puma energy q3 ’19 results report...puma energy q3 ’19 results report 1 company profile puma...
TRANSCRIPT
Puma Energy
Q3 ’19 results report
1
Company profile
Puma Energy Holdings Pte Ltd is incorporated in Singapore as a private company limited by shares. The registered office of the Company is One Marina Boulevard #28-00, 1 Marina Boulevard, Singapore 018989.
Puma Energy is a global oil energy company that focuses on fast-growing markets with high demand for oil products.
The principal business activities of Puma Energy Holdings Pte Ltd and its subsidiaries (the “Company” or “Puma Energy”) are the ownership and operation of storage and retail facilities for, and the sale and distribution of petroleum products.
Puma Energy supplies quality fuel and invests in transformative infrastructure. Through its global supply system, the Company has expertise in integrating midstream and downstream operations in order to deliver high quality fuels around the world safely, swiftly, reliably and at competitive price.
The Company’s shareholders are Trafigura PE Holding Limited (49.41%), Sonangol Holdings Lda (27.99%), Cochan Holdings LLC (15.48%) and other investors (7.12%).
Investor relations
Puma Energy will discuss its results during an investor conference call on Tuesday 26 November 2019 at 14:00 (UK). An accompanying slide presentation will be available on the “Investors” section of PumaEnergy.com (http://www.pumaenergy.com/en/investor-relations).
The conference call can be accessed by dialling one of the access numbers below:
UK & International Number: +44 (0) 20 3003 2666
US Number: +1 212 999 6659
Swiss Number: +41 (0) 43 456 9986
Singapore Number: +65 6494 8889
For further information, please contact our investor relations team on:
http://www.pumaenergy.com/en/investor-relations
Puma Energy
Q3 ’19 results report
2

Puma Energy
Consolidated statement of income
3
in US$'000 2019 2018 2019 2018
Net sales 12,712,304 13,297,364 4,451,494 4,651,802
Cost of sales (11,636,238) (12,200,314) (4,099,881) (4,310,817)
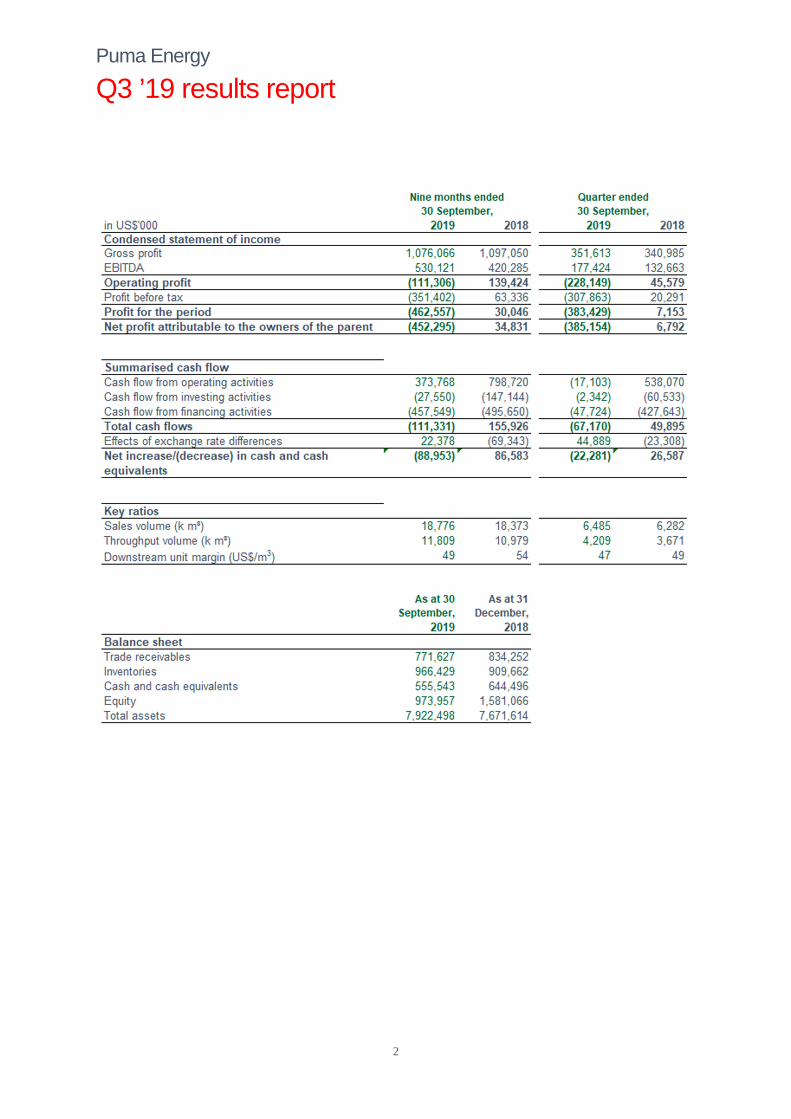
Gross profit 1,076,066 1,097,050 351,613 340,985
Selling and operating costs (1,101,792) (808,410) (597,096) (261,458)
General and administrative expenses (130,227) (140,491) (37,924) (35,065)
Other operating income/(expenses) 46,109 (13,700) 57,273 208
Share of net profit in associates (1,462) 4,975 (2,014) 909
Operating profit (111,306) 139,424 (228,149) 45,579
Finance income 32,959 104,959 (506) 38,524
Finance costs (236,440) (188,809) (84,232) (62,331)
Other financial result (36,615) 7,761 5,024 (1,482)
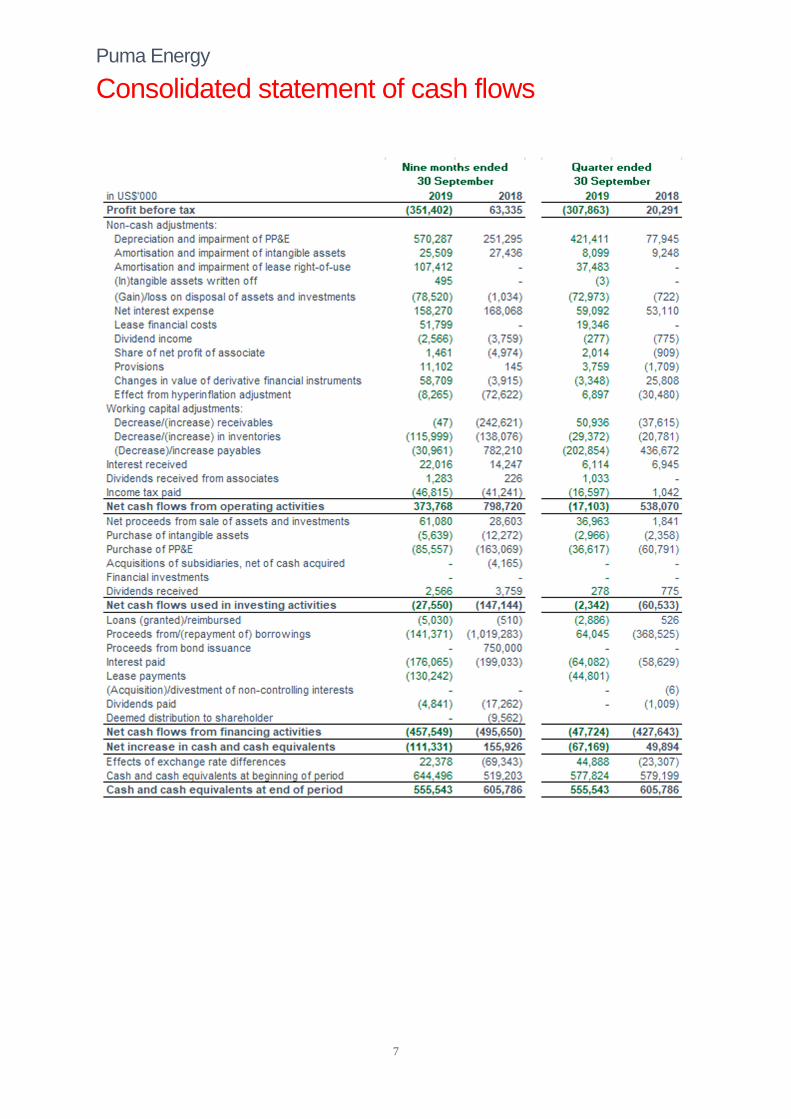
Profit before tax (351,402) 63,335 (307,863) 20,291
Income tax credit/(expense) (111,155) (33,289) (75,566) (13,138)
Profit for the period (462,557) 30,046 (383,429) 7,153
Attributable to:
Owners of the parent (452,295) 34,831 (385,154) 6,792
Non-controlling interests (10,262) (4,785) 1,725 361
Quarter ended 30 September
Nine month ended 30 September

Puma Energy
Segment reporting
4
in US$'000 Downstream Midstream Total
Sales volumes (k m3) 18,676 100 18,776
Throughput volumes (k m3) - 11,809 11,809
Net sales 12,497,981 214,323 12,712,304
Gross profit 943,091 132,975 1,076,066
Selling and operating costs (1,009,814) (91,978) (1,101,792)
General and administrative expenses (122,317) (7,909) (130,226)
Other operating income/(expense), net 38,512 7,597 46,109
Share of net profit/(loss) in associates (2,894) 1,433 (1,461)
Operating profit (150,424) 39,118 (111,306)
in US$'000 Americas Asia Pacific Africa Europe Total
Sales volumes (k m3) 6,763 4,713 5,419 1,881 18,776
Throughput volumes (k m3) 513 4,144 2,642 4,510 11,809
Net sales 3,706,493 3,463,817 3,800,128 1,741,866 12,712,304
Gross profit 375,760 310,075 320,359 69,872 1,076,066
Selling and operating costs (214,188) (613,828) (214,705) (59,071) (1,101,792)
General and administrative expenses (31,286) (32,146) (61,048) (5,746) (130,226)
Other operating income/(expense), net 58,338 (2,560) (10,328) 659 46,109
Share of net profit/(loss) in associates 1,173 819 (2,894) (560) (1,461)
Operating profit 189,797 (337,640) 31,384 5,153 (111,306)
in US$'000 Downstream Midstream Total
Sales volumes (k m3) 17,796 577 18,373
Throughput volumes (k m3) - 10,979 10,979
Net sales 12,857,897 439,467 13,297,364
Gross profit 963,510 133,540 1,097,050
Selling and operating costs (713,345) (95,065) (808,410)
General and administrative expenses (132,565) (7,926) (140,491)
Other operating income/(expense), net (9,888) (3,812) (13,700)
Share of net profit/(loss) in associates 2,887 2,088 4,975
Operating profit 110,599 28,825 139,424
in US$'000 Americas Asia Pacific Africa Europe Total
Sales volumes (k m3) 6,975 4,404 5,076 1,918 18,373
Throughput volumes (k m3) 451 3,574 2,507 4,447 10,979
Net sales 4,208,343 3,500,595 3,832,035 1,756,391 13,297,364
Gross profit 396,302 308,064 337,440 55,244 1,097,050
Selling and operating costs (212,119) (292,461) (239,257) (64,573) (808,410)
General and administrative expenses (28,038) (42,759) (64,198) (5,496) (140,491)
Other operating income/(expense), net (8,364) (9,625) 9,287 (4,998) (13,700)
Share of net profit/(loss) in associates 1,429 1,898 1,510 138 4,975
Operating profit 149,210 (34,883) 44,782 (19,685) 139,424
Nine month ended 30 September, 2019
Nine month ended 30 September, 2018

Puma Energy
Segment reporting
5
in US$'000 Downstream Midstream Total
Sales volumes (k m3) 6,450 35 6,485
Throughput volumes (k m3) - 4,209 4,209
Net sales 4,408,552 42,942 4,451,494
Gross profit 316,363 35,250 351,613
Selling and operating costs (567,866) (29,231) (597,096)
General and administrative expenses (35,956) (1,968) (37,924)
Other operating income/(expense), net 55,510 1,763 57,273
Share of net profit/(loss) in associates (2,267) 252 (2,014)
Operating profit (234,215) 6,066 (228,149)
in US$'000 Americas Asia Pacific Africa Europe Total
Sales volumes (k m3) 2,489 1,527 1,830 639 6,485
Throughput volumes (k m3) 172 1,689 859 1,489 4,209
Net sales 1,315,092 1,113,596 1,422,113 600,693 4,451,494
Gross profit 127,132 91,972 106,534 25,975 351,613
Selling and operating costs (74,185) (431,821) (70,089) (21,001) (597,096)
General and administrative expenses (8,156) (8,757) (19,600) (1,411) (37,924)
Other operating income/(expense), net 67,523 (9,359) (490) (400) 57,274
Share of net profit/(loss) in associates (16) (87) (1,637) (274) (2,014)
Operating profit 112,298 (358,053) 14,717 2,889 (228,149)
in US$'000 Downstream Midstream Total
Sales volumes (k m3) 6,070 212 6,282
Throughput volumes (k m3) - 3,671 3,671
Net sales 4,475,042 176,760 4,651,802
Gross profit 300,374 40,611 340,985
Selling and operating costs (232,100) (29,358) (261,458)
General and administrative expenses (33,752) (1,313) (35,065)
Other operating income/(expense), net (2,437) 2,644 207
Share of net profit/(loss) in associates 219 690 909
Operating profit 32,304 13,274 45,578
in US$'000 Americas Asia Pacific Africa Europe Total
Sales volumes (k m3) 2,303 1,539 1,797 643 6,282
Throughput volumes (k m3) 159 1,410 717 1,384 3,671
Net sales 1,451,611 1,250,429 1,333,601 616,161 4,651,802
Gross profit 115,559 97,702 112,865 14,859 340,985
Selling and operating costs (70,460) (94,117) (75,375) (21,506) (261,458)
General and administrative expenses (6,506) (9,601) (17,673) (1,285) (35,065)
Other operating income/(expense), net 1,516 (220) 1,773 (2,862) 207
Share of net profit/(loss) in associates 389 208 609 (297) 909
Operating profit 40,498 (6,028) 22,199 (11,091) 45,578
Quarter ended 30 September, 2018
Quarter ended 30 September, 2019

Puma Energy
Consolidated balance sheet
6
in US$'000 Sep19A Dec18A
Assets
Property and Equipment 2,827,679 3,158,720
Intangible assets and goodwill 866,305 1,273,008
Right-of-use (IFRS16) 1,089,208 -
Investments in associates 33,585 39,932
Other financial assets 87,902 88,639
Deferred tax assets 56,240 109,940
Other assets 121,707 121,719
Total non-current assets 5,082,626 4,791,958
Inventories 966,429 909,662
Other assets 468,099 386,294
Income tax receivable 15,564 15,934
Trade receivables 771,627 834,252
Other financial assets 62,611 89,018
Cash and cash equivalents 555,543 644,496
Total current assets 2,839,872 2,879,656
Total assets 7,922,498 7,671,614
Equity and liabilities
Share capital 2,054,166 2,054,166
Retained earnings 410,422 662,930
Foreign currency translation reserve (1,628,466) (1,376,870)
Other components of equity 4,472 104,931
Equity attributable to owners of the parent 840,594 1,445,157
Non-controlling interests 133,363 135,909
Total equity 973,957 1,581,066
Interest-bearing loans and borrowings 2,753,288 2,828,303
Lease liabilities 962,112
Retirement benefit obligation 1,231 2,121
Other financial liabilities 4,667 10,103
Deferred tax liabilities 53,986 54,842
Provisions 44,155 43,444
Total non-current liabilities 3,819,439 2,938,813
Trade and other payables 2,501,841 2,598,873
Interest-bearing loans and borrowings 410,927 457,032
Lease liabilities 107,561
Other financial liabilities 41,470 40,799
Income tax payable 43,526 40,151
Provisions 23,777 14,880
Total current liabilities 3,129,103 3,151,735
Total liabilities 6,948,541 6,090,548
Total equity and liabilities 7,922,498 7,671,614
Puma Energy
Consolidated statement of cash flows
7

Puma Energy
EBITDA reconciliation
8
2018
USD '000Nine month ended
30 SeptemberIFRS16 Impact
Pro forma
Nine month ended 30 September
Operating profit (111,306) (27,742) (139,047) 139,424
Other (income)/expenses (61,782) 141 (61,641) 2,130
EBIT (173,088) (27,601) (200,688) 141,554
Depreciation 222,238 37 222,275 241,768
Amortisation (intangibles) 25,509 - 25,509 27,436
Amortisation (right-of-use) 107,412 (107,412) - -
Impairment charge 348,050 1,399 349,448 9,527
EBITDA 530,121 (133,577) 396,544 420,285
2018
USD '000Quarter ended 30 September
IFRS16 Impact
Pro forma
Quarter ended 30 September
Operating profit (228,149) (11,130) (239,278) 45,579
Other (income)/expenses (61,421) 141 (61,280) (100)
EBIT (289,570) (10,989) (300,558) 45,479
Depreciation 73,173 37 73,210 77,924
Amortisation (intangibles) 8,099 - 8,099 9,248
Amortisation (right-of-use) 37,483 (37,483) - -
Impairment charge 348,238 1,399 349,636 11
EBITDA 177,423 (47,036) 130,387 132,662
2019
2019

Puma Energy
Statement of income reconciliation – IFRS16
9
in US$'000
Nine month ended 30 September, 2019
IFRS16 Impact
Pro forma
Net sales 12,712,304 - 12,712,304
Cost of sales (11,636,238) (34,558) (11,670,796)
Gross profit 1,076,066 (34,558) 1,041,508
Selling and operating costs (1,101,792) 12,952 (1,088,841)
General and administrative expenses (130,227) (6,033) (136,260)
Other operating income/(expenses) 46,109 (161) 45,949
Share of net profit in associates (1,462) 58 (1,403)
Operating profit (111,306) (27,742) (139,047)
Finance income 32,959 - 32,958
Finance costs (236,440) 51,799 (184,641)
Other financial result (36,615) 2,019 (34,595)
Profit before tax (351,402) 26,076 (325,326)
Income tax credit/(expense) (111,155) (1,566) (112,721)
Profit for the period (462,557) 24,510 (438,047)
Attributable to:
Owners of the parent (452,295) 23,862 (428,433)
Non-controlling interests (10,262) 648 (9,614)
in US$'000
Quarter ended 30 September, 2019
IFRS16 Impact
Pro forma
Net sales 4,451,494 - 4,451,494
Cost of sales (4,099,881) (12,714) (4,112,594)
Gross profit 351,613 (12,714) 338,900
Selling and operating costs (597,096) 3,540 (593,556)
General and administrative expenses (37,924) (1,981) (39,905)
Other operating income/(expenses) 57,273 118 57,250
Share of net profit in associates (2,014) 47 (1,968)
Operating profit (228,149) (11,130) (239,278)
Finance income (506) - (507)
Finance costs (84,232) 19,346 (64,886)
Other financial result 5,024 (660) 4,365
Profit before tax (307,863) 7,557 (300,306)
Income tax credit/(expense) (75,566) (591) (76,157)
Profit for the period (383,429) 6,965 (376,464)
Attributable to:
Owners of the parent (385,154) 7,270 (377,884)
Non-controlling interests 1,725 (305) 1,420
Puma Energy
Balance sheet reconciliation – IFRS16
10
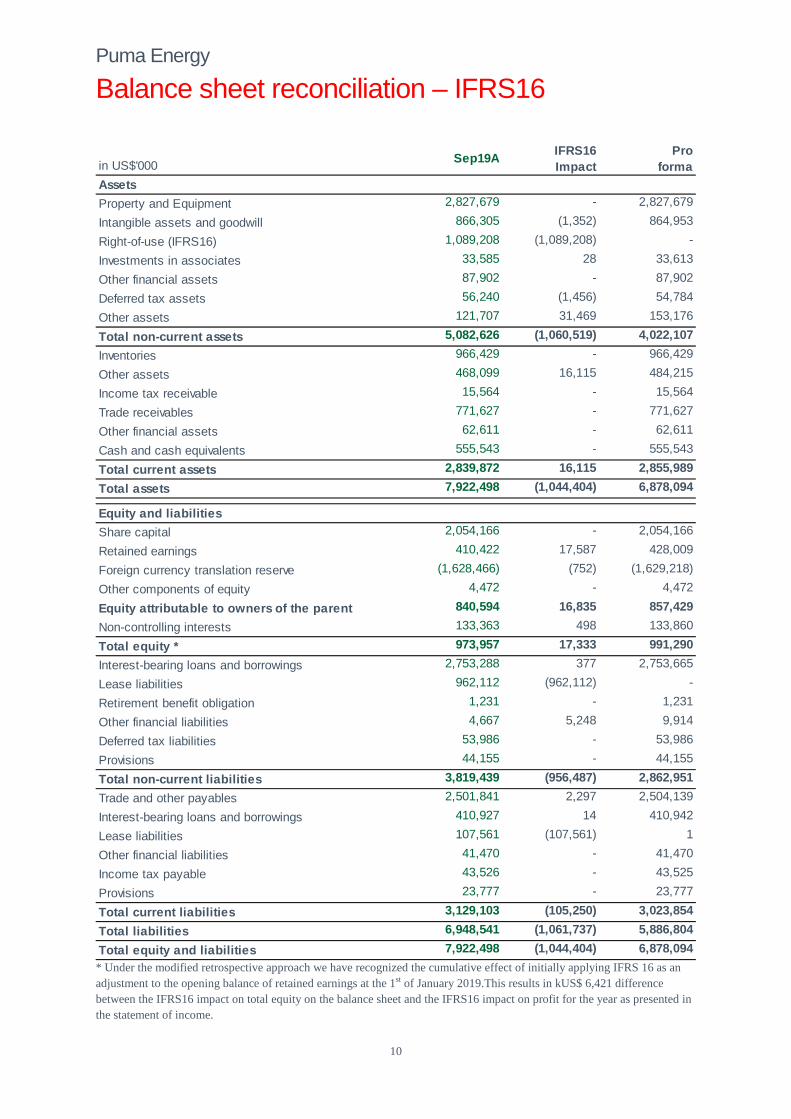
* Under the modified retrospective approach we have recognized the cumulative effect of initially applying IFRS 16 as an adjustment to the opening balance of retained earnings at the 1st of January 2019.This results in kUS$ 6,421 difference between the IFRS16 impact on total equity on the balance sheet and the IFRS16 impact on profit for the year as presented in the statement of income.
in US$'000Sep19A
IFRS16 Impact
Pro forma
Assets
Property and Equipment 2,827,679 - 2,827,679
Intangible assets and goodwill 866,305 (1,352) 864,953
Right-of-use (IFRS16) 1,089,208 (1,089,208) -
Investments in associates 33,585 28 33,613
Other financial assets 87,902 - 87,902
Deferred tax assets 56,240 (1,456) 54,784
Other assets 121,707 31,469 153,176
Total non-current assets 5,082,626 (1,060,519) 4,022,107
Inventories 966,429 - 966,429
Other assets 468,099 16,115 484,215
Income tax receivable 15,564 - 15,564
Trade receivables 771,627 - 771,627
Other financial assets 62,611 - 62,611
Cash and cash equivalents 555,543 - 555,543
Total current assets 2,839,872 16,115 2,855,989
Total assets 7,922,498 (1,044,404) 6,878,094
Equity and liabilities
Share capital 2,054,166 - 2,054,166
Retained earnings 410,422 17,587 428,009
Foreign currency translation reserve (1,628,466) (752) (1,629,218)
Other components of equity 4,472 - 4,472
Equity attributable to owners of the parent 840,594 16,835 857,429
Non-controlling interests 133,363 498 133,860
Total equity * 973,957 17,333 991,290
Interest-bearing loans and borrowings 2,753,288 377 2,753,665
Lease liabilities 962,112 (962,112) -
Retirement benefit obligation 1,231 - 1,231
Other financial liabilities 4,667 5,248 9,914
Deferred tax liabilities 53,986 - 53,986
Provisions 44,155 - 44,155
Total non-current liabilities 3,819,439 (956,487) 2,862,951
Trade and other payables 2,501,841 2,297 2,504,139
Interest-bearing loans and borrowings 410,927 14 410,942
Lease liabilities 107,561 (107,561) 1
Other financial liabilities 41,470 - 41,470
Income tax payable 43,526 - 43,525
Provisions 23,777 - 23,777
Total current liabilities 3,129,103 (105,250) 3,023,854
Total liabilities 6,948,541 (1,061,737) 5,886,804
Total equity and liabilities 7,922,498 (1,044,404) 6,878,094
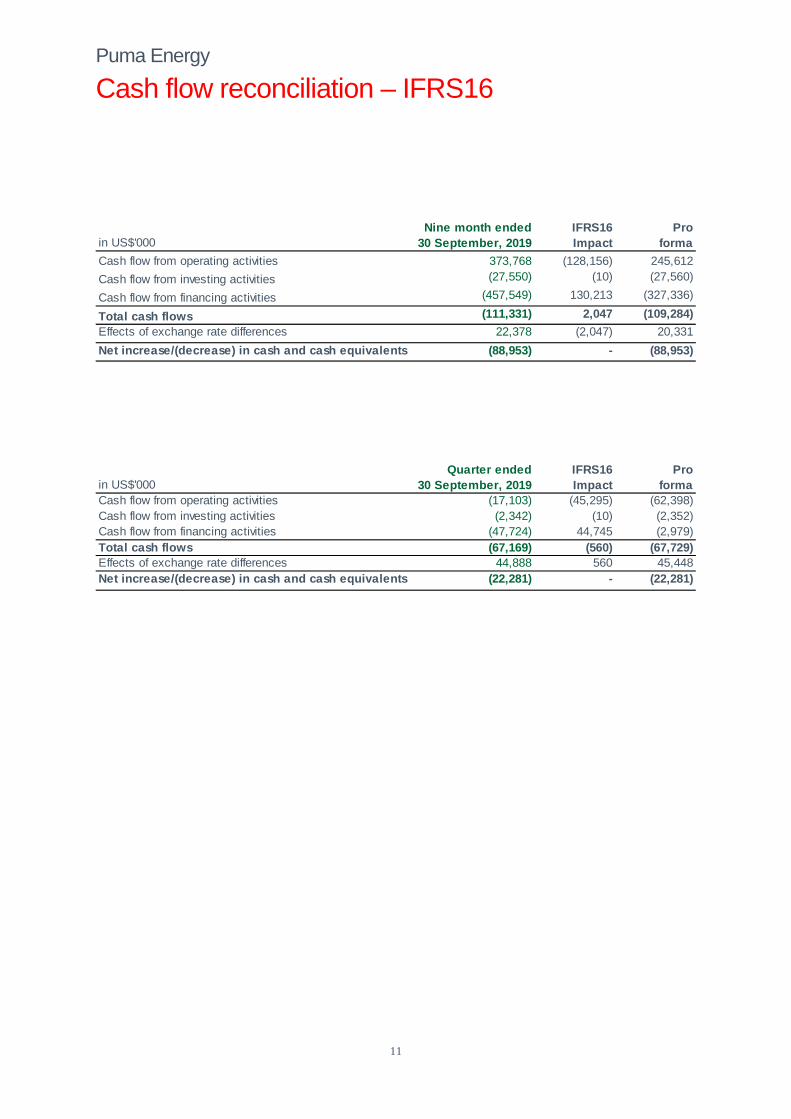
Puma Energy
Cash flow reconciliation – IFRS16
11
in US$'000Nine month ended
30 September, 2019IFRS16 Impact
Pro forma
Cash flow from operating activities 373,768 (128,156) 245,612
Cash flow from investing activities (27,550) (10) (27,560)
Cash flow from financing activities (457,549) 130,213 (327,336)
Total cash flows (111,331) 2,047 (109,284)
Effects of exchange rate differences 22,378 (2,047) 20,331
Net increase/(decrease) in cash and cash equivalents (88,953) - (88,953)
in US$'000Quarter ended
30 September, 2019IFRS16 Impact
Pro forma
Cash flow from operating activities (17,103) (45,295) (62,398)Cash flow from investing activities (2,342) (10) (2,352)Cash flow from financing activities (47,724) 44,745 (2,979)Total cash flows (67,169) (560) (67,729)Effects of exchange rate differences 44,888 560 45,448Net increase/(decrease) in cash and cash equivalents (22,281) - (22,281)