puncturing the waterbed myth - sandbag · puncturing the waterbed myth 2 the supply of allowances...
TRANSCRIPT

Puncturing the waterbed myth
sandbag
Puncturing the waterbed myth 1
Puncturing the waterbed myth The value of additional actions in cutting ETS greenhouse gas emissions October 2016
Summary
Additional actions to reduce greenhouse gas emissions
are being taken across the EU in sectors covered by the
EU Emissions Trading System (EU ETS). These actions
include implementing energy efficiency programmes,
deploying renewables, replacing lignite and coal plants
with less carbon intensive generation, and introducing
national carbon pricing. Such actions are essential if the
EU is to put itself on the most cost-effective long term
emission reduction pathway to deliver its goal of an 80-
95% reduction in emissions by 2050.
It is sometimes argued that such additional actions do
not reduce total emissions, because total emissions in
the EU ETS sectors are set by the fixed cap, irrespective
of what other action is taken. This is sometimes
referred to as the “waterbed effect” by analogy with the fixed volume of water in a waterbed - squeezing a waterbed
at one place immediately leads to it bulging out in another.
While this argument is often repeated, our analysis shows that it largely does not hold true in the EU ETS sectors.
Only 2-8% of allowances (EUAs) freed by additional action will be used, resulting in additional emissions in the short
term. The remaining 90%-plus will add to the surplus of allowances that has developed over the last few years.
These will almost all eventually end up in the Market Stability Reserve (MSR), which is due to operate from 2019.
This result is consistent with current market behaviour where present emission reductions are manifestly not being
replaced in full by emissions elsewhere, as annual emissions remain 10% or more below the cap.
This means that additional actions, particularly while there continues to be a surplus of allowances over at least the
next 10-15 years, are likely to result in long term emissions reductions additional to those delivered by the EU ETS.
This remains true even if the reforms of the EU ETS currently being discussed are adopted.
Furthermore, contrary to the assumption underlying the waterbed effect, the supply of allowances to the market is
not fixed in the long term, but is set by future policy decisions which can respond to circumstances. While in theory
there is the possibility of a long term waterbed effect, if surplus allowances created by additional actions and held in
the Market Stability Reserve (MSR) are returned to the market in the future, in practice this is most unlikely to
happen. Decisions on the supply of allowances will reflect the circumstances prevailing, including international
commitments to emission reductions and the size of a surplus.
This is especially the case as any additional surplus would only return in the 2060s or later, given the likely scale of
the surplus that will anyway accrue, and the limit on the rate of return from the MSR of 100 million tonnes per
annum. It seems unlikely that allowances returning after a period of decades would be allowed to result in
additional emissions. Allowing additional emissions would, for example run counter to the Paris Agreement,
including its provisions to aim for net zero emissions in the second half of the century. The waterbed effect would
thus not occur, at least not in full, even over the longer term.
About Sandbag
Sandbag is a Brussels and London-based not-for-profit think tank conducting research and campaigning for environmentally effective climate policies.
Our research focus includes reforming the EU Emissions Trading System and the Effort Sharing Regulation; accelerating the phase-out of old coal in Europe; deep decarbonisation of industry through technologies including Carbon Capture & Storage.
For more information, visit sandbag.org.uk or email us at [email protected]
Puncturing the waterbed myth 2
The supply of allowances could be reduced, and the waterbed effect thus avoided over the long term, by a range of
policy measures including the following:
arrangements for retiring allowances from the MSR, or elsewhere once the MSR reaches a certain size limit;
decisions taken post-2050 not to return allowances from much earlier surpluses, given prevailing policy
circumstances;
Member States choose to retire allowances, and hence reduce the cap, in order to neutralise surplus allowances
resulting from other policy actions;
the additional surplus gives confidence to policy makers to enable tighter caps to be set for future phases, by
reducing the perceived cost;
the EU ETS is replaced by another mechanism, or fundamentally modified, before the additional surplus is
returned to the market and the new arrangements do not recognise EUAs in full; and
vigorous additional policy actions, and new low-emitting technologies to replace current ones, result in
emissions always remaining below the cap.
The future supply of allowances, and so any waterbed effect, is thus under direct policy control.
Even when the market returns to scarcity, these policy responses enable any benefits of additional action to be
captured in full. It seems likely that the effect of additional actions will continue to shape policy through such
mechanisms. The waterbed is therefore unlikely to apply even for additional actions taken when the market is short
of allowances.
Conclusion
In practice a large majority of the emissions reductions from additional actions are likely to be permanent. The often
repeated claim that additional policy actions “do nothing to reduce emissions because the EU ETS cap is fixed and
emissions will take place elsewhere up to the level of the cap” is seriously misleading, reflecting an outdated view of
the EU ETS. It should not be used as an excuse for inaction.
Key recommendations
EU and national policy makers should be confident that putting in place additional policy actions today and
in the coming years will further reduce emissions in sectors covered by the EU ETS.
Action should be taken to retire any further surplus allowances created by additional actions, or to reduce
the cap by a corresponding amount.
When considering delivering targets, EU and Member State policy makers should take account of the small
waterbed effect that can occur, and ensure they have factored this in to their assumptions about overall
emission reductions that can be achieved.
Putting in place additional policy actions should not be used as an alternative to tightening supply through
the current EU ETS reform process. Rather the two sets of actions should reinforce each other.
Puncturing the waterbed myth 3
1. Additional policy actions in the EU ETS sectors 1.1 The argument that additional policy actions do not reduce emissions in the EU ETS sectors
Many additional policy actions are being taken to reduce greenhouse gas emissions in sectors covered by the
European Union Emissions Trading System (EU ETS), which limits emissions from power generation and large
industry. These actions include implementing energy efficiency programmes, deploying renewables, replacing lignite
and coal plants with less carbon intensive generation, and introducing national carbon pricing. Such actions are
being taken at both national and EU level. The term “additional actions” is used throughout this report to refer to
some combination of such actions.
Additional actions play a valuable role in reducing emissions. They form an essential part of putting the European
economy on an efficient low carbon pathway. They have a range of other benefits, related to both carbon emissions
reductions and other goals (see section 4), including addressing some of the intrinsic limitations of carbon pricing.
And they also act to supplement existing EU action, which is not enough to deliver long term targets.
However, it is sometimes argued that such additional actions do not reduce total emissions, because the level of
emissions in the EU ETS sectors is set by the EU ETS cap, which is fixed by legislation, with reductions in emissions in
one place automatically matched by increases elsewhere. This is sometimes referred to as the “waterbed effect” by
analogy with the fixed volume of water in a waterbed - squeezing a waterbed at one place immediately leads to it
bulging out in another1.
For example, in 2015 RWE used such arguments in objecting to the closure of lignite plant:
“The proposals [to reduce lignite generation] would not lead to a CO2 reduction in absolute terms. [The number of]
certificates in the ETS would remain unchanged and as a result emissions would simply be shifted abroad.” 2
Similarly, in 2012 the then Chairman of the UK’s Parliament’s Energy and Climate Change Select Committee, opposed
the UK’s carbon price support mechanism for the power sector arguing that:
“Unless the price of carbon is increased at an EU-wide level, taking action on our own will have no overall effect on
emissions”3
This argument has also been made by some neutral, well-informed observers of energy markets. For example,
Professor Steven Sorrel from Sussex University recently argued that:
“Any additional abatement in the UK simply ‘frees up’ EU allowances that can be either sold or banked, and hence
used for compliance elsewhere within the EU ETS”4
As a corollary of this argument, it is sometimes argued that additional actions will also reduce the efficiency of the
EU ETS. For example, additional actions may require more costly emission reductions than those signalled by the
carbon price without affecting the total quantity of emissions.
1 This proposed effect is closely analogous to the rebound effect widely observed for some types of energy efficiency investments, such as improved home insulation. By lowering the effective price of energy such measures tend to lead to the benefits being taken as a mixture of greater comfort and reduced consumption. The waterbed effect argument essentially argues for a rebound effect of 100% on measures to reduce emissions. 2 See RWE statement, “Proposals of Federal Ministry for Economic Affairs and Energy endanger the future survival of lignite”, 20 March 2015. http://www.rwe.com/web/cms/en/113648/rwe/press-news/press-release/?pmid=4012793 3 www.parliament.uk/briefing-papers/sn05927.pdf 4 http://www.energypost.eu/brexit-opportunity-rethink-uk-carbon-pricing/

Puncturing the waterbed myth 4
However, these arguments reflect outdated assumptions that allowances are in short supply and that there is a large
amount of unmet demand for allowances. This is not the case in the EU ETS at present, and is unlikely to be so for
additional actions taken over at least the next 10-15 years over which time a cumulative surplus of allowances is
likely to remain even if some of the currently proposed reforms to tighten the cap are implemented. The arguments
also ignore the potential for policy responses over time that could reduce the supply of allowances to recognise the
effect of additional actions. The remainder of this report explores the basis of the “waterbed effect” argument and
why it does not hold.
This report takes into account previous discussions and analysis of the waterbed effect, including a study by Ecofys
(see Annex 3). It extends the work by modelling the likely extent of any waterbed effect given the circumstance of
the EU ETS.
1.2 Additional actions being taken to reduce emissions
As noted above, there is a range of additional actions, going beyond the effect of the carbon price itself, that can
reduce emissions within the EU ETS sectors as set out above. Examples of additional actions that are already in place
or currently proposed are shown in Table 15.
Table 1: Additional actions in Europe to reduce emissions in the EU ETS sectors
Measure Description Main rationale Date
1. German lignite
reserve6
2.7GW of lignite power plants
will be paid €1.6b to go into a
reserve, then closed.
To help meet national 2020
GHG target.
2015 announced
2016 put in law
2. Netherlands coal
closures7
4 coal plant closures of 2.4GW
from 2015 to 2017. In
exchange, scraps coal tax.
To help meet national 2020 and
longer term GHG targets.
2013 announced
2014 put in law
3. UK coal phase-out
announcement8
Announcement that all UK coal
plant must close by 2025.
“Coal is the most carbon
intensive fossil fuel and
damages air quality.”
2015 announced
2016 consultation
4. UK carbon price
floor9
UK ETS installations must pay
£18/tonne to supplement the
EU ETS price.
“Support and certainty for low
carbon investment”
2010 announced
2013 started
5. French carbon Power plants pay tax of €30/t “To curb coal-fired power 2016 announced
5 In some instances, where electricity generation from one source is removed, for example by the closure of coal plant, there is
the possibility that it may be replaced by other generation which is equally carbon intensive or more so. This is likely to be at
most a small proportion of any widespread and diverse programme of additional action (see Annex 2). It is in any case separate
from the “waterbed effect”, which due of the operation of the fixed EU ETS cap. 6 See Clean Energy Wire write-up of the ministry announcement. https://www.cleanenergywire.org/news/brown-coal-standby-reserve-cut-co2 7 See report in Argus media. http://www.argusmedia.com/pages/NewsBody.aspx?id=856174&menu=yes 8 See Amber Rudd’s announcement of the coal phase-out. https://www.gov.uk/government/speeches/amber-rudds-speech-on-a-new-direction-for-uk-energy-policy 9 See UK HM Treasury Carbon Price Floor https://www.gov.uk/government/uploads/system/uploads/attachment_data/file/42639/consult_carbon_price_support_condoc.pdf

Puncturing the waterbed myth 5
floor price10 generation and boost
renewables”
2017 to start
6. Feed in tariff for
solar and wind
A number of countries have
offered a fixed price for
renewables generation
To incentivise early stage
deployment
Continuing
7. Energy Efficiency
Directive
20% energy efficiency gains by
2020
To help meet EU energy
efficiency target
2012 entry into force
1.3 The hypothesis of the waterbed effect in detail
The argument that additional actions to reduce emissions will be ineffective assumes that demand for allowances
will adjust so that the quantity of allowances used is always equal to the cap, which is fixed.
This is illustrated in stylised form in the diagram below. There is fixed, perfectly inelastic supply, represented by a
vertical supply curve. Demand for allowances without additional actions leads to prices at an initial level. Additional
actions reduce demand for allowances at any given price, effectively shifting the demand curve to the left by the
amount by which additional actions reduce emissions. This leads price to fall until the lower price creates sufficient
additional demand that total demand is again equal to the supply set by the cap. Because the supply curve is vertical
the equilibrium quantity of emissions is unchanged, remaining equal to the cap11.
Chart 1: A price response to the change in demand for allowances can lead to emissions re-equilibrating at the cap
However, at present large increases in emissions (such that emissions rise to the cap) due to falling prices are not
occurring. The market has a surplus of allowances both cumulatively and on an annual basis. The price of
10 See Reuters report http://www.reuters.com/article/us-france-carbon-idUSKCN0XN1C6 11 This is analogous to the well-established rebound effect for energy efficiency measures. Improved domestic insulation lowers the effective price of energy, so consumers take some of the benefits as increased warmth, and some as reduced consumption. The argument here is that in effect there is a 100% rebound effect for emissions reductions under the EU ETS.
Supply (cap)
Demand without additional actions
Demand with additional actions
Demand reduction from additional actions
Additional demand due to price fall
Price fall
Price before additional action
Price after additional action
Stylised representation, not to scale
Price
Quantity
Chart A1: Supply and demand for EUAs – Waterbed effect hypothesis
Puncturing the waterbed myth 6
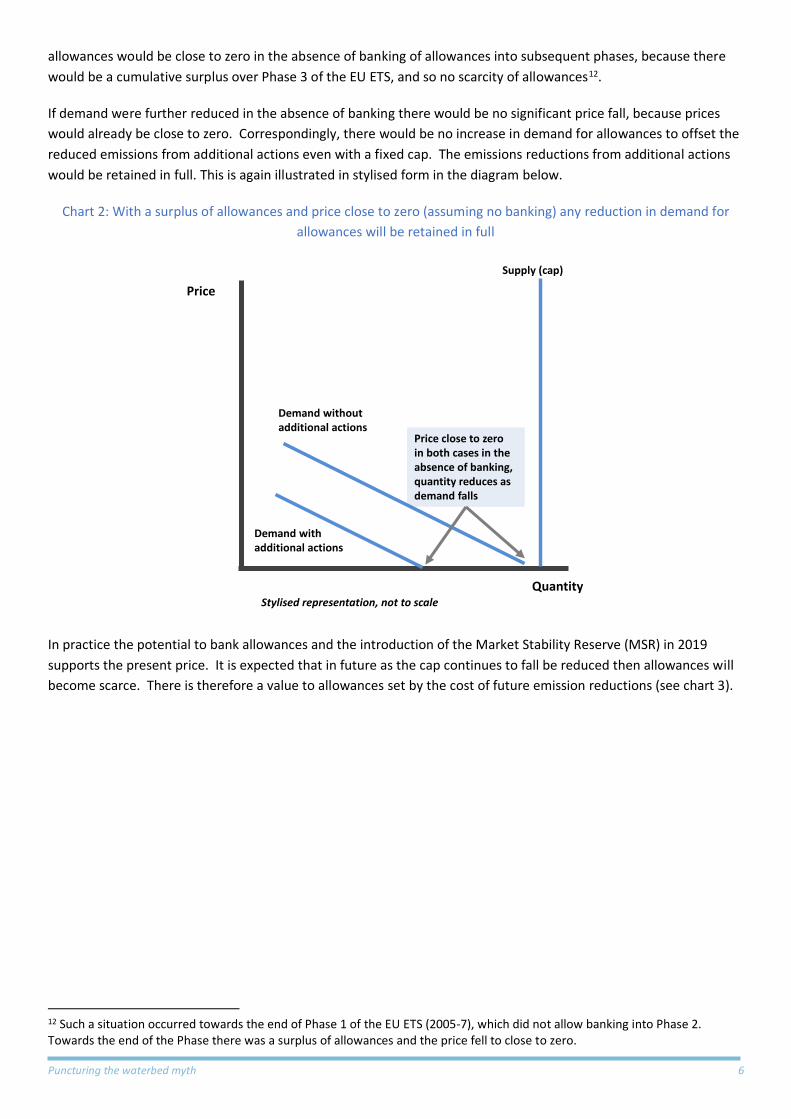
allowances would be close to zero in the absence of banking of allowances into subsequent phases, because there
would be a cumulative surplus over Phase 3 of the EU ETS, and so no scarcity of allowances12.
If demand were further reduced in the absence of banking there would be no significant price fall, because prices
would already be close to zero. Correspondingly, there would be no increase in demand for allowances to offset the
reduced emissions from additional actions even with a fixed cap. The emissions reductions from additional actions
would be retained in full. This is again illustrated in stylised form in the diagram below.
Chart 2: With a surplus of allowances and price close to zero (assuming no banking) any reduction in demand for
allowances will be retained in full
In practice the potential to bank allowances and the introduction of the Market Stability Reserve (MSR) in 2019
supports the present price. It is expected that in future as the cap continues to fall be reduced then allowances will
become scarce. There is therefore a value to allowances set by the cost of future emission reductions (see chart 3).
12 Such a situation occurred towards the end of Phase 1 of the EU ETS (2005-7), which did not allow banking into Phase 2. Towards the end of the Phase there was a surplus of allowances and the price fell to close to zero.
Supply (cap)
Demand with additional actions
Stylised representation, not to scale
Price
Quantity
Demand without additional actions
Price close to zero in both cases in the absence of banking, quantity reduces as demand falls
Puncturing the waterbed myth 7
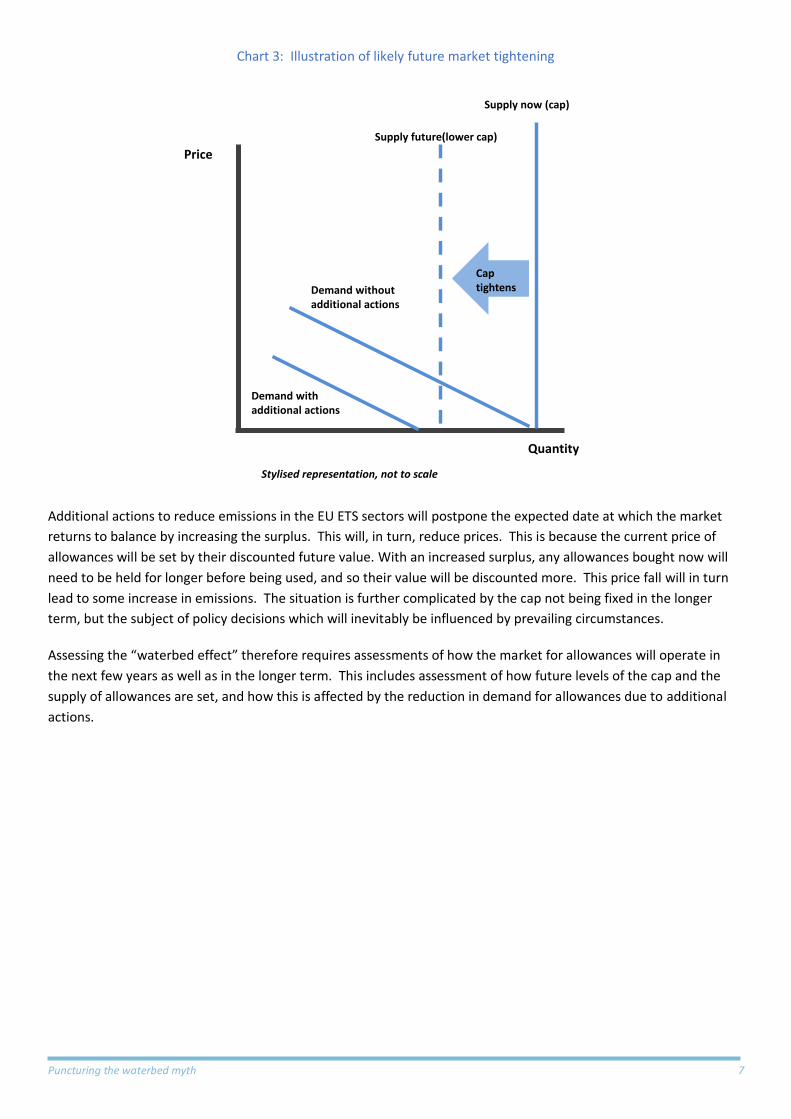
Chart 3: Illustration of likely future market tightening
Additional actions to reduce emissions in the EU ETS sectors will postpone the expected date at which the market
returns to balance by increasing the surplus. This will, in turn, reduce prices. This is because the current price of
allowances will be set by their discounted future value. With an increased surplus, any allowances bought now will
need to be held for longer before being used, and so their value will be discounted more. This price fall will in turn
lead to some increase in emissions. The situation is further complicated by the cap not being fixed in the longer
term, but the subject of policy decisions which will inevitably be influenced by prevailing circumstances.
Assessing the “waterbed effect” therefore requires assessments of how the market for allowances will operate in
the next few years as well as in the longer term. This includes assessment of how future levels of the cap and the
supply of allowances are set, and how this is affected by the reduction in demand for allowances due to additional
actions.
Supply now (cap)
Demand with additional actions
Stylised representation, not to scale
Price
Quantity
Chart 3: Supply and demand for EUAs – cap tightens
Demand without additional actions
Cap tightens
Supply future(lower cap)

Puncturing the waterbed myth 8
2. Modelling the extent of the waterbed effect 2.1 Modelling approach
The extent of an increase in emissions due to price falls caused by an increase in allowances being available within
the EU ETS is modelled by:
establishing a base case set of emissions and prices based on current and expected emissions, caps and
abatement costs;
developing a scenario for the quantity of emissions savings from additional actions;
estimating the extent of a price fall due to the availability of allowances freed up by additional action; and
estimating the increase in demand for allowances corresponding to this price fall using a marginal
abatement cost (MAC) curve.
The estimate of the reduction in prices is based on the additional time which the market takes to return to scarcity.
Further details of the modelling approach are described in Annex 1.
2.2 A scenario for base emissions and additional actions in future
Our base case emissions scenario without additional actions is shown in the chart below. The scenario includes
rebasing the cap to reflect actual emissions at the start of Phase 3. Even with the rebasing, there is a surplus of over
three billion allowances by the start of Phase 4, including both those in the MSR and those available to the market,
Chart 4: EU ETS Supply and demand to 2030
We have then established a scenario to assess the likely effect of additional actions in EU ETS sectors in future. The
scenario is illustrative only, and is intended to establish the extent of any waterbed effect. Additional actions are
0
500
1000
1500
2000
2500
3000
3500
4000
4500
0
500
1000
1500
2000
2500
Sta
tio
na
ry in
sta
llati
on
s, M
t
Cumulative surplus Cumulative MSR Cap Historic Emissions Emissions Forecast

Puncturing the waterbed myth 9
assumed to reduce emissions by an average of 220 MtCO2 per annum, about 13% of the cap, over the period from
now to 2030. A sensitivity with emission reductions of half this level is also examined.
Chart 5: Scenarios for emission reductions due to additional action scenario
There are various combinations of additional actions that could produce such reductions in emissions. Some
examples of the type of actions that could contribute towards such reductions are shown in the table. Many
combinations of such actions are possible. Additional actions are likely to involve a reduction in coal burning,
because emissions from coal burning currently account for over 40% of the total covered by the EU ETS.
Table 2: Illustrative magnitude of potential emissions reductions form additional actions
Additional action Annual emission reductions
(million tonnes CO2)
Retirement of 5 GW of baseload lignite plant 48
Retirement of 5 GW of midload coal plant 20
Deployment of an extra 5GW of wind generation displacing coal 8
Energy efficiency reducing electricity demand by 10% over time 100 (approximately)
French coal phase out 11
UK coal phase out by 2025 75
Source: Sandbag calculations
2.3 Impact on emission levels resulting from changes in price
As noted, additional actions increase the surplus and so reduce the price of allowances. This in turn increases
demand for allowances, and so will tend to absorb at least some of the increased surplus due to additional actions.
We have expressed this increase in demand as a percentage of the reduction in demand from the additional action.
0
50
100
150
200
250
300
350
2016 2017 2018 2019 2020 2021 2022 2023 2024 2025 2026 2027 2028 2029 2030
MtC
O2
e

Puncturing the waterbed myth 10
So for example, if additional actions reduce emissions by 200MtCO2 p.a., and the resulting price fall increases
demand for allowances by 20 MtCO2 p.a., then the increase in demand is 10%. This is a measure of the extent of a
waterbed effect.
We have looked at three sources of evidence for the impact on emissions levels as a result of changes in price:
the current market surplus;
the likely response of individual sectors; and
the MAC curve.
2.3.1 The current market surplus
Emissions have been below the cap since 2008. Annual EU ETS emissions in 2015 were approximately 200 MtCO2 p.a.
(about 10%)13 below the cap (see Chart 5). This year emissions will likely by 13% below the cap, with no sign of
emission rising to meet the cap.
Policies on renewables and energy efficiency together with the UK’s carbon price floor have, over time, contributed
to significant emission reductions. This is particularly the case in the power sector where emissions have fallen by
21% between 2008 and 2015. These emission reductions have not been replaced by additional emissions elsewhere.
Consequently, there is now an accumulated surplus of approximately 2.7 billion14 allowances, which is continuing to
grow.
Chart 6: Emissions are currently well below the cap
13 The average annual surplus for the period 2008-2015, has been 223MtCO2. We expect emissions to continue declining in 2016 and even with the last year of backloading, the annual average surplus would only come down to between 180 and 190Mt. 14 The term surplus is here used to include both allowances available to the market and those to be placed in the MSR. This consists of 1.8 billion EUAs held in registry accounts and available to the market and a further 900Mt withheld from auctioning to be added to the MSR.
0
500
1,000
1,500
2,000
2,500
3,000
2008 2009 2010 2011 2012 2013 2014 2015 2016 2017 2018 2019 2020
Stat
ion
ary
inst
alla
tio
ns,
Mt
Cap with Offsets Backloading effect Historic Emissions Emissions Forecast
Emissions currently
about 10% below the cap
Puncturing the waterbed myth 11
2.3.2 The response of individual sectors
Energy efficiency policies and the economic recession since 2008 have, among other factors, reduced the rate of
electricity demand growth. In fact, electricity demand in the EU has decreased by 6% in the period 2008-2014, with
a 2% reduction in 2014 alone15. Even with stronger future economic growth, low carbon supply seems likely to
meet, in full, any electricity demand growth.
Large additional demand for allowances from coal power generation appears unlikely over the long term as, capacity
that enables switching availability will significantly decline. The EU Reference Scenario 201616 forecasts that solid
fossil fuel capacity will only represent 4% of total installed net generation capacity by 2050, down from 18% in 2015.
Faster decline than this is likely in many scenarios. Gas capacity on the other hand will remain broadly stable over
the same period with renewables covering all of the expected increase in electricity demand as well as any potential
deficit due to coal plant closures. However, a slower decline in coal burn with lower carbon prices remains possible,
and this is captured in the MAC curve we have used for this analysis.
Industrial emissions have also shown little tendency so far to grow in response to the surplus of allowances to date.
There appears to be little reason to assume rapid growth in the future as a response to increases in allowance
availability. The primary factor influencing industrial emissions is the level of industrial production, not the
availability of emissions allowances. The argument that more emissions intensive production methods could be used
when more allowances are available does not seem convincing since such methods would only be available for a
limited range of products and, more importantly, would include higher fuel consumption or process changes, which
seem unlikely to be approved by investors17.
2.3.3 The marginal abatement cost curve
The change in demand for allowances in response to price follows a MAC curve. The MAC curve we have used is
shown in Chart 7 (below). A decrease in the price of allowances leads to reduced levels of emission abatement and
thus additional demand for allowances.
15 Latest available Eurostat data. ENTSO-E data for 2015, which is not directly comparable, shows demand growth of 1% for that year. 16 http://ec.europa.eu/energy/en/data-analysis/energy-modelling 17 The effect is likely to be asymmetric with reduced allowance availability and increased prices increasing abatement, but with a smaller increase emissions in response to lower prices.

Puncturing the waterbed myth 12
Chart 7: Forecast market prices and abatement18
It is assumed constant over time in the absence of more reliable information or knowledge of future relative fuel
prices.
2.4 Results of analysis
2.4.1 Change of demand for allowances in response to changes in price
From the analysis described above, we estimate that the increase in demand for allowances due to falling prices
(percentage of emission reductions from additional action lost) accounts for only between 2% and 8% of the
emissions reductions due to additional actions. The increase in demand for allowances resulting from the price fall is
lower in earlier years because prices are low, so even a large percentage change in price leads to only a small
absolute change in emission reductions.
Correspondingly, over 90% of the emission reductions due to additional actions are maintained, and the allowances
that are freed up by these emissions reductions are added to the surplus.
An immediate waterbed effect thus occurs to only a very limited extent – less than 10%.
18 Source Thomson Reuters. We have used a stylised curve in our modelling based on this data, and on evidence from the response of the market to date and sectoral analysis described above. The MAC curve is implemented in the modelling in piecewise linear form.
€ -
€ 5.0
€ 10.0
€ 15.0
€ 20.0
€ 25.0
€ 30.0
0 10 20 30 40 50 60 70 80Mt CO2e

Puncturing the waterbed myth 13
Table 3: Approximate estimates of the percentage of emission reductions lost as a result of price falls
Year
Increase in demand for allowances (Percentage of average
emissions reductions lost from additional action)
2017 2%
2020 3%
2025 5%
2030 8%
Parameters would need to be in error by about an order of magnitude to substantially affect the conclusion that
most allowances freed up by additional actions add to the surplus.
2.4.2 Additional surplus allowances and the interaction with the MSR
Emission reductions due to additional actions will further increase the number of allowances in the MSR.
The MSR will already have approximately three billion allowances by 2030, even without additional actions, and
these can only be returned to the market at a rate of 100 million per year. This means that the surplus will take 30
years to return, even without additional action.
The further surplus created by additional actions would only potentially start returning to the market in the late
2050s and 2060s, and continue to return for a long period after that time (if the decision was taken to allow this to
happen). Allowances released by additional action before the start of the MSR in 2019 add to the existing surplus
and are nevertheless absorbed over time into the MSR as it begins operation.
Chart 8, overleaf, shows the MSR dynamics until 2050 in our base case. The cap is rebased to reflect forecasted
emissions at the end of Phase 3 in line with our previous proposals. This is a tighter cap than currently envisaged, so
the surplus, while still very large, is smaller than it might otherwise be.
Surpluses generated now will be absorbed by the MSR and could start returning to the market only in the 2030s.
The full volume is not exhausted until into the 2050s even without additional actions.

Puncturing the waterbed myth 14
Chart 8: MSR annual withdrawal/return volumes in base case
Note: Assumes our base case emissions with rebasing of the cap to reflect actual emissions 2017-9 and MSR
introduced as planned from 2019. The MSR rapidly grows in size at the beginning of its operation, primarily due to
the backloaded allowances that are placed in it. It continues to withdraw allowances from the market until the
amount of allowances in circulation falls below 400Mt in 2027. From the following year, the MSR starts releasing
100Mt per annum.
Chart 9 shows the MSR dynamics in the case with additional actions as described above. It shows that there would
be still over two billion allowances in the MSR by 2050. This implies that the MSR will only be emptied in the 2070s.
Allowances not used because of additional action in the next ten years return between the late 2050s and the 2070s.
Chart 9: MSR withdrawal/return volumes with additional action
Assumptions are the same as for the previous chart but with approximately 220 MtCO2 of emissions reduction due
to additional actions
-3500
-2500
-1500
-500
500
1500
2500
3500
-500
-400
-300
-200
-100
0
100
200
300
400
500
Mt
CO
2e
Mt
CO
2e
MSR (right axis) MSR Withdrawals (left axis)
-4000
-3000
-2000
-1000
0
1000
2000
3000
4000
-500
-400
-300
-200
-100
0
100
200
300
400
500
Mt
CO
2e
Mt
CO
2e
MSR (right axis) MSR Withdrawals (left axis)
Puncturing the waterbed myth 15
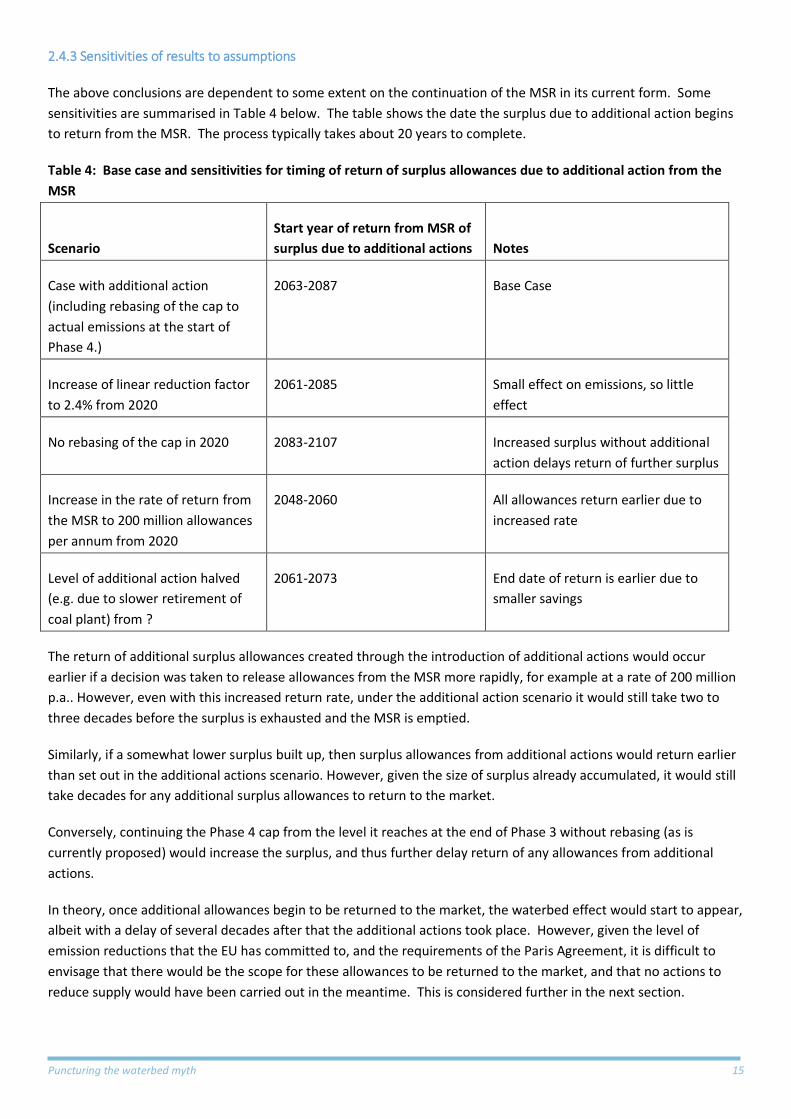
2.4.3 Sensitivities of results to assumptions
The above conclusions are dependent to some extent on the continuation of the MSR in its current form. Some
sensitivities are summarised in Table 4 below. The table shows the date the surplus due to additional action begins
to return from the MSR. The process typically takes about 20 years to complete.
Table 4: Base case and sensitivities for timing of return of surplus allowances due to additional action from the
MSR
Scenario
Start year of return from MSR of
surplus due to additional actions Notes
Case with additional action
(including rebasing of the cap to
actual emissions at the start of
Phase 4.)
2063-2087 Base Case
Increase of linear reduction factor
to 2.4% from 2020
2061-2085 Small effect on emissions, so little
effect
No rebasing of the cap in 2020 2083-2107 Increased surplus without additional
action delays return of further surplus
Increase in the rate of return from
the MSR to 200 million allowances
per annum from 2020
2048-2060 All allowances return earlier due to
increased rate
Level of additional action halved
(e.g. due to slower retirement of
coal plant) from ?
2061-2073 End date of return is earlier due to
smaller savings
The return of additional surplus allowances created through the introduction of additional actions would occur
earlier if a decision was taken to release allowances from the MSR more rapidly, for example at a rate of 200 million
p.a.. However, even with this increased return rate, under the additional action scenario it would still take two to
three decades before the surplus is exhausted and the MSR is emptied.
Similarly, if a somewhat lower surplus built up, then surplus allowances from additional actions would return earlier
than set out in the additional actions scenario. However, given the size of surplus already accumulated, it would still
take decades for any additional surplus allowances to return to the market.
Conversely, continuing the Phase 4 cap from the level it reaches at the end of Phase 3 without rebasing (as is
currently proposed) would increase the surplus, and thus further delay return of any allowances from additional
actions.
In theory, once additional allowances begin to be returned to the market, the waterbed effect would start to appear,
albeit with a delay of several decades after that the additional actions took place. However, given the level of
emission reductions that the EU has committed to, and the requirements of the Paris Agreement, it is difficult to
envisage that there would be the scope for these allowances to be returned to the market, and that no actions to
reduce supply would have been carried out in the meantime. This is considered further in the next section.

Puncturing the waterbed myth 16
3. The likelihood of permanent emissions reductions
The waterbed effect hypothesis assume that the supply of allowances is fixed. This is only true in the short to
medium term over which the cap is defined by legislation, and even then only in part as there is potential for action
to alter supply, for example by cancelling allowances in the MSR. Supply in the longer term is not fixed, but set by
future policy in the context of prevailing circumstances and international obligations. (In analytical terms, the
potential for policy response means that the long term supply of allowances is endogenous with respect to the effect
of additional actions, rather than exogenous as implied under the waterbed effect hypothesis.)
In this context, while there is a theoretical possibility that allowances freed up by additional actions might eventually
return from the MSR it seems unlikely in practice that that they would ever return to enable additional emissions.
There would not therefore be a significant waterbed effect even over the longer term.
There are various reasons for this, reflecting the likelihood that future policy decisions will be affected by the size of
the market surplus and MSR, by prices levels, and by the policy context prevailing in the second half of the century.
Several things can prevent emissions that match the additional surplus of allowances ever occurring, either because
aggregate supply of allowances is reduced in response to the additional surplus, or because there is never any
demand for the surplus allowances. Emissions can be avoided permanently, and in full, by appropriate choice of
policy.
Examples include the following.
Retiring allowances from the MSR. Allowances may be retired once the MSR reaches a certain size limit. Our
modelling of the MSR shows that with any reasonable limit on the size of the MSR, volumes would become
sufficiently large to trigger retirement.19 Additional actions will increase the number of allowances going into the
MSR, which in turn pushes the number in the reserve further above any future size limit, and hence leads to
additional cancellation of allowances above the limit.
Deciding not to return old allowances from the MSR post 2050. Policy decisions may be taken post-2050 not to
return allowances from much earlier surpluses, given prevailing policy circumstances. Emission limits would be
much tighter than they are now. The existing 2050 target would lead to the cap already being at around 100-400
million tonnes p.a. by 2050. There is also a commitment under the Paris Agreement to aim for net zero emissions in
the second half of this century. Large volumes of emissions from much earlier periods would disrupt this goal.
Retirement of allowances by Member States. The additional surplus may give individual Member States the
confidence to retire allowances, and hence reduce the cap. The chances of effective Member State cancellation are
greater if they have more flexibility to retire allowances in varying circumstances.
Tighter caps in future. If emissions are reduced by additional actions, prices are likely to remain lower than they
would otherwise be and the surplus will remain larger for longer. This may reduce the perceived costs of tighter
caps, and enable tighter caps to be set.
Successor mechanisms to the EU ETS. The EU ETS may be replaced by other mechanisms, or fundamentally
modified, before the additional surplus is returned to the market. Any new arrangements may not recognise
allowances in full. Under many of our scenarios it takes four or five decades from now for allowances to return to
the market from the MSR. The likelihood of a successor policy to the EU ETS appears significant over such an
extended period.
19 See our previous report on the MSR https://sandbag.org.uk/reports/stabilising-market-stability-reserve/
Puncturing the waterbed myth 17
Indefinite surplus. Vigorous additional policy actions - such as the phase out of coal, the development of industrial
CCS and introduction of new low-emitting technologies to replace current ones - may resulting in cumulative
emissions always remaining below the cumulative cap. In such circumstances some EUAs will simply not be needed.
Emissions savings due to additional actions will be realised in full, or very nearly so.
Some of these events, such as a tightening of future caps, can occur even when the market is no longer in surplus.
For example, lower allowance prices due to additional action may enable tighter caps even in a market not in
surplus. The absence of the “waterbed effect” is thus not dependent on the current surplus in the EU ETS. It is only
dependent on adequate policy action being taken. Additional actions can thus result in long term emissions
reductions even after the market has returned to scarcity.
In the light of these possibilities allowances only return, and the corresponding emissions only occur, if there is a
failure over several decades to take policy decisions at the EU level (and national level in the case of Member State
cancellation) to respond to larger surpluses. The “waterbed effect” will thus only be present at all if policy makers
choose to allow it to be over several decades.
Sandbag’s strong preference is for the EU ETS cap to be progressively tightened, the size of the MSR to be limited
and allowances retired above a limit set for the MSR, reducing total supply. This helps deliver cost effective emission
reductions in line with the EU’s own targets and the Paris Agreement. However, in the unlikely event that allowances
released by additional action are allowed to return to the market, with no counterbalancing reduction in supply and
an increase in emissions takes place, the emissions would nevertheless have been delayed by several decades from
when they would otherwise have occurred.
4. Other benefits of additional actions
It is often argued that undertaking additional measures is not only ineffective because of the “waterbed effect”, but
is also inefficient because it makes emission reductions more costly. However, additional policy actions often have a
range of benefits beyond reductions in greenhouse gas emissions. Examples include the following:
Structural transformation. The energy system needs to be transformed in a variety of ways as part of the transition
to a low carbon economy, and carbon pricing will not always be able to incentivise this effectively20. For example,
grids need to become more flexible. Many additional actions to reduce emissions have co-benefits in this respect.
For example, energy efficiency measures can help lock in lower emission systems.
New technology development. Renewable power generation is a critical component of any low carbon energy
system and policies to promote the deployment of renewables are found in all major economies. The EU’s role in
reducing the costs of renewables through policy-driven deployment has been one of its major contributions to the
long term effort to limit climate change. Similarly, other new technologies such as carbon capture and storage
require additional support in the early stages of commercialisation.
Other environmental benefits. Some policies may provide other environmental or social benefits. For example,
closing coal plants reduces local or regional pollution that directly affects health21.
Energy security. Lower carbon energy supply may reduce dependency on imported fossil fuels.
Industrial policy. Some means of emission reductions may be promoted as part of a wider industrial policy.
20 See Grubb, Planetary Economics (2013) for a full discussion of this issue. 21 See Sandbag’s report.
Puncturing the waterbed myth 18
The presence of these other potential benefits implies that in assessing additional policies it is usually inappropriate
simply to take account only of the benefits of direct greenhouse gas emission reductions or to calculate the cost of
measures in €/t of abatement22.
Furthermore, carbon pricing is itself an imperfect signal for long term investment. There are several reasons for this,
including the political risk associated with long term revisions to the price, and asymmetries of political risks tending
to lead towards weaker than optimal targets. Additional policies and actions can help overcome these limitations.
5. Conclusions
Additional policy actions in the EU ETS sectors cause at most a limited “waterbed effect”, with less than 10% of
emissions reductions from additional actions being absorbed by a price response. The immediate waterbed effect
thus only occurs to a small extent. This is consistent with the current state of the market where emissions remain
well below the cap despite lower prices.
Correspondingly, in practice over 90% of the emissions reductions from additional actions are likely to be retained
into the long term. While there is a theoretical possibility that allowances may return to the market in the very long
term it is most unlikely in practice that they will do so and undesirable that they should. Various policy mechanisms,
including cancellation of allowances and tighter future caps, have the potential to act to prevent any increase in net
supply due to allowances returning from the MSR. These also applies to a large extent to additional actions taken
after the market has returned to scarcity, so a waterbed effect would be expected to only a limited extent at most
even then.
The often repeated claim that additional policy actions “do nothing to reduce emissions because the EU ETS cap is
fixed and emissions will take place elsewhere up to the level of the cap” is seriously misleading, reflecting an
outdated view of the EU ETS and an erroneous assumption that the supply of allowances is fixed in the long term. It
should not be used as an excuse for inaction.
22 For an example of this type of comparative approach see the report by the OECD (http://www.oecd-ilibrary.org/environment/effective-carbon-prices_9789264196964-en) arguing that explicit carbon prices were below the levels of the implicit carbon price due to other policies such as Feed-In-Tariffs, and thus carbon pricing was more cost-effective as a means of emission reductions. However, the analysis acknowledged that carbon emission reduction was only one motivation for many of the policy instruments included in the study but that it had not accounted for these co-benefits. Consequently the case made is inconclusive. See Executive summary and p.31 for notes on co-benefits.
Puncturing the waterbed myth 19
Annex 1: Further details of modelling approach and results
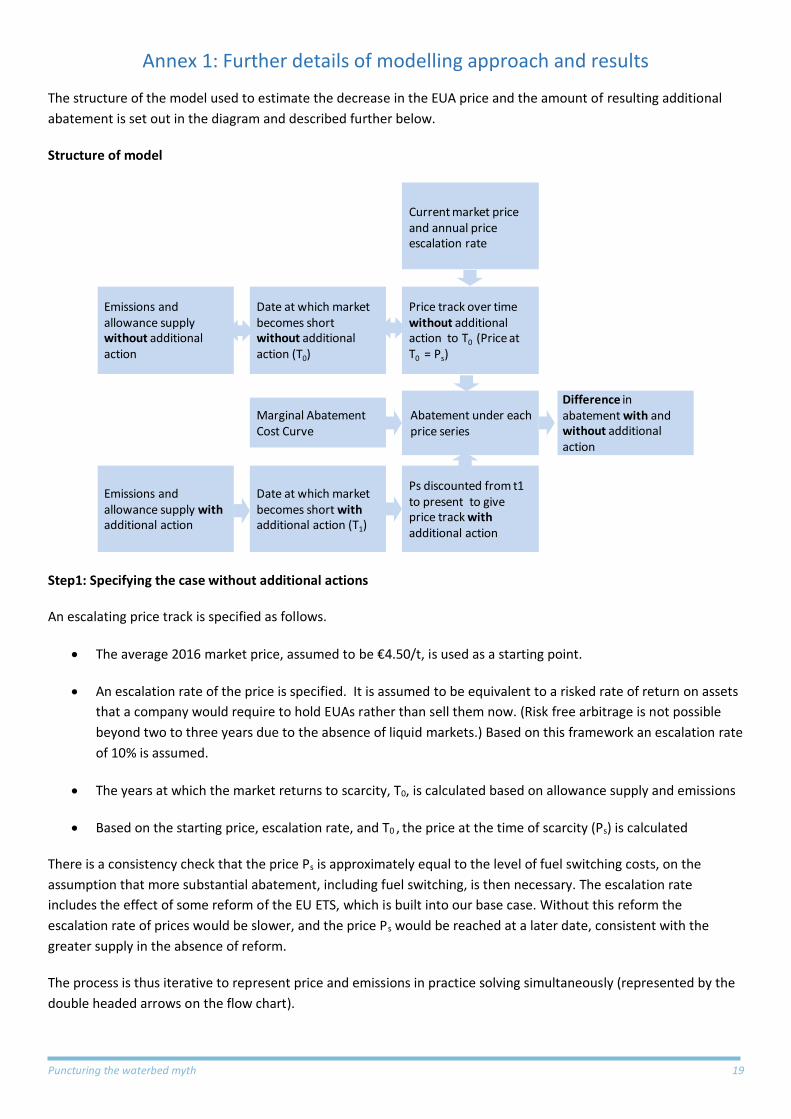
The structure of the model used to estimate the decrease in the EUA price and the amount of resulting additional
abatement is set out in the diagram and described further below.
Structure of model
Step1: Specifying the case without additional actions
An escalating price track is specified as follows.
The average 2016 market price, assumed to be €4.50/t, is used as a starting point.
An escalation rate of the price is specified. It is assumed to be equivalent to a risked rate of return on assets
that a company would require to hold EUAs rather than sell them now. (Risk free arbitrage is not possible
beyond two to three years due to the absence of liquid markets.) Based on this framework an escalation rate
of 10% is assumed.
The years at which the market returns to scarcity, T0, is calculated based on allowance supply and emissions
Based on the starting price, escalation rate, and T0 , the price at the time of scarcity (Ps) is calculated
There is a consistency check that the price Ps is approximately equal to the level of fuel switching costs, on the
assumption that more substantial abatement, including fuel switching, is then necessary. The escalation rate
includes the effect of some reform of the EU ETS, which is built into our base case. Without this reform the
escalation rate of prices would be slower, and the price Ps would be reached at a later date, consistent with the
greater supply in the absence of reform.
The process is thus iterative to represent price and emissions in practice solving simultaneously (represented by the
double headed arrows on the flow chart).
Emissions and allowance supply without additional action
Emissions and allowance supply withadditional action
Date at which market becomes short without additional action (T0)
Date at which market becomes short withadditional action (T1)
Price track over time without additional action to T0 (Price at T0 = Ps)
Current market price and annual price escalation rate
Ps discounted from t1 to present to give price track withadditional action
Marginal Abatement Cost Curve
Abatement under each price series
Difference in abatement with and without additional action

Puncturing the waterbed myth 20
The amount of abatement in this scenario is then calculated based on the marginal abatement cost curve.
Step 2: Specifying the case with additional actions
The price is then reduced to reflect the increased supply of allowances. This is done as follows.
The date at which the market returns to scarcity with additional actions (T1) is calculated
The price reached in that years is set equal to Ps. This in practice means the same price is reached some
years later.
This price is discounted back to the current date using the same escalation rate of 10%, giving a lower
starting price (below the current market level).
This in effect discounts the price by the number of years’ difference between the timing of the market returning to
balance with and without additional action.
The amount of abatement with this new lower price track is calculated.
In principle this could affect the price calculation (price and volume need to solve simultaneously) but in practice the
effect on the date at which the market returns to balance is small – not more than one year – and well within the
uncertainties caused by other assumptions.
Step 3 – calculating the difference between cases
The reduction in abatement (increase in demand for allowances) is then calculated by subtracting the abatement
with additional actions from the abatement without additional actions. This is extent of the waterbed effect. It is
expressed as a percentage by comparing it with the reduction in demand due to additional action.
This analysis implicitly assumes that additional actions are all announced and committed to at once, and the full
effect is immediately realised in the market price as this information is absorbed, with the price escalation rate
unchanged. An alternative assumption, perhaps more realistic, is that the market price is affected only gradually
over time by a programme of additional actions, with less of an immediate price fall and a slower subsequent
escalation rate to reach the eventual price Ps. This would give a price track between those with and without
additional actions estimated here, and would thus show a somewhat reduced waterbed effect. The effect of the
assumption of a full and immediate effect on the market price is therefore to tend to overstate the price response,
and therefore the extent of the waterbed effect.
The results of the analysis are summarised in Table A1 below. The greater different in emissions in the later years is
due to the greater absolute difference in price.
Table A1: summary of waterbed effect
Year Without Additional Action With Additional Action Difference (Increase in emissions)
Price Resulting
Abatement
Price Resulting
Abatement
Increase in
allowance
demand
Increase in demand as
percentage of average
additional action
2016 4 8 2 4 4 2%
2020 7 13 3 6 7 3%

Puncturing the waterbed myth 21
2025 11 21 5 10 11 5%
2030 17 34 8 16 18 8%
Comparison of price tracks with Point Carbon analysis
The escalation rate on price here is smaller than that assumed by Point Carbon in their price forecasting over the
next four years. Point Carbon projects price increases (and therefore rates of return for those holding EUAs as
financial assets) of over 30% p.a. in the remainder of this decade. Prices then escalate and a rate close to the
assumption we have adopted in our modelling. The very high escalation rates over the next four years assumed by
Point Carbon lead to their price projections being consistently above the price levels we have assumed.
Without rebasing With rebasing
Price (€/t)
Growth Rate from
previous (% p.a.) Price
Growth Rate from
previous (% p.a.)
2016 4 n/a 4.5 n/a
2020 12 32 15 35
2030 33 11 42 11
Puncturing the waterbed myth 22
Annex 2: Robustness of emissions savings from additional actions
In this report additional actions are assumed to result in an initial emissions saving, which may be balanced by
increases elsewhere due to the functioning of the EU ETS cap. This Annex considers the circumstances in which the
types of action shown in Table 1 result in emissions savings.
Energy efficiency directly reduces the demand for electricity or combustion energy, thus reducing emissions. The
only exception to this would be if the system were oversupplied with renewables, and their use were curtailed
further by energy efficiency programmes. This is likely to be the case only for a small proportion of the year at most.
Additional deployment of renewables almost always displaces fossil generation and so reduces emissions.
The closure of lignite plant, which is the most emissions intensive form of electricity generation, will be replaced by
less emissions intensive sources, so again reduces emissions.
Replacing coal plant with less carbon intensive generation, from gas, nuclear or renewables also results in a direct
saving.
The closure of all coal plant in weakly interconnected markets will also reduce emissions, because the generation
will be replaced by less carbon intensive sources.
The action of a national carbon tax also reduces emissions to the extent that it increases efficiency or results in
more carbon intensive sources of electricity generation being displaced.
Reduction of output from coal plant in strongly interconnected markets, either by closure or a carbon tax, opens up
the possibility that the plant may be replaced by other coal plant currently running below capacity. Whether this
occurs depends on detailed operating regimes. It has been estimated that this may occur to some extent in the
Netherlands (see http://www.nltimes.nl/2016/07/13/report-closing-all-dutch-coal-plants-by-2020-to-cost-e7-
billion/) However this is unlikely to apply in the case of large scale closures of coal plant, as there would not be
enough alternative plant to increase generation in the event of closure in any case.

Puncturing the waterbed myth 23
Annex 3: Comparison with other work
A recent study by the consultancy Ecofys23 also examined the waterbed effect. It looked specifically at the closure of
Dutch coal plants. The study found that in response to the closure of coal plants there would be increased emissions
elsewhere comprising:
1. Additional emissions from alternative electricity generation to the extent that the alternative is not carbon-
free.
2. A small amount of additional emissions from a decrease in the EUA price
3. A surplus which would either stay in circulation or go into the MSR and return to the market at a later date,
thus representing a delay in emissions.
This is broadly in line with our conclusions in this study. However, Ecofys’ analysis appears to foresee less of a delay
in returning allowances to the market, which appears to reflect estimates by some third party analysts of a smaller
surplus than we expect24.
The study notes in passing that if more widespread national measures are adopted this will have a correspondingly
larger effect on the EU ETS and MSR, as is shown by our analysis. However, the Ecofys study does not explore this
further. They also note that modifications to the EU ETS to take account of national measures could affect outcomes,
but again their report does not explore this further.
Ecofys’ conclusions are thus broadly in line with those of this study, although they do not cover all of the issues
raised here.
23 http://www.ecofys.com/en/news/the-waterbed-effect-and-the-eu-ets-study-now-available-in-english/ 24 They cite studies by European Environment Agency, 2015a, PBL & NEa, 2014, DEHSt, 2014, Thomson Reuters Point Carbon, 2014, and Sandbag, 2015, showing the surplus decreasing to below 833 Mt between 2025 and 2032. Sandbag’s work suggests that there will be no volumes released before 2030.

Puncturing the waterbed myth 24
About this briefing
We are grateful to the European Climate Foundation for helping to fund this work. Full information on Sandbag and our funding is available on our website (www.sandbag.org.uk).
Briefing Author: Adam Whitmore Contact [email protected] or on (+44) 02071 486377.
Sandbag Climate Campaign is a not-for-profit enterprise and is in registered as a Community Interest Company under UK Company Law. Company #671444. VAT #206955986.
Trading (Correspondence) Address: 40 Bermondsey Street, London, UK, SE1 3UD. Registered Address: BWB Secretarial Ltd, 10 Queen Street Place, London EC4R 1BE.
EU Transparency Number: 94944179052-82.