pupil fatalities on public transit buses: a comparison … 6-3 kostyniuk.pdfjournaof pul blrantics...
TRANSCRIPT

Pupil�Fatalities�on�Public�Transit
43
Pupil Fatalitieson Public Transit Buses:
A Comparison with School BusesLidia�P.�Kostyniuk
University�of�Michigan,�Transportation�Research�Institute
Abstract
Fatality�rates�of�school-age�children�on�trips�to/from�school�by�transit�buses��(while
passengers�or�pedestrians�approaching�or�leaving�the�bus)�were� estimated�from
existing�data� and�compared�with� school-bus-related� fatality� rates.� �Data� from
FARS�1996�1998�were�used�to�identify�deaths�of�school-age�bus�passengers�and
pedestrians�in�all�crashes�during�times�that�children�normally�travel�to/from�school.
Police�crash�reports�were�obtained�for�the�pedestrian�deaths�and�reviewed�for�bus
involvement�and� identification�of� the� trip�as�one� to/from�schoo l.� �The�average
number�of�pupils�killed�on�such�trips�on�transit�buses�in�the�United�States�was�0.3
deaths�per�year,�and�possibly�as�high�as�1.7�deaths�per�year.��Using�NPTS�data�to
control� for� exposure,� a� fatality� rate�of� four�deaths�per�billion�pupil� trips� (95%
confidence�interval�of�1�11)�was�estimated.�Within�the�precision�achievable�with
available�data,�no�recognizable�difference�between�pupil� fatali ty�rates�by�transit
buses�and�school�buses�was�found.
IntroductionThere�are�approximately�57�million�children,�age�5�18,�in�the�United�States�(U.S.
Census�Bureau,�2001)�and�most�of�them�are�pupils�in�kindergarte n�through�12th
grade�(K-12).�About�23.5�million�of�these�children�travel�to�and�from�school�on

Journal�of�Public�Transportation,�Vol.�6,�No.�3,�2003
44
school�buses,1� operated�or� contracted�by� schools�or� school�districts� [National
Highway�Traffic�Safety�Administration�(NHTSA)�2001a].�In�many�states,�there�is�no
legal�mandate�to�provide�pupils�with�transportation�services�and�because�of�other
funding�priorities�and�limited�budgets,�some�schools�and�school �districts�look�to
public�transit�buses�as�an�alternative�to�school�buses.�Indeed, �many�urban�public
transportation�systems�have�special�fares�for�students,�and�adjust�their�schedules
and� routes� to�meet� the�demand� for� trips� to� and� from� school.�The �number�of
children�who� travel� to�and� from�school�on�common�carrier�buses� operated�by
public�transit�agencies�is�not�known,�but�was�reported�in�1996� to�be�about�two
million�(National�Association�of�State�Directors�of�Public�Transportation�Services
1996).�Although�the�number�of�fatalities�and�injuries�on�public �transit�systems�is
very�low�(e.g.,�see�NHTSA�2001b),�most�riders�are�adults,�and�c ommunities�con-
sidering�public�transit�for�pupil�transportation�have�questions�about�the�safety�of
children�traveling�on�these�buses.�Periodically,�a�tragic�death�of�a�child�on�the�way
to�or�from�school�by�public�transit�bus�intensifies�these�quest ions�(e.g.,�National
Transportation�Safety�Board�1997).
Children�traveling�either�by�school�bus�or�transit�bus�are�expo sed�to�risks�of�injury
or�death�as�passengers�on�the�bus�as�well�as�pedestrians�approa ching�or�leaving�the
bus.�There� are,�however,�more�measures� to� reduce� these� risks� for� children�on
school�buses�than�for�children�on�public�transit�buses.�For�example,�many�of�the
Federal�Motor�Carrier�Safety�Standards�(FMCSS)�that�apply�to�buses�have�addi-
tional�requirements�for�school�buses,�including�outside�mirrors �that�allow�a�seated
driver� to�see�along�both�sides�of� the�bus,�amber�and�red�warnin g� lights� for�use
when�loading�and�unloading�passengers,�emergency�exits,�and�spe cial�fuel�system
requirements.� In� addition,� four� FMCSS� are�unique� to� school� buse s,� including
minimum�structural� strength� for� rollover�protection,�bus�body� joint� strength,
high-backed�and�well-padded�passenger�seats,�and�a�pedestrian�s afety�system�con-
sisting�of�a�stop�signal�arm�to�protect�pupils�in�the�bus�loading�and�unloading�area
(Code�of�Federal�Regulations�49�CFR�571.3,�2002).�Furthermore,� traffic�laws�of�all
50�states�and�the�District�of�Columbia�require�motorists�to�stop�when�they�en-
counter�a�school�bus�that�is�loading�or�unloading�children�(Hamada�1999).�There
are�no�similar�traffic�rules�for�public�transit�vehicles.
Although�the�extra�safety�precautions�associated�with�school�bu ses�seem�to�indi-
cate�greater�safety�on�the�school�bus�system,�a�comparison�of�the�rates�of�fatalities
and� injuries� sustained�by�children�on� the�way� to�and� from�schoo l�by�both�bus
systems�would�provide� a�more�definitive� answer� to� the�question� about�pupil
Pupil�Fatalities�on�Public�Transit
45
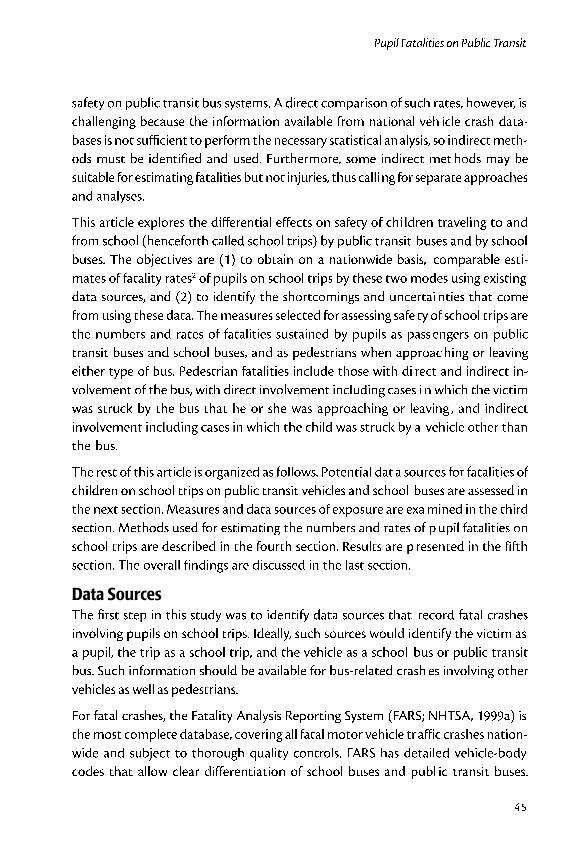
safety�on�public�transit�bus�systems.�A�direct�comparison�of�such�rates,�however,�is
challenging�because�the� information�available�from�national�veh icle�crash�data-
bases�is�not�sufficient�to�perform�the�necessary�statistical�analysis,�so�indirect�meth-
ods�must�be� identified�and�used.� Furthermore,� some� indirect�methods�may�be
suitable�for�estimating�fatalities�but�not�injuries,�thus�calling�for�separate�approaches
and�analyses.
This�article�explores�the�differential�effects�on�safety�of�chi ldren�traveling�to�and
from�school�(henceforth�called�school�trips)�by�public�transit�buses�and�by�school
buses.�The�objectives�are� (1)� to�obtain�on�a�nationwide�basis,� comparable�esti-
mates�of�fatality�rates2�of�pupils�on�school�trips�by�these�two�modes�using�existing
data�sources,�and�(2)�to�identify�the�shortcomings�and�uncertai nties�that�come
from�using�these�data.�The�measures�selected�for�assessing�safe ty�of�school�trips�are
the�numbers�and� rates�of� fatalities� sustained�by�pupils� as�pass engers�on�public
transit�buses�and�school�buses,�and�as�pedestrians�when�approaching�or�leaving
either�type�of�bus.�Pedestrian�fatalities�include�those�with�di rect�and�indirect�in-
volvement�of�the�bus,�with�direct�involvement�including�cases�i n�which�the�victim
was� struck�by� the�bus� that�he�or� she�was�approaching�or� leaving ,� and� indirect
involvement�including�cases�in�which�the�child�was�struck�by�a� vehicle�other�than
the�bus.
The�rest�of�this�article�is�organized�as�follows.�Potential�data�sources�for�fatalities�of
children�on�school�trips�on�public�transit�vehicles�and�school�buses�are�assessed�in
the�next�section.�Measures�and�data�sources�of�exposure�are�examined�in�the�third
section.�Methods�used�for�estimating�the�numbers�and�rates�of�p upil�fatalities�on
school�trips�are�described�in�the�fourth�section.�Results�are�p resented�in�the�fifth
section.�The�overall�findings�are�discussed�in�the�last�section.
Data SourcesThe�first�step�in�this�study�was�to�identify�data�sources�that� record�fatal�crashes
involving�pupils�on�school�trips.�Ideally,�such�sources�would�identify�the�victim�as
a�pupil,�the�trip�as�a�school�trip,�and�the�vehicle�as�a�school �bus�or�public�transit
bus.�Such�information�should�be�available�for�bus-related�crash es�involving�other
vehicles�as�well�as�pedestrians.
For�fatal�crashes,�the�Fatality�Analysis�Reporting�System�(FARS;�NHTSA,�1999a)�is
the�most�complete�database,�covering�all�fatal�motor�vehicle�traffic�crashes�nation-
wide�and� subject� to� thorough�quality� controls.� FARS�has�detailed�vehicle-body
codes� that� allow�clear�differentiation�of� school�buses� and�publ ic� transit�buses.
Journal�of�Public�Transportation,�Vol.�6,�No.�3,�2003
46
FARS�also�has�a�special�code�to�indicate�that�a�school�bus�was�involved�in�a�crash.
Crashes�involving�school�buses�with�other�vehicles�or�with�pede strians�are�coded
as�school-bus�related.�Pedestrian�crashes�in�which�a�child�was� struck�by�another
vehicle�while�approaching�or�leaving�the�school�bus�are�also�coded�as�school-bus
related,�if�the�lights�on�the�school�bus�were�flashing.�Cases�i n�which�the�victim�was
a�passenger�on�a�public�transit�bus�or�was�struck�by�the�bus�can�be�easily�identified
in�FARS,�but�there�are�no�codes�to� identify�a�victim�as�a�pupil�on�a�school�trip.
There�are�also�no�elements�for�coding�the�indirect�involvement� of�public�transit
buses�in�any�pedestrian�crash.�It�is�feasible�to�identify�victims�as�possible�pupils�by
determining�if�the�victim�was�of�school�age,�and�if�the�crash�o ccurred�at�the�time�a
child�would�be�traveling�to�or�from�school,�but�there�is�no�way �of�assessing�whether
a�public�transit�bus�was�indirectly�involved.
Other�electronic�data�sources�were�examined�to�determine�if�they�contained�in-
formation�about�indirect�involvement�of�public�transit�buses�in �pedestrian�deaths
or�if�victims�could�be�identified�as�pupils�on�a�school�trip.�Among�the�data�systems
examined�were:�the�National�Accident�Sampling�System�(NASS)�General�Estimates
System� (NHTSA�1999b),�NASS� System�Crashworthiness�Data� System� (NHTSA
1998),�NASS�Pedestrian�Crash�Data�Study�(NHTSA�1997),�Crash�Out come�Data
Evaluation�System�(NHTSA�1996a,�the�National�Transit�Database�(Federal�Transit
Administration�1999)�and� state�crash�data� files� (NHTSA�1999c).� None�of� these
data� sources� could�provide� information�on� the� indirect� involvement�of�public
transit�buses�in�pedestrian�crashes.�With�the�exception�of�Colorado�s�state�crash
data,�which�has�a�provision�for�identifying�a�victim�as�a�child �on�a�school�trip,�none
of�the�data�sources�could�identify�a�victim�as�a�pupil�on�a�school�trip.
Several�nonelectronic�data�sources�were�also�considered�including�annual�national
surveys�of�school�bus� loading�and�unloading�accidents�published �by�the�Kansas
State�Department�of�Education�(KSDOE�1996,1997,1998,�1999)�and� original�hard-
copy�police�crash�reports�(PCRs).�The�KSDOE�reports�contain�much�information
about�direct�and�indirect�involvement�of�school�buses,�but�prov ide�little�informa-
tion� about�public� transit� bus� crashes.�The�PCRs� (from�which� ele ctronic� crash
records�are� coded)� include�narratives,� crash�diagrams,�witness� statements,� and
other� information�about�the�crash.�Thus,�additional� information �about�cases� in
FARS�electronic�data�can�be�found�in�these�PCRs�and�may�provide�enough�infor-
mation�to�determine� if�a�child�was�on�a� school� trip,�and�also� t o�determine� if�a
public�transit�bus�was�indirectly�involved.
Pupil�Fatalities�on�Public�Transit
47
The�most�promising� source� for� comparing� fatalities�on�public� transit�buses� to
those�on�school�buses�appears�to�be�a�combination�of�FARS�electronic�data�and
PCR�materials.�Fatal�crashes�involving�pupil�passengers�on�school�buses�and�pupil
pedestrians,�whether� they�were� struck�by� the� school�bus�or�by�another�vehicle
when�approaching�or� leaving� the� school�bus,� can�be�obtained� from�FARS�elec-
tronic�data.�Cases�in�which�victims�were�school-age�passengers� of�public�transit
buses�or�school-age�pedestrians�struck�by�public�transit�buses� can�also�be�identi-
fied�directly� from�FARS�electronic�data.� Indirect� involvement�of�public� transit
buses�in�pupil�fatalities�may�be�determined�through�the�review�of�hard-copy�PCRs
of�cases�identified�by�screening�FARS�data.�Because�indirect�involvement�of�a�bus�in
a�crash�occurs�when�a�pedestrian,� approaching�or� leaving� the�bu s,� is� struck�by
another�vehicle,�the�set�of�all�vehicular�crashes�involving�pedestrians�of�school�age
that�occurred�at�the�time�that�children�regularly�travel�to�and �from�school�should
also�contain�those�cases�in�which�public�transit�buses�were�ind irectly�involved.
ExposureMeasures
To�calculate�rates�of�crashes�involving�pupils�on�school�trips,�a�suitable�measure�of
exposure�had�to�be�selected.�This�was�done�by�examining�the�typ es�of�risks�pupils
are�exposed� to�on� school� trips�by�bus,� the�measures�of� these� ri sks,� the� relative
magnitude�of�these�risks,�and�the�availability�of�meaningful�da ta.
Children�on�school�trips�by�bus�are�exposed�to�the�risk�of�two� types�of�crashes:�the
risk�of�a�crash�while�they�are�passengers�on�the�bus�and�the�ri sk�of�being�struck�by
the�bus�or�another�vehicle�when�they�are�approaching�or�leaving �the�bus.�Pupil-
miles�of�travel�is�an�appropriate�exposure�measure�for�the�firs t�type�of�crash.��Crashes
of�the�second�kind�can�occur�only�at�two�points�during�each�tri p;�that�is,�when�the
pupil�gets�on�or�off�the�vehicle.�Thus,�the�number�of�pupil�tri ps�is�an�appropriate
exposure�measure�for�the�second�type�of�crash.
NHTSA�(1999d)�reports�that�in�school-bus-related�crashes,�three �times�as�many
pedestrians�as�passengers�are�killed.�Because�the�overall�number�of�fatalities�aboard
public�transit�buses�is�small,�the�number�of�pupil�fatalities�on�board�transit�buses
is�also�small.�Therefore,�it�is�plausible�to�expect�that�the�ri sk�to�children�is�greater
when�they�are�approaching�and�leaving�a�public�transit�bus�than �when�they�are
passengers�on�that�bus.�Furthermore,�estimating�pupil-miles�of� travel�would�in-
volve�estimating�distributions�of�the�pupil-trip�lengths�and�pupil�bus�occupancies
over�bus�routes,�and�any�proxy�for�pupil-miles�would�at�best�be �a�crude�approxi-

Journal�of�Public�Transportation,�Vol.�6,�No.�3,�2003
48
mation.�These�challenges�led�to�the�selection�of�pupil�trips�as �the�single�exposure
measure�for�this�study.
Exposure Data
School�bus�ridership�by�state�is�available�from�the�National�As sociation�of�State
Directors�of�Pupil�Transportation�Services�(Bobbitt�Publications�2002).�The�chal-
lenge�in�this�study�was�to�find�a�source�of�comparable�pupil�ri dership�on�public
transit�systems.�Several�sources�were�examined�including�the�National�Transit�Da-
tabase� (Federal�Transit�Administration�1999),�American�Public�Transportation
Association�(APTA),�public�transit�systems,�and�the�National�Personal�Travel�Sur-
vey�(NPTS;�Research�Triangle�Institute�and�Federal�Highway�Administration�1997).
The�National�Transit�Database�does�not�have�student�ridership�nor�does�it�distin-
guish�riders�by�age.�APTA�does�not�routinely�collect� student� ridership� informa-
tion.�While�many�public� transit� agencies� collect� student� ridership�data,� several
were�contacted�and�indicated�that�their�legal�departments�would �not�allow�them
to�provide�data�for�this�study.
The�NPTS�is�the�national�database�of�travel�patterns�and�can�be �used�to�estimate
trips�by�age�group�by�purpose�by�modes,�including�the�number�of �school�trips�by
various�modes.�The�latest�available�NPTS�data�at�the�time�of�th is�study�were�from
1995.�There�are�several�problems,�however,�with�using�NPTS�data�to�estimate�the
number�of�pupil� trips�on�public� transit�buses.�One�problem� is� t hat�NPTS�has
codes� for� three� types�of�buses:� intercity�bus,� school�bus,� and� bus.�This�distin-
guishes� school�buses� from�other�buses,�but�does�not�distinguish �public� transit
buses�from�other�types�of�buses.�Although�the�buses�coded�as��b us��in�NPTS�for
school�trips�are�most�likely�public�transit�buses,�the�possibil ity�of�other�types�of
buses�(e.g.,�private�bus,�shuttle�service�bus)�cannot�be�ruled� out.
Another�problem�may�be�how�accurately� actual� school� trips� can�be�estimated
from�the�NPTS�data.�The�NPTS� survey�collects�data� from�a�national� sample�of
households�on�all�personal�travel,�of�which�school�trips�are�a� very�small�part.�The
actual�number�of�school�trips�in�the�sample�is�relatively�small ,�which�suggests�that
the�uncertainty�associated�with�national� estimates�of� these� trips� from�NPTS� is
large.
Despite�these�shortcomings,�NPTS�was�by�far�the�best�source�of� national�modal
information�for�school�trips�and�using�NPTS�for�pupil�trips�for �both�school�buses
and�public� transit�buses�provides� comparable� estimates.�NPTS�was,� therefore,

Pupil�Fatalities�on�Public�Transit
49
selected�to�provide�a�national�estimate�of�pupil�transit�bus�ridership�and�school
bus�ridership�for�this�study.
Method for Estimating Pupil Fatalities and RatesBecause�the�number�of�fatalities�involving�school�buses�and�transit�buses�is�small,
one�year�of�FARS�data�would�not�be�sufficient�for�this�analysis.�Accordingly,�three
years�of�FARS�data�(1996�1998)�were�used.�The�following�set�of�criteria�was�used
to�identify�potential�cases�involving�children�on�school�trips�by�school�bus�and�by
public�transit�bus.
Time�Criteria
� September�through�June,�excluding�Labor�Day,�Thanksgiving�and�the�fol-
lowing�Friday,�Christmas,�New�Year�s�Day,�and�the�week�between�Christ-
mas�and�New�Year�s�Day,�and�Memorial�Day
� Monday� though�Friday
� Hours:� 6:00�8:59�and�14:00�16:59
� Victim�criteria
� Age�5�18�years
� Occupant�of�a�bus�or�van3�or�a�pedestrian�in�a�crash�with�any�vehicle
� Vehicle�criteria,�if�victim�is�not�a�pedestrian
� School�bus�or�van,�operated�by�a�school,�school�district,�or�private�contrac-
tor
� Transit�bus�or�van,�operated�by�public�transit�system
Applying�these�time�criteria�may�exclude�crashes�on�some�school�trips�that�oc-
curred�during�regular�school�hours,�late�in�the�day,�on�weekends,�or�during�sum-
mer� school.� Furthermore,�because�vacation�periods�and�holidays� vary�between
states�and�often�within�a�state�by�school�district,�use�of�thes e�time�criteria�may
exclude�some�cases�that�occurred�on�a�school�day�and�retain�others�that�did�not.
However,�examination�of� the�distributions�of� school-age� fatalities� in� school-bus
related�crashes�recorded�in�FARS�by�month,�day,�and�hour�(Kostyniuk�and�Joksch
2002)�showed�that�these�criteria�captured�most�of�the�cases.�Time�periods�identi-
fied�by�the�time�criteria�are�referred�to�as�regular�school-travel�hours�in�the�rest�of
this�article.

Journal�of�Public�Transportation,�Vol.�6,�No.�3,�2003
50
Pupil Passenger Fatalities
School-age�passenger�fatalities�were�identified�directly�from�the�FARS�electronic
data�files�and�are�shown�in�Table�1.�There�were�84�crashes�involving�buses,�of�which
10�involved�at�least�1�school-age�passenger�fatality.�There�were�9�crashes�involving
school�buses�in�which�12�children�were�killed.�There�were�no�school-age�children
killed�as�passengers�on�public� transit�buses�during� regular� school-travel�hours.
However,�1�school-age�passenger�was�killed�on�a�bus�coded�in�FARS�as��other��bus.
Pupil Pedestrian Fatalities Near Buses
Analysis�of�FARS�electronic�data�from�1996�1998�found�401�fatal�crashes�involving
pedestrians�age�5�18�that�occurred�during�regular�school-travel �hours.�The�PCRs
for�all� cases�were� requested� from�the� states� through�NHTSA.�Of� the�401�cases,
PCRs�were�available�for�388.�Review�of�these�narratives�found�t hat�in�14�of�the�388
cases,�the�person�killed�in�the�crash�was�not�a�pedestrian�age�5�18,�but�some�other
person� involved� in�the�crash.�These�cases�were�dropped� from�further�consider-
ation.�The�PCRs�of�the�remaining�374�cases�were�carefully�read� to�determine�if�the
victim�was�on�the�way�to�or�from�school,�and�if�any�type�of�bus �was�involved�in�the
crash.�A�summary�of�these�results�is�contained�in�Table�2.
Further�review�of�the�374�cases�identified�73�cases�in�which�bu ses�were�specifically
mentioned� (school�buses� in�58�cases;�public� transit�buses�or�other�buses�e.g.,
�city�bus��or� just� �bus�� in�15� cases).�Of� these�73� cases,� 24�were�dropped� from
Table 1. Number of Crashes Involving Buses DuringRegular School-Travel Hours

Pupil�Fatalities�on�Public�Transit
51
Table 2. Initial Sorting of the 401 Cases Involving PedestriansAge 5-18 During Regular School-Travel Hours
further� consideration�because� they�were�not� relevant� to� study� ( e.g.,� the� crash
occurred�near�a�bus�stop�with�no�bus�present;�a�bus�happened�to �be�in�the�vicinity
but�was�not�involved�in�the�crash;�a�pedestrian�was�struck�by�a �random�vehicle�in
the�traffic�stream�that�happened�to�be�a�bus).�The�remaining�48 �crashes�were�cases
in�which�school-age�pedestrians�were�killed�while�approaching�o r�leaving�a�school
bus�or�public�transit�bus.�Table�3�shows�the�distribution�of�these�cases�by�type�of
pedestrian-vehicle�interaction.
Exposure
Table�4�shows�the�numbers�of�pupil-trips�during�regular�school-travel�hours�based
on�NPTS.�Pupils�who�drove�themselves�were�excluded�and�the�smal l�number�of
trips�by�intercity�bus�is�included�in�the��other/unknown��category.�There�were�an
estimated�4.6�billion�pupil-trips�by�school�bus�and�0.3�billion �pupil-trips�by�bus.
The�latter�category�is�referred�to�as�the�nonschool�bus�category�in�the�rest�of�this
article�and�consists�mostly,�but�not�exclusively�of�trips�by�public�transit�buses.

Journal�of�Public�Transportation,�Vol.�6,�No.�3,�2003
52
Tabl
e 3.
Num
ber
of S
choo
l Bu
s an
d Pu
blic
Tra
nsit
Bus
Cra
shes
by
Pede
stri
an-V
ehic
le I
nter
acti
on

Pupil�Fatalities�on�Public�Transit
53
ResultsPassenger Fatalities
Passenger�fatalities�are�shown�in�Table�5.�Between�1996�1998,�there�were�12�pupil
fatalities�in�nine�crashes�in�which�a�pupil�was�killed�while�a� passenger�on�a�school
bus�during�regular�school-travel�hours�(four�deaths�annually).� Assuming�that�the
crashes�are�Poisson�distributed,4�the�95�percent�confidence�range�is� from�2.1�to
7.0.�Dividing�these�numbers�by�4.6�billion�pupil-trips�per�year �by�school�bus�gives
a�rate�of�0.9�pupil�passenger�deaths�per�billion�pupil�trips,�w ith�a�95�percent�con-
fidence�interval�of�0.5�to�4.5.
There�were�no�school-age�passenger�deaths�on�public�transit�bus es�during�regular
school-travel�hours�during�1996�1998.�However,� there�was�one� crash�and�one
school-age�passenger�death�on�board�a�bus�coded�in�FARS�as��other.��Assuming�a
Poisson�distribution�for�crashes�and�school-age�passenger�deaths�gives�a�95�per-
Table 4. Number (in billions) of Trips between Home and Schoolby Children, Age 5-18 During Regular School-Travel Hours
from September through June

Journal�of�Public�Transportation,�Vol.�6,�No.�3,�2003
54
cent�confidence�interval�from�0.03�to�1.9�passenger�deaths�per� year�on�nonschool
buses.�Dividing�by�0.3�billion�pupil-trips�by�nonschool�bus�per�year,�gives�a�rate�of
1.1�pupil�passenger�deaths�per�billion�pupil� trips,�with�a�95�p ercent�confidence
interval�from�0.1�to�6.2.
If�only�trips�by�public�transit�bus�are�considered,�no�school-a ge�passenger�fatalities
were�observed�during�regular�school-travel�hours.�This�gives�a� 95�percent�confi-
dence� interval� for� the�number�of� fatalities� from�0� to�1.2.�Beca use� there�was�no
exposure�measure�specifically�for�public�transit�buses,�the�number�of�pupil-trips
per�year�by�nonschool�buses�was�used�to�estimate�the�rate.�The� resulting�rate�was
0�with�a�95�percent�confidence� interval�of�0�to�4�passenger� fat alities�per�billion
pupil�school�trips�by�public�transit�bus.
Table 5. Number and Rate of Pupil Passenger Fatalities on School Buses,Nonschool Buses, and Public Transit Buses
During Regular School-Travel Hours
Pedestrian Fatalities
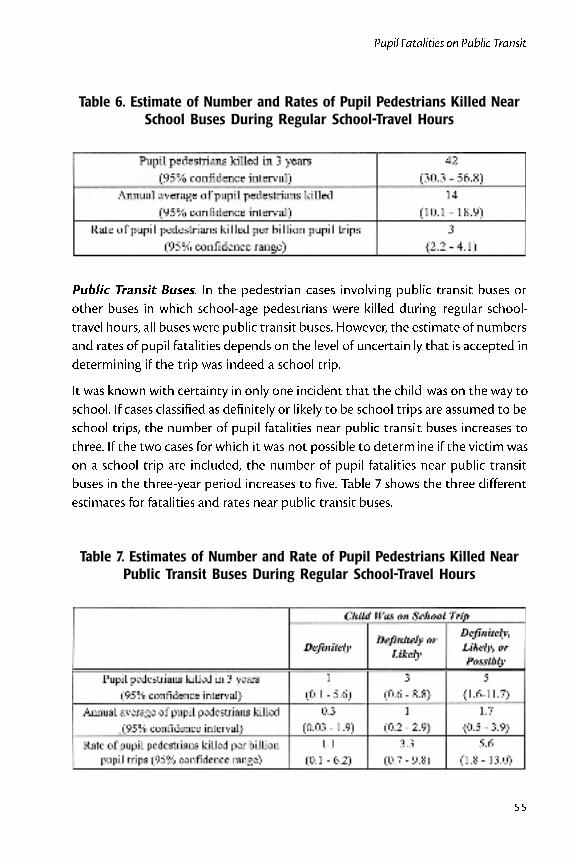
School�Buses.�There�were�42�pupil�deaths�near�school�buses�between1996�1998
(14�pupil�deaths�annually).�The�resulting�fatality�rate�is�3.0� pupil�fatalities�per�bil-
lion�pupil-trips�with�a�confidence�interval�of�2.2�to�4.1�(Table�6).
Pupil�Fatalities�on�Public�Transit
55
Table 6. Estimate of Number and Rates of Pupil Pedestrians Killed NearSchool Buses During Regular School-Travel Hours
Public�Transit�Buses.� In� the�pedestrian� cases� involving�public� transit�buses�or
other�buses� in�which� school-age�pedestrians�were�killed�during� regular� school-
travel�hours,�all�buses�were�public�transit�buses.�However,�the�estimate�of�numbers
and�rates�of�pupil�fatalities�depends�on�the�level�of�uncertain ly�that�is�accepted�in
determining�if�the�trip�was�indeed�a�school�trip.
It�was�known�with�certainty�in�only�one�incident�that�the�child �was�on�the�way�to
school.�If�cases�classified�as�definitely�or�likely�to�be�school�trips�are�assumed�to�be
school�trips,�the�number�of�pupil�fatalities�near�public�transi t�buses�increases�to
three.�If�the�two�cases�for�which�it�was�not�possible�to�determine�if�the�victim�was
on�a� school� trip�are� included,� the�number�of�pupil� fatalities�near�public� transit
buses�in�the�three-year�period�increases�to�five.�Table�7�shows�the�three�different
estimates�for�fatalities�and�rates�near�public�transit�buses.
Table 7. Estimates of Number and Rate of Pupil Pedestrians Killed NearPublic Transit Buses During Regular School-Travel Hours

Journal�of�Public�Transportation,�Vol.�6,�No.�3,�2003
56
Of�the�three�estimates,�the�first�is�likely�to�be�conservative�and�can�serve�as�a�lower
bound.�The�second�estimate�is�most�plausible�because�it�is�based�on�the�assump-
tion�that�cases�with�trips�judged�as�likely�to�a�school�trip�are�indeed�so.�The�result-
ing�estimate�gives�a�pupil�fatality�rate�near�public�transit�buses�that�appears�to�be
similar�to�the�fatality�rate�near�school�buses.�The�third�estimate�includes�cases�that
may�only�possibly�be�school�trips�and�yields�essentially�a�worst-case�estimate�that
may�serve�as�an�upper�bound.
Table�8�shows�the�full�range�of�estimates�for�the�total�(passenger�and�pedestrian)
pupil�fatality�rates�for�public�transit�buses.�There�are�two�sets�of�estimates.�The�first
set�uses�the�total�number�of�deaths�on�or�near�all�nonschool�bu ses�and�the�second
uses�only�deaths�on�or�near�public�transit�buses.�The�estimates �of�the�rate�of�pupil
fatalities�per�billion� school� trips�by�nonschool�buses� range� from�2.2� to�6.7,�de-
pending�on�the�level�of�uncertainty�accepted�in�the�identificat ion�of�school�trips.
If�only�known�public�transit�bus�cases�are�included�in�the�estimation,�this�range�is
from�1.1�to�5.6.
Table 8. Upper and Lower Bounds of Estimate of Rate ofPupil Passengers and Pedestrians Killed on School Trip
by Nonschool Buses and Public Transit Buses
Figure�1�shows�the�most�likely�estimates�of�rates�of�transit-bus-related�pupil�fatali-
ties�to�the�rate�of�school-bus-related�fatalities�and�their�95th�percent�confidence
intervals.�These�average�rates�do�not�appear�to�be�different�from�each�other.�This�is
true�whether�the�pupil�fatality�rate�from�school-bus-related�cases�is�compared�to
the�rate�for�public�transit�buses�or�to�the�rate�for�the�broade r�category�of�nonschool
buses,�which�includes�not�only�the�transit�vehicles�but�also�buses�coded�in�FARS�as
�other.���However,�because�the�number�of�cases�is�very�small,�any�differences�would
have�to�be�very�large�to�be�recognizable.

Pupil�Fatalities�on�Public�Transit
57
Figu
re 1
. Pup
il Fa
talit
y R
ates
on
Scho
ol T
rip
by S
choo
l Bu
s, N
onsc
hool
Bus
, and
Pub
lic T
rans
it B
us

Journal�of�Public�Transportation,�Vol.�6,�No.�3,�2003
58
FindingsFatality�rates�for�grade�K�12�pupils�on�public�transit�buses�and�school�buses�on
school�trips�were�estimated�based�on�fatalities�in�FARS�data�files,�review�of�police
crash�reports,�and�exposure�information�from�NPTS�data.�The�ove rall�finding�of
this�study�is�that,�within�the�precision�achievable�with�the�available�data�and�avail-
able�effort,�there�is�no�recognizable�difference�between�pupil� fatality�rates�by�school
buses�and�by�public�transit�buses.�Both�rates�were�about�four�f atalities�per�billion
pupil� trips.
While� there�was�no� recognizable�difference� in� rates,� the�differ ence� in� absolute
numbers�was� large�because�many�more� children�are� transported� to � and� from
school�by�school�buses�than�by�public�transit�buses.�The�nationwide�average�num-
ber�of�pupils�in�the�killed�going�to�or�from�school�as�bus�pass engers�or�pedestrians
approaching�or�leaving�the�bus�was�found�to�be�0.3�deaths�per�year,�and�possibly
as�high�as�1.7�deaths�per�year�(depending�on�the�uncertainty�accepted�in� inter-
preting�crash�records)�for�public�transit�buses,�and�18�for�school�buses.�The�very
low�number�of�pupil� deaths�by�public� transit�bus� greatly� limits � the� statistical
precision�of�attainable�estimates.�Precision�could�be�increased �by�using�data�from
longer�time�periods,�perhaps�as�long�as�20�years.�However,�policies�and�practices
change�over�such�long�periods,� introducing�other�sources�of�uncertainty.
In�addition�to�this�basic�difficulty�caused�by�small�numbers,�t he�process�of�esti-
mating�these�rates�was�particularly�challenging�because�of�limitations�in�data�avail-
ability.�National�and�state�motor�vehicle�crash�databases�do�not�contain�all� the
information�needed�to�identify�pupil�fatalities�and�even�the�or iginal�police�crash
reports�do�not�always�have�this�information.�The�lack�of�exposu re�data�presents
another�problem.�The�NPTS�was�the�most�comprehensive�source�of�national�data
on�school�trip�modes�available�but�because�it�groups�public�transit�buses�together
with�all�other�nonschool�buses,�it�was�not�possible�to�estimate �pupil�trips�or�other
exposure�measures�for�public�transit�buses�alone�from�these�data.
Sufficiently�detailed�data�would�reduce�the�uncertainty�in�futu re�estimates�of�pu-
pil� fatality� rates�on�public� transit�buses.�Key�pieces�of� information�needed�are
identification�of�a�pupil�on�a�school�trip�and�the�indirect�involvement�of�public
transit�buses� in�pedestrian� crashes� (crashes� in�which� the�victim�was� struck�by
another�vehicle�while�approaching�or�leaving�the�bus).�National�and�state�motor-
vehicle�crash�data�files�identify�crashes�as�school-bus�related �if�a�school�bus�was

Pupil�Fatalities�on�Public�Transit
59
directly�or�indirectly�involved.�A�similar�code�for�transit-related�crashes�should�be
invaluable�for�identifying�the�cases�involving�public�transit�buses.
More�detailed�exposure�data� is� also�critical� for�more�precise�estimates�of�pupil
fatalities�by�public�transit�bus.�The�NPTS,�although�not�fully� compatible�with�the
definitions�of�public�transit�buses,�was�the�best�nationwide�es timate�available�for
the�present�study,�because�the�National�Transit�Data�Base�maintained�by�the�FTA
does�not� contain� information�on�pupil� ridership.�Most� large�pub lic� transit� sys-
tems�have�information�on�pupil�ridership�and�could�report�it,�a lthough�they�are
not�required�to�do�so.
Changing�national� crash�databases�or� the�national� transit� system�reporting� re-
quirements� is�not�a�simple�undertaking.�An�alternative�approach �could�address
the�question�of�relative�safety�of�pupil�transportation�by�the� two�bus�modes.�A
study�could�be�designed�to�collect�information�about�school�tri p�crashes�at�the
school�district�level.�Such�a�study�would�involve�developing�an �appropriate�sample
and�then�recruiting�a�number�of�school�districts,�with�some�using�school�buses,
some�using�transit�buses,�and�some�using�both�types�of�buses.�T he�school�districts
would�report�all�crashes�involving�their�pupils�on�school�trips �by�school�bus�and
by�transit�bus�on�special�forms,�which�they�would�complete�with �the�cooperation
of�the�police�agency�investigating�the�crash.�The�advantage�of� this�approach�is�that
the�exposure�and�crash� information�could�be� fully�matched� for� t he� sample�of
pupils.�This�approach�could�also�be�used�to�collect�injury�information.�Further,�it
need�not�be�limited�to�the�bus�modes�but�could�also�be�used�to� determine�the
safety�of�the�school�trip�by�all�modes�of�travel.
The� relative� risk�of� children�s� travel� to�and� from� school�by�various�modes� is� an
important� issue.�Only�by�knowing� the� relative� risks� and� safety� records�of� each
travel�mode,�can�communities,�parents,�and�school�districts�make�informed�choices
that�balance�safety,�community�needs,�and�resources.

Journal�of�Public�Transportation,�Vol.�6,�No.�3,�2003
60
Endnotes1��49�CFR�571.3�(Code�of�Federal�Regulations�2002)�defines�a�scho ol�bus�as�a�bus�that
is�sold,�or�introduced�into�interstate�commerce,�for�purposes�that�include�carrying
students�to�and�from�school�and�related�activities,�but�does�no t�include�a�bus�de-
signed�and�sold�for�operation�as�a�common�carrier�in�urban�tran sportation.
ANSI�16.1,�Manual� on�Classification�of�Motor�Vehicle�Traffic�Accidents� defines� a
school�bus�as�a�vehicle�used�for�the�transportation�of�any�school�pupil�at�or�below
the�12th�grade�level�to�or�from�a�public�or�private�school�or�school-related�activity.
This�vehicle� is�not�a�school�bus�while�on�trips�which�involve�the�transportation
exclusively�of�other�passengers�or�exclusively�for�other�purposes.�It�is�a�school�bus
only�if� it� is�externally�identifiable�by�the�following�characte ristics:�(1)�its�color�is
yellow,�(2)�the�words��school�bus��appear�on�the�front�and�rear,�(3)�flashing�red
lights�are�located�on�the�front�and�rear,�and�(4)�lettering�on�both�sides�identified
the�school�or�school�district�served,�or�the�company�operating� the�bus.
2�The�research�on�which�this�article�is�based�did�investigate�the �feasibility�of�estimat-
ing�pupil�injuries�on�the�school�trip�by�transit�bus.�Because�o f�type�and�quality�of
data�available,�the�methods�for�obtaining�nationwide�estimates� of�pupil�injuries
were�very�different�from�those�used�to�obtain�fatality�estimate s�and�are�not�re-
ported�in�this�article.
3�The�vehicle�category��van��was�included�in�these�criteria�because�there�are�sepa-
rate� codes� in�FARS� for�van-based� school�bus�and�van-based�public� transit�bus.
Van-based�school�buses�are�included�in�the�school�bus�category,�and�public�tran-
sit�vans�are�included�in�the�public�transit�bus�category�in�this�study.
4�The� assumption�of� a� Poisson�distribution� for�passenger�deaths� i s� somewhat
tenuous�because�multiple�deaths�in�one�crash�may�not�be�independent.
Acknowledgments
This�article�is�based�on�work�by�the�author�and�Hans�C.�Joksch� of�the�University�of
Michigan�Transportation�Research� Institute� (UMTRI)� sponsored�by� the�Federal
Transit�Administration�under�TCRP�Project�J-6�Task�30,�Data�Collection�for�Pupil
Safety�on�Transit�Bus�Systems.�The�author�thanks�Jean�T.�Shope�and�Lisa�J.�Molnar
of�UMTRI�for�their�helpful�comments�and�suggestions�in�the�preparation�of�this
Pupil�Fatalities�on�Public�Transit
61
article.�The�opinions�and�conclusions�expressed�or�implied�in�this�article�are�those
of�the�author�and�not�necessarily�of�the�sponsoring�agencies.
References
ANSI�16.1.�1996.�Manual�on�classification�of�motor�vehicle�traffic�accidents.
Bobbit� Publications.� 2002.� State� by� State� Transportation� Statistics.�http://
www.schoolbusfleet.com.�Accessed� July�24,�2002.
Code�of� Federal�Regulations�49�CFR�571.3.� Federal�Motor�Vehicle� Safety� Stan-
dards,�as�of�October�1,�2002.
Federal� Transit� Administration.�National� transit� database .� 1999.� http://
www.fta.dot.gov.ntl/database.htm.�Accessed�October�10,� 1999.
Hamada,�K.,�ed.�1999.�Digest�of�motor�laws.�Heathrow,�FL:�AAA�Traffic�Safety�De-
partment.
Kansas�State�Department�of�Education.�1996.�School�bus�loading�&�unloading�sur-
vey,�1995�-96�school�year.�Topeka:�School�Bus�Safety�Education�Unit.
Kansas�State�Department�of�Education.�1997.�School�bus�loading�&�unloading�sur-
vey,�1996�97�school�year.�Topeka:�School�Bus�Safety�Education�Unit.
Kansas�State�Department�of�Education.�1998.�School�bus�loading�&�unloading�sur-
vey,�1997�98�school�year.�Topeka:�School�Bus�Safety�Education�Unit.
Kansas�State�Department�of�Education.�1999.�School�bus�loading�&�unloading�sur-
vey,�1998�99�school�year.�Topeka:�School�Bus�Safety�Education�Unit.
Kostyniuk,�L.�P,�and�H.�C.�Joksch.�2002.�Pupil�safety�on�transit�bus�systems:�A�com-
parison�with� school�buses,�Report�UMTRI-2002-15.�Ann�Arbor:�University�of
Michigan�Transportation�Research� Institute.
National�Association�of� State�Directors�of�Pupil�Transportation�Services.� 1996.
www.stnonline.com/stn/schoolbussafety.positionpapers/nasdpts_transit.htm.
Accessed�February�11,�2002.
Nation�Highway�Traffic� Safety�Administration.� 1996a.�The� crash� outcome�data
evaluation�system�(CODES).�DOT�HS�808�338�NHTSA�Technical�Report.�Wash-
ington,�D.C.:�U.S.�Department�of�Transportation.

Journal�of�Public�Transportation,�Vol.�6,�No.�3,�2003
62
National�Highway�Traffic�Safety�Administration.�1996b.�Traffic� safety� facts�1995.
DOT�HS�808�471,�Washington,�D.C.:�U.S.�Department�of�Transportation.
National�Highway�Traffic�Safety�Administration.�1997.�National�automotive�sam-
pling�system�(NASS)�Pedestrian�Crash�Data�Study�(PCDS),�1996.�Data�Collec-
tion,�Coding,� and� Editing�Manual.�Washington,�D.C.:�U.S.�Department�of
Transportation.
National�Highway�Traffic�Safety�Administration.�1998.�National�automotive�sam-
pling� system� (NASS)�Crashworthiness�Data� System� (CDS)�Analytic�User�s
Manual,�1997�File.�Washington,�D.C.:�U.S.�Department�of�Transportation.
National�Highway�Traffic� Safety�Administration.� 1999a.� FARS�analytic� reference
guide,� 1975�1998.�DOT�HS�808�792,�Washington,�D.C.:�U.S.�Department�of
Transportation.
National�Highway�Traffic�Safety�Administration.�1999b.�National�automotive�sam-
pling�system�(NASS)�General�Estimates�System�(GES),�Analytical�User�s�Manual,
1988�1997.�Washington,�D.C.:�U.S.�Department�of�Transportation.
Nation�Highway�Traffic� Safety�Administration.� 1999c.� State� crash� report� forms
catalog�1999�update.�Washington,�D.C.:�U.S.�Department�of�Transportation.
National�Highway�Traffic�Safety�Administration.�1999d.�Traffic�safety� facts�1998.
DOT�HS�808�959.�Washington,�D.C.:�U.S.�Department�of�Transportation.
National�Highway�Traffic�Safety�Administration.�2001a.�School�bus�safety:�Safe�pas-
sage� for�America�s� children.� /injury/buses/schbus/schbussum.html.�Accessed
February�11,�2002.
National�Highway�Traffic�Safety�Administration.�2001b.�Traffic�safety�facts�2000.
DOT�HS�809�337.�Washington,�D.C.:�U.S.�Department�of�Transportation.
National�Transportation�Safety�Board.�1997.�Highway�accident/incident�summary
report,�Collision�with�a�pedestrian�by�a�utility�truck�near�Cosmopolis,�Washing-
ton�on�November�26,� 1996.�Report�PB97-916201,�Washington,�D.C.
Research�Triangle�Institute�and�Federal�Highway�Administration.�1997.�1995�Na-
tionwide�Personal�Transportation�Survey,�User�s�guide� for� the�public�use�data
files.�Publication�No.�FHWA-PL-98-002�Washington,�D.C.:�U.S.�Department�of
Transportation.

Pupil�Fatalities�on�Public�Transit
63
U.S.�Census�Bureau.�2001.�Statistical�abstracts�of�the�United�States:�2001.�121st�ed.
Washington,�D.C.:�U.S.�Department�of�Commerce.
About the Author
LIDIA�P.�KOSTYNIUK�([email protected])�is�a�research�scientist�in�the�Social�and
Behavioral�Analysis�Division�at�the�University�of�Michigan�Transportation�Research
Institute.�She�holds�a�Ph.D.�in�civil�engineering�and�is�a�lice nsed�professional�engi-
neer�in�the�State�of�Michigan.�Dr.�Kostyniuk�s�research�interests�are�in�travel�behav-
ior,�mobility,�and�transportation�safety.