purchase or lease of all-purpose vehicle for … and methodology ..... 1 3. scope and...
TRANSCRIPT

For comments, suggestions or further inquiries please contact:
Philippine Institute for Development StudiesSurian sa mga Pag-aaral Pangkaunlaran ng Pilipinas
The PIDS Discussion Paper Seriesconstitutes studies that are preliminary andsubject to further revisions. They are be-ing circulated in a limited number of cop-ies only for purposes of soliciting com-ments and suggestions for further refine-ments. The studies under the Series areunedited and unreviewed.
The views and opinions expressedare those of the author(s) and do not neces-sarily reflect those of the Institute.
Not for quotation without permissionfrom the author(s) and the Institute.
The Research Information Staff, Philippine Institute for Development Studies5th Floor, NEDA sa Makati Building, 106 Amorsolo Street, Legaspi Village, Makati City, PhilippinesTel Nos: (63-2) 8942584 and 8935705; Fax No: (63-2) 8939589; E-mail: [email protected]
Or visit our website at http://www.pids.gov.ph
May 2014
DISCUSSION PAPER SERIES NO. 2014-26
Purchase or Lease of All-PurposeVehicle for Government Offices
Department of Budget and Management

DEPARTMENT OF BUDGET AND MANAGEMENT
Purchase or Lease of All-Purpose Vehicle for Government Offices
This article compares the costs and benefits for the government of leasing vis-a-vis outright purchase of motor vehicles. It presents two methods through which public managers can estimate and assess the value of procuring motor vehicles either under lease payment or direct purchase. Using data from selected government agencies, the net present values (NPV) generated suggest that outright purchase of low-end vehicles is preferable to leasing. For high-end end models, leasing offers a more practical option. The findings, however, are far from conclusive because assumptions regarding the variables and input data are subject to change. Results can be significantly improved with better and more accurate statistics. To gain sufficient understanding of the issue, factors other than those covered by the study, i.e. economies of scale and entry of commercial banks, must also be explored.

Table of Contents List of Tables ................................................................................................................................................ iv
1. Introduction .......................................................................................................................................... 1
2. Objectives and methodology ................................................................................................................ 1
3. Scope and Limitation............................................................................................................................. 2
4. Government motor vehicles: some basic statistics ............................................................................ 2
5. Government procurement policy ......................................................................................................... 5
5.1 General guidelines .............................................................................................................................. 5
5.2 Replacement / Disposal ...................................................................................................................... 6
5.3 Agency-specific guidelines .................................................................................................................. 7
5.3.1 Department of Interior and Local Government : Bureau of Jail Management and Penology
(BJMP) ................................................................................................................................................... 7
5.3.2 Department of Interior and Local Government : National Police Commission (NPC) ................. 8
5.3.3 Philippine Institute for Development Studies (PIDS) ................................................................... 8
5.3.4 Department of Health (DOH) ....................................................................................................... 8
5.3.5 Department of Foreign Affairs (DFA) ........................................................................................... 8
Box 1. Car Rental Industry: A brief overview ...................................................................................... 10
6. Leasing vs Direct Purchase : a conceptual review .............................................................................. 11
6.1 Technical aspects .......................................................................................................................... 12
6.2 Managerial aspects ....................................................................................................................... 12
6.3 Financial aspects ........................................................................................................................... 12
7. Leasing vs Direct Purchase : some country experiences .................................................................... 13
8. Data and Methodology ....................................................................................................................... 14
8.1 Model 1: ........................................................................................................................................ 14
8.2 Model 2: ........................................................................................................................................ 16
9. Data description .................................................................................................................................. 17
9.1 Case 1: Government Owned and Controlled Corporation (GOCC) ............................................... 17
9.2 Case 2: Government department 1 .............................................................................................. 17
9.3 Case 3: Government department 2 .............................................................................................. 17
10. Estimation of Net Present Values ................................................................................................... 20
11. Results ............................................................................................................................................. 21

iv
12. Summary and findings .................................................................................................................... 21
References .................................................................................................................................................. 31
List of Tables Table 1. Number of Registered Government-Owned Vehicles: 2000 to 2012 ............................................. 3
Table 2. Motor vehicle by mode of registration ........................................................................................... 3
Table 3. Philippine government procurement budget 2007-2011 (PhP ‘000).............................................. 4
Table 4. Capital outlays, 2011-2013 .............................................................................................................. 5
Table 5. Summary of selected government directives on motor vehicle procurement and disposal .......... 7
Table 6. Direct Purchase vs Lease: Advantages and Disadvantages ........................................................... 11
Table 7. Transport equipment procurement of GOCC (Case 1) .................................................................. 17
Table 8. Motor vehicle expenses, by type of vehicle: 2000-2011............................................................... 18
Table 9. Motor vehicle procurement of Government Agency 2 ................................................................. 19
Table 10. GOCC : Low-end motor vehicle ................................................................................................... 22
Table 11. GOCC : Mid-range/High-end motor vehicle ................................................................................ 23
Table 12. Government Agency 1 – Low end motor vehicle ........................................................................ 23
Table 13. Government Agency 1— Mid-range motor vehicle .................................................................... 24
Table 14. Government Agency 1 – High-end motor vehicle ....................................................................... 24
Table 15. Government Agency 2 – Low-end motor vehicle ........................................................................ 25
Table 16. Government Agency 2 – Mid-range motor vehicle ..................................................................... 25
Table 17. Government Agency 2 – High-end motor vehicle ....................................................................... 26
Annex 1. GSA Rental Rates .......................................................................................................................... 27
Annex 2 ....................................................................................................................................................... 29
Annex 3 ....................................................................................................................................................... 30

1
1. Introduction
Every year, the Philippine government spends billions of pesos of taxpayers’ money to purchase goods and services needed to perform its duties and deliver public services to its citizens. Included in this wide array of goods are motor vehicles that are used to provide public services directly or indirectly. Police patrol cars and ambulances, for instance, are used directly to maintain peace and order and to provide health services. Motor vehicles are likewise necessary in the general administration of government functions, which is an indirect form of public service. To expedite public service and support its general work requirements, government needs motor vehicles. The provision of government motor vehicles however, competes with other inputs and impinges upon government’s scarce resources. Notwithstanding the salaries and benefits of the required manpower and support staff, the government must also contend with various expenses directly associated with maintaining a government fleet. On top of the initial or full up-front costs, there are continuing maintenance costs as well as disposal costs that must be considered in motor vehicle acquisition. Given the current economic condition, government managers who are entrusted with public funds are under increasing pressure to deliver faster and better services while managing costs, particularly with regard to government offices’ capital outlay requirements. To contain expenditure growth in this area, the DBM has partnered with PIDS to look for a more economical and cost-effective approach to fleet acquisition and management, and leasing is one alternative being seriously considered. Unfortunately however, the Philippine government at present has no prescribed methodology to evaluate leasing and buying options for financing big-ticket items procured from private entities. Neither is there any relevant research that can be found regarding leasing versus buying vehicles by/in Philippine government offices.
2. Objectives and methodology
This study is being conducted to address this gap. It will determine if the long-term lease for government as one entity is the most cost-efficient as against direct purchase considering the huge costs to government, aside from the possibility that procurement may not have been well-managed. Using data from select government agencies, the paper will employ simple, straightforward cost-benefit analysis models (CBA) lifted from previous studies. The paper will examine the benefits for the government to either lease or purchase motor vehicles as demonstrated by the agency cases selected for the study. Moreover, given the changes in salvage value (depreciation) and the incremental costs, the paper will also describe and identify the corresponding costs between leasing and purchasing. In sum, the paper will have the following specific objectives:
1. To describe the existing systems, procedures in the procurement of all-purpose land motor vehicles of the government1
2. To determine the advantages and disadvantages of purchase vs lease of all-purpose land motor motor vehicles by analyzing the costs and benefits for each mode
1 It was agreed during the initial project meetings that the study will not assess the procurement process since
PIDS has no technical expertise to undertake a procedural analysis of the government procurement system

2
3. To review other country experiences of purchase or lease of all-purpose land motor vehicles by government
4. To generate policy recommendations as basis for decisionmaking by DBM
3. Scope and limitation
The study focuses only on all-purpose vehicles or those motor vehicles used indirectly in the provision of government services and/or used in the performance of general administration functions. Specialized vehicles like patrol cars, ambulances, fire trucks and military service trucks are not included. Aside from the difficulty of estimating their depreciation and future values, all too often, government motor vehicles with ‘specialized’ functions are obtained through the Philippine Charity Sweepstakes Office (PCSO), the Priority Development Assistance Fund (or pork barrel), or grants and donations from private individuals and international donors, and therefore beyond the purview of the current undertaking. Moreover, the unavailability of data on leasing or rental fees for these types of vehicles, which is required in performing CBA, makes it impossible to estimate the net present value (NPV) of specialized vehicles under lease agreement. The paper also refrains from using noneconomic input data in the generation of NPV and tries to abstain from using input variable costs dealing with personnel costs and/or benefits and related matters that are highly sensitive and difficult to quantify.
4. Government motor vehicles: Some basic statistics
As mentioned, the Philippine government uses motor vehicles in delivering services to the general populace. The total government fleet, including LGUs and government-owned corporations, is composed of 72,204 vehicles as of 2012. This is equivalent to about 1.0 percent of the total number of registered motor vehicles in the country. Table 1 presents data on motor vehicles from 2000 to 2012. Data show that government vehicles accounted for less than 2 percent of the total number of motor vehicles in the country from 2000 to 2012. While it may seem that the ratio of government vehicles to total registered vehicles is declining, a closer look at the absolute figures, however, reveals that government purchase of motor vehicles has remained relatively unchanged. From 6,623 new units in 2000, the purchase of new vehicles in 2012 totaled 6,456, supporting an earlier observation of a somewhat stable purchasing trend.

3
Table 1. Number of registered government-owned vehicles: 2000 to 2012
Ratio of
Government-
owned
Vehicles to
Total
Ratio of
Newly-
Owned to
Total
Government
Vehicles
(In %) (In %)
2000 3,701,173 66,468 6,623 1.8 10.0
2001 3,865,862 56,695 4,426 1.5 7.8
2002 4,187,673 58,142 3,749 1.4 6.4
2003 4,292,272 68,437 7,325 1.6 10.7
2004 4,760,593 74,356 6,820 1.6 9.2
2005 5,059,753 77,953 8,368 1.5 10.7
2006 5,331,574 75,803 6,200 1.4 8.2
2007 5,530,052 70,528 4,657 1.3 6.6
2008 5,891,272 73,307 6,553 1.2 8.9
2009 6,220,433 68,230 7,109 1.1 10.4
2010 6,634,855 65,060 5,956 1.0 9.2
2011 7,138,942 67,324 5,681 0.9 8.4
2012 7,463,393 72,204 6,456 1.0 8.9
Year
Total Motor
Vehicles
Govern
ment-
Owned
Vehicles
Newly-
Owned
Govern
ment
Vehicle
Sources: NSCB; LTO
Table 2. Motor vehicle by mode of registration
Mode of Registration 2009 2010 2011 2012 2010-11 GR 2011-12 GR Ave GR
Private NEW 900,245 1,082,992 1,229,197 1,241,436 13.5 1.0 7.25
RENEWAL 4,316,401 4,548,385 4,867,226 5,176,373 7.01 6.35 6.68
Sub-Total 5,216,646 5,631,377 6,096,423 6,417,809 8.26 5.27 6.76
Government NEW 7,109 5,956 5,681 6,456 -4.62 13.64 4.51
RENEWAL 61,121 59,104 61,643 65,748 4.3 6.66 5.48
Sub-Total 68,230 65,060 67,324 72,204 3.48 7.25 5.36
Diplomatic NEW 328 406 450 326 10.84 -27.56 -8.36
RENEWAL 3,574 3,185 3,147 2,734 -1.19 -13.12 -7.16
Sub-Total 3,902 3,591 3,597 3,060 0.17 -14.93 -7.38
For Hire NEW 33,538 38,955 42,531 41,270 9.18 -2.96 3.11
RENEWAL 897,510 895,221 928,415 928,514 3.71 0.01 1.86
Sub-Total 931,048 934,176 970,946 969,784 3.94 -0.12 1.91
Tax Exempt NEW 56 60 36 80 -40 122.22 41.11
RENEWAL 551 591 616 456 4.23 -25.97 -10.87
Sub-Total 607 651 652 536 0.15 -17.79 -8.82
TOTAL NEW 941,276 1,128,369 1,277,895 1,289,568 13.25 0.91 7.08
RENEWAL 5,279,157 5,506,486 5,861,047 6,173,825 6.44 5.34 5.89
GRAND TOTAL 6,220,433 6,634,855 7,138,942 7,463,393 7.6 4.54 6.07
Source: LTO
Table 2 shows motor vehicle statistics by mode of registration. The data under ‘renewal’ should give some indication of the total number of ‘serviceable’ government fleets, which has increased slightly in recent years. From only 66, 468 units in 2000, the government was able to accumulate some 72, 200 units of motor vehicles in 2012. The government acquired an average of 6,148 units a year between 2000 and 2012.

4
As a percentage share of the national procurement budget and total capital outlays, government purchase of transportation equipment for the years 2007 to 2011 ranges from 0.6 to 1.3 percent, and 1 to 2.1 percent, respectively. In the last two years however, this has gone up, accounting for 2.3 to 4.4 percent of the total capital outlays (Table 4). Add to that is the cost of operating and maintaining the fleet. Available general data on MOOE from DBM, however, do not specifically reflect or indicate the costs of repairing and maintaining transportation equipment (Table 3), which are likely to jack up over the years as the vehicles age and the warranties lapse. Table 3. Philippine government procurement budget 2007-2011 (PhP ‘000)
2007 2008 2009 2010 2011
Maintenance & Operating Expenses
Repair and Maintenance 23,465,563 24,988,621 21,771,084 25,021,782 27,763,401
Supplies and Materials 39,637,080 41,277,811 48,635,923 44,274,234 43,433,069
Utility Expenses 6,442,858 6,705,812 6,834,835 8,253,051 8,533,803
Training and Scholarship Expense 6,209,303 7,160,583 11,843,028 9,192,594 13,372,926
Professional Services 15,964,613 22,805,652 31,559,649 23,184,888 19,071,665
Printing and Binding Expenses 1,871,709 1,131,623 1,303,719 1,232,892 1,263,446
Advertising Expenses 609,565 891,073 960,280 827,372 1,062,623
Subscription Expenses 171,309 132,796 6,949,257 238,528 247,884
Subtotal (A) 94,372,000 105,093,971 129,857,775 112,225,341 114,748,817
Capital Outlay
Land and Land Improvement 12,127,661 5,525,203 11,723,151 5,440,485 6,161,027
Buildings and Structures 8,472,219 10,837,703 10,997,394 22,694,122 38,662,260
Office Equipment 4,944,178 5,583,390 9,309,847 7,357,548 6,833,778
Transportation Equipment 1,380,911 2,524,880 4,524,978 2,104,774 1,580,823
As a % share of Govt Procurement budget 0.602 0.902 1.316 0.676 0.513
As a % share of Total Capital Outlay 1.023 1.443 2.115 1.056 0.818
Machineries and Equipment 8,084,841 11,996,851 9,361,146 10,679,190 10,170,871
Public Infrastructure 99,936,131 138,463,865 168,035,648 151,048,823 129,923,265
Subtotal (B) 134,945,941 174,931,892 213,952,164 199,324,942 193,332,024
Total 229,317,941 280,025,863 343,809,939 311,550,283 308,080,841
Percent of National Government Budget 19.84% 21.30% 23.90% 20.00% 18.70%
Percent of Gross Domestic Product 3.45% 3.77% 4.47% 3.74% 3.40%
Source: Bombay (2011)

5
Table 4. Capital outlays, 2011-2013
2011 2012 2013
(Actual) (Adjusted) (Proposed)
Capital Outlays
Investment Outlay 12,202,592 3,223,917 8,448,995
Loans Outlay 379,796 21,385 2,010,000
Livestock and Crops Outlay 313,275 361,628 45,340
Land and Land Improvement Outlay 1,398,176 3,193,701 2,364,257
Building and Structures Outlay 16,872,915 30,706,449 23,153,543
Office Eqpt, Furniture and Fixtures 6,138,709 7,688,387 8,690,750
Work Animals Outlay 19,998 29 1,088
Transportation Eqpt 861,635 11,152,177 6,778,973
Machineries and Eqpt 6,440,338 13,332,600 13,825,865
Public Infrastructures 136,475,259 183,291,924 230,259,410
Reforestration Projects 1,144,535 1,522,291 3,123,612
Total Capital Outlays 182,247,228 254,494,488 298,701,833 Source: DBM Website
5. Government procurement policy
5.1 General guidelines
All procurement activities by government agencies, local government units, state universities and colleges, and state-owned enterprises are guided and governed by Republic Act 9184, otherwise known as the Philippine Government Procurement Reform Act (GPRA) of 2003. Widely considered a landmark legislation, the GPRA, which is anchored on the principles of transparency, accountability and competitiveness, consolidates and standardizes procurement rules and procedures for all government entities. It applies to procurement of goods and services, including infrastructure projects and consulting services, regardless of funding source. The GPRA covers activities from procurement planning, to the contract implementation stage, to termination of contract and warranty. Its distinguishing and perhaps most important feature is the establishment of the “Philippine Government Electronic Procurement System or PhilGEPS”, an electronic single portal for government procurement activities. Backed by state-of-the-art software, PhilGEPS serves as a primary source of information on government procurement, which is made available through its electronic bulletin board; registry of manufacturers, suppliers, distributors and consultants; and an electronic catalog of all current purchases and sales. Although the GPRA and PhilGEPS make procurement simpler and faster, it cannot account for the variations in the nature and procurement practices of government agencies. There is at the moment no single government entity responsible for all procurement functions. Procurement is decentralized, with each agency maintaining responsibility for and controlling its own procurement activities (Bombay 2011).

6
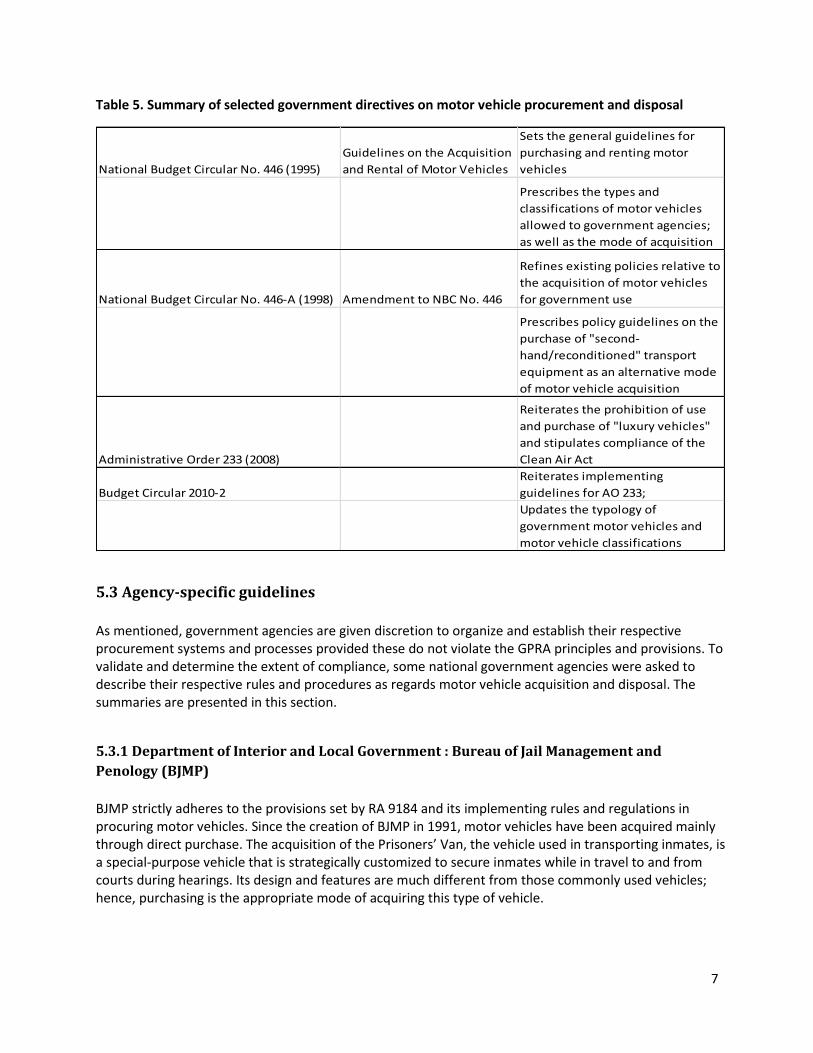
Section 6.2 of the revised IRR of the GPRA states that government agencies are given prerogatives to customize their procurement procedures to suit the agencies’ needs, peculiarity, nature, or complexity of procurement. These procedures however, must be harmonized and consistent with the GPRA rules, including those specific to motor vehicle acquisition. For motor vehicle acquisition and repair which fall under the “goods” category, the GPRA reiterates the general guidelines prescribed in the National Budget Circular No. 446 and 446-A issued in 1995 and 1998, respectively. Both circulars maintain that “acquisition of brand new units by outright purchase (paid for on a single, lump-sum basis) shall be adopted as a mode of motor vehicle acquisition.” NBC 466, in particular, restricts the continuous renting of motor transport equipment to not more than fifteen (15) days, except as may be authorized by the DBM Secretary. The types of motor vehicles that may be acquired are likewise limited to the classifications set and described by both circulars. Still in accordance with the above memoranda, Administrative Order (AO) 233 issued in 2008 which applies to all NGAs, SUCs and GOCCs, requires the consent and approval of agency heads, Secretary of DBM, and the Office of the President for the purchase of motor vehicles regardless of funding source. It also prohibits the use and acquisition of what the state considers as “luxury vehicles” and stipulates compliance with the Clean Air Act. AO233 provides a long list of what the government considers acceptable for official use and what it deems as “luxury vehicles” (Table _). For LGUs, Budget Circular 2010-2 allows local chief executives to approve and authorize the purchase of brand-new motor vehicles chargeable against local funds, provided these vehicles do not exceed the technical specifications prescribed by AO 233. Table 5 below lists down some of the government policies and circulars relevant to motor vehicle rental and acquisition.
5.2 Replacement/disposal
Also pursuant to NBC 446, government motor vehicles may be replaced under the following conditions: (1) for high official function vehicle, if the car is at least seven years old and has traveled at least 175,000 kms and (2) if the utility vehicle is at least five years old and has traveled at least 150,000 kms. Other conditions may also apply: if the vehicle is declared and certified unserviceable and/or if the average annual cost of recurring repair during the past two years is at least 30 percent of the current price of the same unit. Under the current setup, the disposal of motor vehicles must be appraised, approved and must have complied with Commission on Audit (COA) rules. The most common mode of disposal is through donation or transfer without cost to junk.
7
Table 5. Summary of selected government directives on motor vehicle procurement and disposal
National Budget Circular No. 446 (1995)
Guidelines on the Acquisition
and Rental of Motor Vehicles
Sets the general guidelines for
purchasing and renting motor
vehicles
Prescribes the types and
classifications of motor vehicles
allowed to government agencies;
as well as the mode of acquisition
National Budget Circular No. 446-A (1998) Amendment to NBC No. 446
Refines existing policies relative to
the acquisition of motor vehicles
for government use
Prescribes policy guidelines on the
purchase of "second-
hand/reconditioned" transport
equipment as an alternative mode
of motor vehicle acquisition
Administrative Order 233 (2008)
Reiterates the prohibition of use
and purchase of "luxury vehicles"
and stipulates compliance of the
Clean Air Act
Budget Circular 2010-2
Reiterates implementing
guidelines for AO 233;
Updates the typology of
government motor vehicles and
motor vehicle classifications
5.3 Agency-specific guidelines
As mentioned, government agencies are given discretion to organize and establish their respective procurement systems and processes provided these do not violate the GPRA principles and provisions. To validate and determine the extent of compliance, some national government agencies were asked to describe their respective rules and procedures as regards motor vehicle acquisition and disposal. The summaries are presented in this section.
5.3.1 Department of Interior and Local Government : Bureau of Jail Management and
Penology (BJMP)
BJMP strictly adheres to the provisions set by RA 9184 and its implementing rules and regulations in procuring motor vehicles. Since the creation of BJMP in 1991, motor vehicles have been acquired mainly through direct purchase. The acquisition of the Prisoners’ Van, the vehicle used in transporting inmates, is a special-purpose vehicle that is strategically customized to secure inmates while in travel to and from courts during hearings. Its design and features are much different from those commonly used vehicles; hence, purchasing is the appropriate mode of acquiring this type of vehicle.

8
5.3.2 Department of Interior and Local Government : National Police Commission (NPC)
NPC also adheres to RA 8194 and describes its procurement procedures as follows: (1) All reports and requests for motor vehicles of central and regional offices are consolidated by the General Services Division of the Personnel and Administrative Service (GSD-PAS) for inclusion in the NPC’s Capital Outlay program, which in turn is submitted to DBM for approval. Once approved, the Financial Service informs the head of agency and the BAC. The BAC convenes and discusses the technical aspects of the vehicles. A pre-bid conference is conducted, after which the BAC Secretariat prepares the required bid documents, including PhilGEPS postings. Then, bidding and subsequent activities proceed as set, with the whole process ending with the issuance of notice to proceed to the winning bidder from BAC, as prescribed by the law.
5.3.3 Philippine Institute for Development Studies (PIDS)
PIDS also follows the GPRA guidelines on procurement. The current motor pool, which consists of nine utility vehicles, were all obtained through direct purchase. The Institute also rents vehicles but always on a short-term basis, and only during special occasions, i.e. out-of-town team building activity, foreign visitors, etc. Old cars are disposed of either through donation or scrapped as junk as per COA guidelines.
5.3.4 Department of Health (DOH)
The Department of Health (DOH) has published two volumes of a procurement manual documenting the the procurement activities of different DOH offices and affiliates, and how these should be coordinated and modified to observe and follow the GPRA guidelines. The manual formally identified the procuring entity/ies for the whole organization, and also that of the central office. The agency’s current fleet, including the ambulances, were acquired mostly through direct purchase.
5.3.5 Department of Foreign Affairs (DFA)
DFA developed a refleeting program which was introduced in 2008. Following the basic guidelines set by GPRA, the refleeting program is directed more towards the department’s posts in foreign countries whose transport needs must incorporate the peculiarity that comes with working abroad. This was DFA’s deliberate attempt to respond and cater to the needs of DFA officials and diplomats. Under the program, motor vehicle units were standardized and for this time, the “Mercedez Benz E200 series” or its equivalent were issued to requesting units. These vehicles are acquired either through direct purchase or under lease arrangement depending on the assessment of the requesting consular office. Aside from economic considerations (i.e. economically advantageous to government), several other factors were considered in the acquisition of these transport equipment: usefulness in the posts’ performance of its mandate (i.e. use of diplomatic plate), security, ease of maintaining the vehicle, and possible resale value (if purchased). Plus, it must be presentable, a model befitting an Ambassador, a Diplomat or visiting foreign dignitaries. It is important to point out however, that these units are within the ‘High official function cars’ category of DBM Budget Circular 2010-2—the same circular that exempts the DFA from the government moratorium on the use and purchase of luxury vehicles. Meanwhile, for nonexecutive functions, the department maintains a a more conservative fleet.

9
To assist in the conduct of this study, DFA did a quick survey of its foreign posts and made requests for them to send data that may be relevant to the study. Out of 84 posts abroad, 59 responded with data on budget allocation and the purchase price of the acquired vehicle. A summary of the rapid appraisal conducted between car leasing and direct purchase using the above-mentioned factors as basis was likewise provided. In 34 foreign posts, purchasing motor vehicles were found to be more economical, while the other 18 posts show inclination towards leasing motor vehicles. It was also noted that in countries like Mexico, Brussels, Dubai and in some cities in the US, Philippine consular offices prefer and favor car rental over direct purchase presumably because it is cheaper and offers hassle-free registration for diplomatic plates. Meanwhile for those who hold office in Middle East and Asia Pacific countries (i.e. Bangkok, Tokyo, Abu Dhabi, etc), direct purchase is preferable than leasing. For the 18 foreign posts where the circumstances support the rental of vehicles, there is a pending request for DBM to approve the extension of the rental period to one year from 15 days. To date, in addition to its vehicles abroad, the DFA also maintains 28 service vehicles in its Manila headquarters, eight (8) of which are rented cars from CATS Philippines.

10
Box 1. Car rental industry: A brief overview
Although the leading car leasing company has been in the country since the early 1970s, data from the National Statistics Office (NSO) seem to suggest that car leasing is virtually non-existent in the Philippines. Industry statistics on car leasing in the country are almost negligible, with only a handful of reported players. As shown in the table below, the number of establishments engaged in renting and leasing motor vehicles in the country and other relevant data were ‘suppressed’. The NSO does this only in cases wherein there are very few establishments, to avoid disclosure of individual establishment data. A quick interview with NSO officials reveals that there are fewer than five car rental companies under 20 ATE and over, most of which are operating in urban areas, in particular the National Capital Region (NCR). Online data sources, however suggest several car rental companies operating in Metro Manila. But since these are likely to have an average total employment of less than 20 employees, they were not counted in the official statistics. Also excluded in the list are manufacturers engaged in car leasing as a secondary business activity, which remains undisclosed as of this writing. Interestingly, even car dealers are not too keen to join the government’s roster of suppliers. Even with a streamlined accreditation process, car dealers remain wary and elusive. As per the PSO Chief, dealers do not wish to be registered for fear of being monitored by the BIR.

11
6. Leasing vs direct purchase : A conceptual review
Except for the Department of Foreign Affairs, it would appear that government agencies in general have only one primary method of procuring motor vehicles, which is purchasing. This case is not unique to the Philippines. A notable exception perhaps is Michigan State in the US, which started leasing vehicles in 1995. Governments in many parts of the world simply do not lease vehicles, they purchase them (Christiansen 2010). This practice was predicated on the notion that government vehicles have longer life cycles and the “run it into the ground” approach was seen as the most cost-effective method for operating a fleet of vehicles. The government’s directive to purchase outright and pay lump-sum, as well as the minimum number of years required to replace a government fleet are a throwback to this long-held tradition. But over the years, given the dynamic business environment and rapidly changing demands, outright purchase of capital equipment such as motor vehicles may not always be the best option for the government. Considering the cost of repair and the hassle of disposing of old unserviceable cars, perhaps there is indeed a real value in seeking other alternatives. And leasing is one that offers a practical solution that will fund and operate a younger fleet. Table 6 below gives a general overview of the advantages and disadvantages of both leasing and purchasing options. Table 6. Direct purchase vs lease: Advantages and disadvantages
Advantages Disadvantages
Purchasing Rights of ownership Higher initial expense
More streamlined process* Less available liquidity
Tax benefits Obsolete equipment/car model
Leasing No upfront costs payment obligation for entire term
More available liquidity higher overall costs
Flexible payment options maintenance requirements
Easier to upgrade model
tax benefits
lower, fixed interest rate Generally defined as an agreement conveying the right to use a property, plant and equipment for a stated period of time in return for a series of stipulated cash payments, leasing has become quite popular in recent decades. Many companies in the US lease a significant portion of their assets and this is particularly true for equipment leasing. It was estimated that in the 1990s, about 80 percent of the corporations in the US lease assets, roughly equivalent to USD 100 billion in earnings a year. It would seem that increasingly, companies are signing up for the extra services that leasing companies provide. Car leasing has likewise become so pervasive, that one in every three cars in the US road is rented (Mollaghasemi 1995). Leasing, on one hand, as opposed to purchasing, generally does not require a huge initial investment, has lower interest costs, and has more flexible payment terms. Under a highly competitive market, banks are likely to offer lower lease payments and interest rates. Leasing arrangements also have provisions for asset upgrading and disposal (Department of Treasury and Finance Western Australia, 2005). In some cases like in an open-end lease contract, the lessee is responsible for the market value of the vehicles

12
when it is sold at the end of the lease. Hence, the lessee has to maintain the equipment to pre-defined specifications which may entail some cost on the part of the lessee. Direct purchase, on the other hand, gives government offices the right of ownership and with that, the discretion to maintain the equipment according to their guidelines. However, they have to contend with repair and maintenance costs, not to mention the manpower support which are likely to increase over the years. The basic aspects described above can also be organized into broad categories to summarize the major issues that must be considered in the buying-versus-leasing decision. These factors may be classified into technical, managerial, and financial aspects. The technical aspects refer to the technical requirements, whereas managerial aspects relate to managerial and administrative issues. The financial aspects relate to the funding and cost factors associated with lease negotiations. The succeeding section explains these aspects in detail: 2
6.1 Technical aspects
Although these are more applicable to technical equipment like computers and sensitive communication devices, there are also technical requirements in motor vehicle acquisition that government agencies must consider, such as design and performance specifications. DFA’s posts abroad can clearly relate to this view. If the objective and requirement is to have transport equipment with the latest and most reliable security features and establish a certain status, then perhaps leasing is more appropriate. Leasing, in this case, gives the lessee flexibility to swap and replace vehicles to accommodate changing security and design requirements as time passes and technology changes.
6.2 Managerial aspects
Leasing requires less administrative and managerial effort on the part of the government, hence the managerial aspect of leasing is definitely an important factor to consider. The overhead management cost is lowered since the number of personnel assigned will be smaller.
6.3 Financial aspects
The timing of costs and benefits to the cash flow is an important factor in lease-versus-buy decisions. Purchasing requires one-time payment, whereas leasing involves a series of small periodic costs, whose aggregate amount may be bigger than the one-time cost of purchase decision. Here, how the government values the time difference and opportunity cost of money, i.e. discount rate, is critical in calculating the total present value costs of the lease stream and buy stream. Determining the appropriate discount rate is one of the most contentious issues in lease-versus-buy analyses.
2

13
7. Leasing vs direct purchase : Some country experiences
While the literature is replete with studies on the procurement practices of the private sector, procurement in the public sector receives significantly less focus. As a result, a significant knowledge gap exists and there is relatively little information on the purchasing function, as practiced by public entities (Wang and Bunn 2004; Schiele and McCue 2006; Bryntse 1996; Murray 1999, 2001, as cited in Scott 2011). Acknowledging the wide disparity in the nature and organizational goals of government and the private sector, Scott (2011) insists their respective procurement objectives and practices would differ just as much. Hence, although useful, many of the findings on lease-versus-buy decisions currently available may not relate well to government setup. The few available studies on lease-versus-buy decisions are limited to developed economies, particularly the US, and these are mostly studies conducted for the US Military (Kim 1990; Kim 2002). For instance, the issue of leasing versus buying of the US Air Force’s general purpose vehicles has been documented in several studies. The US Department of Defense has been struggling with this issue as early as the 1940s after the World War II, when the department was faced with a huge demand for new vehicles which resulted in the establishment of the General Services Administration (GSA). GSA was created in 1949 to build up stocks and supplies for wartime, and manage and dispose of war surplus goods3. Kim (2002) asserts the GSA has played a very important role in the procurement and management of the US government fleet, and provided motivation for the US Air Force to conduct studies on leasing versus buying in the US military. Most of these graduate papers according to Kim (2002) identified vehicle procurement as the most cost-effective option between commercial leasing and GSA leasing and ownership. The GSA leasing option exists only in the United States and there is currently no single statutory authority anywhere in the world which would allow the ownership of all general-purpose vehicles to be transferred to the commercial sector. Despite a handful of studies on lease-versus-purchase analysis in the US Air Force, it has yet to come up with a definitive approach to acquiring general purpose vehicles. Kim (2002) further maintains that available literature is split, with leasing advocates insisting that the act will lead to rationalization of fleet size and induce significant reduction in the amount of resources required to maintain an ageing fleet. Other studies note that the flexibility and the sense of ownership that comes with directly purchasing motor vehicles help reduce performance uncertainty and boost employee morale. They associated the leasing of equipment and facilities with labor downsizing within the military. A recent study by Lebo and Scott (2009) however, provides a “middle ground” as it argued for a “hybrid” approach to motor vehicle acquisition within the US Marine Corps (USMC). Using a simple cost-benefit analysis, the paper examined the overall benefits for the USMC to either purchase or lease alternative fuel-vehicles (AFV). Lebo and Scott (2009) estimated a net savings of USD 823,000 for the USMC if it decides to purchase vice lease these vehicles. More savings however will be realized if USMC adopts a “hybrid” approach, or a combination of lease and purchase for its fleet. From USD 823,000, overall savings will increase to roughly USD 1.7 million if the USMC purchases compact sedans and pickup trucks, and leases minivans. Based on these findings, the study concludes that a “one-size-fits-all” policy may not necessarily be the optimal solution for the USMC.
3

14
Kim (2002) came out with a different verdict. Looking at the procurement of sedans in the Korean Air Force, Kim (2002) found that ownership or outright purchase of general-purpose vehicles is the better alternative to leasing. It was shown that in the case of KAF, having direct ownership of these sedans is almost three times more cost-beneficial than leasing. It was also proven to be less costly.
8. Data and methodology
Most studies involving lease-vs-buy decisions utilized the Cost Benefit Analysis or Net Present Value method. It has also been used extensively in the lease-or-buy decisions studies in the US military. The concept of NPV has been widely accepted as basis for determining the most desirable investment alternatives in finance literature (Johnson and Lewellyn, 1972). NPV allows for the systematic and quantitative evaluation and comparison of the life cycle costs and benefits of buying to other alternative ways of acquiring vehicles. Included in a typical CBA analysis are the economic and financial costs and benefits of both alternatives. From the time of acquisition to the disposal of the vehicles, many components of tangible and intangible benefits of leasing versus buying are weighed and quantified in money terms, which are then compared with a cost analysis through discounted cash flow. Each year’s net cash are discounted to take into account the time value of money. This discounting gives the present value of each of the amounts. When comparing leasing and purchasing options, the peso value of future expenditures (or income in the case of salvage value) in a lease or purchase agreement, must be converted to their present value in pesos to compare the real costs of each option (Lebbo and Scott 2009). Using the data from three government agencies—a government-owned and controlled corporation (GOCC) and two government deparments, two methodologies were considered. The first was developed by Johnson and Lewellen (1972) and the second was lifted from the graduate paper of Lebo and Scott (2009). These methodologies were chosen on the basis of their simplicity and their applicability to the Philippine case, taking into consideration the quality of available data.
8.1 Model 1:
The first methodology takes off from a study done by Johnson and Lewellen published in the Journal of Finance in 1972. Simple and straightforward, the model measures only quantifiable economic factors and disregards non-tangible items such as “pride of ownership” which is highly subjective and difficult to measure. The model also reckons that leasing is a “long-term acquisition-of-services arrangement which differs in time profile but not in financing impact from purchase”, hence borrowing issues and other forms of financing should not even be remotely considered in the estimation. Interestingly, based on the illustrative example given, the model allows for the computation of net present value (NPV) for one single asset, which suits data-constrained cases like the Philippines. Under this method, a positive figure for ∆ NPV would imply that outright purchase is economically superior to leasing. The model is mathematically described as follows4:
4 Some of these common terms will cancel out and assumptions were made for the input variables that are left to
form part of the final equation

15
Where: A = Cash purchase price of the asset in question;
n = Useful economic life of the asset (years); Assumption : Under existing government rules, motor vehicles subject for replacement must be at least seven years old. Taking note of this directive, the economic life span of motor vehicles for this purpose is assumed to be 10 years.
B = Anticipated book value of the asset at the end of its useful life; book value represents the value of an asset as reflected in the balance sheet, less its accumulated depreciation
S = Expected cash salvage value of the asset at the end of its life; the salvage or residual value is the estimated value of asset at the end of its useful life. Assumption: For this case, the government mandated salvage value, which is equivalent to 10 percent of the purchase price, is assumed.
Di = Depreciation charge for the year i if the asset is owned; Li = Lease payment (before taxes) required in year i if the asset is leased ; Assumption: There are two (2) sources of lease data used in this study: (1) for
motor vehicles acquired and used abroad, the GSA rental rates for 2014 were used as basis5; and (2) for those obtained and utilized domestically, average rental rates from websites of domestic car rental companies and other online sources were employed. Car leasing rates are likely to vary per country, but for purposes of consistency and uniformity, the GSA rates were used as benchmark. In cases where lease data for identified units are not available, rental rates for comparable models are used.
t = Corporate ordinary income tax rate; Assumption: In this case, the government imposed corporate income tax rate of
50 percent is observed. tg = Tax rate applicable to gains and losses on the disposal of fixed assets (may be
equal to t); Assumption: Proceeds from sale of an asset are taxed as ordinary income of a corporation. Irrespective of purpose, the disposal of fixed assets in the Philippines is subject to a corporate gains tax of 7.5%, which is also applied in this study.
Ri = Total cash revenues expected from the use of the asset in year i ; Ci = Total pre-tax cash costs for labor, materials, etc., expected to be required to
operate the asset in year i if it is purchased by the firm; Oi = Pre-tax cash operating costs that are expected to be borne in year i by the firm if it
purchases the asset, but not if the asset is leased; these might include certain
5 It would have been preferable to use GSA Rental rates corresponding to the acquisition years of motor vehicles as
reported in the available government data, but these are not accessible from the GSA website.

16
items of maintenance, insurance, property taxes, etc., depending upon the terms of the lease contract, or might be zero if the case of a “pure” financial lease. In either event Oi denotes the year- i additional operating cost, if any, of owning, and therefore the difference Ci - Oi represents the year- i total cash operating cost of leasing; Assumption: Under a government setup, the standard operating costs for maintaining a motor pool includes salaries of support staff, i.e. drivers and administrative clerks. The assumed operating cost of PhP356,000 already incorporates the estimated annual maintenance cost (PhP 100,000) and the highest annual personnel service cost earmarked for a driver position in the government.
k = after-tax cost of capital for the firm; Assumption: 12 percent r = after-tax interest rate on the firm’s borrowings; Assumption: 4 percent
Here, the NPV of an anticipated asset is the sum of the present value of its net after-tax cash operating profits, plus the discounted after-tax cash proceeds from salvage, minus the asset cost. Similarly, the NPV under lease arrangement is represented by the NPV of the after-tax cash operating profits, less the after-tax present value of the lease payments. Since there are several terms common to both flows, algebraically, the equations can be transformed into a reduced form, where:
8.2 Model 2:
For the second methodology, the following equations from Lebbo and Scott (2009) were adopted with slight modification to suit available data. The proposed method is applicable only to data with longer, continuous time trend and for only one type of vehicle, i.e. government purchase of sedans from 2004-2011. Here, NPV is calculated as follows:
Net Present Value (NPV) of Total Annual Cost of Inventory (Purchase) = Annual Cost of Inventory (lease) x Discount Rate Factor NPV of Total Annual Cost of Inventory (Purchase) = Annual Cost of Inventory (purchase) x Discount Rate Factor – Total Average Salvage Value* Total Average Salvage Value Per Year = Number of Vehicles Acquired x (Purchase Price per Vehicle + Incremental or Operating cost per vehicle) x (0.10*Purchase price)
The preferred alternative is the one with highest NPV. It is important to mention however, that the model did not undergo peer review, hence this should cause analysts to view the whole procedure with caution.

17
9. Data description
This section describes the data used in the calculation of NPV. As mentioned, the data generated came from three government offices: one government-owned and controlled corporation (GOCC) and two line agencies.
9.1 Case 1: Government-owned and controlled corporation (GOCC)
Case 1 refers to a government-owned and controlled corporation (GOCC), the Philippine Institute for Development Studies (PIDS), which has a total of nine vehicles in its current pool. The oldest, both Toyota Corolla GLi models, were purchased in 1996, while the two most recent purchases, Isuzu Wagon-Crosswind units, were acquired in 2012. The Institute’s administration department estimated that the total maintenance costs for all nine vehicles averaged PhP100,000 yearly. Table 7 below is an inventory with unit and acquisition details of all the motor vehicles acquired by PIDS from 1996 to 2012. Table 7. Transport equipment procurement of GOCC (Case 1)
INVENTORY REPORT AS OF DECEMBER 27, 2012
Government Owned and Controlled Corporation
MOTOR VEHICLES
PROPERTY ACQUISITION ACQUISITION
NUMBER DATE COST
A522A Toyota Corolla GLi with Plate No. SEG 587 6/11/1996 500,500.00
A522B Toyota Corolla GLI with Plate No. SEG 577 6/11/1996 500,500.00
A621 Honda Civic Lxi M/T with Plate No. SEW 925 3/12/1998 447,000.00
A622 Nissan Vanette Grand Coach with Plate No.SEV 500 9/28/1998 609,500.00
A694 New Toyota Revo SRJ Series 1.8 L M/T, Gas SGH-667 6/21/2002 750,000.00
A1056 Toyota Innova E Diesel MT Plate No. SJA 382 3/12/2008 828,500.00
A1094 Nissan Escapade Plate No. SHV 117 7/1/2008 927,678.58
A1179a 2013 Isuzu Wagon, Crosswind Series, Model XT 2.5L Diesel (Rich Red) Plate No. SKV 791 12/17/2012 945,000.00
A1179b2013 Isuzu Wagon, Crosswind Series, Model XT 2.5L Diesel (Midnight Blue) Plate No. SKV
78112/17/2012 945,000.00
Grand Total 6,453,678.58
DESCRIPTION
9.2 Case 2: Government department 1
The second case refers to a government institution involved in the delivery of primary government services. Although some of its functions have already been devolved, the department still carries out critical tasks and has retained its supervisory role in many of the devolved offices. The agency’s transport equipment purchases include motor vehicles with highly specialized features. However, for this purpose, only general-purpose motor vehicles were covered. From 2000-2013, the agency’s central office in Manila was able to accumulate a total of 73 units of transport equipment. Most are SUVs and AUVs, and only three are ambulances. Car leasing is very rare and only on a short-term basis.
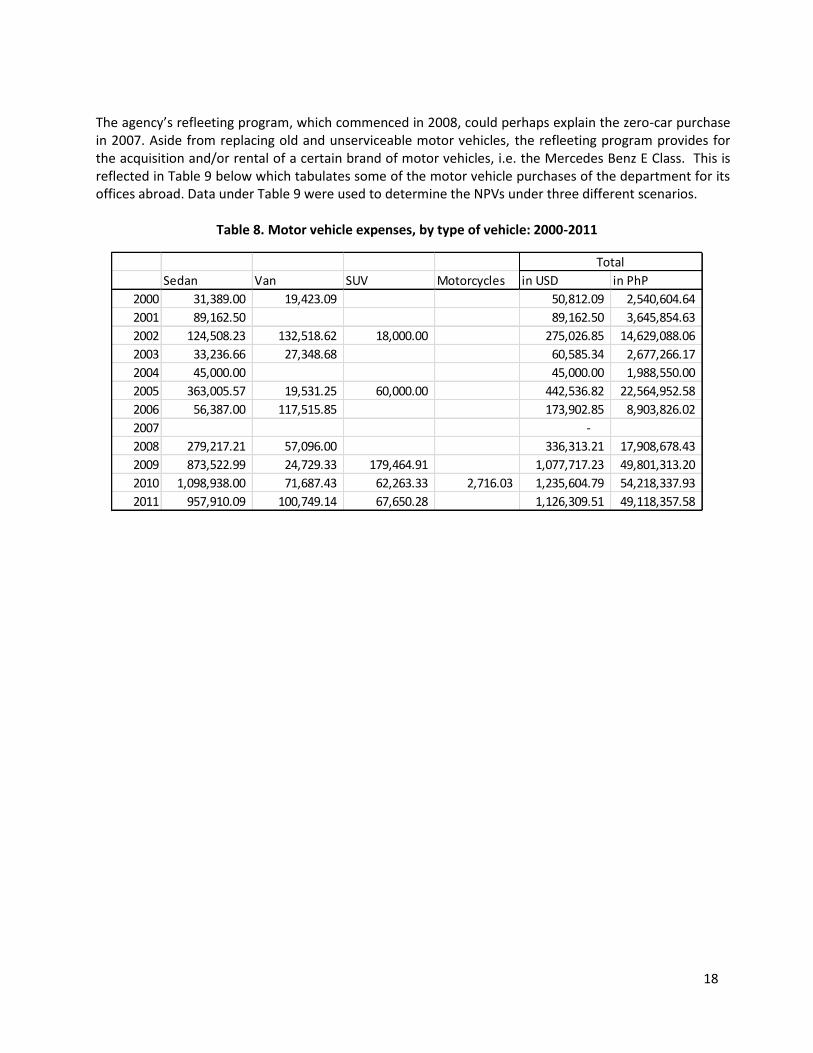
9.3 Case 3: Government department 2
For Case 3, the data used came from a government agency with satellite offices abroad. It is one of the very few government agencies that regularly rents motor vehicles and currently, has set up a refleeting program for its posts overseas. Table 8 below shows the motor vehicle procurement expenses of the agency from 2000 to 2011 by type of vehicle.
18
The agency’s refleeting program, which commenced in 2008, could perhaps explain the zero-car purchase in 2007. Aside from replacing old and unserviceable motor vehicles, the refleeting program provides for the acquisition and/or rental of a certain brand of motor vehicles, i.e. the Mercedes Benz E Class. This is reflected in Table 9 below which tabulates some of the motor vehicle purchases of the department for its offices abroad. Data under Table 9 were used to determine the NPVs under three different scenarios.
Table 8. Motor vehicle expenses, by type of vehicle: 2000-2011
Sedan Van SUV Motorcycles in USD in PhP
2000 31,389.00 19,423.09 50,812.09 2,540,604.64
2001 89,162.50 89,162.50 3,645,854.63
2002 124,508.23 132,518.62 18,000.00 275,026.85 14,629,088.06
2003 33,236.66 27,348.68 60,585.34 2,677,266.17
2004 45,000.00 45,000.00 1,988,550.00
2005 363,005.57 19,531.25 60,000.00 442,536.82 22,564,952.58
2006 56,387.00 117,515.85 173,902.85 8,903,826.02
2007 -
2008 279,217.21 57,096.00 336,313.21 17,908,678.43
2009 873,522.99 24,729.33 179,464.91 1,077,717.23 49,801,313.20
2010 1,098,938.00 71,687.43 62,263.33 2,716.03 1,235,604.79 54,218,337.93
2011 957,910.09 100,749.14 67,650.28 1,126,309.51 49,118,357.58
Total

19
Table 9. Motor vehicle procurement of Government Agency 2
Mode of
Post Qty Description Manufacturer/Model Acquisition Year Amount Condition Remarks
A. Embassies
Athens, Greece 1 Motorcycle Honda 125CC Purchase 2009 Good Under Car Refleeting Program (FY 2008)
1 Sedan Mercedes Benz E280 Purchase 2008 $ 58,158.64 Good Under regular repair and maintenance
1 Sedan Mercedes Benz E240 Purchase 1998 $ 38,645.89 Poor Unservicable and for disposal
Bangkok,
Thailand 1 Motorcycle Honda 125CC Purchase 2010 Bht 38,095.23 Good Under regular repair and maintenance
1 Sedan Mercedes Benz 300S Purchase 2009 $ Good Under Car Refleeting Program (FY 2008)
1 Van Toyota Hi-Ace D3.0 Purchase 2002 23,090.24 Serviceable Under regular repair and maintenance
1 Sedan Mercedes Benz E230 Purchase 1995 DM 58,368.00 Serviceable Under regular repair and maintenance
1 Sedan Mitsubishi Galant Purchase 1987 12,083.33 Poor Unservicable and for disposal
Beijing, PRC 1 Sedan Mercedes Benz E230 Purchase 2009 $ 38,775.00 Good Under Car Refleeting Program (FY 2008)
1 Van Toyota Hi-Ace Donation 2006 Poor Unservicable and for disposal
1 Sedan Toyota Camry Donation 2002 Serviceable Under regular repair and maintenance
1 Sedan Mercedes Benz 220E Purchase 1993 46,463.00 Poor Unservicable and for disposal
Budapest,
Hungary 1 Van Kia Carins 2.0 Purchase 2009 $ 24,729.33 Good Under Car Refleeting Program (FY 2008)
1 Saloon BMW 520i 2002 Purchase 2002 24,020.62 Serviceable Under regular repair and maintenance
1 Van Mercedes Benz V230 Purchase 1999 34,914.24 Serviceable Under regular repair and maintenance
Buenos Aires,
Argentina 1 Sedan Mercedes Benz E280 Purchase 2009 $ 45,426.00 Good Under Car Refleeting Program (FY 2008)
1 Sedan Mercedes Benz E220 Purchase 1998 31,630.00 Poor Unservicable and for disposal
Doha, Qatar 1 Sedan BMW 523i 2006 Donation 2009 Good Under regular repair and maintenance
The Hague,
Netherlands 1 Sedan Mercedes Benz E240 Purchase 2004 41,215.00 Serviceable Under regular repair and maintenance
Ottawa, Canada 1 Sedan Mercedes Benz Purchase 1999 $ 50,325.00 Poor Under regular repair and maintenance
Riyadh, Saudi
Arabia 1 SUV Toyota Prado Purchase 2010 $ 29,413.33 Excellent Under Car Refleeting Program (FY 2008)
1 Van Toyota Previa Lease Purchase 2007 30,572.80 Good Under regular repair and maintenance
1 Sedan Mercedes Benz 350L Lease Purchase 2005 $ 85,171.20 Good Under regular repair and maintenance
1 Van Toyota Previa Trade-in 1996 1,333.00 Poor Unservicable and for disposal
Tel Aviv, Israel 1 Sedan Mercedes Benz S350 2005 Lease Purchase 2005 $ 90,056.76 Fair Under regular repair and maintenance
1 Van Toyota Hi-Ace Lease Purchase 2008 57,096.00 Good Under regular repair and maintenance
Vientienne, Laos 1 Sedan Mercedes Benz E230 Purchase 2009 $ 46,500.00 Good Under Car Refleeting Program (FY 2008)
1 Motorcycle KOLAO 125CC Lease Purchase 2006 744.00 Good Under regular repair and maintenance
Amman, Jordan 1 Sedan Mercedes Benz Purchase 2009 $ 39,375.00 Good Under Car Refleeting Program (FY 2008)
1 Van Toyota Hi-Lux Donation 2003 Serviceable Under regular repair and maintenance
Oslo, Norway 1 Sedan Mercedes Benz E220 Lease Purchase 2008 $ 49,107.14 Good Under regular repair and maintenance
Lisbon, Portugal 1 Sedan Mercedes Benz E250 CDI Purchase 2010 $ 54,881.44 Excellent Under regular repair and maintenance
Warsaw, Poland 1 Sedan Mercedes Benz E250 Purchase 2010 $ 64,443.54 Excellent Under regular repair and maintenance
Acquisition

20
B. Consulates
Honolulu, Hawaii
USA 1 Sedan Lincoln Town Car Lease Purchase 2002 $ 39,395.00 Serviceable Under regular repair and maintenance
Jeddah, Saudi
Arabia 1 Sedan Mercedes Benz E300 Purchase 2010 € 40,480.00 Excellent Under Car Refleeting Program (FY 2008)
1 SUV Toyota Prado GX Diesel Lease Purchase 2009 32,653.75 Serviceable Under regular repair and maintenance
1 Van GMC Savana - 2006 Donation 2006 61,333.33 Good Under regular repair and maintenance
1 Sedan Mercedes Benz S350L Lease Purchase 2005 82,929.60 Serviceable Under regular repair and maintenance
1 Sedan Lincoln Town Car Purchase 1996 40,691.49 Poor Unservicable and for disposal
1 SUV Mitsubishi Pajero Purchase 1995 30,851.06 Poor Unservicable and for disposal
1 SUV GMC Suburban Donation 1995 38,829.79 Poor Unservicable and for disposal
Osaka, Japan 1 Sedan Mercedes Benz E350 Purchase 2010 $ 68,328.65 Excellent Under Car Refleeting Program (FY 2008)
1 Sedan Toyota Crown Royal Saloon Donation Good Under regular repair and maintenance
1 Van Toyota Hi-Ace Donation Good Under regular repair and maintenance
Milan, Italy 1 Sedan Mercedes Benz E260 Purchase 2009 $ 43,500.00 Good Under Car Refleeting Program (FY 2008)
1 Van Volkswagen Caravelle Purchase 2001 21,851.00 Serviceable Under regular repair and maintenance
1 Sedan Mercedes Benz E220 Purchase 1997 35,309.00 Poor Unservicable and for disposal
New York City,
USA 1 Sedan Mercedes Benz E350 Purchase 2011 $ 67,348.38 Excellent Under Car Refleeting Program (FY 2008)
1 Sedan Cadillac DTS 2007 Lease Purchase 2010 33,122.50 Good Under regular repair and maintenance
Xiamen, PRC 1 Van Golden Dragon Donation 2007 Good Under regular repair and maintenance
1 Sedan Toyota Camry 2003 Donation 2003 Serviceable Under regular repair and maintenance
1 Sedan Toyota Camry 2005 Purchase 1995 $ 20,077.72 Poor Unservicable and for disposal
C. Missions
New York, USA 1 Sedan Mercedes Benz E350 Purchase 2010 $ 58,644.00 Excellent Under Car Refleeting Program (FY 2008)
1 Sedan Lincoln Town Car Lease Purchase 2005 48,185.00 Serviceable Under regular repair and maintenance
10. Estimation of Net Present Values
Using the available data from these government offices, and the assumptions described above, the net present values under lease and direct purchase were estimated applying the prescribed methodologies. Whenever possible, the estimates were done for three different types of motor vehicles per agency: low-end, mid-range and high-end. The classifications were based on the purchase price of motor vehicles acquired by the agencies from 2008-2012. Vehicle data from each agency were sorted according to acquisition cost, from lowest to highest, with the least expensive and most expensive units as proxies for low-end and high-end vehicles respectively. Likewise, as earlier stated, data for Agency 2 referred to motor vehicles purchased or rented abroad, and the reported acquisition costs were converted to Philippine currency using the applicable average US Dollar-Philippine Peso exchange rate (average annual exchange rate for the year of purchase). The succeeding tables below summarize the relevant flows and calculations called for by Johnson and Lewellen’s model. Note that the assumptions used were all based on prevailing government and market rates. Car rental rates for domestic cars or those used within the country were taken from the published rates posted on the websites of various car rental companies. For motor vehicles purchased and used abroad, the GSA rates for 2014 (Annex 1) were used as basis in lieu of real-time, country-specific data. Meanwhile, since most of the data obtained were patchy and inconsistent, the NPV estimate using Methodology 2 was applied only to the case of Government Agency 2 and only for its purchase of Mercedes Benz E-Class units (sedan) between 2008-2011. An average inflation of 3.0 percent was discounted from the GSA monthly rate of USD 356 to estimate monthly car rental rates for 2010 and

21
earlier years. Additionally, whenever appropriate, the assumptions made under Methodology 1 were applied.
11. Results
Case 1: GOCC Data obtained from the selected GOCC permitted the calculation of NPV for only two types of motor vehicles: low-end and mid/high-end. Tables 10 and 11 below show positive NPV for both types of vehicles. Case 2: Government Department 1 For Government Department 1, the reported net present values favor direct purchase over leasing. This is true for all types of cars, from low-end AUVs to luxury cars which include SUVs like Toyota Fortuner (Tables 12-14). One plausible explanation for the positive NPV is the high cost of renting motor vehicles in the country. Another reason could be the anticipated economic life of a government motor vehicle, which is at least seven to 10 years. Case 3: Government Department 2 The estimates generated using available data from Government Department 2 under Methodology 1 reveal negative NPVs, which suggest that leasing motor vehicles is more economically advantageous than purchasing. The results may be attributed to the low rental rates abroad and also the high purchase costs of the transport equipment acquired, which fall under the “high-end” category (Tables 15-17). Similarly, NPV estimate under Methodology 2 ( Annex 3) generated a negative result, which also suggests that abroad, leasing of cars is favorable over direct purchase. Evaluating all the variables applied in this model, salvage value appears to be a very strong determinant in support of leasing. This is consistent with the result obtained by Lebo and Scott (2009), where it was argued that without sufficient values, leasing would always turn out to be the most desirable option (Lebo and Scott 2009).
12. Summary and findings
Based on the calculations presented, it appears that for domestic vehicles, outright purchase would be more beneficial than leasing, regardless of technical specifications. The positive net present values obtained will ensue if (1) the net salvage value of the assets exceeds the extra operating costs of owning, or (2) the purchase price, less depreciation tax savings, is less than the burden of the lease payments (Johnson and Lewellyn, 1972). The latter appears to be truer in this case as accumulated cost of renting in the country has been shown to be much higher than cost of owning a vehicle. Meanwhile, for superior and more expensive models, like the Mercedez Benz E350, leasing offers a more favorable option. The operating costs associated with such units far outweigh the cost of periodic leases. It is probable that in areas where there are significant players and car-renting is highly competitive, leasing is an attractive and perhaps the best alternative especially for offices with overseas operations. If the GSA rates are of any indication, it seems that international car rates are much lower than the reported domestic car rental rates. Likewise, salvage values, especially in relation to superior car models, can

22
significantly impact the decision to lease. Perhaps this is because these models can easily meet market demand for resale. It is also important to mention that several important factors not covered by the study can significantly affect the estimation and sign of NPVs. For instance, bulk purchases and economies of scale and the entry of commercial banks in car leasing and/or car-ownership trade can have substantial impact in the lease-versus-buy decisions of firms. Any of these circumstances can either lower car costs and make motor vehicles more affordable or create low-cost lease opportunities (Johnson and Lewellyn, 1972). This paper introduced two types of models, through which an attempt to establish the cost and benefits of leasing and purchasing motor vehicles was made. The findings however are far from conclusive because the assumptions regarding the variables and choice of input data are subject to change and interpretation. Hence, the results presented here can be significantly improved with the availability of longer and more accurate statistics, especially with respect to car rental rates and operating costs. Moreover, examining factors other than those considered by the study can provide sufficient understanding of the issues and present good topics for further research. Table 10. GOCC : Low-end motor vehicle
Toyota Innova E Diesel MT Plate No. SJA 382
Assumptions:
Economic Life (N) = 10
eqpt cost (date purchased: 2008)= 828,500
lease pymnt (annual)= 480,000 1400 42,000.00
salvage cost (10% of purchase price) 82,850 17,510.0 70,040.0
Annual Operating cost 356,000
Corp inc tax 0.5
Capital gains rate 0.075
Overall cost of capital 0.12
Discount rate/borrowing cost (int
rate) 0.08
aftr tax rate 0.04
ILLUSTRATIVE CALCULATION USING GOCC DATA
Tax Savings After-tax Added Salvage Value After-Tax
Present
Value of (1)
Present
Value of (4)
on Depreciation Operatings Costs Net of Taxes
Lease
Payment
minus (2)
plus (3), at 4%
Year, i tDi Oi (1-t) S-tg (S-B) Li (1-t) at 12 %
(1) (2) (3) (4)
1 75,318.18 178,000 240,000.0 (91,680) 230,769
2 67,786.36 178,000 240,000.0 (87,862) 221,893
3 60,254.55 178,000 240,000.0 (83,809) 213,359
4 52,722.73 178,000 240,000.0 (79,616) 205,153
5 45,190.91 178,000 240,000.0 (75,359) 197,263
6 37,659.09 178,000 240,000.0 (71,101) 189,675
7 30,127.27 178,000 240,000.0 (66,890) 182,380
8 22,595.45 178,000 240,000.0 (62,765) 175,366
9 15,063.64 178,000 240,000.0 (58,756) 168,621
10 7,531.82 178,000 76,636.3 240,000.0 (30,211) 162,135
(708,050) 1,946,615
∆NPV = NPV (P) - NPV (L)
∆NPV = 410,065
Conclusion: Purchasing is better than leasing

23
Table 11. GOCC : Mid-range/High-end motor vehicle
2013 Isuzu Wagon, Crosswind Series, Model XT 2.5L Diesel (Midnight Blue)
Assumptions:
Economic Life (N) = 10
eqpt cost (date purchased: 2013)= 945,000
lease pymnt (annual)= 725,760 60480 Toyota Previa
salvage cost (10% of purchase price) 94,500
Annual Operating cost 356,000
Corp inc tax 0.5
Capital gains rate 0.075
Overall cost of capital 0.12
borrowing cost (int rate) 0.08
aftr tax rate 0.04
ILLUSTRATIVE CALCULATION USING GOCC DATA
Tax Savings After-tax Added Salvage Value After-Tax
Present
Value of (1)
Present
Value of (4)
on Depreciation Operatings Costs Net of Taxes Lease Payment
minus (2)
plus (3), at 4%
Year, i tDi Oi (1-t) S-tg (S-B) Li (1-t) at 12 %
(1) (2) (3) (4)
1 85,909.09 178,000 362,880.0 (82,224) 348,923
2 77,318.18 178,000 362,880.0 (80,263) 335,503
3 68,727.27 178,000 362,880.0 (77,778) 322,599
4 60,136.36 178,000 362,880.0 (74,904) 310,191
5 51,545.45 178,000 362,880.0 (71,754) 298,261
6 42,954.55 178,000 362,880.0 (68,418) 286,789
7 34,363.64 178,000 362,880.0 (64,974) 275,759
8 25,772.73 178,000 362,880.0 (61,482) 265,153
9 17,181.82 178,000 362,880.0 (57,993) 254,955
10 8,590.91 178,000 87,412.5 362,880.0 (26,401) 245,149
(666,191) 2,943,282
∆NPV = NPV (P) - NPV (L)
∆NPV = 1,332,091
Conclusion: Purchasing is better than leasing
Table 12. Government Agency 1 – Low end motor vehicle
Mitsubishi Adventure GLX DSL
Assumptions:
Economic Life (N) = 10
eqpt cost (date purchased: 2009?)= 879,600 50000 Hyundai Trajet 7 seater
lease pymnt (annual)= 600,000 1400 42,000.00
salvage cost (10% of purchase price) 87,960 17,510.0 70,040.0
Annual Operating cost 356,000
Corp inc tax 0.5
Capital gains rate 0.075
Overall cost of capital 0.12
borrowing cost (int rate) 0.08
aftr tax rate 0.04
ILLUSTRATIVE CALCULATION
Tax Savings
After-tax
Added Salvage Value After-Tax
Present
Value of (1)
Present
Value of (4)
on Depreciation
Operatings
Costs Net of Taxes
Lease
Payment
minus (2)
plus (3), at 4%
Year, i tDi Oi (1-t) S-tg (S-B) Li (1-t) at 12 %
(1) (2) (3) (4)
1 79,963.64 178,000 300,000.0 (87,532) 288,462
2 71,967.27 178,000 300,000.0 (84,529) 277,367
3 63,970.91 178,000 300,000.0 (81,164) 266,699
4 55,974.55 178,000 300,000.0 (77,549) 256,441
5 47,978.18 178,000 300,000.0 (73,778) 246,578
6 39,981.82 178,000 300,000.0 (69,924) 237,094
7 31,985.45 178,000 300,000.0 (66,050) 227,975
8 23,989.09 178,000 300,000.0 (62,202) 219,207
9 15,992.73 178,000 300,000.0 (58,421) 210,776
10 7,996.36 178,000 81,363.0 300,000.0 (28,540) 202,669
(689,690) 2,433,269
∆NPV = NPV (P) - NPV (L)
∆NPV = 863,979
Conclusion: Purchasing is better than leasing

24
Table 13. Government Agency 1— Mid-range motor vehicle
Isuzu Crosswind XT (AUV)
Assumptions:
Economic Life (N) = 10 60480 Toyota Previa
eqpt cost (date purchased: 2009)= 925,000 92123 (Toyota Fortuner)
lease pymnt (annual)= 725,760 1400 42,000.00
salvage cost (10% of purchase price) 92,500 17,510.0 70,040.0
Annual Operating cost 356,000
Corp inc tax 0.5
Capital gains rate 0.075
Overall cost of capital 0.12
borrowing cost (int rate) 0.08
aftr tax rate 0.04
ILLUSTRATIVE CALCULATION
Tax Savings After-tax Added Salvage Value After-Tax
Present Value
of (1)
Present
Value of (4)
on
Depreciation Operatings Costs Net of Taxes
Lease
Payment
minus (2) plus
(3), at 4%
Year, i tDi Oi (1-t) S-tg (S-B) Li (1-t) at 12 %
(1) (2) (3) (4)
1 84,090.91 178,000 362,880.0 (83,847) 348,923
2 75,681.82 178,000 362,880.0 (81,567) 335,503
3 67,272.73 178,000 362,880.0 (78,813) 322,599
4 58,863.64 178,000 362,880.0 (75,713) 310,191
5 50,454.55 178,000 362,880.0 (72,373) 298,261
6 42,045.45 178,000 362,880.0 (68,879) 286,789
7 33,636.36 178,000 362,880.0 (65,303) 275,759
8 25,227.27 178,000 362,880.0 (61,702) 265,153
9 16,818.18 178,000 362,880.0 (58,124) 254,955
10 8,409.09 178,000 85,562.5 362,880.0 (27,055) 245,149
(673,377) 2,943,282
∆NPV = NPV (P) - NPV (L)
∆NPV = 1,344,905
Conclusion: Purchasing is better than leasing
Table 14. Government Agency 1 – High-end motor vehicle
Isuzu 090 Altera 4x2 Wagon (SUV)
Assumptions:
Economic Life (N) = 10
eqpt cost (date purchased: 2009)= 1,567,000 87360 Nissan Patrol
lease pymnt (annual)= 1,048,320 1400 42,000.00
salvage cost (10% of purchase price) 156,700 17,510.0 70,040.0
Annual Operating cost 356,000
Corp inc tax 0.5
Capital gains rate 0.075
Overall cost of capital 0.12
borrowing cost (int rate) 0.08
aftr tax rate 0.04
ILLUSTRATIVE CALCULATION
Tax Savings
After-tax
Added
Salvage
Value After-Tax
Present Value
of (1)
Present
Value of (4)
on
Depreciation
Operatings
Costs Net of Taxes
Lease
Payment
minus (2) plus
(3), at 4%
Year, i tDi Oi (1-t) S-tg (S-B) Li (1-t) at 12 %
(1) (2) (3) (4)
1 142,454.55 178,000 524,160.0 (31,737) 504,000
2 128,209.09 178,000 524,160.0 (39,693) 484,615
3 113,963.64 178,000 524,160.0 (45,580) 465,976
4 99,718.18 178,000 524,160.0 (49,750) 448,054
5 85,472.73 178,000 524,160.0 (52,502) 430,821
6 71,227.27 178,000 524,160.0 (54,094) 414,251
7 56,981.82 178,000 524,160.0 (54,742) 398,319
8 42,736.36 178,000 524,160.0 (54,631) 382,999
9 28,490.91 178,000 524,160.0 (53,914) 368,268
10 14,245.45 178,000 144,947.5 524,160.0 (6,055) 354,104
(442,699) 4,251,407
∆NPV = NPV (P) - NPV (L)
∆NPV = 2,241,708
Conclusion: Purchasing is better than leasing

25
Table 15. Government Agency 2 – Low-end motor vehicle
Kia Carins 2.0 - Van (purchased: 2009) $24,729.33
Assumptions:
Economic Life (N) = 10
eqpt cost (date purchased: 2009)= 1,162,279 68,328.7 USD
annual lease pymnt = (GSA:$260) 146,640.00 48000 yen/12 hrs 222 USD
salvage cost (10% of purchase price) 116,228
Annual Operating cost 356,000
Corp inc tax 0.5
Capital gains rate 0.075
Overall cost of capital 0.12
borrowing cost (int rate) 0.08
aftr tax rate 0.04
ILLUSTRATIVE CALCULATION
Tax Savings
After-tax
Added Salvage Value After-Tax
Present Value
of (1)
Present
Value of (4)
on Depreciation
Operatings
Costs Net of Taxes
Lease
Payment
minus (2) plus
(3), at 4%
Year, i tDi Oi (1-t) S-tg (S-B) Li (1-t) at 12 %
(1) (2) (3) (4)
1 105,661.68 178,000 73,320.00 (64,588) 70,500
2 95,095.51 178,000 73,320.00 (66,091) 67,788
3 84,529.35 178,000 73,320.00 (66,531) 65,181
4 73,963.18 178,000 73,320.00 (66,117) 62,674
5 63,397.01 178,000 73,320.00 (65,029) 60,264
6 52,830.84 178,000 73,320.00 (63,415) 57,946
7 42,264.67 178,000 73,320.00 (61,400) 55,717
8 31,698.50 178,000 73,320.00 (59,089) 53,574
9 21,132.34 178,000 73,320.00 (56,568) 51,514
10 10,566.17 178,000 107,510.76 73,320.00 (19,294) 49,532
(588,120) 594,691
∆NPV = NPV (P) - NPV (L)
∆NPV = (356,328-945,000-89036) = (1,155,708)
Conclusion: Leasing is better than purchasing
Table 16. Government Agency 2 – Mid-range motor vehicle
Toyota Prado GX Diesel (2009) $32,653.75
Assumptions:
Economic Life (N) = 10
eqpt cost (date purchased: 2009)= 1,534,726 68,328.7 USD
annual lease pymnt = $276* x 12 (GSA rate) 155,664 48000 yen/12 hrs
salvage cost (10% of purchase price) 153,473
Annual Operating cost 356,000
Corp inc tax 0.5
Capital gains rate 0.075
Overall cost of capital 0.12
borrowing cost (int rate) 0.08
aftr tax rate 0.04
ILLUSTRATIVE CALCULATION
Tax Savings
After-tax
Added
Salvage
Value After-Tax
Present Value
of (1)
Present
Value of (4)
on Depreciation
Operatings
Costs Net of Taxes
Lease
Payment
minus (2) plus
(3), at 4%
Year, i tDi Oi (1-t) S-tg (S-B) Li (1-t) at 12 %
(1) (2) (3) (4)
1 139,520.57 178,000 77,832.00 (34,357) 74,838
2 125,568.51 178,000 77,832.00 (41,798) 71,960
3 111,616.45 178,000 77,832.00 (47,250) 69,192
4 97,664.40 178,000 77,832.00 (51,055) 66,531
5 83,712.34 178,000 77,832.00 (53,501) 63,972
6 69,760.28 178,000 77,832.00 (54,838) 61,512
7 55,808.23 178,000 77,832.00 (55,273) 59,146
8 41,856.17 178,000 77,832.00 (54,986) 56,871
9 27,904.11 178,000 77,832.00 (54,126) 54,684
10 13,952.06 178,000 141,962.18 77,832.00 (7,111) 52,581
(454,296) 631,287
∆NPV = NPV (P) - NPV (L)
∆NPV = (356,328-945,000-89036) = (1,357,735)
Conclusion: Leasing is better than purchasing

26
Table 17. Government Agency 2 – High-end motor vehicle
Mercedes Benz E350 (Purchased in 2010) $68,328.65
Assumptions:
Economic Life (N) = 10
eqpt cost (date purchased: 2010)= 3,082,305 68,328.7 USD
annual lease pymnt = $376* x 12 (GSA rate) 203,536 48000 yen/12 hrs
salvage cost (10% of purchase price) 308,231
Annual Operating cost 356,000
Corp inc tax 0.5
Capital gains rate 0.075
Overall cost of capital 0.12
borrowing cost (int rate) 0.08
aftr tax rate 0.04
ILLUSTRATIVE CALCULATION
Tax Savings
After-tax
Added
Salvage
Value After-Tax
Present Value
of (1)
Present Value
of (4)
on Depreciation
Operatings
Costs Net of Taxes Lease Payment
minus (2) plus
(3), at 4%
Year, i tDi Oi (1-t) S-tg (S-B) Li (1-t) at 12 %
(1) (2) (3) (4)
1 280,209.58 178,000 101,768.16 91,259 97,854
2 252,188.62 178,000 101,768.16 59,143 94,090
3 224,167.67 178,000 101,768.16 32,861 90,472
4 196,146.71 178,000 101,768.16 11,533 86,992
5 168,125.75 178,000 101,768.16 (5,603) 83,646
6 140,104.79 178,000 101,768.16 (19,199) 80,429
7 112,083.83 178,000 101,768.16 (29,817) 77,335
8 84,062.87 178,000 101,768.16 (37,940) 74,361
9 56,041.92 178,000 101,768.16 (43,979) 71,501
10 28,020.96 178,000 285,113.25 101,768.16 43,510 68,751
101,767 825,431
∆NPV = NPV (P) - NPV (L)
∆NPV = (356,328-945,000-89036) = (2,155,108)
Conclusion: Leasing is better than purchasing

27
Annex 1. GSA Rental Rates
Equip. Federal 2014 Monthly 2014 Mileage
Vehicle Description Code Std. Item Rate Rate
PASSENGER VEHICLES
Sedan, Midsize 1100 10B 260.00$ 0.180$
Sedan, Midsize, Special Services 1125 17Z 308.00$ 0.200$
Sedan, Midsize, Special Services 1126 17, 17F 350.00$ 0.200$
Sedan, Midsize, Special Services, Charger 1127 17R 373.00$ 0.200$
Sedan, Compact 1200 9C, 9Z 171.00$ 0.150$
Sedan, Compact (Hybrid) 1203 9H 171.00$ 0.110$
Sedan, Compact (Hybrid - Full Replacement) 1204 9H 341.00$ 0.110$
Sedan, Compact 1263 9D 231.00$ 0.160$
Sedan, Subcompact 1300 8C, 8Z, 6 160.00$ 0.135$
Sedan, Subcompact (Hybrid) 1301 8H 160.00$ 0.105$
Sedan/Station Wagon Subcompact (Electric) 1305 8E 171.00$ 0.059$
Sedan/Station Wagon Subcompact (Electric) 1307 8P 171.00$ 0.075$
Sedan, Subcompact (CNG) 1330 8N 160.00$ 0.135$
Sedan, Microcompact 1358 7, 7Z 204.00$ 0.136$
Sedan, Large, Special Services 1426 17R 376.00$ 0.240$
Motorcycle (Electric) 1700 2E 187.00$ -$
Motorcycle (Electric) 1701 2E 256.00$ -$
Station Wagon, Subcompact 2000 12Z 189.00$ 0.145$
Station Wagon, Subcompact 2100 13Z 242.00$ 0.160$

28
LIGHT TRUCKS, LESS THAN 12,500 GVWR, 2-WHEEL DRIVE (4X2)
Equip. Federal 2014 Monthly 2014 Mileage
Vehicle Description Code Std. Item Rate Rate
Minivan 4x2, Cargo (Electric) 4109 30E 204.00$ 0.077$
Van, Cargo 4110 30 204.00$ 0.195$
Van, Passenger 4115 20, 20C 214.00$ 0.195$
Compact Pickup, Regular Cab 4120 60 192.00$ 0.185$
Compact Pickup, Extended Cab 4121 61C 197.00$ 0.185$
Compact Pickup, Crew Cab 4122 61E 200.00$ 0.185$
Standard Pickup, Regular Cab 4150 41, 41Z 197.00$ 0.185$
4X2 SUV, Compact 4174 98A 231.00$ 0.165$
Sport Utility, 4-Door (Hybrid) 4175 98H, 100 188.00$ 0.150$
Sport Utility 4181 91 277.00$ 0.210$
SUV, Crossover, 4-door 4182 91B 277.00$ 0.210$
Sports Utility, 4-door 4194 98 188.00$ 0.185$
Van, Cargo 4210 31, 31Z 222.00$ 0.230$
Van, Passenger 4215 21 230.00$ 0.230$
Sport Utility, Special Services 4221 100L 310.00$ 0.255$
Standard Pickup, Regular Cab 4250 41, 42Z 200.00$ 0.240$
Standard Pickup, Extended Cab 4251 41C 206.00$ 0.240$
Standard Pickup, Crew Cab 4252 50, 50Z 225.00$ 0.240$
Standard Pickup, Crew Cab (Hybrid) 4254 50H 225.00$ 0.200$
Standard Pickup, Crew Cab, Special Services 4255 50C 259.00$ 0.250$
Standard Pickup, Full Size, Crew Cab 4259 51 230.00$ 0.240$
4x2 SUV, 4-door, Special Services* 4272 101C 296.00$ 0.250$
Sport Utility, 4-Door 4275 100B, 100C 287.00$ 0.240$
Sport Utility, 4-Door 4276 101 301.00$ 0.240$
Sport Utility, 4-Door 4279 100A 267.00$ 0.240$
Van, Cargo 4310 32, 32Z, 34, 34N, 75E 252.00$ 0.230$
Van, Maint. Conversion 4313 162 252.00$ 0.230$
Van, Passenger 4315 22, 24 260.00$ 0.230$
Pickup, Regular Cab 4350 44, 44A, 44B 238.00$ 0.250$
Pickup, Extended Cab 4351 44C, 44D, 44E 244.00$ 0.250$
Pickup, Crew Cab 4352 51C, 52, 54 258.00$ 0.250$
Service Utility 4355 82, 83, 84 258.00$ 0.260$
Service Utility, Crew Cab 4356 141, 142, 144 301.00$ 0.260$
Service Utility, Extended Cab 4357 82C, 83C, 84C 276.00$ 0.260$
4X2 Pickup, Crew Cab 4360 52A 265.00$ 0.260$
Van, Cargo 4364 95, 95E, 95Z 276.00$ 0.220$
Delivery Van, Cut-off Cab 4365 92, 94 297.00$ 0.285$
Multistop Van (FC) Truck 4366 131, 134 297.00$ 0.285$
Cargo Van, Cutaway, CNG 4368 94N 492.00$ 0.285$
Chassis & Regular Cab 4370 73, 74, 74A 258.00$ 0.260$
Chassis & Crew Cab 4371 73E, 73F, 74E 274.00$ 0.260$
Chassis & Extended Cab 4372 73C, 73D, 74C 269.00$ 0.260$
4x2 Flightline Van (Ford E350) 4374 92F 276.00$ 0.230$
Sport Utility, 4-Door 4375 102, 102C 301.00$ 0.250$
Chassis & Cutaway Cab 4376 75, 75A, 75D, 75F 196.00$ 0.260$
Stake, Regular Cab 4380 122, 123, 124 258.00$ 0.260$
Stake, Crew Cab 4381 122E, 123E, 124E 287.00$ 0.260$
Stake, Extended Cab 4382 122C, 123C, 124C 274.00$ 0.260$
Dump Truck 4390 154, 154Q 258.00$ 0.260$

29
Annex 2
Low end High end Low end Mid-range High end High end Low end Mid-range High end
Car type/model
Toyota Innova E
Diesel MT Plate
No. SJA 382
2013 Isuzu Wagon,
Crosswind Series,
Model XT 2.5L
Diesel (Midnight
Blue)
Mitsubishi
Adventure GLX
DSL
Isuzu Crosswind
XT (AUV)
Isuzu 090 Altera
4x2 Wagon
(SUV)
Toyota Fortuner
4x4 DSL A/T
(SUV) Kia Carins 2.0 - Van
Toyota Prado GX
Diesel
Mercedes Benz
E350
Date purchased 2008 2013 2009? 2009 2009 2012 2009 2009 2010
Purchase price in USD $24,729.33 $32,653.75 $68,328.65
Assumptions:
Economic Life (N) = 10 10 10 10 10 10 10 10 10
Eqpt cost or purchase price (in PhP)= 828,500 945,000 879,600 925,000 1,567,000 1,895,000 1,162,279 1,534,726 3,082,305
Lease payment (annual)*= 480,000 725,760 600,000 725,760 1,048,320 1,128,960 146,640 155,664 203,536
Salvage cost (10% of purchase price) 82,850 94,500 87,960 92,500 156,700 189,500 116,228 153,473 308,231
Annual Operating cost 10,000 10,000 10,000 10,000 10,000 10,000 10,000 10,000 10,000
Corp inc tax 0.5 0.5 0.5 0.5 0.5 0.5 0.5 0.5 0.5
Capital gains rate 0.32 0.32 0.32 0.32 0.32 0.32 0.32 0.32 0.32
Overall cost of capital 0.12 0.12 0.12 0.12 0.12 0.12 0.12 0.12 0.12
borrowing cost (int rate) 0.08 0.08 0.08 0.08 0.08 0.08 0.08 0.08 0.08
aftr tax rate 0.04 0.04 0.04 0.04 0.04 0.04 0.04 0.04 0.04
*from online sources
*rental for Toyota
Previa
*rental for
Hyundai Trajet 7
seater
*rental for
Toyota Previa
*rental for
Nissan Patrol
*rental for
Toyota Fortuner *GSA rate: $260/mo *GSA: $276/mo *GSA: $376/mo
(60,480/month) (50k/month) (60,480/month) (87,360/month) (92,123/month) 1 USD: 47 PhP 1 USD: 47 PhP 1 USD: 45.11 PhP
1,381,017.61 2,302,125.23 1,834,529 2,315,097 3,206,835 3,321,133 (186,639.20) (391,364.14) (1,199,948.53)
∆NPV = 410,064.52 1,332,091.13 863,979 1,344,905 2,241,708 2,358,593 (1,155,707.78) (1,357,734.56) (2,155,107.67)
CONCLUSION Purchase Purchase Purchase Purchase Purchase Purchase Lease Lease Lease
Case 1: GOCC Case 3: Government Agency 2Case 2: Government Agency 1
METHODOLOGY 1

30
Annex 3
METHODOLOGY 2: COMPACT SEDAN BASELINE CALCULATIONS
UNDER LEASE
2008 2 2 $343.17 $4,118 0.120 1.00000 $8,236 $8,236
2009 5 7 $353.78 $4,245 0.120 0.89286 $29,717 $26,533
2010 5 12 $364.72 $4,377 0.120 0.79719 $52,519.68 $41,868
2011 1 13 $376.00 $4,512 0.120 0.71178 $58,656.00 $41,750
TOTAL $149,129 $118,388
UNDER PURCHASE Assumption:
PHP 356,000.00
2008 2 2 53,632.89 $8,005 30,818.7 1.00000 661,159,010.61 123,274.92 ($661,035,736)
2009 5 7 42,715.20 $7,473 62,735.4 0.89286 1,071,902,730.33 250,941.76 ($1,071,678,675)
2010 5 12 55,424.15 $7,892 79,145.0 0.79719 1,754,618,332.05 316,580.11 ($1,754,365,956)
2011 1 13 67,348.38 $8,219 18,891.9 0.71178 508,935,559.94 75,567.60 ($508,881,772)
TOTAL 766,364.39 ($3,995,962,140)
Average Salvage
Value
Avg Salvage
value per
year
Discount
Rate Factor
Annual Cost of
Inventory
NPV of Total Cost of
InventoryFY
Vehicles
Acquired
Total
Inventory
Avg Purchase
Price Per
Vehicle
Annual
Maintenance
cost per Vehicle
FY
Vehicles
Acquired
Total
Inventory
Monthly Lease
Rate per
Vehicle*
Inflation
Adjusted Yearly
Lease Rate per
Vehicle
Annual Cost of
Inventory
NPV of Total Annual
Cost of Inventory
4 yr
Capitalization
Rate
Discount
Rate Factor

31
References
Bombay, Nide Marie (2011). “Philippines: Case study on the Philippine Government Electronic
Procurement System (PhilGEPS)”. Asian Development Bank Technical Assistance Consultant’s Report.
June 2011.
Christensen, J. (2010). “Leasing, Not Just for Private Sector Fleets”. Government Fleet website.
http://www.government-fleet.com/fc_resources/gf0510-16-leasing.pdf (accessed: March 31, 2013)
Department of Budget and Management. http://www.dbm.gov.ph/
Hensley, C. and Tinjum, A. (2008) “Lease vs. Purchase in Defense Acquisition”. US Naval Postgradiate
School, Monterey, California. MA Thesis, December 2008.
Johnson, R. and Lewellen, W. (1972). “Analysis of the Lease-or-Buy Decision”. Journal of Finance, Vol.27,
No.4 (Sep., 1972), pp 815-823.
Kim, Il Joong (1990). “Lease versus Buy Decision Methodology for the Korean Army: A Proposal”. US
Naval Postgradiate School, Monterey, California. MA Thesis, March 1990.
Kim, Jung Jin (2002). “Comparative Analysis of Leasing versus Buying General Purpose Vehicle (Sedan) in the Korean Airforce”. Air Force Institute of Technology Graduate School of Engineering and Management, Ohio. MA Thesis, March 2002 Land Transportation Office. http://www.lto.gov.ph/index.php/publication/statistical-reports
Lebo, S. and Scott, R. (2009). “Lease vs Purchase Analysis of Alternative Fuel Vehicles in the United
States Marine Corps”. US Naval Postgradiate School, Monterey, California. MA Thesis, December 2009.
Mollaghasemi, Mansooreh, Pet-Edwards, Julia, and Gupta, Uma. “A multiple criteria buy versus lease analysis for government contracts”, IEEE transactions on engineering management, 42: 278-285 (August 1995)
National Statistical and Coordination Board. http://www.nscb.gov.ph/
National Statistical Office. http://www.census.gov.ph/
Scott, M.A. (2011). “Developing input to ‘best-value’ vehicle procurement practice: An analysis of
supplier evaluation and selection in the US public transportation industry”. Dissertation.
Wang, S. and Bunn, M.D. (2004). “Government/Business Relationships: Insights Into Contract
Implementation”. Journal of Public Procurement, 84 (1), 2004.