purchase price allocation and impairment testing
TRANSCRIPT

Purchase Price Allocation and Impairment Testing
-A straight application of standards?
Redmo, Nathalie and Wallgren, Emma
The Master Program of Accounting and Financial Management STOCKHOLM SCHOOL OF ECONOMICS
2011
Supervisor Tomas Hjelström,
Assistant Professor Department of Accounting

1
We would like to express our most
cordial thanks to our supervisor, mentor
and friend, Tomas Hjelström. Thanks to
his endless engagement and joyful
inspiration, the process of writing this
thesis has not only been educative, but
also an adventure!

2
Abstract The importance of goodwill and intangible assets has amplified over the years as both their
presence in the standards and their values in the financial reports have increased. How the
purchase price allocation (PPA) and the subsequent impairment testing process are made is of
great importance as different choices have different consequences on for example the financial
reports and key ratios.
The purpose of this thesis is to explore and identify practices and forces affecting the
implementation of IFRS 3 with respect to the allocation of the consideration transferred and the
subsequent impairment tests. In order to fulfill the aim of this thesis, a quantitative and a
qualitative study have been made. In the quantitative study, general tendencies in how firms
allocate the consideration transferred between the major asset groups in the PPA and how often
impairments are done have been investigated. The qualitative study has been based on a
Swedish group where four specific acquisitions have been studied.
The study of the case group revealed seven aspects that have a major impact in the reasoning
process of the group when doing a PPA and the subsequent impairment testing. It was
concluded that the expectations of impairments were low, that the case group had a partial lack
of formal control in some areas and that the informal control within these areas not was strong
enough to counterbalance the partial lack of formal control. Furthermore, practicality,
materiality, internal incentives and external pressure were concluded to influence the PPA and
the impairment testing. As the comparison of the case group to the quantitative sample gave no
sign of the case group being an extreme outlier, the findings and conclusions made in the
qualitative study can be suggested as possible also for other companies.
Concluding, even though standards often are considered as the determinants of accounting, it
has been shown that company culture, management control systems and external influences
also might be of great importance in the reasoning when performing a PPA after an acquisition
and in the subsequent impairment testing.
3
Table of content Abstract ........................................................................................................................................................................................... 2
Abbreviations............................................................................................................................................................................... 5
1. Introduction ....................................................................................................................................................................... 6
1.1 Background ...................................................................................................................................................................... 6
1.2 Purpose .............................................................................................................................................................................. 7
1.3 Structure ............................................................................................................................................................................ 7
2. Theoretical framework ................................................................................................................................................. 8
2.1 Current standards in the context of business combinations.................................................................. 8
2.1.1 Accounting for a business combination ................................................................................................... 8
2.1.2 Accounting subsequent to the acquisition .............................................................................................. 9
2.1.3 Disclosures ........................................................................................................................................................... 10
2.2 Difficulties in allocating the consideration transferred and the subsequent impairment
testing ...................................................................................................................................................................................... 11
2.3 The concept of goodwill ......................................................................................................................................... 12
2.4 Consequences of the allocation of the consideration transferred and the subsequent
impairment testing ........................................................................................................................................................... 13
2.4.1 Direct consequences........................................................................................................................................ 13
2.4.2 Indirect consequences .................................................................................................................................... 14
2.5 Data on firm practice ............................................................................................................................................... 15
2.5.1 Allocation of the consideration transferred ........................................................................................ 15
2.5.2 Subsequent impairment testing ................................................................................................................ 16
2.6 Creative accounting .................................................................................................................................................. 16
3. Method ............................................................................................................................................................................... 19
3.1 Quantitative method ................................................................................................................................................ 19
3.1.1 Compilation of data .......................................................................................................................................... 20
3.2 Qualitative method.................................................................................................................................................... 20
4. Quantitative study ........................................................................................................................................................ 22
4.1 Results ............................................................................................................................................................................. 22
4.1.1 Allocation of the consideration transferred ........................................................................................ 22
4.1.2 Subsequent impairment testing and amortization.......................................................................... 22
4.2 Discussion ...................................................................................................................................................................... 24
5. Qualitative Study ........................................................................................................................................................... 26
5.1 Results ............................................................................................................................................................................. 26
5.1.1 Case Description ................................................................................................................................................ 26
5.1.2 General responsibilities and guidelines of the group .................................................................... 26

4
5.1.3 Acquisition descriptions................................................................................................................................ 34
5.1.4 Allocation of the consideration transferred ........................................................................................ 36
5.1.5 Impairment testing, depreciation and amortization of goodwill and assets revalued in
the PPA ............................................................................................................................................................................... 41
5.1.6 The group WACC ............................................................................................................................................... 44
5.1.7 Disclosures in the Annual Reports of the PPA process and the impairment testing ..... 46
5.1.8 The reflection of the characteristics of the acquisitions in the accounting ........................ 46
5.2 Discussion ...................................................................................................................................................................... 47
5.2.1 Expectations of impairments ...................................................................................................................... 47
5.2.2 Applications of guidelines and formal control................................................................................... 49
5.2.3 Areas of discussion and informal control ............................................................................................. 50
5.2.4 Applications of practicality .......................................................................................................................... 51
5.2.5 Requirements of materiality ....................................................................................................................... 53
5.2.6 Consequences of external interest ........................................................................................................... 54
5.2.7 Consequences of internal interest............................................................................................................ 56
5.2.8 The case group in relation to the quantitative study ..................................................................... 58
6. Conclusions ...................................................................................................................................................................... 60
7. Reliability .......................................................................................................................................................................... 61
8. Validity ............................................................................................................................................................................... 62
9. Final remarks .................................................................................................................................................................. 63
10. References ................................................................................................................................................................... 64
10.1 Literature .................................................................................................................................................................... 64
10.2 Standards .................................................................................................................................................................... 66
10.2.1 Guidance to interpretation ........................................................................................................................ 66
10.3 Interviews ................................................................................................................................................................... 66
10.3.1 At the case group ............................................................................................................................................ 66
10.4 Databases .................................................................................................................................................................... 67
Appendix
Quantitative Study: Table of Acquisitions
Quantitative Study: Table of Impairments and Amortizations

5
Abbreviations BA (A,B,C) Business Area (A,B,C) C(1,2,3,4pf) CAPM CGU DCF
Company (1,2,3,4pf) Capital Asset Pricing Model Cash Generating Unit Discounted Cash Flow (model)
DTL EBIT FCF HQ
Deferred Tax Liability Earnings Before Interest and Taxes Free Cash Flow Head Quarter
IA IAS
Intangible Assets International Accounting Standards
IFRS International Financial Reporting Standards M&A PGM PPA
Mergers and Acquisitions Purchased Goodwill Method Purchase Price Allocation
RIV ROCE WACC
Residual Income Valuation Return On Capital Employed Weighted Average Cost of Capital

6
1. Introduction
1.1 Background The importance of goodwill, the value in an acquisition that cannot be attributable to separable
assets and liabilities, and intangible assets, identifiable assets without physical form, have
amplified over the years. This is both due to the fact that these assets’ presence in the standards
has increased and due to an amplification of their values in the balance sheets (Gauffin and
Nilsson, 2010). According to a Swedish report by Ernst & Young (2009), these assets constitute
a large part of the acquired enterprise value after an acquisition; the average value between
2006 and 2009 was 77 percent (50.5 percent goodwill and 26.5 percent intangible assets).
When an acquisition has been made, an allocation of the consideration transferred has to be
conducted. This purchase price allocation (PPA) concerns valuing both tangible and intangible
assets acquired in the acquisition to fair value as well as placing a monetary value on the
goodwill emerged in the acquisition. In this process, recognizing and measuring goodwill and
intangible assets is featured by a significant amount of subjectivity. From an external
perspective it is nearly impossible to oppose the assumptions made by companies in the
process of allocating the consideration transferred in the PPA and in the subsequent
impairment testing (Wyatt, 2005).
Subsequent to an acquisition, tangible and intangible assets1 valued at fair value as well as
goodwill have to be depreciated, amortized or tested for impairment. Also this process is
complicated as for example the values of intangible assets are hard to estimate (Wales 1962,
Muller, 2004) and as goodwill need to be allocated to cash generating units which often give
rise to complex calculations (Wines et al, 2007).
How the PPA and the subsequent impairment testing are made is of great importance as
different choices have different consequences on for example the income statement, the balance
sheet (Bloom, 2009) and hence also key ratios. Furthermore, the effects on the financial
statements may give rise to effects on management compensation (Newman, 1989) and stock
price reactions (Niederhoffer and Regan, 1972).
According to IFRS 3, goodwill should no longer be amortized but instead tested for impairment
whilst most intangible assets, which in line with IFRS do not include goodwill, still are
amortized over their useful life. A current debate concerns the question of what effects the new
standards have on the level of goodwill and goodwill impairments. Several researchers have
raised the opinion that the levels of goodwill will increase as a result of the changed standards
(for example Hellman et al, 2010). Another raised opinion is that the change of the standards
has decreased the usefulness of the external accounting due to the way the standards are
applied (Marton, 2009). Hence, both the formulation of the IFRS 3 and the application made by
companies have been criticized.
The fact that goodwill and intangible assets constitute a large amount of the total enterprise
value after an acquisition, that the values are characterized by subjectivity, that the treatment of
goodwill differs from the treatment of most intangible assets and that the choices made can
have large consequences make the PPA and the subsequent impairment testing a topic that is
1 When discussing tangible and intangible assets further in the thesis, it is generally the assets arising as a

7
interesting to further investigate. How do companies allocate the consideration transferred to
goodwill and intangible assets? How are the interest rate and time horizon chosen? Are there
incentives for companies to take advantage of the subjectivity?
By studying Swedish companies that apply IFRS, the questions raised in this section are the
focus of this thesis. Already at this point it should be noted that the thesis does not take a stand
in the discussion concerning the shortcomings of the IFRS or in which direction the standards
should develop.
1.2 Purpose The purpose of this thesis is: To explore and identify practices and forces affecting the implementation of IFRS 3 with the respect to the allocation of the consideration transferred and subsequent impairment tests. A visualization of this can be seen in Figure 1, where the blue box represents the process this
thesis aims to investigate. This process could for example include company specific
interpretation and adjustments of the IFRS as well as consideration of internal incentives and
external pressure.
As a basis for the described study, a pre-study has been made. The purpose of the pre-study is to
investigate general tendencies in how companies allocate the consideration transferred
between the major asset groups in the PPA and how often impairments are done. In Figure 1,
the pre-study corresponds to the outcome of the blue box, i.e. the externally reported allocation
of the consideration transferred and the impairments.
This thesis aims to take an external perspective, meaning that the purpose of the thesis is to
provide analysts, investors and standard setters with information and an example of the blue
box process in Figure 1 in order to make better decisions within their respective area.
1.3 Structure The thesis is organized as follows. After a short explanation of the current IFRS within the area
of the thesis, previous research is presented. After that, the research method is described. The
results of the pre-study are then presented along with a discussion of the quantitative findings.
This discussion is followed by the empirical results of the qualitative case study and a
discussion concerning the case results. The thesis ends with conclusions, a discussion of the
reliability and validity of the thesis as well as suggestions for further research.

8
2. Theoretical framework When a company is acquired the parent
company has to specify what individual assets it
has purchased, i.e. how to allocate the
consideration transferred between the different
assets classes in the PPA. The major asset
classes are tangible assets, intangible assets and
goodwill. As can be seen below, tangible and
intangible assets should be valued at fair value.
Goodwill is on the other hand calculated as the residual as shown in Figure 2. The allocation to
the different asset classes will then be included in the consolidated financial reports.
This section will start by describing the IFRS standards within this area. After that, previous
literature will be covered in four different sections. The first section describes the difficulties
that arise when allocating the consideration transferred in the PPA and in the subsequent
impairment testing. After that, a section covering the concept of goodwill follows. The third
section explains why the PPA and the subsequent impairment testing are important by
describing potential consequences of the different choices. The fourth section of the previous
literature gives an account of the current literature concerning firm practice within the area of
this thesis and the final section touches upon the area of creative accounting2.
2.1 Current standards in the context of business combinations
2.1.1 Accounting for a business combination
According to the International Financial Reporting Standards (IFRS) 3, a business combination
is a transaction or event in which an acquirer obtains control of one or more businesses
(Appendix A). When accounting for business combinations, IFRS 3 Business Combinations
should be applied. The standard describes an acquisition method containing four steps (IFRS 3
§5):
1. Identification of the acquirer
2. Determination of the acquisition date
3. Recognition and measurement of the identifiable assets acquired, the liabilities assumed
and any non-controlling interest
4. Recognition and measurement of goodwill or gain from a bargain purchase
As the thesis is focusing on how the consideration transferred is allocated in the PPA, only step
3 and 4 will be discussed further.
2.1.1.1 Recognition of identifiable assets acquired, liabilities assumed and non-controlling
interest
At the acquisition date, the identifiable assets acquired, the liabilities assumed and any non-
controlling interest in the acquired company should be recognized (IFRS 3 §10). In order to be
recognized, the assets and liabilities must meet the definitions of assets and liabilities in the
IASB Framework (IFRS 3 §11). According to IFRS 3 Appendix A, an asset is identifiable if it is
2 In this thesis, the concept of creative accounting is used to denote all cases where personal preferences consciously or unconsciously affect the external accounting. Hence, the concept is substantially broader than fraud.

9
either separable and thus can be sold or arises from contractual rights. It should be noted that
IFRS 3 implies that assets and liabilities not recognized before the acquisition may be
recognized (§13).
IAS 38 §11 states that it is the requirement to be identifiable that separates intangible assets
from goodwill. When an intangible asset acquired in an acquisition as a part of a business
combination meets the definition of an intangible asset, the probability recognition criteria and
the reliability measurement criteria is always considered to be satisfied (IAS 38 §33).
IFRS provides an exception to the general recognition principles when it concerns contingent
liabilities. At an acquisition, the acquirer should recognize a contingent liability if it is a present
obligation that arises from a past event and its fair value can be measured reliably (IFRS 3 §23).
Thus, there is no need that the liability is probable, which is required by IAS 37.
IAS 12 §19 explains that when the carrying amount of an asset is increased to its fair value in a
business combination, and the tax base of the asset remains at cost in the subsidiary’s accounts,
a taxable temporary difference arises. According to IAS 12 §39 shall an entity recognize a
deferred tax liability for all taxable temporary differences that arise in an acquisition of a
subsidiary. The same holds for deferred tax assets (IAS 12 §44). An important exception to this
rule is that, as explained by §15, no deferred tax should be recognized for goodwill (IAS 12).
2.1.1.2 Measurement of identifiable assets acquired, liabilities assumed and non-
controlling interest
When measuring the identifiable assets and liabilities, the fair value at the acquisition date
should be used (IFRS 3 §18). Any non-controlling interest should be measured at either fair
value or at the non-controlling interest’s proportionate share of the acquired company’s
identifiable net assets.
Fair value is defined as the amount for which an asset could be exchanged or a liability settled
between knowledgeable, willing buyers and sellers in an arm’s length transaction (IFRS 3
Appendix A). According to the fair value hierarchy, three levels of fair value exist (IFRS 7 §27A).
The first level consists of observable quoted prices for identical assets/liabilities in active
markets. The second level consists of observable inputs other than quoted prices for identical
assets/liabilities in an active market. The level three inputs are unobservable.
2.1.1.3 Recognition and measurement of goodwill
According to IFRS 3 §32, goodwill is determined as the difference between a) the consideration
transferred and the non-controlling interest and b) the net of the acquisition date amounts of
the acquired assets and liabilities. If this amount is smaller than zero, no goodwill is recognized
and the acquirer will instead make a bargain purchase (IFRS 3 §34). The resulting gain shall be
recognized in the acquirer’s income statement. According to IFRS 3 §40 and §58, a change in the
consideration transferred made years after the acquisition does not affect the recorded
goodwill.
2.1.2 Accounting subsequent to the acquisition
Subsequent to the acquisition, assets acquired, liabilities assumed or incurred and equity
instruments issued in a business combination are in general measured in accordance with other
applicable IFRS, depending on the type of asset (IFRS 3 §54). This means that tangible assets are
depreciated and intangible assets with a finite life are amortized (IAS 16, IAS 38).

10
2.1.2.1 Amortization and impairment of intangible assets
For intangible assets with finite useful lives, the depreciable amount shall be allocated on a
systematic basis over the useful life (IAS 38 §97). When determining the useful life of an asset,
many factors should be considered (IAS 38 §90-95). These factors include for example:
Expected usage
Typical product life cycle
Stability of the industry
Actions of the competitors
Periods of control
Legal factors
Intangible assets with an indefinite useful life shall not be amortized (IAS 38 §107) but instead,
annually or when needed, tested for impairment.
An impairment loss should be recognized if the recoverable amount of an asset or a cash
generating unit (CGU) is less than its carrying amount (IAS 36 §59). The recoverable amount is
defined as the higher of the fair value less costs to sell and the value in use (IAS 36 §18). When
estimating the value in use, estimates of future cash flows should be discounted by the
appropriate discount rate (IAS 36 §31).
2.1.2.2 Impairment of goodwill
According to IFRS 3 B63, goodwill is no longer subject to amortization but instead tested for
impairment. When performing the impairment testing, goodwill acquired in a business
combination shall be allocated to CGU:s or groups of CGU:s of the acquirer (IAS 36 §80). This
should be done irrespective of how the other assets and liabilities are assigned to the units. Each
unit or group of units shall represent the lowest level within the entity at which the goodwill is
monitored for internal management purposes and not be larger than an operating segment
according to IFRS 8 §5 before aggregation. Impairment testing should be done annually or more
often if there is an indication that the goodwill may be impaired (IAS 36 §90).
As for all assets, an impairment should be done if the recoverable amount of the CGU is lower
than the carrying amount of the unit. The impairment should be recognized in accordance with
IAS 36 §104 stating that the carrying amount of the unit’s goodwill should be reduced prior to a
pro rata decrease of the other assets of the unit. However, for the individual assets, it is not
possible to reduce the value to less than the highest of its fair value less costs to sell, its value in
use and zero. An impairment loss for goodwill cannot be reversed in a later period (IAS 36
§124) as this would likely be an increase in internally generated goodwill, which cannot be
recognized according to IAS 38 (IAS 36 §125).
2.1.3 Disclosures
After the acquisition, information that enables users of financial statements to evaluate the
nature and financial effect of a business combination should be disclosed (IFRS 3 §59).
Examples of what should be disclosed are the fair value of the total consideration at the
acquisition date and the amounts recognized for each major class of assets acquired and
liabilities assumed (IFRS 3 §B64).

11
Also requirements regarding disclosures of impairments are stated by IFRS. As an example, the
amount, the reason and the valuation method should be disclosed for all material impairment
losses (IFRS 36 § 130).
A threshold for disclosing information in the external accounting is the principle of materiality.
According to the IFRS Framework QC11, information is material if omitting it can influence the
decisions made by external users of the financial information. It is also pointed out that
materiality is an entity-specific aspect.
2.2 Difficulties in allocating the consideration transferred and the
subsequent impairment testing The intention of the standards concerning the PPA and its subsequent treatment is to give
investors a good picture of the financial situation of an acquisition. However, some people
within the industry (for example Heurlin, 2011) have criticized the way in which IFRS have
been formulated, suggesting that the standards are difficult to interpret for companies. Hence,
for the preparers of the financial information many problems might arise in the application of
the standards. Due to different national contexts these problems are further increased
(Hellman, 2011).
The introduction of IFRS 3 implied that companies need to analyze acquisitions more deeply
(Thorne, 2010) and as Wines et al. (2007) point out, the current accounting of goodwill require
numerous assumptions to be made when estimating fair value, value in use and recoverable
amount. Thus, as Wines et al. state it: Considerable ambiguity and subjectivity are inherent in the
IFRS requirements (2007, p. 862). However, Dahmash et al. (2009) argue that the avoidance of
subjectivity when valuing intangible assets and goodwill might not be possible as the pattern of
declination varies among those assets. Instead, they suggest that managerial discretion is crucial
to achieve somewhat relevant measures.
When performing the PPA and the subsequent impairment testing, the difficulties can be
divided into two types: recognition problems and measurement problems. Recognition
problems concern the fact that it might not always be obvious what assets and liabilities to
recognize in the allocation process following an acquisition. An example of a difficult issue on
the asset side is which intangible assets to recognize and which not to (Thorne, 2010, Heurlin,
2011). On the liability side, a problematic area in the allocation concerns the treatment of
contingent liabilities (Wines et al, 2007). As a result of the residual nature of goodwill, the
higher amount of intangible assets and the lower amount of contingent liabilities recognized,
the lower is the residual amount of goodwill.
Measurement problems concern how to measure the different values in the PPA and in the
subsequent impairment testing. The valuation might be done by looking at other prices in the
market or by doing estimates and using a theoretical model. Herz et al. (2001) suggest two basic
models for estimating fair values, the discounted cash flow (DCF) model and the residual
income valuation (RIV) model. All valuation models should theoretically give rise to the same
value, but this might not be the case in practice. Thus, the choice of how to value an asset or
liability can have implications for the recognized amounts. A disadvantage with the use of both
the DCF and the RIV models when valuing goodwill is that they measure the aggregate goodwill,
not the acquired (Herz et al, 2001).
12
In a valuation model, there are several inputs and estimates that have a great impact on the
calculated value. As an example, the length of the time period of the model and the choice of
rates, such as discount and growth rates, are important. As shown in Skogsvik (2006), these
choices might have very large consequences on the calculated value. Once the basic assumptions
of the valuation model have been made, future earnings and cash flows have to be estimated
together with probability estimates (Sevin and Schroeder, 2005). In many situations, a salvage
value also has to be estimated (Wines et al, 2007).
When valuing intangible assets, further complications arise. As Muller (2004) concludes, the
determination of the useful life of an intangible asset is subjective and as stated by Wales
(1962), the same holds for the choice of amortization pattern. The subjectivity when valuing
intangible assets is also highlighted by Olsen and Halliwell when stating: How do you quantify
things you can't feel, see or weigh? (2007, p. 66).
Due to the characteristics of goodwill, also the measurement of goodwill comes with further
difficulties (Herz et al, 2001). Marton (2009) even proposes that goodwill is the most difficult
area within IFRS. The residual nature of the calculation of goodwill implies that any
measurement error in computing the fair value of net assets affects the imputed value of the
goodwill. The same holds for any overpayment or underpayment at the acquisition. Wines et al.
(2007) also consider the subjectivity when recognizing a gain on a bargain purchase. It should
also be noted that the handling of goodwill also results in major accounting and administration
costs (Heurlin, 2011).
Another difficulty in the treatment of goodwill relates to identifying CGU:s. While the standards
require the use of the smallest units possible, many units often give rise to complex calculations
when determining cash flows, fair value and recoverable amount (Wines et al, 2007). This goes
hand in hand with the demand for more time and money.
A third goodwill related problem arises as goodwill does not produce profit by itself. Instead, it
is the combination with other assets that produce profit. This makes it hard to determine
whether goodwill has been impaired or not (Wines et al, 2007). This issue is further
complicated if the acquired firm is operationally merged with any other company in the group
(Herz et al, 2001).
Concluding, there are several difficulties in allocating the consideration transferred and in the
subsequent impairment testing. As it is hard to tell what is right or wrong, the decisions that
have to be made are characterized by subjectivity. That this is a problematic area has also been
considered by the standard setters, who currently are working on a new standard for
calculating fair values (Ernst & Young, 2010) and have the intention of revising the current
standards concerning impairment testing of goodwill (Heurlin, 2011).
2.3 The concept of goodwill Before proceeding, it is interesting to reflect upon what is meant by the term goodwill at the
time of the acquisition. According to the old article Economic theories of goodwill the term is in
general used to designate the capital value of all periodic surpluses accruing to an enterprise in
the regular course of business, whether or not they are exploitation profits (Preinreich, 1939, p.
177). This is in line with what Hellman et al. (2010) define as core goodwill: the economic value
of the entity less the net value of identifiable assets and liabilities measured at fair value and

13
less all unrecognized assets and liabilities measured at fair value. Conceptually, only core
goodwill is regarded as an asset according to IASB.
The concept of goodwill has received a lot of critique in the past. Much of this relates to what
Benjamin Graham states in his famous quote: Separate what you know from speculation and
anchor on what you know (Penman, 2009, p. 359). Following his reasoning, goodwill should be
left out from the balance sheets as it concerns a lot of speculation.
Another type of critique concerns the vague distinction between intangible assets and goodwill,
as discussed above. As an example, Malmqvist (2007) argues that goodwill should include all
intangible assets acquired in an acquisition. This is in contrast to Heurlin (2011) who points out
that by separating intangible assets from goodwill it is possible to see the underlying reasons
for the acquisition.
2.4 Consequences of the allocation of the consideration transferred and the
subsequent impairment testing One major reason to why it is interesting to study the
allocation of the consideration transferred in the PPA and
the subsequent impairment testing is that the choices of
methods and assumptions have several consequences.
The choices by a company give rise to consequences in
different levels and in this thesis, the consequences have
been structured as shown in Figure 3.
2.4.1 Direct consequences
The first level of consequences can be called direct
effects. Direct effects that Bloom (2009) points out relate
to result effects, financial position effects and tax effects
(see Figure 4).

14
Interesting to keep in mind is that whereas most tangible and intangible assets are subject to
depreciation or amortization, goodwill is currently only subject to impairment. In addition,
Wales (1962) highlight the fact that the amortization period of intangible assets can have a large
impact on net income.
The fact that goodwill no longer is amortized has theoretically important direct consequences as
pointed out by Hellman et al. (2010). At the acquisition, the recognized goodwill will consist of
core goodwill and recognition goodwill. This is due to the fact that there will be no
measurement conservatism as all assets and liabilities should be recognized at fair value.
Subsequent to the acquisition, when measurement conservatism is introduced, a buffer
consisting of unrecognized assets, for example internally generated goodwill, and
conservatively valued assets is created. This buffer protects the goodwill from being impaired
and implies that future goodwill not only will consist of the goodwill emerged in the acquisition,
but also of hidden reserves for unrecognized and conservatively measured assets. Hellman et al.
thus argue that the probability of goodwill impairments is decreased by the buffer. The fact that
the impairment test does not measure whether the core goodwill has been impaired is
something that has gained a lot of critique (Alfredson et al, 2009) and that IASB has brought up
in the Basis for Conclusions of IAS 36.
It should also be noted that the fewer and the larger the identified CGU:s are in a group, the
higher is the probability for the shielding of goodwill and the lower is the probability of
reporting a goodwill impairment (Hellman et al, 2010).
2.4.2 Indirect consequences
The direct consequences of the allocation of the consideration transferred in the PPA and the
subsequent impairment testing give rise to indirect consequences both internally in the
company and in the external market.
One potential internal indirect effect concerns the level of bonus paid to managers. Newman
(1989) claims that companies tend to use either profit before income taxes or profit after
income taxes when determining management compensation. That the net income is important
for the mangers bonuses is also supported by the article of Gibbs et al. (2009). In a study of 326
car dealerships the authors find that net income is the primary performance measure in over 50
percent of the cases. Another internal indirect effect concerns credit ratings. As illustrated by
White et al. (2003), both earnings and balance sheet measures are considered when the credit
rating for a company is decided. The credit ratings will further have implications for required
interest rates and the issuing of debt.
Credit ratings are also important from an external perspective as investors are likely to use
them in their decision making processes (White et al, 2003). Another external indirect
consequence concerns the stock price. Niederhoffer and Regan (1972) show by studying over
1000 companies of the New York Stock Exchange that stock prices are strongly dependent on
earnings changes.
Johansson (2008) discusses the fact that a consequence of the new standards is that it is very
hard to predict goodwill impairments from an external perspective. However, Elwin (2008)
points to the fact that goodwill accounting might not be that important. He argues that what
analysts look for is intangible assets where there is a reasonably clear legal framework and that
15
subjective intangible assets and goodwill, both on the income statement and balance sheet, are
ignored. This argument is also supported by Heurlin (2011).
Still, as the concept of goodwill has been highly debated in the past and been the focus of
extensive lobbying (Gowthorpe and Amat, 2005) one has to conclude that goodwill must have
importance. This is for example the opinion of Dahmash et al. (2009), who show that goodwill
and intangible assets, despite being presented with less reliability than other assets, are value
relevant.
Concluding, there are many factors other than the IFRS that might influence how the PPA and
the subsequent impairment testing are made. As an example, Hjelström and Schuster (2011)
points out management control systems, cost-benefit analysis and considerations of a broader
spectrum of economic consequences as important in the accounting. Hence, these factors are
likely to influence the PPA process and the subsequent impairment testing.
2.5 Data on firm practice
2.5.1 Allocation of the consideration transferred
As stated above, the allocation process might not be straight forward and that companies find
this process difficult becomes evident in a study by the Financial Reporting Council (2010). The
study shows that many acquiring companies found it hard to identify separate intangible assets
and were satisfied by recognizing everything as goodwill with the argument that it could not be
measured reliable. The Financial Reporting Council also found the disclosure level
disappointing. That this is a problem also when only considering only Swedish companies is
concluded by Gauffin and Nilsson (2010). Furthermore, Petersen and Plenborg (2010) conclude
that there is inconsistency among companies in the application of IAS 36 Impairment of Assets.
This holds for both how the CGU:s are defined and how the recoverable amount is estimated.
Also Ernst & Young (2010) find indications of a lack of consistency in the application of the
standards.
In a study made by Ernst & Young (2010), the 40 largest acquisitions made during 2009 by
Swedish companies complying IFRS were investigated. The study showed that goodwill was the
most important asset of the consolidated enterprise value, constituting on average 35 percent of
the total value. However, this percentage was substantially lower than during the previous three
years when goodwill represented over 50 percent of the total value. Ernst & Young suggest that
the 2009 decrease partly can be explained by overall lower company valuations. In a similar
study by Gauffin and Nilsson (2010) covering companies noted on Stockholm OMX, the authors
conclude that years with high purchase prices of companies are accompanied with higher
percentages of goodwill in relation to the consideration transferred.
The Ernst & Young study (2010) revealed a 2009 average of 32 percent for intangible assets in
relation to the enterprise value. It also showed that it is common to aggregate all intangible
assets in one post. In a similar study covering over 700 global transactions 2007, Ernst & Young
(2009) conclude that the recognition of a key intangible asset results in a smaller goodwill
amount and thus that the residual goodwill is strongly negatively correlated to the recognition
and measurement of intangible assets. The study also shows that in the process of valuing
intangible assets, the choice of model varies depending on the type of intangible asset and that
some sort of income approach is most commonly used.
16
Ernst & Young (2010) conclude that it is rare with fair value adjustments of tangible assets.
Heurlin (2011) offers a reason to this by arguing that Swedish companies tend to consider the
book values in the acquired companies as the correct values despite the fact that these are often
not fair values. However, Ernst &Young concludes a previous reluctance to recognize assets that
are depreciated or amortized to have been decreased.
By studying the technology industry Wyatt (2005) shows that the industry is of importance for
the allocation of the consideration transferred in the PPA. As an example, the speed of the
technology development has a positive correlation with the likelihood of managers recognizing
intangible assets as their cash flows are closer and thus less risky. The importance of industry is
supported by Ernst & Young (2009) who show that the allocation of the consideration
transferred in the PPA varies depending on which industry the company operates within.
2.5.2 Subsequent impairment testing
Herz et al. (2001) conclude that when doing impairment tests, the DCF model is the most
frequently used model. Gauffin and Thörnsten (2010) investigate impairment testing of
goodwill in 254 companies noted on Stockholm OMX and their study shows that DCF valuation
also is the most common model for impairment testing when only considering goodwill
valuation. In over 50 percent of the cases, a discount rate of 10 to 13 percent was used. In a
study of ten Swedish companies by Hellman (2011), discount rates between 6 and 14 percent
were used.
Beisland and Hamberg (2009) describe a study of 230 Swedish companies listed on the
Stockholm OMX. In that sample, impairments of goodwill were during the period 2001 to 2007
on average made in 17 percent of the companies. The authors concluded that there were no
differences in the level of goodwill impairments before and after the introduction of the new
IFRS.
Heurlin (2011) criticizes the way in which companies apply the new standards, stating that they
tend to do it in a practical and simplistic way. He argues that there should be a higher number of
impairments if the standards were applied in a more correct manner.
Concluding the sections on firm practice, it becomes evident that there is a need of more
research in the area of how companies do the allocation of the consideration transferred in the
PPA and the subsequent impairment tests. Even though some quantitative data is available
there is a gap in deeper qualitative information on how firms make their allocation of the
consideration transferred in the PPA and how they subsequently treat the PPA.
2.6 Creative accounting When the communication from a company is deliberately distorted by financial statement
preparers in order to bias the message, the company can be said to pursue creative accounting
(Gowthorpe and Amat, 2005).
The previously discussed indirect consequences of the allocation of the consideration
transferred in the PPA and the subsequent impairment testing could potentially give incentives
for management to be creative in the accounting. Healy and Wahlen (1999) suggest a variety of
reasons to why companies might manipulate the financials. Several of the reasons concern the
indirect consequences, both internal and external, that have been discussed: influencing the

17
stock market, increasing management compensation, reducing the likelihood of violating
lending agreements and avoiding intervention by government regulators.
The ambiguity and subjectivity in the processes of allocating the consideration transferred in
the PPA and of subsequent impairment testing, in combination with the effects on the financial
statements suggest that these processes are potential areas for creative accounting.
Furthermore, the fact that it is very hard for outsiders to observe and monitor these processes
(Wyatt, 2005) increases the possibilities for creative accounting. Additionally, Gowthorpe and
Amat (2005) suggest that the replacement of the amortization of goodwill with tests of
impairment, as the new IFRS require, further increase the opportunities for creative accounting
as the impairment testing rely on fair value estimates.
Earnings management has in previous literature been defined as the attempt by corporate
managers to influence short-term reported income (Sevin and Schroeder, 2005). Massoud and
Raiborn (2003) raise concerns that the possibility of creative accounting, due to the standards
allowing for flexibility, might result in managers adhering to a big bath behavior and higher
volatility in the earnings. Wines et al. (2007) point out that as a low number of CGU:s decrease
the probability of goodwill impairments, there are incentives to identify as few CGU:s as
possible. A final suggestion for creative accounting is offered by Muller (2004) who states that
an indefinite useful life can in many cases be assumed for intangible assets, thus resulting in the
same subsequent treatment as for goodwill.
Previous research suggests that earnings management of intangible assets and goodwill has
existed in the past. Wines and Ferguson (1993) provide evidence that firms between 1985 and
1989 used accounting policies to avoid the goodwill amortization. In the study, companies
recognized intangible assets that they did not amortize in order to get as low goodwill
amortization as possible. There have also been indications of that companies have planned the
timing of the amortization in order to make the stock price react favorable (Henning and Shaw,
2003). This suggests that already before the changes in the standard were applied there were
tendencies of manipulation concerning goodwill. After having studied ten Swedish companies
during 2008 and 2009, Hellman (2011) questions whether impairments of goodwill should not
have been larger and occurred more often. There is also evidence that goodwill impairments
have been used in order to manipulate earnings by adopting a big bath behavior (Sevin and
Schroeder, 2005, Giacomino and Akers, 2009).
Gramlich et al. (2001) consider the existence of balance sheet management and report in their
study that firms do manipulate balance sheet ratios by reclassifying assets and liabilities. As a
result, the liquidity and leverage ratios reported on the balance sheet are smoothened.
As is evident by the previous research, creative accounting can be implemented both by
focusing on the income statement and on the balance sheet and when investigating creative
accounting it is as Hellman et al. (2010) point out important to both consider the effects on the
balance sheet and the effects on the income statement. Hellman (2010) explains two different
approaches to how financial performance can be measured. Taking the income statement
approach, accomplishment is measured by profit. By instead taking the balance sheet approach,
the change in net assets is the measure of accomplishment. It should also be noted that some
researches argue that there is no dichotomy between the two different concepts. Instead,
Heurlin (2011) argues that the two approaches do not exclude each other.

18
As Elwin (2008) describes, IFRS and other standard setters are more and more focusing on the
balance sheet approach. Dahmash et al. (2009) argue that this shift is likely to increase the
importance of appropriately recognizing intangible assets. Penman (2009) on the other hand
concludes that even though the value of intangible assets and goodwill are stated on the balance
sheet, it is important to also focus on the income statement in order to get the most accurate
picture of a company’s financial position.
An indication of that analysts pay a lot of attention to the income statement is the fact that the
earnings measure is related to the stock recommendation (Bradshaw, 2004). Analysts also tend
to overweight past earnings in their forecasts, as Nandelstadh (2003) shows in his study of the
Nordic market.
The direction of a manipulation is all dependent on the specific situation and on whether most
focus is on the balance sheet or the income statement. Consequently, as Wines et al. (2007)
highlights, it is not possible to state in which direction a possible manipulation would be in, it
could be both up- and downwards. Despite the fact that one cannot say for certain whether it is
in the favor of the balance sheet approach or the income statement approach creative
accounting would be, the majority of the previous research seems to be in agreement of that it is
avoiding impairments that companies would like to do.
Even though there has been much written about the fact that companies might manipulate,
Wyatt (2005) suggests, after having investigated intangible assets within the technology sector,
that the risk of manipulation in many instances is overstated. Also, as is highlighted in the study
by Barton and Simko (2002), there is a trade-off between earnings and balance sheet
management since the income statement and the balance sheet are closely interlinked.
Management’s ability to manipulate earnings on the income statement decreases with the
extent to which the accumulated amount of net assets already are overstated on the balance
sheet (Barton and Simko, 2002).
Despite the arguments that creative accounting might not be such a large problem, it can be
concluded that is important to have the concept of creative accounting in mind when analyzing
the empirical data in this thesis.

19
3. Method In order to fulfill the aim of this thesis, a quantitative and a qualitative study have been made.
The aim of the quantitative study is to extend the previous studies that have been made within
the area, to investigate how firms on average allocate the consideration transferred and to
determine the general level of goodwill impairments and amortization of intangible assets.
Compared to the previous quantitative studies, the study of this thesis is extended in time and
number of details investigated.
The qualitative study takes an exploratory approach and aims to deeper investigate how the management of one chosen group reflect and reason in the process of allocating the consideration transferred and in the subsequent impairment testing. This part of the thesis will explain the methods, calculations and choices made, first in the
quantitative study and secondly in the qualitative study.
3.1 Quantitative method The quantitative study is important due to two reasons. Firstly, if the fair value adjustments of
the tangible assets, the recognized intangible assets and the residual goodwill amount are
substantial, the qualitative study becomes relevant. Hence, this is important prior to the
qualitative study. Secondly and after the qualitative study, the quantitative study can be used in
order to validate that the case group not is an extreme outlier when it comes to the externally
reported allocation of the consideration transferred and the externally reported impairments. It
should be noted that the case group is only one company of a heterogeneous sample why
generalizations are impossible and hence not either included in the purpose of the thesis.
When performing the quantitative study, the annual reports from 2006 to 2009 of companies in
February 2011 listed on Stockholm OMX Large Cap have been investigated. A four year period
has been chosen to give a high number of observations, more reliable averages and not give
results affected by economic conditions on a yearly specific basis. In order to get results that are
useful to interpret and generalize, companies in the financial sector has been left out as they are
operating under very specific conditions.
As a first step, acquisitions made from 2006 to 2009 by the companies in the sample have been
analyzed by deeper readings of the annual reports. The acquisitions studied are those where:
The parent company is gaining control over the acquired company and thus
consolidates assets and liabilities. Step acquisitions were control already has been
established (generally if the group already own 50 percent or more) are left out to not
distort the sample.
The consideration transferred is higher than 100 million SEK (15 MUSD, 10 MEUR).
The acquisition not is a reverse acquisition, to avoid the risk of distorting the sample.
In the cases where single acquisitions not are disclosed in the annual reports, aggregate
acquisition data have been used if the total consideration is higher than the minimum monetary
requirement of 100 million SEK. Observations fulfilling the monetary requirement of the
consideration transferred but with no information of the allocation has been noted but not
included in the numerical calculations.

20
Due to the revision of IFRS 3, effective from July 1st 2009, implying that transaction costs should
be expensed rather than added to the consideration transferred, transaction costs have in this
thesis been treated differently for the different years depending on the company specific
treatment. The reason to why this not has been adjusted for is that the necessary information
seldom is disclosed and that the transaction costs in relation to the consideration transferred
generally is small.
Studying the acquisitions, the allocation of the consideration transferred, the amortization
periods of the revalued assets and the ownership stake before and after the acquisition have
been recorded. When the deferred tax liabilities (DTL) arising due to acquisitions not have been
assigned to specific acquisitions, the DTL allocation has been estimated based on the amount of
the fair value adjustment of the net assets in the acquired company. In the case of acquisitions of
less than 100 percent, the accounting method (i.e. the purchased goodwill method or the full
goodwill method) has also been noted.
As a second step, the level of goodwill and other intangible assets together with the
accompanying impairment/amortization has been monitored. It should be noted that these
figures do not only consist of assets recognized as a result of an acquisition but also of for
example internally generated goodwill and intangible assets.
The number of CGU:s per group has been recorded and related to the group revenue. In order to
calculate an average of this ratio, the revenue used in the ratio has been translated into SEK
when necessary. The exchange rates used have been those of the last trading day of the specific
year as reported by Swedbank (2011).
3.1.1 Compilation of data
To determine how large part of the goodwill/intangible assets that have been
impaired/amortized, the following ratios have been calculated:
Reversals have been treated as negative impairments3. When calculating the averages for the
above three ratios, a denominator corresponding to the number of impairments/amortizations
made has been used.
3.2 Qualitative method In order to answer the questions posed in the introduction and to fulfill the purpose of the
thesis, a Swedish group, referred to as the group, has been selected as a case object. This group
3 As can be seen in the results, reversals were few and have a minor impact on the aggregated numerical data.

21
was chosen as it is a mature and stabile group accustomed to handle the accounting issues
investigated in this thesis. Also, the authors had high accessibility to this group. To be able to
study the case on an as deep level as possible, the authors have for a period of three weeks been
positioned at the head quarter of the group.
As a first step, general information and knowledge about the operations of the group has been
acquired, for example by studying annual reports, group magazines and other available
material. Secondly, the group guidelines concerning the investigated issues have been
processed. Thirdly, four different acquisitions have been chosen as case objects based on the
aim of getting as diverse case acquisitions as possible. For example, acquisitions made with
different objectives, of different size and from all business areas of the group have been chosen.
For the four chosen acquisitions, the documentation from the acquisition has been studied. The
group’s documentation of these four acquisitions included for example PPA:s, press releases
and in some cases fair value calculations. The fourth step consisted of undertaking interviews
with people at the head quarter as well as in the organization. Those at the head quarter were
interviewed concerning the group guidelines and organizational structure whereas those in the
organization were interviewed regarding one of the four studied acquisitions. The interviews
were in general face-to-face interviews. However, in two cases the interviews had to be made
via telephone, in one case due to sickness and in the other case due to different location. All
interviews were semi-structured and have been recorded and transcribed. A list of the
interviews can be found in the reference list.

22
4. Quantitative study This section will first account for the results of the quantitative study. The results have been
divided into two parts, the first covering the allocation of the consideration transferred in the
PPA and the second covering the subsequent impairment testing and amortization. After the
results have been presented, a discussion of the quantitative study will follow.
4.1 Results Based on the criteria described in the Method section, 43 companies have been included in the
quantitative study.
4.1.1 Allocation of the consideration transferred
The selection criteria resulted in 117 acquisition observations, of which 33 observations
consisted of more than one acquired company. Almost every acquisition resulted in recognition
of goodwill and the goodwill constituted on average 48 percent of the consideration transferred.
The median was slightly higher, 50 percent.
New intangible assets were recognized in 70 percent of the cases. The value of intangible assets
constituted on average 30 percent of the consideration transferred. The median was 19 percent.
In many cases, the composition of the intangible assets was not explained. Among the cases
disclosed, trademarks/brands and customer relationships were common explanatory posts. As
companies were bad at disclosing the useful life of their intangible assets, it is hard to state any
aggregated numbers concerning useful lives. However, for trademarks and brands the most
commonly disclosed useful life was 10 years. For customer related intangible assets, the useful
life was slightly lower. The amount of intangible assets with an indefinite lifetime was generally
low.
Tangible assets were fair value adjusted in approximately 40 percent of the cases. The
adjustments were in the majority of these cases made upwards. When disclosed, the most
commonly mentioned fair value adjusted tangible asset was property, plant and equipment
(PPE).
A general observation from the study of acquisitions is that there are large differences among
the companies on how much information concerning acquisitions that is disclosed. No
acquisition was accounted for by applying the full goodwill method.
4.1.2 Subsequent impairment testing and amortization
As four individual years were investigated, 172 observations of the level of goodwill and
intangible assets together with the accompanying impairment/amortization were monitored.
The results from this part of the study are shown in Table 1. It can be seen that goodwill was
impaired in approximately 25 percent of the goodwill observations and that intangible assets
were almost amortized every year. In relation to sales, both goodwill impairments and
intangible asset amortization were minor. It is also evident that in every third observation,
impairments of intangible assets were made. However, these were in general very small. The
number of reversals was low and not of a great amount.

23
Number of companies 43
Number of observations 172
Number of goodwill items 155
Number of goodwill impairments 38
Number of goodwill impairments/Number of goodwill items 25%
Average (Goodwill impairment/Goodwill) 12%
Average (Goodwill impairment/Revenue) 3%
Number of intangible asset posts 156
Number of intangible asset amortizations 149
Number of intangible asset amortizations/Number of intangible asset posts 96%
Average (Intangible asset amortization/Intangible assets) 14%
Average (Intangible asset amortization/Revenue) 1%
Number of intangible asset impairments 56
Number of intangible asset impairments/Number of intangible asset posts 36%
Average (Intangible asset impairment/Intangible assets) 3%
Average (Intangible asset impairment/Revenue) 0.3% Table 1
Interesting to note is the distribution of
the goodwill impairments and the
intangible asset impairments. A total of
38 goodwill impairments were
distributed among 20 companies as
shown in Figure 5. As an example, it can
be seen that of the companies that have
done impairments, more than half of
them have done more than one
impairment. The 56 observations of
intangible asset impairments were
distributed among 20 companies and
the number of companies that did both impairments of goodwill and of intangible assets
amounted to 14.
The number of CGU:s defined for impairment testing of goodwill was hard to determine. The
companies were in general good at disclosing goodwill allocated on units, but it is hard to know
on which level the impairment tests are done. The units disclosed ranged between 1 to 20, with
the majority distributed between 2 and 7 CGU:s. On average, the revenue generated per CGU
amounted to 19 billion SEK. The median was 7 billion SEK.
All ratios in the quantitative study were also calculated excluding real estate companies due to
concerns that they might distort the results. The exclusion did not alter any figure materially,
partly due to the low number of acquisitions made by real estate companies. Hence, the real
estate companies will not be excluded further in the thesis.
For additional results of the quantitative study, please see the appendix.

24
4.2 Discussion Looking at the results of the quantitative study it is evident that goodwill and intangible assets
often constitute a large amount of the balance sheets. As goodwill by several authors (for
example Herz et al, 2001) has been considered to be characterized by substantial subjectivity,
the reliability of the accounting of business combinations can be questioned as almost 50
percent of the consideration transferred on average is recognized as goodwill in the PPA. The
question of ambiguity is further enhanced by the fact that intangible assets also constitute a
large part of the consideration transferred and also intangible assets are hard to value
objectively, as stated by for example Muller (2004), Olsen and Halliwell (2007) and Heurlin
(2011).
It should be noted that due to the revised IFRS, transaction costs are in some observations not
included in the consideration transferred. Even though this will have an impact on the goodwill
item, this effect is likely to be minor.
The study of intangible assets gives no indication of any large amount of intangible assets with
an indefinite life, which suggest that intangible assets with an indefinite life are not used as a
source of manipulation as Muller (2004) suggests. Hence, whether the consideration
transferred is allocated to goodwill or intangible assets in the PPA seems in practice to give
raise to substantial differences.
Noticeable is the low occurrence of fair value adjustments of tangible asset. A possible reason to
the low numbers of adjustments of tangible assets is, as Heurlin (2011) suggests, that managers
consider the original book values as very relevant. A related possible reason for not adjusting
the value of tangible assets concerns the principle of materiality; if the management believes the
fair values to be close to the book values the management might not consider the benefits of
revaluing the tangible assets to exceed the costs. It could also be the case that the values already
are fair values, which in many cases seems realistic as the use of fair values lately has increased
in the IFRS. With this aspect in mind, it is not possible to conclude that the number of
revaluations is too low. On the other hand, if the number of acquired companies that before the
acquisition did not apply IFRS and instead used historical cost accounting were high, fair value
adjustments of tangible assets in 40 percent of the cases seems low. However, the accounting
policies of the acquired companies have not been investigated in this study. It can also be noted
that few fair value adjustments of tangible assets increases the amount of goodwill in most
cases. Hence, if the company is in favor of high levels of goodwill, low amounts of fair value
adjustments is a potential method to achieve this.
When analyzing the data on goodwill impairments, one can start to question whether goodwill
impairments in 25 percent of the cases is a high or low number. The figure is higher than the
level of goodwill impairments found by Beisland and Hamberg (2009) and seems high enough
to not suggest manipulation in the form of too few impairments on a general level. On the
individual level this type of creative accounting might still be the case. Manipulation on the
individual level is supported by the fact that the goodwill impairments are not evenly
distributed among the companies. However, the fact that some companies do impairments of
goodwill for several years, indicates that no big bath behavior is applied. Another possible
reason for the uneven distribution is industry specific norms and company specific policies, as
suggested by Wyatt (2005) and Ernst & Young (2009). If the number of impairments were

25
highly correlated to the company or industry, predicting goodwill impairments would be
somewhat easier than envisioned by Johansson (2008).
Impairments of intangible assets are commonly occurring, but the level of impairments, both in
relation to the intangible assets itself and to sales, is rather low. Hence, companies seem to be
good at estimating useful life and in contrast to previous literature, there is no support for big
bath behaviors concerning intangible assets. As experienced by Ernst & Young (2010) and the
Financial Reporting Council (2010) it was in the pre-study sample common to aggregate all
intangible assets into one post. This might as the Financial Reporting Council suggests be due to
companies finding the standards hard to apply. Another suggestion is that companies do not
want to disclose too much information due to secrecy. Despite the underlying reason, this
makes the analysis of the acquisition harder from an external perspective.
When comparing the average percentage decrease in goodwill in those cases where goodwill is
impaired with the average amortization of intangible assets, it can be concluded that they are
approximately the same. As goodwill impairments are done more seldom than amortization of
intangible assets, this implies that goodwill will stay on the balance sheet during a longer time
period. One can question whether the fact that something is not separable and has an indefinite
life (i.e. goodwill) implies that it has a longer life. If this is not the case, the shielding effect
discussed by Hellman et al. (2010) resulting in a lower probability of goodwill impairments is
supported.
As stated in the section Results, a possible reason to the low numbers of CGU:s is that companies
in some cases do not bother to disclose all units, but only the largest. As a low number of CGU:s
in line with Hellman et al. (2010) increases the shielding of goodwill and can be seen as a sign of
manipulation, it should be in the companies’ interest to disclose all units tested for goodwill
impairment. This means that if companies today only are disclosing the largest CGU:s one can in
the future, when the theories regarding creative accounting are more understood by companies,
expect more details on the allocation of goodwill. However, keeping the number of CGU:s low is
a useful tool for keeping impairments low that is hard to argue against. Another likely reason to
the low number of CGU:s is the difficulties in dividing the operations into different units as
pointed out by Wines et al. (2007).
The large difference between the average and the median of the ratio between the revenue and
the number of CGU:s implies that there are a number of companies that have a very high ratio.
Even though these companies do not belong to a specific industry, they are all mature and well
developed companies focusing on their core business.
Two plausible reasons for why there are such large differences in how much and how detailed
information companies disclose regarding acquisitions and impairment testing are that some
companies put more effort into the disclosing process than others and that some companies are
reluctant to reveal some of their information. The reason is likely to be dependent on the
individual company and its competitive situation.
After performing the quantitative study, it can be concluded that the allocation of the
consideration transferred and the subsequent impairment testing have large direct
consequences on the financial reports and that the PPA and impairment testing processes are
characterized by several choices. This implies that it is important to get a deeper understanding
of how companies reason and think in these processes.
26
5. Qualitative Study This section covers the main study of the thesis, firstly by giving an account of the observations
of the case group and secondly by discussing the results.
5.1 Results After a brief description of the case group, general responsibilities and guidelines of the group
are portrayed. This general information of the group is followed by illustrations of the four
specific acquisitions made by the company, both when it comes to the PPA and the impairment
testing. Finally, the WACC and the level of disclosures in the annual report are described.
5.1.1 Case Description
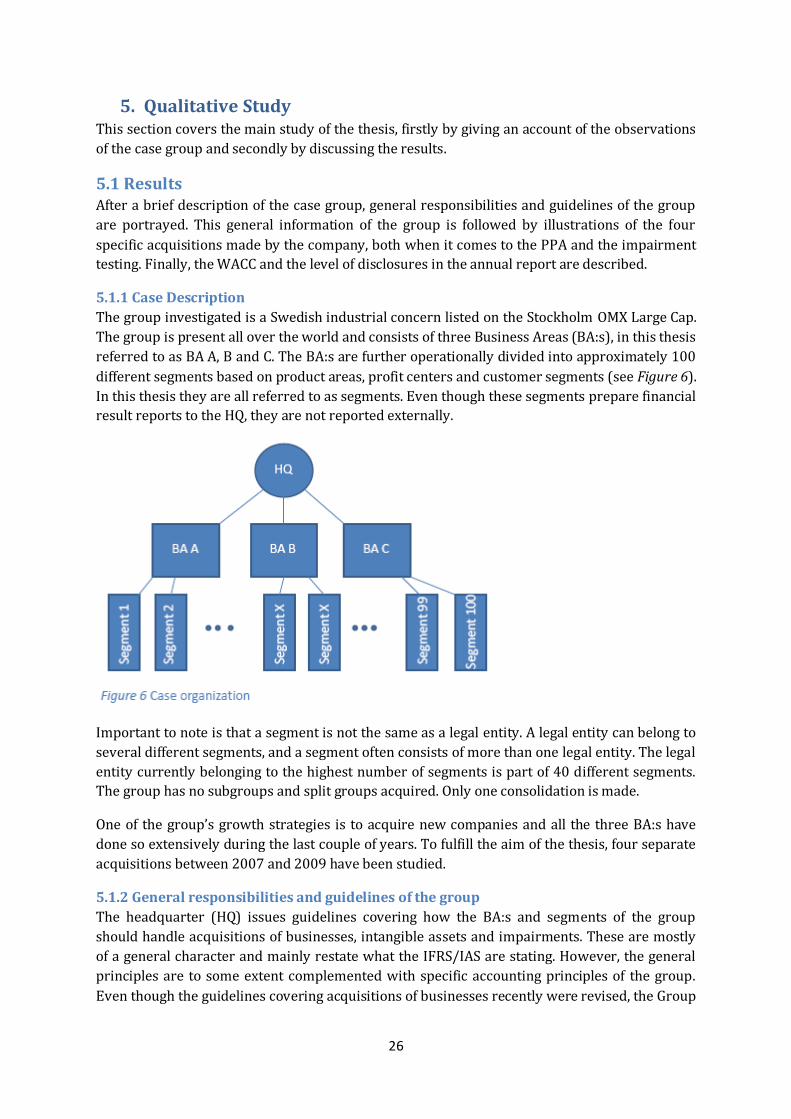
The group investigated is a Swedish industrial concern listed on the Stockholm OMX Large Cap.
The group is present all over the world and consists of three Business Areas (BA:s), in this thesis
referred to as BA A, B and C. The BA:s are further operationally divided into approximately 100
different segments based on product areas, profit centers and customer segments (see Figure 6).
In this thesis they are all referred to as segments. Even though these segments prepare financial
result reports to the HQ, they are not reported externally.
Important to note is that a segment is not the same as a legal entity. A legal entity can belong to
several different segments, and a segment often consists of more than one legal entity. The legal
entity currently belonging to the highest number of segments is part of 40 different segments.
The group has no subgroups and split groups acquired. Only one consolidation is made.
One of the group’s growth strategies is to acquire new companies and all the three BA:s have
done so extensively during the last couple of years. To fulfill the aim of the thesis, four separate
acquisitions between 2007 and 2009 have been studied.
5.1.2 General responsibilities and guidelines of the group
The headquarter (HQ) issues guidelines covering how the BA:s and segments of the group
should handle acquisitions of businesses, intangible assets and impairments. These are mostly
of a general character and mainly restate what the IFRS/IAS are stating. However, the general
principles are to some extent complemented with specific accounting principles of the group.
Even though the guidelines covering acquisitions of businesses recently were revised, the Group

27
Reporting Manager working at the Financial Control unit at the HQ cannot identify any major
changes from the previous guidelines.
The Group Reporting Manager states that in addition to the written guidelines, HQ also provides
the group with educational gatherings to make sure that a high quality of the accounting is
reached. Four times a year, HQ assembles two representatives from each BA in a forum where
they proactively discuss internal as well as external accounting issues. On these occasions, HQ
also takes the opportunity to inform about new accounting rules and the effects they may have.
The Group Reporting Manager further exemplifies the educational efforts by informing that the
HQ also arranges seminars on a regional basis in order to decrease implementation differences
arising in the accounting due to cultural differences. Most cultural differences are perceived to
exist between Asia and Europe, both concerning the mentality and the institutional factors.
However, the Group Reporting Manager highlights that the implementation differences are less
problematic than what is often expected.
5.1.2.1 Mandate to decide whether to acquire
Acquisitions are initiated at the level of the BA:s, which have their own Mergers and
Acquisitions (M&A) units. The initiative to make an acquisition is often raised internally, but in
some cases also external parts come with suggestions. The BA is the first instance to approve an
acquisition.
The second instance to approve an acquisition is the HQ. The HQ should be informed and
involved in the acquisition process at an early point. However, at this point, the M&A process is
at a fairly advanced stage and the majority of the potential acquisitions never reach this stage.
The Group Reporting Manager explains that information about acquisitions previously
sometimes has arrived too late to the HQ and that this is the reason for why explicit guidelines
on this matter have been formulated. A rule of thumb is that the larger the planned acquisition,
the earlier the HQ should be involved. A preferable time frame is up to 12 months before a
planned large acquisition.
The pre-notice information that should be provided to the HQ is described in the guidelines and
includes for example strategic reasons for the acquisition, purchase price, PPA plan, conditions
for closing and company structure. In return, HQ has the responsibility to assist the BA and to
make sure that there are no risks for non-compliance with IFRS or other accounting principles
applied by the company. If the acquisition involves complicated issues related to accounting, the
Group Reporting Manager explains that the BA has an extended responsibility to contact the HQ.
The final decision of whether to acquire is made by the board of directors of the group. In
practice, it is according to the Group Reporting Manager seldom that the board rejects a
proposed acquisition as it informally has been discussed prior to the point of decision.
5.1.2.2 PPA responsibilities
When an acquisition has been finalized, the guidelines state that it is the responsibility of the BA
to:
Ensure that a PPA is initiated as soon as possible
Ensure that revaluations from local GAAP to IFRS are initiated
Allocate goodwill to the relevant segments together with the HQ

28
The general rule is that when an acquisition has been made, a revaluation of the assets in the
acquired company should be made. However, the Group Reporting Manager explains that the
group uses the principle of materiality in this case and that sometimes the benefits of
performing a revaluation of the assets are considered to be outweighed by the costs. The
reasoning in the group of whether to perform a revaluation of the assets should according to the
HQ follow the structure shown in Figure 7. If the size of the acquisition is considered to be large
enough, a revaluation is always made. If the acquisition not is considered large enough, the
judgment criteria is instead the size of the difference between the price paid and the original
book values of the net assets of the acquired company. If this difference is large a revaluation is
made but if not, the assets of the acquired company are not revalued and the difference between
the price and the net assets is booked as goodwill. There are no formal numerical limits for
making this decision.
The final decision of whether to perform a revaluation of the assets is taken by the HQ according
to the Group Reporting Manager. The Group Reporting Manager reflects over the fact that it is of
great importance that the HQ monitor the BA:s in this matter. This is since the BA:s have
incentives to avoid revaluations as the BA:s in the short term are charged with the costs of
performing the revaluation and in the long term are negatively affected by the depreciation and
amortization of the increases in value of tangible assets and recognitions of intangible assets
that often is the result of a revaluation.
The Group Reporting Manager explains that even though the booking of goodwill is made at the
HQ, it is the responsibility of the BA:s to, after the acquisition, report how the goodwill should
be divided over the segments and cash generating units (CGU). In this matter, the HQ has no
mandate to affect the decisions of the BA:s, but only to give advice. This division of goodwill is
not fully reported externally.
In the PPA process, the HQ is responsible for the external reporting, the consolidation, the main
contact with the auditors and that the company specific accounting principles are followed. The
HQ also has the responsibility of documenting the acquisition. A binder with information
concerning twelve different areas, such as due diligence, PPA, balance sheet from the acquired
company and acquisition balance sheets, should be created.

29
The Group Reporting Manager explains that even though the BA:s have the formal responsibility
for the PPA, the HQ is very much involved in the process:
Sometimes it feels like I have more contact with the BA:s than with the people at the HQ.
The Group Reporting Manager further explains that as soon as any queries arise, the BA:s
consult the HQ.
5.1.2.3 PPA calculation guidelines
The group guidelines state that the consideration transferred in an acquisition should be
measured at fair value at the acquisition date. Furthermore, a liability for an eventual deferred
consideration should be determined by discounting the amount payable. What is meant by this
is according to the Group Reporting Manager that payments that are planned to be made in the
future should be discounted. The Group Reporting Manager further informs that this is nothing
that the group has been doing so far and that there has never been a case where the planned
deferred payments have not been paid.
The guidelines describe a four-step process for preparing the consolidated balance sheet after
an acquisition. It is stated that this process can be based on the balance sheet of the acquired
company. The first step in the PPA process concerns reclassification of the acquired company’s
balance sheet items to the group format. The second step is to identify any differences between
local GAAP and IFRS in the acquired balance sheet and to make adjustments when necessary.
The third step concerns identifying and making adjustments for differences between reported
IFRS values and fair values. As the third step corresponds to the focus of this thesis, emphasis
will be put on issues covered in this step. The fourth and final step concerns the consolidation of
the reclassified and adjusted balance sheet of the acquired company. The consolidation is made
by the HQ. A thorough documentation of the PPA, expressed by a ten point list, is required by
the guidelines.
In the PPA process, the guidelines suggest that fair value adjustments in practice often occur for
the following items:
Buildings
Land
Plant and machinery
Inventory
Pension obligations
Intangible assets
Three general valuation approaches are presented in the guidelines for estimating the fair value
of tangible assets and the Group Reporting Manager explains that these methods are extracted
from audit firm guidelines. The market approach is suggested for real estate, machinery and
equipment, the income approach for office buildings and production lines and the cost approach
for industrial buildings, special designed assets and high number of assets.
The guidelines prescribe that the assessment of buildings and land preferable should be made
by an external real estate valuation institute. Since this is a costly process there is however
always, as explained by the Group Reporting Manager, a question of whether the benefits
exceed the costs. The Group Reporting Manager does not know how often an external part is

30
consulted but states that it is dependent on which company that is acquired. The Group
Reporting Manager believes that the BA:s often have an already established contact with a
valuation firm in the countries where many acquisitions have been made. The choice of external
part is decided by the BA in consultation with a Country Financial Manager. Each country where
the company is present has a Country Financial Manager that due to experience of the country
and its accounting rules has a good knowledge of country specific matters. The Country
Financial Managers are often recruited locally and work as consultants that are of great
importance for both the BA:s and the HQ.
Even though the guidelines state that higher fair values than reported values are rare for plant
and machinery, they also state that these assets should be revalued internally by the business
area. However, how this valuation should be done is not explained. The Group Reporting
Manager does not know how this is done in practice but points to the fact that there often is an
internal knowledge of these assets. Technicians are included in the PPA teams and these types
of assets are often sold at market prices within the group. In some cases, external valuations of
plant and machinery have been made according to the Group Reporting Manager.
Inventory should be valued differently depending on the characteristics of the inventory item.
Finished goods should be valued at selling prices less costs to sell and less a reasonable profit.
The same holds for work in progress items, with the addition of deducting costs to complete.
Raw material should be valued at current replacement costs. It is also stated that due to the
complexity of the inventory valuation, this area need thorough discussions. The Group
Reporting Manager states that inventory is even closer than plant and machinery to the core
business of the company and thus that the internal knowledge is even better for inventory
valuations.
How pension obligations should be valued is not stated in the guidelines. Together with
financial instruments and taxes, pension obligations are according to the Group Reporting
Manager a signal that the HQ is to be consulted. HQ has specialists in these complex areas and if
the HQ are not contacted by the BA:s after an acquisition, they contact the PPA teams to make
sure that the fair value adjustments of these assets are made correctly.
Hidden assets and liabilities are also mentioned in the guidelines as items that should be
recognized at fair values. As stated by the guidelines, this could for example be intangible assets
such as customer lists, contracts and trademarks. In connection with this information it is in the
guidelines stated that the PPA is normally prepared by external advisors. The Group Reporting
Manager explains that what is meant by this is that intangible assets preferably should be
valued externally as the competence for doing this often does not exist within the group.
External valuation also implies objectivity. However, in some cases where the BA:s claim to have
the competence, the BA:s find it unnecessary to pay for the service of external valuation and do
the valuation themselves according to the Group Reporting Manager.
The Group Reporting Manager explains that a general group principle is to be cautious towards
intangible assets, both concerning the recognition and the estimation of useful life. Material
substance is required to be able to record these assets and limitations for the useful life exist. As
an example, to be able to capitalize development costs or IT software, group materiality is set to
be equivalent to 5 MSEK. The reason for the cautiousness is that there is a great amount of
ingenuity for activating intangible assets in the operating functions in order to minimize the

31
costs. However, that a low amount of intangible assets after an acquisition results in low
numbers of amortization is nothing the Group Reporting Manager thinks that the BA:s take
advantage of.
In comparison to the principle of cautiousness concerning intangible assets, the guidelines
concerning intangible assets also state that the identification of intangible assets needs to be
more stringent in an acquisition than if they would be internally generated. What is meant by
this is according to the Group Reporting Manager that more intangible assets should be
recognized today when IFRS 3 is applied in comparison to before applying IFRS.
Examples of how intangible assiets should be valued according to the group guidelines are
shown in Table 2.
Approach Method Examples
Market approach
Brands and trademarks
Customer lists
Income approach Relief from royalty method Brands and trademarks
Technology
Software
Multi-period excess earnings Customer relationships
Order backlog
Technology
Internally developed assets
Incremental cash flow method Brands and trademarks
Technology
Direct cash flow method
Cost approach Reproduction costs method Internally developed assets
Replacement costs method Customer lists
Software
Table 2
The Relief from royalty method determines the present value of the intangible assets based on
the cost savings realized through ownership. The Multi-period Excess Earnings Method (MEEM)
calculates a present value by excluding a proportion of the cash flow that is assigned to other
assets that the intangible asset needs in order to generate cash flows. The Incremental cash flow
method calculates a present value of the extra cash flow that arises due to the intangible asset.
Even though all these methods are extracted from an audit firm, the Group Reporting Manager
explains that all methods are used in the group and believes that the MEEM is one of the most
common methods.
Even though the Group Reporting Manager states that valuations in an ideal situation should be
made on each particular asset, the group is often forced to conduct valuations on a higher level,
such as the segment. If the fair value of the intangible assets is not valued by the market
approach, the guidelines state that the value of the asset cannot be so high that it creates
negative goodwill.

32
Contingent liabilities should according to the guidelines be discussed with HQ. Furthermore, the
guidelines prescribe that tax amortization benefits should normally be excluded from asset fair
values as a step-up in fair value is not tax deductible.
The Group Reporting Manager explains that the recommended valuation model for estimating
fair values consists of a five year forecast period together with a terminal value and that the
model is constructed by one of the BA:s. The cash flows should be based on the BA’s business
plans and the Group Reporting Manager states that the HQ is striving for limiting the terminal
values, for example by not allowing a growth rate over three percent.
All fair value adjustments arising in the PPA are pushed down on the legal entities even though
these values often are irrelevant for the entities. The Group Reporting Manager explains that
this is a new practice within the group and that the legal entities in some cases are so reluctant
to recognize the fair value adjustments that the HQ is forced to book the adjustments at the
group level. The Group Reporting Manager states that the major benefit with the push down
accounting is that people closer to the operations, and hence better informed about what
happens with the assets, have responsibility for the asset values and to make impairments. This
also implies that the legal entity’s auditor audit the asset value. An exception to the push down
accounting concerns goodwill, which only is placed on the BA level.
Goodwill is in the guidelines defined as a residual value calculated as the difference between the
purchase price and the sum of the individual fair values of the acquired assets and liabilities.
5.1.2.4 Guidelines concerning depreciation and amortization of assets revalued in the PPA
As mentioned above, the group applies limiting rules for how long the useful life for an
intangible asset can be. The guidelines state that capitalized development costs should be
amortized over a period of maximum seven years and that the amortization period for IT
software investments not should exceed three years. If the business area believes that a longer
amortization period is appropriate it needs to be approved by the HQ. The Group Reporting
Manager explains that this is very rare and that a substantial sustainable value needs to be
verified in order to approve a longer useful life. Examples of assets approved to have a longer
useful life are patents and other assets with a legal base. On average, the Group Reporting
Manager estimates that the useful life is between three and five years. The Group Reporting
Manager also states that almost all assets are depreciated and amortized linearly as it is the
default depreciation/amortization pattern. If the useful life of an intangible asset should be
considered indefinite, HQ has to be consulted.
5.1.2.5 Guidelines concerning impairment testing of goodwill and assets revalued in the
PPA
The group guidelines covering impairments state that if possible, impairment tests should be
done at the individual asset, and if not possible at the smallest group of assets that generate
independent cash flows, i.e. CGU:s. To illustrate the notion of CGU:s, an example with two
different products is provided in the guidelines. If these two products share any machine, the
impairment test should be done for both products together, whereas if the products do not
share any machine, it is probably possible to do the impairment test on each individual product.
Another rule of thumb stated is that if one can identify a business result, it is likely that one can
calculate a separate cash flow. In most cases, the CGU:s are according to the Group Reporting

33
Manager identical with the segments. As stated in the guidelines covering impairments,
goodwill should not be allocated to a unit larger than a segment.
The Group Reporting Manager explains that each segment has one person that is responsible for
the impairment testing and that this also is the level where the impairment tests generally are
made. If the calculation shows a need for impairment, the BA should be contacted. However, the
majority of the segments has not done any acquisitions and does hence not have any goodwill or
any in an acquisition revalued assets.
In addition to annual impairment tests, the guidelines give examples of indicators that should
cause an impairment test:
Internal changes, for example restructuring of operations or the asset becoming idle
Declining market value
External changes, for example technical or legal
Increases in market rates that affect the discount rate
The guidelines state that the best method for calculating a value for impairment testing is
market value less costs to sell. However, it is also noted that the most commonly used valuation
method of the recoverable amount is the value in use method based on discounted expected
future cash flows.
The group has a general excel model that should be used to test whether tangible and intangible
assets with an indefinite life need to be impaired. In the model, future free cash flows (FCF) are
calculated as follows:
The estimation of the four components is simplified by calculating the four components of free
cash flow for the previous three years and using these figures as reference points. When
estimating the terminal value, the guidelines state that the forecasting of the EBIT-margin
should be conservative, that the estimated capital expenditures should be almost equal to the
last explicit year and that the working capital is restricted to the same amount as the last
explicit year. The guidelines state that a maximum of five explicit years should be used unless a
longer period can be justified and the excel model distributed to the BA:s is built in accordance
with this reasoning. The guidelines state that the discount rate should reflect the risk specific for
the assets. However, in the model, it is stated that the discount rate is given by the HQ.
If the impairment test concerns an intangible asset with an indefinite useful life or goodwill, HQ
should be contacted.
5.1.2.6 Evaluation within the group
In order to reach the, in the annual report stated, target of a ROCE of 25 percent, the Group
Reporting Manager states that the BA:s are evaluated monthly on income and net working
capital and quarterly on full financial reports. However, from the year of 2012 full financial
reports will be demanded each month to fulfill the key ratio demands from the board of
directors. How the group’s incentive systems are constructed is nothing the Group Reporting
Manager wants to comment upon.

34
As stated by the Business Controller of BA A, all segments of BA A are currently evaluated on the
same measures, mainly EBIT margin and an economic value added measure, despite the fact
that the segments ideally should be evaluated based on their specific characters. For example,
the Business Controller suggests that EBIT margin might not be the optimal measure for a raw
material unit. Due to this, BA A is currently considering revising the key measures.
The segments of BA B are according to the Executive Vice President Finance (Vice President) of
BA B evaluated based on the general financial performance, both with regards to the income
statement and the balance sheet. As pointed out by the Vice President, the board is primarily
evaluating BA B based on organic growth and return on capital employed. Hence, these KPI:s are
also important when BA B evaluates its segments. However, the incentive system of the BA B
segments is based on EBIT margin and cash conversion size.
Also BA C focuses the evaluation of its segments on the same measures that BA C itself is
evaluated upon: organic growth and return on capital employed externally, and EBIT margin
internally. The Financial Control Manger of BA C also mentions net working capital divided by
revenue as an important measure. Bonuses of higher management in the segments are based on
the mentioned measures, and differ somewhat between the years.
The Business Controller of BA A states that the original management in the segments and
acquired companies often are reluctant to be measured on ratios affected by numbers arising as
a consequence of the acquisition, such as goodwill impairment and fair value
depreciation/amortization. Hence, this is something the Business Controller considers
important to have in mind.
5.1.3 Acquisition descriptions
Four specific acquisitions have been studied, in this thesis referred to as the acquisition of
Company 1 (C1), Company 2 (C2), Company 3 (C3) and Company 4 production facilities (C4pf),
where the acquisition of C1 has the largest consideration transferred and the acquisition of C4pf
the smallest. Further figures concerning the acquisitions are shown in Table 3.
Acquisition C1 C2 C3 C4pf
Percentage acquired 100% 100% 100% 100%
Previous ownership 0% 49% 0% 0%
Year of acquisition 2009 2007 2007 2008
Acquiring Business Area A B B C
Consideration transferred in relation to C1 100% 9% 5% 3%
Revenue the year prior to the acquisition (MSEK) 2000 600 70 150 Table 3
5.1.3.1 Acquisition of C1
In 2009, BA A acquired 100 percent of one of their suppliers. The acquisition was of a highly
strategic character as it secured the access to a, of BA A, crucial raw material that otherwise
would be in full control by the Chinese market. Since BA A considered the Chinese market to be
politically unstable, an acquisition of this type of company had been planned for a while. The
reason for choosing C1 was that it was the largest company within its business and the
acquisition both complemented and strengthened the operations of the BA. Prior to the
acquisition the acquired company was owned by its management, the majority by the founder

35
that wanted to retire and lacked an obvious successor. BA A was the only potential buyer and
the acquisition was considered natural as BA A was C1:s largest customer. The year prior to the
acquisition, C1 had revenues of approximately 2000 MSEK.
The intention of BA A was to let C1 continue to operate as an independent unit, thus supplying
the BA:s competitors with material. However, the Business Controller of BA A points out that
the group always has a choice of terminating the supply of raw material to the competitors of
BA A.
The implementation of C1 has been very successful and the profitability has been higher than
expected. One of the reasons for this is the unexpected increase in the price of the raw material
extracted.
5.1.3.2 Acquisition of C2
C2 was founded in the beginning of the 21th century by three entrepreneurs. As these three
entrepreneurs wanted to buy the majority of their machinery park from the case group, the
group was offered to make an initial investment in the start-up. According to BA B´s Vice
President, the investment, resulting in a 49 percent share ownership, was minor in monetary
terms. At the initial investment, a pre-emption agreement was signed stating that when C2 had
reached a certain size, the case group would have the possibility to increase their ownership in
the company to 100 percent. However, when the group in 2007 decided to acquire one of the
three largest players on this market, operating in the same country as C2, a discussion with C2
was initiated. As C2 was both a competitor and a complement to the other acquired company in
the country, it was seen as suitable to also fully acquire C2. The acquisition of C2 was made
parallel to the acquisition of the other company and seen as a strategic acquisition that enabled
BA B to take a leading role within its specific market segment. The year prior to the acquisition
of the final shares in the company, C2 had revenues of 600 MSEK and the holdings were
recorded as an associated company of the group.
The Vice President of BA B states that during the first two years, C2 performed positively in line
with the expectations. Even though the operations then were cut down almost 50 percent due to
the global financial crisis, the segment has continued as a strong player on the market.
5.1.3.3 Acquisition of C3
In 2007, BA B concluded that they lacked one type of company in the long term strategy of one
of their segments. BA B could only identify one company with the potential to fill this hole and
as BA B already functioned as the sales channel for this company, the acquisition of C3 in 2007
was a natural acquisition that was expected to both give rise to synergies and to complement
the product offering of BA B. The acquisition was considered as very small and in 2006 the
company had an annual turnover of approximately 70 MSEK.
According to the former CFO of BA B, the integration of C3 was very simple due to the
company’s small size and the company has been able to deliver in line with the expectations.
5.1.3.4 Acquisition of C4pf
For several years, the group has been operating as a materials provider within a specific
industry. This industry was in 2007 considered as one of BA C’s areas where the highest growth
and future profitability would occur and several companies were bought within this sector. To
increase the growth rate, BA C decided to take the next step in the value chain and thus start

36
producing the products within the industry. As the risk within the sector was considered to be
too high for the group, BA C searched for ways of mitigating this risk while still exploiting the
profitability of the sector. In 2008, BA C therefore acquired 100 percent of a production facility
owned by C4 that provided the C4 group with products. The acquisition contract included a
section stating that as long as BA C followed C4:s instructions, no risk would be placed on BA C.
In addition to increasing the BA C growth, C4pf was also seen as a good complement to the
already existing portfolio of BA C. The year prior to the acquisition, the C4pf had sales of
approximately 150 MSEK.
The Business Controller of BA C states that at the point of the acquisition, the C4pf was
considered to be a bargain. However, what was not revealed during the Due Diligence process
was that the production costs were considerably understated by the C4 group. Six months after
the acquisition BA C realized that with the agreed selling prices to the C4 group, BA C was not
able to make a profit. Due to this, BA C forced C4 to renegotiations of the prices resulting in a 30
percent price increase both retrospectively and for the future. The Business Controller explains
that the renegotiation was good in the short term as it created a profit. However, in a medium
time perspective, the renegotiation was a disaster as it destroyed the relationship with the C4
group, resulting in lower sales for the C4pf as the C4 group bought as much as possible from
other producers. However, the Business Controller of BA C informs that fortunately the
relationship between the parties has improved lately.
5.1.4 Allocation of the consideration transferred
5.1.4.1 Payment of the acquisition
In order to put pressure on the owner of C1, it was decided that the purchase price of C1 should
be paid in eight installments over 21 months. The Business Controller of BA A explains that
yearly installments are booked as individual investments the year the payment is done. Thus, it
appears as if new acquisitions are made every year. The Business Controller continues by
stating that he would have preferred a single investment post in the cash flow statement and the
installments booked as financial operations. Due to changes in currency rates, the deferred
payments have resulted in currency gains in the currency translated consolidated financial
accounts. However, the PPA is booked in the purchase price currency and is thus not affected by
currency changes.
Neither was the payment for C2 fully made at the time of the acquisition. Instead it was decided
that the payment should be distributed over the eight upcoming years, with the majority being
paid during the first three years. In order to avoid currency effects on the consolidated goodwill
item, the deferred payments were hedged.
The consideration for C3 was paid in cash. However, 15 percent of the consideration was held as
a retention sum to be released if no claims were made against the sum. The former CFO of BA B
confirms that no claims were raised.
In the case of C4pf, the total sum was paid in cash at the time of the acquisition. The
consideration transferred was however adjusted in the final PPA compared to the preliminary
PPA. The Group Reporting Manager believes that this was due to difficulties of interpreting the
contract. Sometimes it can be so hard to interpret contracts that one does not really understand
the full meaning of the purchase agreement until at a later stage and then consequently has to
adjust the purchase price.

37
5.1.4.2 Involvement in the PPA
The Business Controller at BA A and the Business Controller of BA C point out that it is the BA:s
that perform the PPA. However, HQ has the ultimate responsibility for the figures presented to
the financial market and according to the Vice President of BA B this results in that they also
have the final say in all PPA decisions. In addition to approving the PPA, HQ can also function as
a sounding board for the BA throughout the PPA process. The Vice President of BA B states that
this is particularly evident in the case of financial assets and pension obligations but that these
issues also can be discussed with specialists. Furthermore, the HQ function of a sounding board
may also be applied when the BA:s face difficulties in how to apply new standards. This was for
example the case for C2.
The valuation of C1 was made fully internally by the Business Controller of BA A. The Business
Controller considers internal valuation to be ideal as, from his point of view, external valuation
firms tend to use a very standardized framework in the PPA valuation. This would result in
recognitions of intangible assets that are very general. In comparison to external valuation
firms, the Business Controller claims to have a better understanding of why companies such as
C1 are acquired, resulting in a PPA reflecting the underlying reasons for the acquisition in a
better way. The Business Controller does not consider the PPA calculations to be very
complicated and rather suspects that valuation firms describe the process as complex in order
to get clients. However, the original PPA calculations made for C1 by the Business Controller
were not approved by the HQ and the auditors since they did not include any recognition of
intangible assets. The Business Controller claims that the highly strategic characteristics of the
acquisition motivated a high level of goodwill but that there are external expectations on the
allocation proportions of the consideration transferred that has to be fulfilled.
The acquisition of C2 was made right after the introduction of the new IFRS 3 and it was the first
PPA that BA B conducted in the manner they do today. In the PPA process, BA B consulted the
transaction service unit of the group’s auditor, both in Sweden and in the country of the
acquisition. It had previously been discussed with the HQ whether it would be appropriate to
use parts of the audit firm for other services than auditing and it was decided that as long as
different units of the audit firm were used it would be considered as appropriate. The role of the
audit unit of the audit firm was limited to the annual auditing and they were hence not involved
in the acquisition process. As also the transaction service unit had minor experience in applying
the new standards, a new model was created based on both the BA’s and the transaction unit’s
knowledge. While both BA B and the transaction unit were involved in the valuation part, the
transaction unit focused on the detailed information and the balance sheet while the BA B
contributed with knowledge about the acquisition. After a model was created, a process of
iterations concerning the valuations was initiated between BA B, the external transaction unit in
Sweden and the transaction unit of the audit firm in the acquisition country. Due to the
uncertainty of how to apply the new standards, BA B also had a continuous dialogue with the
HQ concerning how to value customer relations.
As the country where the acquisition of C3 was made is an important market for BA B, the BA
has competent personal knowledgeable in accounting located in the country. The former CFO of
BA B explains that as the acquisition was of minor size, the local personnel were conducting
most PPA calculations. In cases of larger acquisition characterized by a higher degree of secrecy,
local offices cannot be used to the same extent as for C3, as then only a few people are intended
to be involved in the preliminary PPA. Hence, centralization increases. However, when

38
acquisitions characterized by a higher degree of secrecy have reached a later state and are
official, more parties can be involved in order to get more reliable valuations. The former CFO of
BA B reflects over the fact that this often results in revisions of the preliminary PPA.
The valuations of C3 were made in cooperation with an external valuation firm in the country of
the acquisition. The former CFO of BA B explains that the BA:s have no restrictions when it
comes to the choice of the external valuation firm except for being cautious to not use the group
audit firm in too many consultancy cases. Important factors in the choice of external consultants
are according to the former CFO previous relationships, confidence and competence within the
specific area. The C3 valuation assignment was rather small, but in larger cases BA B sometimes
collects price offers from different firms before choosing the external part.
In the preliminary PPA calculations made after the acquisition of the C4pf no assets were
revalued or recognized. The Business Controller of BA C confirms that the discussions of
whether to perform a revaluation correspond to Figure 7 but that the final decision of whether
to perform a revaluation of assets generally is made by the HQ. In the case of the C4pf, the Group
Reporting Manager at the HQ and the person responsible for the PPA knew each other as they
previously had been working together at the same office, why the decision was taken by the HQ
and BA C in coherence. In the final PPA, it was decided to revalue the machinery and when doing
this, neither an external valuation firm nor the auditor was consulted.
5.1.4.3 PPA calculations
The PPA:s of the four acquisitions resulted in fair value adjustments of tangible assets, new
intangible assets and residual goodwill in relation to the consideration transferred according to
Table 4.
Acquisition C1 C2* C3 C4pf
Revaluation value of TA/Consideration transferred 13% 0% 0% 1%
New IA/Consideration transferred 8% 86% 40% 0%
Goodwill/Consideration transferred 51% 19% 37% 12% Table 4
*The reason for a total percentage exceeding 100 percent is due to DTL:s.
The C1 PPA calculations led to positive fair value adjustments for buildings, inventory, rights,
know-how and technology. The buildings fair values were based on the insurance values as they
were considered to be good indicators of the fair values and the amounts recorded were
calculated by multiplying the current insurance values with the ratio between the previous book
values and the historical acquisition costs of the buildings. Inventory was valued to selling
prices without deductions. The Business Controller of BA A states that the inventory rule is an
insane rule as it results in zero profit during the period after the acquisition when the old
inventory is sold.
Rights, know-how and technology of C1 were valued by standard DCF models without terminal
values. The exclusion of terminal values is motivated by the fact that these assets only are useful
for a limited period. The rights were restricted to a period of five years but since there was raw
material for at least 20 years, the DCF calculation and hence the useful life was based on this
number of years. The cash flows were estimated as the difference between the current raw
material price and the extraction costs. As there is a limit on how much raw material that can be

39
extracted from the mine, no growth in cash flows was assumed for the mine. The know-how and
the technology were the assets that were recognized in the later stage in the PPA process. For
these assets, a useful life of 10 years was assumed based on a discussion with several persons
concerning for example for how long previous techniques had been used.
The C2 PPA resulted in recognition of three intangible assets: a brand, customer relations and a
backlog. When calculating the value of the customer relations, 90 percent of the customers were
assumed to be regular buyers. This percentage was however assumed to decline by 10 percent
yearly. The order backlog was valued as the gross profit in the backlog at the point of the
acquisition. It corresponded to approximately four months of sales.
At the time of the final acquisition of C2, the Vice President was not aware of any explicit
guidelines from the HQ concerning how long the useful life for intangible assets should be. Thus,
this was decided in a discussion between BA B, the HQ and the external valuation firm. The
estimates were based on their previous experience and expertise. The order backlog was
amortized during the backlogs useful life, thus a very short period.
The Vice President of BA B considers the cash flow estimations the hardest part in the PPA
process as, in relation to estimating the WACC and useful life, estimating cash flows is less
mechanical. Furthermore, cash flows also have a major impact on the final estimated value.
When estimating cash flows when calculating the fair values of the intangible assets of C2, the
estimations of the future EBIT margin was based on the historical performance and the
calculations made in the due diligence. The EBIT margin was estimated to increase in the future
due to a forecasted higher increase in sales than increase in fixed costs. The estimation of the
sales growth was a conservatively adjusted historical growth.
The fact that the group previously had a 49 percent share in the company complicated the C2
PPA process. Most problematic was the question of whether to revalue the previous stake or to
use the investment value transferred in the start-up. This was especially important in this case
as the book value of the first 49 percent was considerably lower than the consideration
transferred 2007. Additionally, there were no precedents in this area. In the end, the decision
was taken not to revalue the first 49 percent.
The external valuation firm consulted after the C3 acquisition was instructed that plant and
equipment should be assumed to have a fair value equal to its written down book value. The
former CFO of BA B explains that this judgment was made by technicians within BA B and that
this is an area where BA B in general has better knowledge than valuation firms. However, the
former CFO highlights that it is important that the external consultant take a critical perspective
and consider the plausibility of the assumptions made by the BA as many assumptions in the
calculations are based on the group’s expectations which after an acquisition naturally are high.
The C3 PPA resulted in fair value adjustments of the inventory and intangible assets. However,
in the final PPA, the inventory adjustment was not included. No one can remember why this was
the case, but several possible explanations are presented. The former CFO of BA B suggests that
it might be due to an almost immediate depreciation of the adjustment. The Group Reporting
Manager suggests that either the BA did not agree with the assumptions made by the external
valuation firm or elements of the final PPA are made incorrectly.

40
The intangible assets identified in C3 consisted of the brand name and two intangible assets for
the product ranges. The intangible asset for each product range was not further divided as the
external valuation firm considered an aggregation to give a better reflection of how the
intangible assets were used in the business. It is noted in the PPA that the aggregation consisted
of patents, technical knowledge, designs and trade names and the former CFO points out that it
was the product ranges that were the reasons for acquiring C3. When valuing the product
ranges and the brand, explicit forecasts based on the sales expectations of the group were made
for 5.5 respectively 15.5 years as these times were considered the useful lives of the intangible
assets. No terminal values were used. The useful lives were estimated by BA B and the former
CFO of BA B states that no permission from the HQ was asked for when choosing a useful life of
15.5 years for one of the product ranges and the brand. The external valuation firm used the
income approach when valuing the intangible assets. The brand was valued by the Relief from
royalty method, assuming a two percent royalty rate. The MEEM as mentioned by the Group
Reporting Manager is no method that the former CFO of BA B is acquainted with.
No DTL:s were recognized in connection with the recognition of the C3 intangible assets. The
former CFO of BA B explains that this was due to country specific tax rules that for example
allowed deductions of the fair value adjustments. The Group Reporting Manager explains that
this type of rules are very rare and that DTL:s are recorded in most cases.
Two other intangible assets were also identified in C3 in addition to the two product ranges and
the brand. However, after the external valuation firm had valued these projects with the cost
approach the projects were considered minor and thus immaterial. Consequently, they were not
recognized. Other intangible assets such as customer lists, proprietary software and distribution
networks were also considered to have immaterial value. As an example, the former CFO of BA B
mentions that the customer base was almost identical to the BA B customer base as they were
already selling the products of C3. The former CFO of BA B mentions two criteria that have to be
met in order to be able to recognize an asset. Firstly, the value has to be material. Secondly, a
sufficient degree of certainty has to be established for the future cash flows. The external
valuation firm states in their report that they use materiality level of in SEK approximately 6
million.
As with the value of the consideration transferred, the book value of the acquired net assets was
also changed between the preliminary and the final PPA of C4pf. The Group Reporting Manager
explains that at an early stage, the group has to rely on what the acquired company tells the
group. When the group, in a later stage, gets hold of the company’s books there are often
adjustments necessary due to accounting principles that the acquired company did not realize
were different from the group’s. The Business Controller of BA C states that when making the
final calculations, BA C is much more informed about the company, for example due to local
controllers and visits to the company, why revaluations can occur. One further issue of why
there might be changes in the preliminary PPA is strategy changes. As an example, an asset not
part of the future strategy is given a value of zero.
The simplified revaluation process of the C4pf resulted in that no external valuation firm was
consulted and that no intangible assets were revalued. In a later stage it was apparent that a fair
value adjustment of the machinery had to be done. The revaluation of machinery was not done
based on a DCF but rather by making a personal judgment. The Group Reporting Manager
explains the reason for not doing a DCF was due to materiality; machinery of 800 KSEK was not

41
considered to be large enough. Materiality considerations were also the reason for not
recording any DTL on the fair value adjustment of machinery.
The Financial Control Manger of BA C expresses the opinion that in connection with an
acquisition it can be beneficial to not be conservative when recognizing intangible assets that
can be amortized. In this manner, the goodwill items are kept at a lower level and the likelihood
of the unfavorable situation of doing large impairments will decrease. This opinion is
contradicted by the Business Controller of BA A who personally prefers to recognize everything
as goodwill in order to avoid amortization of intangible assets.
The Business Controller of BA A reflects
upon a possible tactic for increasing the
balance sheet values after an acquisition.
By recognizing intangible assets resulting
in DTL:s, the value of total assets increase
by the amount of the DTL as illustrated in
Figure 8. As the DTL:s are booked at the
level of the group together with all tax
posts, the DTL:s are not visible at the level
of the BA, something the Business
Controller of BA A questions. Despite this
possibility, the Business Controller has
not seen any signs of this tactic being
used in the group. In contrast, the
Business Controller of BA C states that
DTL:s are booked at the BA, but that the
BA does not consider these as important
as they are evaluated on the EBIT
measure. The Group Reporting manager informs that DTL:s can be seen at the level of the legal
entities but that no unit or segment evaluation is affected by DTL:s. This is something the Group
Reporting Managers consider to have both advantages and drawbacks.
When DTL:s are calculated, all BA:s use a tax rate based on the tax rate in the country where the
acquisition is made.
5.1.5 Impairment testing, depreciation and amortization of goodwill and assets revalued
in the PPA
All BA:s are depreciating and amortizing all assets revalued in a PPA linearly. This is seen as the
default case and as the Vice President of BA B states it is hard to motivate any other
depreciation/amortization pattern. Neither one of the Business Controller of BA A, the Vice
President of BA B nor the Financial Control Manager of BA C is aware of any intangible assets
with an indefinite useful life.
At the annual impairment testing, it is the CGU:s that are tested and not any specific asset such
as goodwill or intangible assets. However, as it is the value of goodwill that is reduced first when
an impairment is made, these tests are often referred to as goodwill impairment tests. The
Business Controller of BA A mentions that the guideline of contacting HQ when testing goodwill
is nothing that the BA has to consider as HQ will make contact themselves.
42
Individual assets and companies being part of a CGU are only tested if there are indications that
impairment tests are necessary. One occasion when the value of an individual asset had to be
revalued was when it was decided that the brand of C2 would be replaced by the group brand. It
was then obvious that the useful life of the brand no longer would be the previously estimated
ten years and the useful life was consequently shortened to five years. The former CFO of BA B
can on the other hand not remember any occasion where an individual asset has been tested.
The Financial Control Manager of BA C explains that if an individual company performs poorly,
that company will be tested for impairment individually. The Vice President of BA B points out
that even though the group standards state that goodwill should be impaired before any other
asset in the CGU, this is not always the case in practice.
5.1.5.1 Responsibilities
The Business Controller of BA A and the Vice President of BA B inform that it is the BA that has
the responsibility and makes the calculations in the impairment testing process. However, there
is a continuous dialogue with the segments. The Financial Control Manager of BA C explains that
at BA C, it is the person closest to the operational activities that conducts the impairment test,
hence the person responsible for the unit or the individual company. When the unit responsible
has done the impairment test, the calculations are handed over to BA C.
The by the BA suggested calculations are handed over to the HQ, who takes the decision of
whether to go through with the impairment. Furthermore, the Business Controller of BA C
explains that all impairments of greater importance in practice have to be approved by the CEO
or CFO.
The Financial Control Manager of BA C explains that at BA C, impairment tests are conducted
and the outcome discussed with the auditors a few months before the annual revision is made
to make sure that no disagreements arise between the BA and the auditors in the annual
revision. If the probability of an impairment is considered to be substantial, the impairment test
is initiated earlier in the financial year in order to have time for a thorough discussion with the
auditors. Of particular interest to the auditors are always the goodwill items.
5.1.5.2 Model used for impairment testing
When testing for impairments, the group has one standardized excel model that is distributed
within the group. Both the Business Controller of BA A and the Financial Control Manager of BA
C explains that when using this model, a five year explicit period plus a terminal value is used.
The underlying reasoning of the impairment testing model is similar to when performing a PPA.
However, one difference is that the PPA valuations are more detailed as they for example
distinguish intangible assets from goodwill. The Business Controller of BA A also believes the
risk consideration concerning taxes to be somewhat different when doing impairment testing as
compared to when making the PPA valuations. The Group Reporting Manager is not familiar
with this difference. Market values were not used in the impairment testing for any of the case
acquisitions.
The Vice President of BA B reflects over the fact that it is the assumptions concerning the
perpetual growth rate and the EBIT margin that are the most critical estimates in the
impairment testing process. To mitigate the difficulties of forecasting, the EBIT margins are
based on the business plans and a specific BA B principle that states that exceptionally good
arguments has to be raised in order to be able to have a perpetual growth rate of over 2 percent.

43
At BA A, the growth rate in the terminal value is commonly 3 percent. The Business Controller
of BA A does not mention this as an explicit rule from the HQ but rather states that the rate has
to be higher than the inflation. It is also explained that this is a rate often questioned by the
auditors. The Financial Control Manager of BA C states that also BA C uses a 3 percent perpetual
growth. In this case, it is however a result of the guidelines issued by the HQ.
An area that sometimes causes problems when doing impairment testing is according to the
Business Controller of BA A transfer prices. Transfer prices biased due to local taxes are
adjusted in the impairment testing, but discussions sometimes arise.
5.1.5.3 Definitions of CGU:s
If possible, the CGU:s are at all BA:s defined at the level of the segments and thus below the BA:s.
For BA A there are five impairment tests made on the segment level, of which C1 is one. The
remaining part, which according to the Business Controller of BA A constitutes the majority of
the tested value, is tested at the level of the BA. The reason why C1 is tested separately is that it
is fully separable from BA A’s other operations.
BA B has currently two CGU:s at the level of the segments. The residual value is tested at the
level of the BA. The former CFO of BA B reflects upon the use of a relatively low number of CGU:s
when stating that since the intention of an acquisition generally is to complement, rationalize
and create synergies, it is natural that an acquired company becomes part of a larger CGU soon
after the acquisition.
C2 was the year after the acquisition considered a standalone CGU, but since the year of 2009 C2
and the parallel acquired company have been treated as one CGU due to the merging of their
operational activities. They are today one of the two CGU:s at the level of the segment. According
to the Vice President of BA B, the critical event for when the two companies were started to be
treated as one CGU was when the production and the product development were merged. At
this point, it was no longer possible to distinguish what products and hence income that
belonged to which company. The sales units for the different companies were integrated at a
later point. C3 has since the acquisition been part of a larger CGU and is today part of the second
CGU on the segment level.
The Financial Control Manager of BA C explains that at BA C there is only one CGU at the level
below the BA that is tested as a separate CGU. C4pf is one of three acquisitions that belong to
this unit.
Both the Business Controller of BA A and the Financial Control Manager of BA C state that it
would probably be possible to define more CGU:s. However, even if considered as theoretically
preferred, the current CGU structure has been chosen for practical reasons.
5.1.5.4 Impairment testing in the cases
Since the acquisitions were made, no impairments have been made in any of the studied cases.
For C2, this is despite the fact that the CGU not has performed in line with expectations. The
Financial Control Manager of BA C states that this is since the BA still sees the potential of the
CGU and believes that the unit has the knowledge to perform better in the future.

44
For the case acquisitions’ CGU:s, the ratio between the calculated values in use, used in the
impairment testing 2008, and the 2008 book values was 130 percent, 250 percent and 270
percent.4
Worth to notice is that in the 2008 impairment testing, all terminal values for the studied cases
exceeded 50 percent of the total value of the discounted cash flows.
Even though no impairments were made for C2 during the financial crisis between 2007 and
2009, the Vice President of BA B mentions that the crisis was reflected in the estimates. The
expectations from before the financial crisis were postponed about five years and thus the crisis
had large impacts on the DCF valuations. However, the Business Controller of BA A, the Vice
President of BA B and the Financial Control Manager of BA C are all agreeing in that the event of
a financial crisis not necessarily has to result in impairments of goodwill or other assets. They
motivate this by stating that the long term value has to be considered and that the impact of a
financial crisis on this value is minor. However, both the Business Controller of BA A and the
Financial Control Manager of BA C highlights the fact that a financial crisis can be seen as a good
time to conduct goodwill impairments as it is likely to be externally accepted to perform poorly
during crises. By taking impairments during financial crises, one might also avoid to present
poor results due to goodwill impairments when the operations are going well.
5.1.5.5 The goodwill item in the future
The Vice President of BA B states that since relatively few impairments of goodwill today are
done at the BA, the goodwill item is larger than it would have been if the old IFRS standards
with goodwill amortization would have been prevailing. The former CFO of BA B adds that with
the amortization rules it was not a question of if the goodwill item should be decreased but
rather of how much, why the new standards would result in a higher goodwill item. This opinion
is to some extent supported by the Financial Control Manager of BA C who states that a behavior
to defend the goodwill item is likely to be adopted when applying the new standards. However,
the Financial Control Manger expects the impairments to be very large when they eventually are
done, potentially resulting in a long term goodwill value at the same level as before the new
IFRS. Furthermore, the Business Controller of BA A argues that the new standards are likely to
result in that the goodwill item will be hard to assign to a specific unit and consequently become
somewhat unidentifiable.
5.1.6 The group WACC
Many fair value calculations are dependent on a discount rate and the group guidelines state
that this rate should be determined together with the HQ. In practice, HQ provides the group
with the group Weighted Average Cost of Capital (WACC) that is used as the discount rate when
testing for impairments and when evaluating new investments, possible acquisitions and
payment terms. Up until the summer of 2010, different rates were used when valuing payment
terms and assets but as of today only one rate is used in the group.
According to the Head of Group Business Control positioned at the HQ, who is responsible for
calculating the group WACC, the WACC calculations are based on the following formula:
4 Due to the critical character of these figures, the percentages are in the thesis not assigned to the specific acquisitions. It should also be noted that only three of the studied acquisitions had been made at this point, hence only three figures are disclosed.

45
rD is defined as the average group debt rate and D as the value of the group debt. E is defined as
the stock market value and rE is derived using the standard Capital Asset Pricing Model (CAPM):
The risk free rate (rf) is set equal to a ten year Swedish government bond and the beta value (β)
is taken from the Bloomberg database. The Head of Group Business Control informs that the
beta is based on the historical group performance but cannot explain how it is calculated. The
Swedish market risk premium (rM-rf) used is 4 percent and as the Head of Group Business
Control explains, the figure is determined based on professional judgment and only changed if
radical changes are experienced.
HQ estimates both a pre-tax and a post-tax WACC. However, as the Head of Group Business
Control states it is the pre-tax WACC together with pre-tax cash flows that is commonly used in
the group.
Even though the calculations of the WACC are made at the end of every year, the rate used is
seldom changed. As an example, even though the calculated rate in the year of 2010 was
estimated to 10.6 percent it was not considered to be a significant deviation from the 10 percent
WACC in use and the WACC was consequently not changed. The Head of Group Business Control
explains that changes in the WACC have large practical consequences for incentive plans and
other calculations, why rates estimated between 9 to 11 percent would not alter the 10 percent
WACC currently in use.
The HQ argument for using one single rate is that the HQ does not perceive any differences in
the risk and requested return for the different BA:s. No political risk is considered when
determining the discount rate even though the Group Reporting Manager can see a potential
benefit of doing this.
The Business Controller of BA A expresses some objections towards the use of a group WACC.
As it is used as a risk premium, the WACC should ideally be different depending on for example
in which country the WACC is used. Also the Head of Group Business Control is of a similar
opinion when stating that the next step for the group ideally would be to adjust the risk
premium of the WACC in high risk countries. Instead of doing this, the group’s current approach
implies that one has to make qualitative considerations in addition to DCF calculations in high
risk countries. Even though also the Financial Control Manager of BA C reflects upon the fact
that all units of the group does not carry the same risk, the Financial Control Manager raises the
question of whether the complexities of using case specific WACC:s would be larger than the
benefits of more accurate calculations. In the long term, the results of using a too low rate in
some cases and a too high rate in other cases might even out. The Head of Group Business
Control also points out that a single group WACC is common practice among similar groups
within the industry.
The Business Controller of BA A explains that the group WACC is used for internal as well as
external calculations. Furthermore, the Business Controller believes that this rate also is given

46
as a presumption when valuations are made by external consultants. However, the former CFO
of BA B states that external valuation firms use rates based on publicly available market
information rather than the internal expectations that the group WACC is based on. In the case
of C3, the discount rate used by the external valuation firm was a post tax company specific
WACC on 12.5 percent. When valuing the customer contracts and the brand a 0.5 percent higher
discount rate was used as those assets were considered to have a higher risk.
5.1.7 Disclosures in the Annual Reports of the PPA process and the impairment testing
In the Annual Reports from 2006 to 2009, the group does not disclose the individual PPA:s for
each acquisition. Instead, the aggregated PPA for each BA is presented. The given reasons for
recognizing goodwill are the same for all years.
How the goodwill is tested for impairment is described in detail by for example mentioning the
model with five explicit years and a terminal value, the 3 percent maximum of the steady state
growth and the WACC used. As explained by the Business Controller of BA A, the division of
goodwill is for all material CGU:s disclosed for BA A. For BA B and BA C, all CGU:s are disclosed
together with their amounts of goodwill. The description of how other intangible assets are
tested for impairments is less extensive in comparison to the description of the goodwill testing.
Whereas impairments of intangible assets are shown under the heading Accumulated
amortization and impairment losses in the Annual Report, impairments of goodwill are shown in
connection with the acquisition costs of the assets.
5.1.8 The reflection of the characteristics of the acquisitions in the accounting
The Vice President of BA B generally considers that the application of IFRS/IAS gives a good
picture of acquired companies. What the Vice President considers to be the hardest asset to give
a fair value is unpatented technology.
Concerning the acquisition of C1, the Business Controller of BA A considers the PPA to reflect
the strategic acquisition rather well. A minor objection concerns the decision to recognize
intangible assets.
In the case of C2, one of the main reasons for acquiring the company was to get access to
customer relations and technology. Even though these were separately recognized in the PPA,
the Vice President of BA B believes that they are more valuable than what was recorded and
consequently that some of the value was allocated to the goodwill item.
The former CFO of BA B considers the two aggregated intangible assets that were recorded in
the PPA to be the main reason to the acquisition of C3. Therefore, the accounting can be said to
give a good comprehension of the acquisition.
As stated above, all intangible assets possible to recognize in the acquisition of C4pf were not
recognized due to the principle of materiality. Taking this into consideration, also the Group
Reporting Manger regards the accounting to be satisfactory for C4pf.
Despite being in general satisfied with the accounting of the studied acquisitions, the Business
Controller of BA A, the Vice President of BA B and the Financial Control Manager of BA C all
consider the subjectivity of the PPA process and the goodwill impairment testing to be
substantial. The former CFO of BA B stresses that the subjectivity is decreased by having several
persons with different backgrounds and competences in the processes. However, the Vice
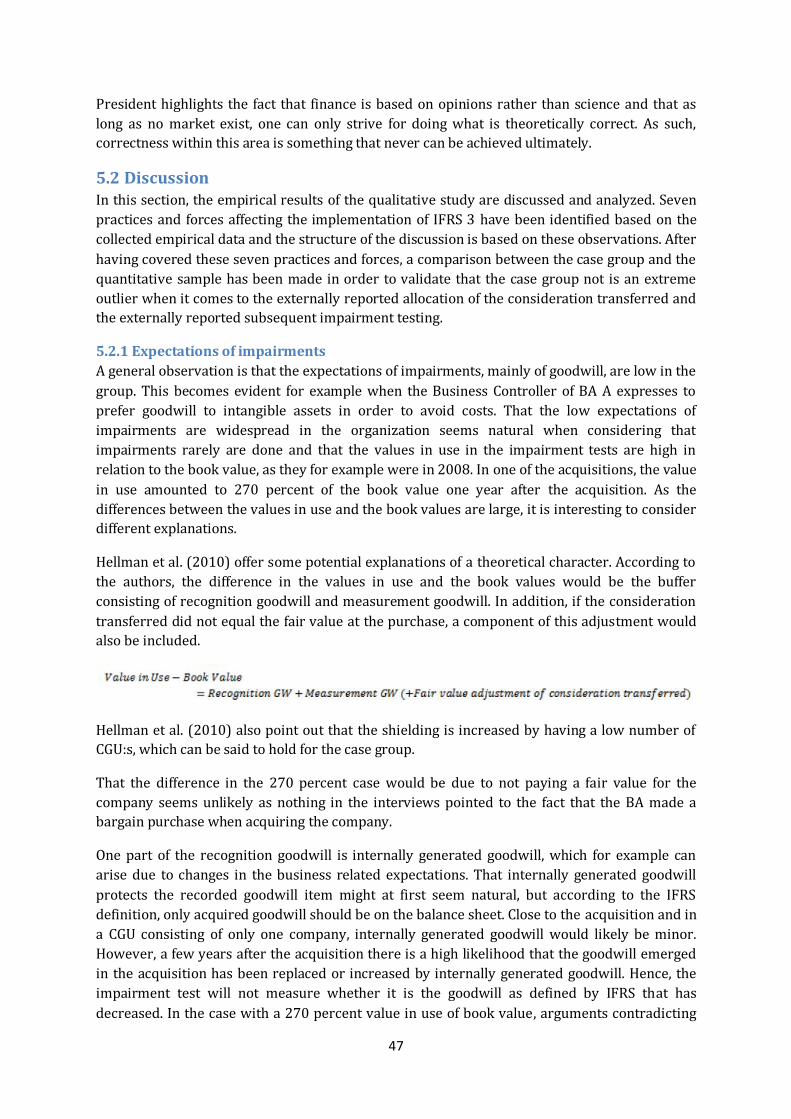
47
President highlights the fact that finance is based on opinions rather than science and that as
long as no market exist, one can only strive for doing what is theoretically correct. As such,
correctness within this area is something that never can be achieved ultimately.
5.2 Discussion In this section, the empirical results of the qualitative study are discussed and analyzed. Seven
practices and forces affecting the implementation of IFRS 3 have been identified based on the
collected empirical data and the structure of the discussion is based on these observations. After
having covered these seven practices and forces, a comparison between the case group and the
quantitative sample has been made in order to validate that the case group not is an extreme
outlier when it comes to the externally reported allocation of the consideration transferred and
the externally reported subsequent impairment testing.
5.2.1 Expectations of impairments
A general observation is that the expectations of impairments, mainly of goodwill, are low in the
group. This becomes evident for example when the Business Controller of BA A expresses to
prefer goodwill to intangible assets in order to avoid costs. That the low expectations of
impairments are widespread in the organization seems natural when considering that
impairments rarely are done and that the values in use in the impairment tests are high in
relation to the book value, as they for example were in 2008. In one of the acquisitions, the value
in use amounted to 270 percent of the book value one year after the acquisition. As the
differences between the values in use and the book values are large, it is interesting to consider
different explanations.
Hellman et al. (2010) offer some potential explanations of a theoretical character. According to
the authors, the difference in the values in use and the book values would be the buffer
consisting of recognition goodwill and measurement goodwill. In addition, if the consideration
transferred did not equal the fair value at the purchase, a component of this adjustment would
also be included.
Hellman et al. (2010) also point out that the shielding is increased by having a low number of
CGU:s, which can be said to hold for the case group.
That the difference in the 270 percent case would be due to not paying a fair value for the
company seems unlikely as nothing in the interviews pointed to the fact that the BA made a
bargain purchase when acquiring the company.
One part of the recognition goodwill is internally generated goodwill, which for example can
arise due to changes in the business related expectations. That internally generated goodwill
protects the recorded goodwill item might at first seem natural, but according to the IFRS
definition, only acquired goodwill should be on the balance sheet. Close to the acquisition and in
a CGU consisting of only one company, internally generated goodwill would likely be minor.
However, a few years after the acquisition there is a high likelihood that the goodwill emerged
in the acquisition has been replaced or increased by internally generated goodwill. Hence, the
impairment test will not measure whether it is the goodwill as defined by IFRS that has
decreased. In the case with a 270 percent value in use of book value, arguments contradicting

48
that internally generated goodwill would have a large impact in 2008 are that the impairment
test was made soon after the acquisition and that the performance of the acquired company did
not deviate from the expectations.
Other possible explanations to the 2008 difference are measurement goodwill and changes in
recognition goodwill not related to internally generated goodwill. Due to only one year passing
since the acquisition, neither these explanations are likely to have a major impact on a
standalone basis. Even though the combined buffer effect as explained by Hellman et al. (2010)
may explain a major part of the differences in the values in use and book values and hence give
rise to the low expectations of impairments, there may also be practical factors that should be
taken into consideration as the application of the standards when it comes to goodwill has been
pointed out as the most complex area within IFRS (Marton, 2009).
A practical reason for the large differences between the values in use and the book values 2008
may be differences in the model related assumptions. In contrast to when estimating the fair
values at the point of the acquisition when the useful life of the individual asset is used, the
impairment testing model is based on larger units and on five explicit years and a terminal
value. Theoretically, this should not give rise to any differences but the question is whether this
is the case in practice. An example suggesting that the five year models with terminal values
give rise to higher values than the fair value models based on a useful life is that all terminal
values exceeded 50 percent of the total value in the year of 2008. Even though assets in the CGU
may have useful lives exceeding five years, allocating the majority of the total value to the
terminal value seems much when considering that the Group Reporting Manager states that it is
a group principle to be conservative when estimating terminal values. It can also be noted that
the usage DCF valuation in the impairment testing is in line with the findings of Herz et al.
(2001) and Gauffin and Thörnsten (2010).
As pointed out by Skogsvik (23006), the choice of discount rate may have a great impact on the
calculated value. Hence, the fact that different discount rates sometimes are used in the fair
value estimations and in the impairment testing is another possible explanation to why
impairments rarely are done and hence neither expected. This is not only a practical problem
but also a theoretical. In the case of the brand of C3, a 3 percent higher rate was used in the
valuation than later in the impairment testing. This means that the cash flows in the fair value
estimation becomes substantially more discounted than the cash flows in the impairment test,
resulting in a higher value in use than book value.
In addition to the theoretical and practical suggestions, one may also consider psychological
aspects when trying to understand the reasons to the low expectations and low numbers of
impairments. As stated by Heurlin (2011), companies generally tend to put high focus on the
long term effects when doing impairment tests. This is in line with how the case group reasons
when not impairing assets during financial crises as it is stated that long term values not are
considered to be altered substantially. Hence, the long term perspective adapted by the group
can be an explanation to why impairments seldom are done or expected. Even though the long
term thinking is an appealing thought that also would decrease the volatility of markets, one can
question whether it not would be more correct to decrease the fair values, which should be
based on market values, when all prices in the market are decreased.
49
In line with Beisland and Hamberg (2009) and Hellman et al. (2010), the interviewed people at
the case group generally agree with the statement that the goodwill items will be higher in the
future due to the IFRS replacing goodwill amortization with impairments. Even though it is
evident that many in the group consider the new rules hard to apply it might also, to some
extent, be possible that this becomes a self-fulfilling prophecy. As pointed out in the group, a
behavior of defending the goodwill items likely arises. This might create a psychological
threshold towards recognizing impairments, even further decreasing the probability of goodwill
impairments.
Concluding the discussion of impairments, it is evident that both the number and the
expectations of impairments, especially concerning goodwill, are low. Three areas of potential
explanations for this have been identified: theoretical, practical and psychological. Which one of
these areas that have the greatest impact can only be speculated upon.
5.2.2 Applications of guidelines and formal control
When looking at the guidelines, rules and responsibilities of the group, many formal control
mechanisms are apparent. However, after having investigated the four separate cases it
becomes evident that the formal control of the PPA processes and impairment testing is not as
strong as first envisioned.
The group guidelines issued by the HQ mainly restate what the IFRS state. Furthermore, it is
obvious that the guidelines have been written by different people as they sometimes are
inconsistent. It is also evident that the knowledge of these guidelines is limited within the BA:s
and also sometimes overlooked by the HQ. Examples of this are the fact that not all BA:s are
aware of the maximum of 3 percent perpetuity growth and the use of the same rate for all group
calculations when it in the guidelines is stated that the discount rate should be specific for each
individual asset. Furthermore, the recommendation to use a five year explicit forecast period in
the fair value calculations is not followed and in some cases the inventory valuation is done
without the deductions stated by the guidelines.
A possible reason to the discrepancies between the group guidelines and the group practice is
that the IFRS and the group guidelines are hard to interpret, as previously concluded by the
Financial Reporting Council (2010), Gauffin and Nilsson (2010) and Petersen and Plenborg
(2010). A potential effect of the discrepancies between the group guidelines and the group
practice is inconsistencies in how the PPA:s and the impairment testing is made. Inconsistencies
could occur both between the BA:s and within one BA if different persons are involved. As an
example, there were often different people in the group that performed the fair value
calculations at the point of the acquisition than performed the subsequent impairment testing.
Hence, in addition to the discrepancies in the application of the standards between companies
found by Petersen and Plenborg, there could also to be differences within large groups.
One can question what the benefits of the group guidelines are if they are not fully applied and if
those that should apply them are not updated on their content. One potential reason for issuing
the guidelines is that it is expected, both internally and externally, from an organization of the
group’s size to have guidelines. If this would be the case, the benefit would be mainly
institutional.
Another factor that points to the institutional use of the group guidelines is the inclusion of
valuation models from an external auditor in the guidelines. That these not always are followed

50
is evident in the case of C1 where the fair value estimation of buildings is based on insurance
values instead of the model stated in the guidelines. It should however be noted that in line with
Ernst & Young (2009), the income approach is the most commonly used valuation technique in
the case group.
In addition to discrepancies between the group guidelines and the application of the group, it
also appears to be discrepancies between what the HQ believes and what actually is done in the
BA:s when it comes to very general issues. As an example, the Group Reporting Manager states
that one person at each segment makes the impairment tests, when in reality this person most
often is at the higher BA level. The Group Reporting Manager also states that goodwill is tested
at the segment level, which in reality rarely is the case. Furthermore, the Group Reporting
Manager states the MEEM to be one of the most common valuation models in the group while
the former CFO of BA B has never heard of the model. Hence, there seems to be a lack of
evaluation of the BA’s applications of the group guidelines.
There are several potential explanations to the lack of communication concerning general
accounting principles of the group and evaluation of the application of these accounting
principles. One reason could be that the HQ overestimates the general practicality of the IFRS
and group guidelines and hence does not understand how hard they are to apply. Another
reason could be that the HQ in line with the arguments by Elwin (2008) does not consider the
accounting of goodwill to be of importance and thus only focuses on the more specific matters
that the auditors often have opinions about. That this would be the case is however unlikely as
the HQ in the case of C1 had strong opinions regarding the allocation of goodwill and intangible
assets. A third possible suggestion is that the HQ does not want to know what the BA:s are doing
in order to avoid to detect errors or manipulations. A final possibility is that the HQ has
substantial time constraints and not prioritize the communication regarding these issues with
the BA:s. Regardless of the reasons to the lack of communication, it implies that the risk of
divergent behavior within the group is increased. Furthermore, it makes the BA:s more of
separate units and hence creates possibilities for the BA:s to perform creative accounting as
suggested by Wyatt (2005).
Concluding this section, it is clear that within the area of formal control there are some
discrepancies between the group guidelines and the group practice and a partial lack of formal,
general communication within the group regarding accounting issues. Even though
consequences of this have been suggested, it is not possible to state whether those would occur
without first also considering the informal characteristics of the PPA process and the
impairment testing.
5.2.3 Areas of discussion and informal control
Even though the formal communication concerning general questions not is optimal, the
informal communication within very specific areas and parts of the PPA process seems to work
very well. In these areas, many decisions are taken informally and not via formal meetings and it
is evident that the majority of these processes are dynamic and continuous. Examples of this are
the continuous dialogues between the HQ and the BA:s when taking critical decisions in the PPA
processes and the early informal participation of the board when deciding whether to acquire.
The initiation of a specific discussion can be made by all parts of the group and the inputs and
assumptions in the numerical calculations are often changed. Looking at the decision processes

51
and information flow within the group it is clear that the informal communication has larger
impact than the formal communication.
The reason to initiating informal discussions seems to be based on a problem that one wishes to
discuss with a colleague rather than a formal requirement of agreement. It is plausible that
discussions initiated at the HQ are based on previous experience whereas discussions initiated
at the lower levels are more likely to concern individual difficulties that from the perspective of
the group might be of minor importance. As people at the HQ and BA:s know each other and
have worked together previously it becomes natural to consult each other. The existence of
informal relations between the HQ and the BA:s is very important as it can be said to mitigate
the potential problems arising due to the deficiencies of formal communication within the
group. However, it should be noted that this implies that most focus is placed on very specific
questions and parts of the PPA and impairment testing processes while it in the long run
probably are the more general questions that have the largest impact on the financial reports.
The pattern of dynamic processes characterized by informal control is also present in the
external relations, both with the valuation firms and the auditors. As an example, the contact
with the valuation firms of C2 and C3 was more of a continuous problem solving dialogue than
the handing over of a task. This seems good when considering that both the business knowledge
of the company and the accounting knowledge of the valuation firm are used. As pointed out by
the former CFO of BA B also the choice of the valuation firm is based on informal relations. Even
though this might result in that the external valuation firm achieves a good knowledge of the
specific businesses of the group, it also decreases the legitimacy of consulting an external part.
A general observation is that many people,
internal as well as external, are involved in
the specific processes and discussions of the
group. Examples of the persons involved in
the PPA process are shown in Figure 9. The
impact of the different parts is dependent on
the specific situation, but it is evident that the
BA is in the center. Many parties involved
suggests that the calculations becomes more
reliable and that the group consider it to be
important that the PPA:s and impairment
testing are made in a correct manner.
However, as stated previously, the inclusion
of a large amount of different parties is
limited to some questions and difficult areas,
suggesting that the informal control is not
sufficient to counterbalance for the deficiencies in formal control as mentioned above. Hence,
the suggested potential consequences of divergent behavior and creative accounting due to the
weaknesses in formal general control may occur in practice.
5.2.4 Applications of practicality
An additional general observation is that the practices of the case group are characterized by
choices that seem to be made based on practical considerations rather than what would be
more theoretically correct. Interesting to note is that these choices often are made despite the
52
knowledge that they are less correct. This holds both when it comes to recognition and
measurement and examples of practical choices can be seen within several areas.
A first example concerns the fact that a liability for an eventual deferred consideration
according to the group guidelines should be determined by discounting the amount payable.
This has not been made in the cases, even though the Group Reporting Manager states that it
would have been better if that had been done. That the treatment of deferred consideration is of
importance is evident as the consideration in three of the four cases was not paid in cash at
once.
Secondly, the guidelines state that the PPA can be based on the balance sheet values of the
acquired company. This seems more practical than correct and it is in accordance with Heurlin’s
(2011) statement that Swedish companies tend to view the acquired balance sheet values as
correct even though these values might not in any aspect be related to fair values. Having the
old book values as the starting point, it becomes easy to be biased and less objective. This
approach is likely to result in fair value adjustments of minor importance, and hence most often
to larger amounts of goodwill. This line of argumentation is in line with Ernst & Young’s (2010)
conclusion that the revaluation of tangible assets is low and that goodwill constitute a large
amount of the consideration transferred.
Another example of practicality in the case group is that the guidelines give explicit examples of
the most common assets to revalue. This seems like a good idea for people that are new within
accounting and the business, but it may also result in that the revaluation procedure becomes
standardized concerning what assets to revalue and recognize. Looking at the studied
acquisitions, the assets mentioned in the guidelines are the only assets that have been fair value
adjusted. Additionally, the guidelines state that higher fair values than reported values are rare
for plant and machinery. Thus, the guidelines are not only informative but also normative,
further increasing the likelihood of standardization. Even though the former CFO of BA B states
that no fair value adjustments were necessary for plant and equipment in the case of C3, one can
still question whether the normative guideline did not affect the decision to instruct the external
valuation firm that plant and equipment should be assumed to have a fair value equal to its
written down book value. However, in the case of C4pf the machinery was revalued. It can be
suggested that the described formulations of the group guidelines are written mainly based on
practical considerations rather than analysis of what consequences they may have.
In addition to practical choices in the PPA process, there are also practicality tendencies when
testing for impairments in line with Heurlin (2011). Even though, as the Group Reporting
Manager states, valuations in an ideal situation should be made on each particular asset, the
group mainly conducts valuations on a higher level, such as the segment or even the BA. The fact
that it is the BA:s that decide the allocation of the goodwill is good from the perspective that
they are closer to the operations but on the other hand it has resulted in the fact that a major
part of the annually tested value is tested at the BA level. That this is due to practical reasons is
evident as it is stated that it probably would be possible to do it at a lower level. This follows the
reasoning of Wines et al. (2007) that many CGU:s are less desired from a practical perspective
and as stated by both Wines et al. and Hellman et al. (2010) a low number of CGU:s decrease the
probability of making impairments, as discussed in the section Expectations of impairments.
However, according to the former CFO of BA B the merging of all companies to one CGU is not
due to practicality but rather inherent in the reason for making an acquisition.

53
That impairment testing is performed at the BA can be considered good as it is close to the
operations at the same time as not the people in the actual operations perform the test. Hence,
some objectivity is present. However, impairment testing at the level of the segment, as is the
case in BA C, may be viewed as more simple and practical at the cost of objectivity. Also,
incentive problems as discussed in the section Consequences of internal interest might increase.
Finally, the use of a single WACC throughout the whole organization is another application of
practicality. It is throughout the group pointed out that one rate is very practical even though
most people also state that it might be good to have different rates for different countries. As the
political risk and inflation are dissimilar on different continents this would be preferred from a
theoretical perspective. The use of the same rate within the group implies that fair value
estimations in acquired companies with higher business risk or operating in high risk counties
should get high fair values relative to those assets belonging to companies with low risk in the
operations or the country. Also, the impairment testing will be biased so that the probability of
impairments in projects with higher risk becomes too low.
Especially the HQ has a very relaxed view towards the WACC, which can be said to be strange as
the rate is used extensively in the organization and has a major impact on the valuations. As an
example, the person calculating the WACC has no idea how and on what the beta is calculated
and the rate is not changed often. Interesting to consider is also that most people are very aware
of that the WACC practices could be more theoretically correct but justify the current practice
by relating to other similar groups. Hence, a “if they do it, we can also do it” mentality is
apparent. That this mentality is common among companies is supported by the study of Gauffin
and Thörnsten (2010) which states that many firms use a similar WACC rate. Even though the
group WACC of 10 percent is in line with the findings of Gauffin and Thörnsten (2010) and
Hellman (2011), the goal of a ROCE of 25 percent would result in a steady state market-to-book
ratio of over 3 if a steady state growth rate of 3 percent is used5. Since this ratio according to
Pennman (1996)6 can be said to be very high, either the WACC or the desired ROCE seem
unrealistic.
After having considered practicality matters within the group it is evident that practicality has
an influence on the PPA processes and the impairment testing. It is obvious that most of the
practicality choices are based on a reasoning that the costs of a more correct manner are higher
than the accompanying benefits and hence, in line with Hjelström and Schuster (2011), the
group has a high focus on costs. Even though the costs in each specific case might be higher than
the benefits, it can be questioned whether it on an aggregated level would not be more
beneficial to make the less practical choices as the combined bias of many minor practical
choices can be substantial.
5.2.5 Requirements of materiality
The principle of materiality is also present throughout the group, both with regards to
recognition and measurement issues. In the process of an acquisition, the materiality
considerations are first apparent in the measurement problem of whether to revalue the
acquired assets. At this point it is questioned whether the benefits of a revaluation outweigh the
costs and, as no formal numerical limits are stated, this decision process appears to be very
5 Steady state market-to-book = (ROCE – g)/(WACC – g) 6 A market-to-book ratio exceeding 3 is in the study of Pennman (1996) considered as high.

54
subjective. As discussed in the section Consequences of internal interest, this is also an area
where incentive problems are evident.
Another example of the use of the materiality principle is given by the Group Reporting Manager
when explaining the reason for not doing a DCF in the valuation of machinery in the C4pf case
and not recognizing a DTL; machinery of 800 KSEK is not considered to be large enough. In this
case, the adherence of the materiality principle results in that comparisons of the PPA between
large and small acquisitions within the group becomes harder as no DTL:s are recorded in the
small acquisitions. It is also important to note that the external valuation firm might have
another materiality level than the group, which further could make comparison difficult. In the
case of C3 it was for example stated that the external firm used a materiality level of 6 million
SEK.
The group looks upon materiality as something relative to their own operations and size. Even
though this seems reasonable and is in line with the IFRS Framework treating materiality as an
entity-specific asset, it also results in that comparisons with other companies become hard.
Hence, if a smaller company would acquire the same company as the group, the accounting
would likely be different. However, taking the size of the group into consideration, many of the
above mentioned areas might not be of great importance when evaluating the group as a whole.
Hence, the assets left out due to materiality are not likely to influence decisions made by
external users of the financial information.
Potential reasons to the widespread use of a materiality threshold are practicality issues and
cost issues. In some cases, not even practicality or costs seems like plausible explanations for
applying the materiality principle. As an example, in the case of C3 the external valuation firm
valued the projects that were seen to be too small to recognize. When having finalized and paid
for the valuations one can question why the valued assets are not recognized if the group wants
to give an as good description as possible of the acquisition. At this point, questions of whether
creative accounting is present arise. This example also supports the argumentation by Thorne
(2010) that it is hard for companies to decide which intangible assets to recognize.
Despite the benefits of using a materiality threshold, the obvious drawbacks are that the
information and descriptions of the acquisitions are decreased. Even though some level of
materiality is necessary, in order to avoid mismatches, the same materiality level should be
applied by the group and the consulted external valuation firms.
5.2.6 Consequences of external interest
In the PPA processes and in the impairment testing, it is important to also consider the potential
effect of the external interest in the group. A first effect of external factors is that the group has
to be very cautious with the number of people involved in the initial stages of a large
acquisition. A potential side effect of this is that decisions of going through with larger and
strategically more critical acquisitions, where less people are involved, are taken with less
information than smaller and less critical acquisitions. This also suggests that the PPA process
of secret acquisitions is likely to be characterized by a lot of changes as the inclusion of experts
within different areas will increase gradually throughout the process.
Another issue concerns whether it is due to secrecy towards competitors that the choice to not
disclose the consideration transferred and the adjustments for each particular acquisition is

55
made. This choice results in the fact that aspects such as further division and the useful life of
the intangible assets have to be left out of the financial statements.
One can also question why the in the annual reports given reasons for recognizing goodwill are
the same for all years. This gives the perception that the group does not consider the goodwill
item as very important, which as observed at the cases, evidently not is the case. Also, as the
goodwill acquired by the group sometimes is hard to justify externally, the group could put
more focus on explaining what the in the acquisitions emerged goodwill consists of. Despite
what has been mentioned it is concluded that the group in comparison to other companies in
general is good at disclosing the PPA:s and hence to a large extent enables users of the financial
statements to evaluate the nature and financial effects of business combinations as requested by
IFRS.
The group being good at disclosing is also true in the case of disclosing how the testing for
impairments of goodwill is made. However, one can question why impairments of goodwill are
not disclosed in connection with costs, as that seems more theoretically correct. The placement
also makes it very confusing for the reader and the post is easy to overlook, almost as if that was
the intention. To make impairments of goodwill hard to see would be beneficial if it is assumed
that impairments of goodwill from an external perspective would be seen as a bad sign. Another
fact pointing towards goodwill impairments being seen as particularly negative is the statement
of the Financial Control Manager of BA C that it is a good strategy to recognize many intangible
assets to reduce the risk of goodwill impairments. However, if analysts are disregarding the
effect of goodwill impairments on the income statement as suggested by Elwin (2008), it would
be beneficial to make impairments of goodwill easy to notice so they can be taken aside from the
income statement.
A potential reason for not giving as detailed information concerning the impairment testing of
assets other than goodwill might be that the group does not test these assets extensively. Being
critical, one can question if the less detail is a way of not having to explain that impairment tests
of individual assets other than goodwill are rarely done.
In the acquisition of C1, the Business Controller of BA A was of the opinion that no intangible
assets should be recognized since this was how the Business Controller considered best
represented the acquisition. However, both the HQ and the auditors were reluctant to this and
wanted intangible assets to be recorded despite the fact that this contradicted the prudence
principle concerning intangible assets stated by the Group Reporting Manager at the HQ. As this
according to the Business Controller was due to external expectations one can conclude that the
PPA process can be a very political process. If these external pressures are general for the
market it implies that too much intangible assets are recorded. This would then further increase
the view that it is less accepted to buy something without substance (i.e. much goodwill) and
thus potentially create a vicious circle.
The consideration of the timing of goodwill impairments, in line with Henning and Shaw (2003),
is another example of that external pressure is present in the case group. Several of the
interviewed persons pointed to the fact that a big bath behavior is preferred during financial
crises as it then is externally accepted to present bad results. That impairments during crises
mainly are considered based on external factors is evident as crises by the group not are seen as
substantially decreasing the value of the assets due to a long term thinking, as mentioned in the
56
section Expectations of impairments. The big bath findings are in line with the findings of
Giacomino and Akers (2009) and Sevin and Schroeder (2005) and support the argumentation
put forward by Massoud and Raiborn (2003), who argues that the flexibility allowed by the
standards might introduce higher volatility in the earnings due to managers adhering to a big
bath behavior.
The findings of this study also support the argumentation of Gowthorpe and Amat (2005)
stating that the new standards give further opportunities for creative accounting. As mentioned
both in the interviews at the case group and by Johansson (2008), the predictability of goodwill
is currently lower than compared to when the old standards requiring amortization of goodwill
were applied. Potential effects of the decreased predictability are higher volatility in the market
and possibly higher market premiums. However, even though it might be hard to compare
different years for the group due to volatile results, the application of the new standards should
theoretically give a better picture of the yearly performance of the company.
It was in the interviews mentioned that external valuation firms were seen as giving objectivity
to the valuations. However, the exclusion of the inventory adjustment suggested by the external
firm in the case of C3 raises the question of whether external valuation firms to some extent
only are used in order to gain legitimacy. An additional argument for this is, as stated by the
Business Controller of BA A, that the internal personnel know the business better and that
external advisors mainly cost money and follow a standardized model. However, departing from
the previous discussion of external expectations on intangible assets, a standardized model of
intangibles can be a way to satisfy the market. If external firms are used to gain legitimacy one
can question the practice of using the audit firm as a valuation firm and firms the group has
strong relationships with to the extent they are used today. The above reasoning suggests that
the increased reliability that the external valuation firms are expected to contribute with might
not be that major after all.
Concluding, it is evident that external interest has an impact on the PPA processes and the
impairment testing. In general, it seems like the political game gives rise to a worse reflection of
the acquisitions in the accounting and tendencies of creative accounting in the impairment
testing. Hence, the suggestion of Healy and Wahlen (1999) that companies might manipulate the
financials to influence the stock market is supported.
5.2.7 Consequences of internal interest
In some cases, there are incentives at lower levels to act in a way that is beneficial for the
specific BA/segment. As stated by Healy and Wahlen (1999) affecting compensation might be a
reason for this, but also other reasons such as exaggerating the performance of the unit to
attract status and resources are possible. In an organization with an in some areas rather weak
formal control, different incentives within the organization can be dangerous.
An example of diverging incentives pointed out by the Group Reporting Manager is that the BA:s
have incentives to not revalue the assets. This is since the BA:s and most segments are evaluated
on EBIT and the costs of revaluing and carrying intangible assets and goodwill will affect the
evaluation of the unit. Also, these types of assets are often irrelevant for the original
management in the acquired companies as they have never carried these assets before.
In addition to the incentives to not revalue, there are also incentives for the BA:s/segments to
recognize the type of assets that minimize the future costs. In theory, this should not be a
57
problem as the HQ has the final say in all PPA calculations but the informal discussion processes
likely implies that the BA:s/segments have possibilities to influence the HQ in a for the
BA:s/segments beneficial direction, especially since they make all the assumptions in the
calculations. The BA:s/segments could also chose to allocate goodwill to the CGU:s where
impairments are least likely to occur. Whether the practice of these tactics is frequent in the
group is hard to comment on, but the personal opinion of the Business Controller of BA A
concerning only recognizing goodwill, suggests that is not inconceivable.
Another personal opinion suggesting that private benefits might affect the accounting is the
Financial Control Manager of BA C’s preference of intangible assets to goodwill in order to
decrease the risk of large goodwill impairments. A potential reason to the contrasting opinions
of what assets that are preferred to recognize might be different risk situations of the different
BA:s. As an example, in a very risky unit, amortization (i.e. recognizing intangible assets) might
be preferred to impairments (i.e. recognizing goodwill) as amortizations are easier to forecast.
The statement of the Financial Control Manager of BA C is also interesting as it is in great
contrast to the cautiousness of recognizing intangibles that the Group Reporting Manager states
to be an overall group principle. In addition to noticing that this formal rule not does seem to
work very well one can question whether it is correct that the attempts to avoid incentive
problems in an organization, as was the aim of formulating the rule, should affect the external
accounting.
Another potential tactic to influence the individual evaluation of the BA:s/segments would be to
take advantage of the fact that DTL:s are booked at the HQ and increase the balance sheet in line
with Figure 8. Any signs of this tactic being used were not visible.
Also after the PPA is done, there are possibilities to adapt the accounting so that it suits the
personal agenda. One such example would be to be conservative when it comes to making
impairments in line with Gowthorpe and Amat (2005). As stated in the section Expectations of
impairments there are many potential explanations to why so few impairments are done. It
might be the case that the avoidance of impairments is a mindful underlying reason to these
explanations. In some cases, the preference to avoid impairments might also be an unconscious
motivation for some of the choices decreasing the probability of impairments.
It can be concluded that there in many cases are incentives within the group to act in a way that
is beneficial for the unit and hence to bias the accounting. In the case group, the possibilities of
the lower levels to pursue creative accounting are increased by the fact that the group in many
cases is dependent on the good behavior of the decentralized units. When for example taking a
final decision of whether to acquire a company, the HQ and the board have to rely on the
estimations, expectations and information provided by the BA:s which in line with Wyatt (2005)
will be very hard to argument against. Even though this seems reasonable as the BA:s probably
are more informed regarding the business and operations, it increases the possibilities of
creative accounting.
The possibilities for the BA:s/segments to bias the accounting are further increased by the fact
that the dependence of the BA:s in some cases is formal and explicitly stated by the group
guidelines. An example of this is the division of goodwill to different CGU:s, a decision which
according to the guidelines should be taken by the BA without interference of the HQ. In some
cases formal rules and mechanisms are established by the HQ to balance the dependence of the

58
decentralized units. An example of this is the rule that HQ has the final say in deciding of
whether to revalue acquired assets. However, one can question whether a rule that says that HQ
should be contacted early in the acquisition process will change anything when these types of
formal rules do not seem to work very well in the group, as described in the section Applications
of guidelines and formal control.
Creative accounting is often discussed in relation to parties external to the group. However, it is
in this case shown that there also are incentives and possibilities for the BA:s/segments to
pursue creative accounting in relation to the HQ. This implies that when analyzing PPA:s and
impairments, it is important to consider that there might be biased accounting at all times and
not only in a direction beneficial for the group as a whole. Hence, this supports the conclusion of
Wines et al. (2007) that the direction of a possible manipulation cannot be determined in
advance.
5.2.8 The case group in relation to the quantitative study
The quantitative study can be used in order to validate that the case group not is an extreme
outlier when it comes to the externally reported allocation of the consideration transferred and
the externally reported subsequent impairments.
As in most acquisitions in the quantitative study, goodwill was recognized in all case
acquisitions. Even though the general level of goodwill was slightly lower in the case than in the
quantitative sample, the difference is not major. The number of acquisitions resulting in new
intangible assets was in the case sample, just as in the quantitative sample, less than the number
of acquisitions resulting in goodwill. Furthermore, the number of revaluations of tangible assets
was even lower, both in the case group and in the quantitative study.
In line with the quantitative study, the case group often recognized brands but never intangible
assets with an indefinite useful life. As in the quantitative study, aggregation of intangible assets
was also present in the case group. Inventory was the most commonly revalued tangible asset in
the group cases, whereas the most commonly revalued tangible asset in the quantitative study
was PPE. It should be noted that the qualitative study was based on more information why the
relevance of the comparison of different asset types recognized and revalued can be discussed.
No impairments were done in the case acquisitions in contrast to 25 percent in the quantitative
study. However, this comparison is not entirely correct as the quantitative study measure
impairments on the company as a whole whereas in the case group, only a part of the
organization is examined.
The number of CGU:s in the case group was slightly higher than what was the most common in
the quantitative study. However, the revenue/CGU ratio of the group was close to the median in
the quantitative study. Hence, the case group was not one of the companies contributing to the
large difference between the average and the median of the ratio.
When it comes to the level of disclosures, the case group can be perceived to be of the general
level of the companies in the quantitative study.
It can be concluded that there is no sign of the case group being an extreme outlier in relation to
the quantitative sample. Even though this does not say anything about the PPA process and
impairment testing in other companies, it gives support to the suggestion that the findings and

59
conclusions made in the qualitative study can be considered as possible also for other
companies. As noted earlier it is not possible to make any generalizations, which neither was
the purpose of the study.

60
6. Conclusions The investigations of this thesis have resulted in several conclusions regarding the practices and
forces affecting the implementation of IFRS 3 with respect to the allocation of the consideration
transferred and subsequent impairment tests.
It is evident that both the number and the expectations of impairments, especially concerning
goodwill, are low in the case group. Without speculating upon what the major reason to this is,
three areas of potential explanations are offered: theoretical, practical and psychological.
Furthermore, it is clear that within the area of formal control there are some discrepancies
between the group guidelines and the group practice and a deficient level of formal, general
communication and evaluation regarding accounting issues. This partial lack of formal control is
to some extent mitigated by dynamic informal processes. However, since this informal control is
limited to particular areas and specific difficulties, the informal control cannot be said to be
sufficient to counterbalance for the difficulties in formal control. Hence, divergent behavior and
creative accounting may be consequences of the partial lack of formal general control.
It is also evident that practicality has an influence on the PPA and the impairment testing
processes and that most of the practical choices are based on a reasoning that the costs of doing
it more correct are higher than the accompanying benefits. Both practicality and cost
considerations are suggested as explanations to the materiality considerations of the group.
Even though both practicality and materiality to some extent is necessary in practice, there is an
important trade-off as the application of these concepts may result in less informative
accounting.
Another conclusion is that when analyzing PPA:s and impairments, it is important to consider
that both external and internal pressure might influence the accounting. As incentives might
exist on all levels of the organization, it is important to note that creative accounting may be
present at all times and not only in a direction beneficial for the group as a whole. Hence, it can
be concluded the PPA and the impairment testing are political processes.
By comparing the case group with the quantitative sample, it can be concluded that there is no
sign of the case group being an extreme outlier, why the findings and conclusions made in the
qualitative study can be suggested as possible also for other companies.
Finally, even though standards often are considered as the determinants of accounting, this
thesis shows, in line with Hjelström and Schuster (2011), that company culture, management
control systems and external influences might be of great importance in the reasoning when
implementing the IFRS 3 with respect to the allocation of the consideration transferred and
subsequent impairment tests. The conclusions of this thesis are illustrated in Figure 10.

61
7. Reliability The reliability of the thesis concerns the extent to which a repeated investigation would give the
same results as those presented in this thesis.
In the quantitative study, the reliability is relatively high as the investigation can be argued to
have a high degree of objectivity. The material has been collected carefully and several controls
have been made. Additionally, the calculation of percentages implies that unreasonable figures
likely should have been detected. A factor decreasing the reliability is the sometimes deficient
level of disclosures, leaving the authors with missing values and the necessity to make
assumptions. However, the assumptions have been made in an as objective manner as possible.
In addition, due to the recent revisal of the standards covering transaction costs, some
observations exclude this amount in the consideration transferred. This implies that in these
cases the goodwill amount would be slightly lower. As this figure in relation to the consideration
transferred is minor, this issue has been disregarded.
When it comes to the qualitative study, the reliability is somewhat weaker as the collection of
empirics is strongly dependent on the authors’ perceptions and interpretation. In order to
minimize the risk of misunderstanding and misinterpretation, the interviews has been recorded
and transcribed, supplementary questions have been asked and the collected empirics have
been discussed with the Group Reporting Manager.
Additional difficulties in the qualitative investigation have been that the current group
guidelines in some cases not were effective when all acquisitions were made, that old guidelines
were hard to find and that the acquisitions were made a while ago resulting in that the
interviewees sometimes had a hard time to remember all details. However, in order to capture
the development of the acquired companies and the impairment testing, and due to higher
secrecy regarding the most current acquisitions of the company, it was thought that the most
beneficial procedure was to investigate acquisitions made some years ago. Another factor
relevant to consider is the possibility that the interviewees deliberately presented false
information as the investigated issues in many cases are very sensitive. This risk was partially
mitigated by asking several persons at different units and levels within the group the same
questions.

62
8. Validity The internal validity of the thesis concerns the degree to which the thesis assesses the specific
concepts that is attempted to measure. External validity assesses the degree to which the
findings of the thesis can be generalized.
Keeping a high internal validity in the quantitative study is complicated by a few factors. For
example, the collected information of impairments and amortization does not only relate to
assets acquired as a part of an acquisition and as mentioned the disclosures were sometimes
deficient. It can be questioned whether it would have been better to investigate fewer
companies, but instead having contacted each of the companies and made sure that the
collected information better related to the purpose of the thesis. However, due to the purpose of
identifying tendencies and also doing deep a qualitative study, the used method was considered
as the best as it gave the possibility to include the highest number of observations. However, the
fact that many observations were made implies that the external validity is higher than the
internal validity.
The term validity takes a somewhat different expression for the qualitative study. The three
weeks visit of the company gave major possibilities to ensure sufficient depth of the data to
provide a clear picture of the research questions explored, thus resulting in a high internal
validity. Furthermore, the internal validity of the research method was increased by means of
triangulation of different sources of data. The external validity, on the other hand, limits itself to
theoretical generalization. Given the small sample size, the results cannot be generalized to the
greater population, as in most qualitative research, since the investigated group is a specific
case of a heterogeneous sample. However, for this particular research issue, and given the
current state of the previous research in this area, it is the authors’ beliefs that this exploratory
method is most suitable to fulfill the purpose of the thesis. The findings of the thesis will
hopefully help to improve current theory on this research issue, and lay the groundwork for
further empirical testing with the help of more robust statistical methods in the future. As such,
the study can be said to have a high external validity.

63
9. Final remarks The conclusions of this thesis give rise to some questions and implications for the future in
order to increase the market efficiency. As an example, would it be possible for standard setters
to increase the interaction with companies? In order to avoid improper interpretation by
companies it seems as if standard setters have to understand the practical considerations of
companies to a greater extent. However, not only the standard setters have to gain a greater
understanding of the difficulties a company encounter in the accounting. In order to make
reliable forecasts, to evaluate investments based on solid facts and to evaluate the performance
of the operations, analysts and investors have to realize the complexity of accounting. This is
especially important when it comes to the allocation of the consideration transferred in an
acquisition and in the subsequent impairment testing.
In extension of this thesis, there are several areas worth to further investigate. Firstly, in order
to strengthen the conclusions of this study, qualitative investigations of additional companies
within Sweden would be desirable, both when it comes to the same and other industries.
Secondly, it would be interesting to make quantitative studies to investigate whether some of
the findings of the case study can explain the observations of the quantitative study. As an
example, the qualitative study supported the suggestion in the discussion of the quantitative
study that a possible reason for not revaluing tangible assets is due to the principle of
materiality. However, the qualitative study offered an additional suggestion in the form of
practicality considerations. It was also suggested in the quantitative discussion that on the
individual level, creative accounting concerning goodwill impairment might be the case, which
is in line with the conclusions of the qualitative study. To examine these matters on a more
general level would be interesting.
Thirdly, also outside the boundaries of this study there are interesting areas to investigate. As
suggested in this thesis, external pressure might have an impact on the proportion of the
different asset classes recognized in a PPA. Studies to validate this proposal are suggested. In a
few years’ time when the long term consequences of the change in the goodwill treatment of
IFRS 3 have stabilized, it would also be interesting to see whether the suggested increase in
goodwill levels is general and significant.
Finally, it would also be of interest to conduct both the quantitative and qualitative study within
other countries applying IFRS.
64
10. References
10.1 Literature Alfredson, K., Leo, K., Picker, R., Loftus, J., Clark, K., Wise, V. (2009) Applying International
Financial Reporting Standards. John Wiley & Sons, Second edition, Australia, 2009.
Barton, J., Simko, P. (2002) The Balance Sheet as an Earnings Management Constraint. The
Accounting Review, Vol. 77, 2002.
Beisland, L., Hamberg, M. (2009) Changed Methods to Account for Goodwill – Did it really make a
difference? Handelshögskolan vid Göteborgs universitet and Universitetet I Agder, 2009.
Bloom, M. (2009) Accounting for goodwill. ABACUS, Vol. 45, No. 3, 2009.
Bradshaw, M. (2004) How Do Analysts Use Their Earnings Forecasts in Generating Stock
Recommendations? The Accounting Review, Vol. 79, No. 1, 2004.
Dahmash, F., Durand, R., Watson, J. (2009) The value relevance and reliability of reported
goodwill and identifiable intangible assets. The British Accounting Review, 41, 2009.
Elwin, P. (2008) Discussion of “Accounting for intangible – a critical review of policy
recommendations”. Accounting and Business Research, Vol. 38, No. 3, 2008.
Ernst & Young (2009) Acquisition accounting - What’s next for you? Ernst & Young, 2009.
Ernst & Young (2010) Börsföretagens förvärvsanalyser 2009. Power point, Sverige, 2010.
Financial Reporting Council (2010) FRC Study: Accounting for Acquisitions. Financial Reporting
Council, 2010.
Gauffin, B., Nilsson, S. (2010) Fördjupning: Rörelseförvärv enligt IFRS 3 – femte året. Balans, No.
1, 2010.
Gauffin, B., Thörnsten, A. (2010) Fördjupning: Goodwillavskrivningar 2009, en svårbedömd
historia. Balans, No. 8-9, 2010.
Giacomino, D., Akers, M. (2009) Goodwill And Goodwill Write-Downs: Their Effects On Earnings
Quality For 2008 And 2009. Journal of Business & Economics Research, Vol. 7, No. 11, 2009.
Gibbs, M., Merchant, K., Van der Stede, W., Vargus, M. (2009) Performance Measure Properties
and Incentive System Design. Industrial Relations, Vol. 48, No. 2, 2009.
Gramlich, J., McAnally, M., Thomas, J. (2001) Balance Sheet Management: The Case of Short-Term
Obligations Reclassified as Long-Term Debt. Journal of Accounting Research, Vol. 39, No. 2,
September 2001.
Gowthorpe, C., Amat, O. (2005) Creative accounting: some ethical issues of macro- and micro-
manipulation. Journal of Business Ethics, Vol. 57, 2005.
Hellman, N. (2010) Course 3301, Financial Accounting, Lecture 2: Value concepts and historical
cost accounting. Stockholm School of Economics, August 31, 2010.

65
Hellman, N., Hjelström, T., Johansson, S. (2010) Goodwill components and impairment tests under
conservative accounting and growth: A theoretical analysis. Working Paper, Stockholm School of
Economics, 2010.
Hellman, N. (2011) Fördjupning: Tillsynen över IFRS får vi en bra lösning? Balans, No. 3, 2011.
Hjelström, A., Schuster, W. (2011) Standards, incentives and accounting practice – lessons from
the IFRS transition in Sweden. Forthcoming Accounting in Europe, 2011.
Henning, S., Shaw, W. (2003) Is the Selection of the Amortization Period for Goodwill a Strategic
Choice? Review of Quantitative Finance and Accounting, 20, 2003.
Herz, R., Iannaconi, T., Maines, L., Palepu, K., Ryan, S., Schipper, K., Schrand, C., Skinner, D.,
Vincent, L. (2001) Equity Valuation Models and Measuring Goodwill impairment. Accounting
Horizons, Vol. 15, Iss. 2, 2001.
Malmqvist, P. (2007) Revisorerna bör säga ifrån! Balans, No. 2, 2010.
Marton, J. (2009) Redovisning: Nedskrivning av goodwill – hur jämförbart är det? Balans, No. 5,
2009.
Massoud, M., Raiborn, C. (2003) Accounting for Goodwill: Are We Better Off? Review of Business,
Vol. 24, No. 2, 2003.
Muller, J. (2004) Amortization of Certain Intangible Assets. Journal of Accountancy, Vol. 198, Iss.
6, 2004.
von Nandelstadh, A. (2003) Do Analysts Overweight Earnings Information? Finnish Journal of
Business Economics, 1/2003.
Newman, H. (1989) Selection of Short-Term Accounting-Based Bonus Plans. The Accounting
Review, Vol. 64, No. 4, 1989.
Niederhoffer, V., Regan, P. (1972) Earnings Changes, Analysts' Forecasts and Stock Prices.
Financial Analysts Journal, Vol. 28, Iss. 3, 1972.
Olsen, M., Halliwell, M. (2007) Intangible Value: Delineating Between Shades of Gray. Journal of
Accountancy, Vol. 203, Iss. 5, 2007.
Penman, S. (2009) Accounting for Intangible Assets: There is Also an Income Statement. Abacus,
Vol. 45, No 3, 2009.
Penman, S. (1996) The Articulation of Price-Earnings Ratios and Market-to-Book Ratios and the
Evaluation of Growth. Journal of Accounting Research, Vol. 34, No. 2 (Autumn, 1996), pp. 235-
259
Petersen, C., Plenborg, T. (2010) How Do Firms Implement Impairment Tests of Goodwill? Abacus,
Vol. 46, No. 4, 2010.
Preinreich, G. (1939) Economic theories of goodwill. Journal of Accountancy, September 1939.

66
Sevin, S., Schroeder, R. (2005) Earnings management: evidence from SFAS No. 142 reporting.
Managerial Auditing Journal, 20, 2005.
Skogsvik, K. (2006) Probablistic Business Failure Prediction in Discounted Cash Flow Bond and
Equity Valuation. SSE/EFI Working Paper Series in Business Administration 2006:5, 2006.
Thorne, C. (2010) Goodwill Hunting. Accoutancy Age, June 2010.
Wales, S. (1962) Intangible Expenses and Amortizing Intangible Assets. The Accounting Review,
Vol. 37, No. 1, 1962.
White, G., Sondhi; Ashwinpaul C., Fried; Dov (2003) The Analysis and Use of Financial Statements.
John Wiley & Sons, Unites States, 2003.
Wines, G., Dagwell, R., Windsor, C. (2007) Implications of the IFRS goodwill accounting treatment.
Managerial Auditing Journal, Vol. 22, No. 9, 2007.
Wines, G., Ferguson, C. (1993), An empirical investigation of accounting methods for goodwill and
identifiable intangible assets: 1985 to 1989. Abacus, Vol. 29 No. 1, 1993.
Wyatt, A. (2005) Accounting Recognition of Intangible Assets: Theory and Evidence on Economic
Determinants. The Accounting Review, Vol. 80 No. 3, 2005.
10.2 Standards IFRS Framework
IAS 12 Income Taxes
IAS 16 Property, Plant and Equipment
IAS 36 Impairment of Assets
IAS 38 Intangible Assets
IFRS 3 Business Combinations
IFRS 7 Financial Instruments: Disclosures
10.2.1 Guidance to interpretation
Deloitte (2008) Business combinations and changes in ownership interests - A guide to the revised
IFRS 3 and IAS 27. Deloitte, 2008.
Deloitte (2010) IAS Plus website, http://www.iasplus.com/standard/, January 17, 2011.
Deloitte (2010) IFRS in your pocket 2010. Deloitte, 2010.
10.3 Interviews Heurlin, S., PWC, March 2, 2011.
10.3.1 At the case group
Business Controller, BA A, March 15, 2011.
Business Controller, BA C, March 22, 2011.

67
Executive Vice President Finance, BA B, March 14, 2011.
Financial Control Manager, BA C, March 16, 2011.
Former CFO, BA B (currently Vice President of Group Assurance), March 23, 2011.
Group Reporting Manager, HQ, March 8 and March 24, 2011.
Head of Group Business Control, HQ, March 17, 2011.
10.4 Databases Swedbank (2011), Currency rates archive. Online,
[https://www.swedbank.ee/private/d2d/payments/rates/archive], 2011-02-19.

Appendix
Quanti tative Study: Table of Acquis i tions
Company Year Acquis i tion Holding, method Cons .Transf. GW (-negative GW) Minori ty Type of new IA New IA Useful l i fe DTL due to acq. Type of reva lued TA or debt Revalued TA/D
ABB 1 2009 No
MUSD 2008 Kuhlman 1 100% 513 427 0,83 Tota l 114 0,22 No info
Customer relationships 63 6 y
Order backlog 20 1 yTrademark and trade names 16 10 yTechnology 15 4 y
2007 Total 1 54 23 0,43 No info 0,00 No info2006 No
Alfa Laval 1 2009 LHE Co 1 90%, PGM 1086 347 0,32 Tota l 595 0,55 No info
MSEK Patents and un-patented know-how 297 10 yTrademark 298 10 y
HES GmbH 1 100% 112 59 0,53 Tota l 83 0,74 No info
Patents and un-patented know-how 83 10 yOnnuri Industria l Machinery Co 1 100% 133 48 0,36 Tota l 79 0,59 No info
Patents and un-patented know-how 40 10 yTrademark 39 10 y
Two companies 1 532 189 0,36 Tota l 291 0,55 No info
Trademark 291 10 y2008 Hutchison Hayes 1 100% 230 46 0,20 Tota l 144 0,63 No info Inventory 1
Patents and un-patented know-how 95 10 y
Trademark 49 10 yAccrued gross margin in work in progress 1 1 y
Standard Refrigeration 1 100% 373 152 0,41 Tota l 166 0,45 No info Inventory 5Patents and un-patented know-how 166 10 y
Accrued gross margin in work in progress 5 1 y2007 Fincoi l 1 100% 479 241 0,50 Tota l 233 0,49
Patents and un-patented know-how 233 10 yHelpman 1 100% 140 4 0,03 Tota l 36 0,26 Properties 9
Patents and un-patented know-how 36 10 y Land 82006 Tranter 1 100% 1224 530 0,43 Tota l 451 0,37 Properties 17
Patents and un-patented know-how 180 10 yTrademark 265 20 y
Accrued gross margin in work in progress 6 1 y
Alliance Oil Company Reverse acquis i tion
Assa Abloy 1 2009 Ditec etc. 1 100% 1107 637 0,58 Tota l 163 0,15 *4 to 5 y 20 Other assets and l iabi l i ties -25
MSEK 2008 Rockwood, Gardesa, Va l l i&Val l i , Shenfei etc. 1 100% 2030 1208 0,60 Tota l 233 0,11 *4 to 5 y 46 Other assets and l iabi l i ties -119
2007 Pemko, Aontec, Baodean etc. 1 70-100%, PGM 1675 1029 0,61 Tota l 328 0,20 *3 to 5 y, 50% indef l i fe 84 Liabi l i ties 362006 Fargo 1 100% 2486 1547 0,62 Tota l 708 0,28 *3 to 5 y, 50% indef l i fe 176 Liabi l i ties 134
Adams Ri te, Baron etc. 1 100% 1067 716 0,67 Tota l 118 0,11 *3 to 5 y, 50% indef l i fe Liabi l i ties 22
AstraZeneca 1 2009 No MUSD 2008 No
2007 MedImmune 1 96%, No info 15653 8757 0,56 Tota l 7882 0,50 No info PPE 70
Other not current assets -17Current assets 115Current l iabi l i ties -39
2694 Additional fin. obl igations 1724Arrow Therapeutics + Atlantis Components 1 100% 220 0 0,00 Tota l 347 1,58 No info 118
2006 Cambridge Antibody Technology 1 19,2%->100% 1116 104 0,09 Tota l 1235 1,11 No info 364 Other non-current l iabi l i ties 20Humira royalty system 675 No infoOther intangible assets 560 No info
KuDOS Pharmaceutica ls 1 100% 206 12 0,06 Tota l 285 1,38 No info 85
Atlas Copco 1 2009 Made by Compressor Technique 1 (25%->)100% 154 55 0,36 Tota l 48 0,31 5 to 10 y 12,75 PPE 13MSEK Other assets -3
Other l iabi l i ties and provis ions -2,752008 Made by Compressor Technique 1 <100%, PGM 254 -69 -0,27 Tota l 337 1,33 5 to 10 y 78 PPE 12
Other assets -1
Other l iabi l i ties and provis ions 22
2007 Made by Compressor Technique 1 No info, PGM 1609 843 0,52 2 Total 498 0,31 151,5 PPE -4Assets held for sa le 12
Other l iabi l i ties and provis ions -19,5Dynapac 1 25%->100% 4676 4437 0,95 0 Total -132 -0,03 No info PPE 65
Old goodwi l l -1336 Indefini te 385 Other l iabi l i ties and provis ions -94
Trademark and brand loya l ty 1204 No infoMade by Industria l Technique 1 100% 181 61 0,34 0 Total 157 0,87 No info 50,5 Other l iabi l i ties and provis ions 12,5
2006 Made by Compressor Technique 1 100% 926 525 0,57 9 Total 235 0,25 No info 47,2 PPE 8Other l iabi l i ties and provis ions -1,2
Made by Mining Technique 1 100% 161 22 0,14 0 Total 47 0,29 No info 5,9 PPE 3Made by Industria l Technique 1 100% 400 134 0,34 0 Total 33 0,08 5,9 Other l iabi l i ties and provis ions 7,1
Autoliv 1 2009 Delphi North America & Europé 1 <100%, PGM 34 0 0,00 No info 0,00MUSD 2008 Tyco Electronics 1 100% 42 21 0,50 No info 0,00
2007 Autol iv IFB Private Limited 1 49,9->100% 36 23 0,64 No info 0,002006 No
Axfood 1 2009 NoMSEK 2008 PrisXtra 1 100% 400 286 0,72 Tota l 109 0,27 28 PPE -8
Trademarks 80 3 to 5 y
Customer relationships 15 3 y
Leaseholds 14 Lease time
2007 No
2006 No

Boliden 1 2008 No
MSEK 2009 No2007 No
2006 No
Castellum 1 2009 No
MSEK 2008 No2007 No 165
2006 No
Electrolux 1 2009 NoMSEK 2008 No
2007 No2006 No
Elekta 1 2009 No
MSEK 2008 No2007 CMSI Holdings Corp. 1 100% 376 378 1,01 0,00 412006 3D Line Research and Development Srl 1 100% 155 123 0,79 0,00 No info
Ericsson 1 2009 Nortel 1 <100%, PGM 8345 2957 0,35 Tota l 5790 0,69 No info 0MSEK Intel lectual property rights 4979 <10 y
Customer relationships 811 <10 y
3 other 1 1288 577 0,45 Tota l 42 0,03 No infoCustomer relationships 42 <10 y
2008 No2007 Redback 1 100% 14794 9354 0,63 0 Total 5456 0,37 No info Other l iabi l i ties 2122
Intel lectual property rights 3272 10 y
Brands 609Customer relationships 1575
Tandberg 1 100% 9787 5442 0,56 0 Total 4474 0,46 No info Other l iabi l i ties 1432Intel lectual property rights 2712
Brands 276 10 yCustomer relationships 1486
LHS 1 87,47%, PGM 1664 1293 0,78 82 Total 1187 0,71 No info Other l iabi l i ties 380Intel lectual property rights 367 10 yBrands 43
Customer relationships 777
Entrisphere, Mobeon, Drutt, HyC 1 (20%->)100% 1968 828 0,42 Tota l 510 0,26 No info Other l iabi l i ties 1472006 Marconi 1 <100%, PGM 19360 0 0,00 Tota l 15367 0,79 0
Intel lectual property rights 11748 10 y
Brands 2901Customer relationships 718
Netwise 300 No info of a l location
Fabege 1 2009 NoMSEK 2008 No
2007 No2006 Fastighets AB Tornet 1 100% 3123 0 0,00 0,00 63 Investment properties 565
Current assets -54
Getinge 1 2009 Datascope 1 100% 7142 3561 0,50 Tota l 1810 0,25 3 to 15 y No info Provis ions 706
MSEK 2008 Boston Scienti fic 1 100% 4851 2417 0,50 Tota l 1947 0,40 3 to 15 y 49 Tangible assets 452007 Huntleigh 1 21,52%->100% 5631 3430 0,61 Tota l 1299 0,23 3 to 15 y 456 Tangible fixed assets 49
2006 No
Hakon invest Financia l company
HM 1 2009 No
MSEK 2008 FaBric Scandinavian 1 60%, PGM 927 431 0,46 0 Total 601 0,65 169
Brands 470 10 y
Customer relations 131 10 y2007 No
2006 No
Hexagon 1 2009 No
MSEK 2008 Total PGM 874 No info of a l location No info
2007 Novatel 1 100% 3285 1998 0,61 Tota l 354 0,11 No info Tangbi le fixed assets 5Current receivables , inventories etc. -18Provis ions 95
Current l iabi l i ties -182006 Total PGM 169 No info of a l location
Holmen 1 2009 NoMSEK 2008 Iggesund Paperboard Europe 100% 208 No info of a l location
2007 No
2006 No
Hufvudstaden 1 2009 NoMSEK 2008 No
2007 No
2006 No
Husqvarna 1 2009 No
MSEK 2008 Jenn Feng 1 <100%, PGM 681 301 0,44 Tota l 64 0,09 0 0
Brand/trademark 64 10 y2007 Soff-Cut 1 No info, PGM 302 338 1,12 Tota l 166 0,55 5 to 13 y 172
Patents and customer relations 166
Zenoah 1 No info, PGM 1026 312 0,30 Tota l 59 0,06 57,3 Other non-current assets 178
Inventories 9
Other operating l iabi l i ties 35
Gardena 1 100% 2949 2951 1,00 Tota l 1235 0,42 344 Other non-current assets -15Trademark 3009 Indefini te Inventories 53

Old goodwi l l -1774 Other operating l iabi l i ties 937
King Concepts 1 No info, PGM 126 71 0,56 Tota l 66 0,52 10 to 13 y 57,3Patents 66
Kl ippo 1 No info, PGM 222 160 0,72 Tota l 41 0,18 57,3Trademark 41
2006 McOuat 1 100% 193 121 0,63 0,00
Dixon 1 100% 240 146 0,61 Tota l 58 0,24 22Trademark 58
Jika i 1 80%, PGM 125 35 0,28 0,00
Industriliv Financia l company
Investor Financia l company
Kinnevik Financia l company
Latour Financia l company
Lundbergföretagen Financia l company
Lundin mining 1 2009 NoMUSD 2008 No
2007 Tenke 1 100% 1333 0 0,00 0,00 No info
Rio Narcea Gold Mines 1 85,5%, PGM 922 159 0,17 0,00 No info2006 EuroZinc Mining Corporation 1 100% 1668 501 0,30 0,00 No info
NAN 1 37,1%->100% 37 0 0,00 0,00 No info
Meda 1 2009 No
MSEK 2008 Valeant 1 100% 2803 755 0,27 Tota l 1433 0,51 174Product rights 1433 10 to 15 y
El lem läkemedel 1 100% 105 11 0,10 Tota l 116 1,10 32Product rights 116 10 to 15 y
2007 3M’s European pharma divis ion 1 5679 1530 0,27 Tota l 4171 0,73 Max 15 y 12 Non-current receivables 3Product rights 4171 Non-current l iabi l i ties 5
MedPointe Inc 1 100% 5241 3601 0,69 Tota l -94 -0,02 587 Deferred tax assets 12Product rights 1401 Inventories -17Old goodwi l l -1495 Other current assets 3
Other current l iabi l i ties -67
Recip AB 1 100% 2311 1252 0,54 Tota l -55 -0,02 368 Trade receivables -14Product rights 1316 Max 15 y Other current assets 14Old goodwi l l -1371
2006 Viatris group 1 100% 5463,6 5097,9 0,93 Tota l 579 0,11 647 Deferred tax assets -392,2Product rights 1194,9 Max 15 y Current l iabi l i ties 5Software 9,1Old goodwi l l -625
Melker Schörling Financia l company
Millicom 1 2009 No 49 38 0,78MUSD 2008 Amnet 1 100% 546 340 0,62 Tota l 136 0,25 42 PPE 3
Other current assets 24Other current l iabi l i ties 24
2007 No2006 Colombia Móvi l 1 50% + 1 vote, PGM 124 62 0,50 No info Tota l 105 0,85 PPE -30
Financia l assets 15Cash and cash equiva lents 122Contingent l iabi l i ties 15
MTG 1 2009 No
MSEK 2008 Gymgross is ten 1 100% 198 89 0,45 Tota l 701 3,54 15
Immateria l rights 55
Broadcasting l i cence 153Trademarks 493
Nova Televiza 1 100% 6044 5321 0,88 0,00 652007 Playahead 1 89%, PGM 102 79 0,77 3 Total 32 0,31 9
Immateria l rights 11
Trademarks 21
2006 P4 Radio Hele Norge ASA 1 40->100% 658,3 445,6 0,68 Tota l 265,7 0,40Trademarks 265,7 74,4
NCC 1 2009 NoMSEK 2008 No
2007 No2006 No
Nordea Financia l company
Oriflame 1 2009 NoMEUR 2008 No
2007 No2006 No
Peab 1 2009 Total 1 PGM 474 1 0,00 1 Total 3 0,01 *3-10 y 12 Tangible fixed assets -15
MSEK -3 Deferred tax recoverables 199
-133 Project and development property -55
Accounts receivables -72008 Total 1 PGM 767 90 0,12 Tota l 38 0,05 *3-10 y 18 Tangible fixed assets 29
-464 Deferred tax recoverables 731
Project and development property 3
Accounts payable and other l iabi l i ties 1
2007 Total 1 PGM 208 31 0,15 5 Total 38 0,18 *3-10 y 47 Tangible fixed assets 50
Project and development property 81Accounts payable and other l iabi l i ties 7

2006 Total 1 PGM 666 173 0,26 Tota l 138 0,21 *3-10 y 86 Tangible fixed assets 151
Accounts receivables 30Accounts payable and other l iabi l i ties 5
Saab 1 2009 No
MSEK 2008 No
2007 No2006 No
Sandvik 1 2009 Total 1 PGM 3272 1647 0,50 Tota l 525 0,16 *3-20 y 140 PPE 138
MSEK Inventories 50Non-interest bearing l iabi l i ties 171
2008 Total 1 PGM 764 474 0,62 Tota l 38 0,05 *3-20 y 10 PPE 1Inventories 1Non-interest bearing l iabi l i ties 16
2007 Total 1 PGM 6549 3886 0,59 Tota l 1318 0,20 *3-20 y 489 PPE 506
Financia l investments -17Inventories 77Current receivables -71Non-interest bearing l iabi l i ties 497
2006 Total 1 PGM 1188 526 0,44 Tota l 115 0,10 *3-20 y 30 PPE 26Financia l investments 6Inventories -17
Current receivables -11Non-interest bearing l iabi l i ties 37
SCA 1 2009 NoMSEK 2008 P&G European tissue operations 1 100% 1663 346 0,21 0,00
2007 P&G European tissue operations 1 100% 3192 653 0,20 0,00
2006 No
Scania 1 2009 NoMSEK 2008 No
2007 Total 1 PGM 269 131 0,49 0,002006 No
SEB Financia l company
Seco Tools 1 2009 NoMSEK 2008 ALG (Russ ia) 1 100% 100 59 0,59 Tota l -3 -0,03 Acquired net assets 9
Brands -3 Inventories 10
Trade receivables 12007 No2006 No
Securitas 1 2009 NoMSEK 2008 No
2007 G4S Cash Services 1 100% 283,1 140,2 0,50 Tota l 59,3 0,21 *3-5 y Operating fixed assets 9,2Other l iabi l i ties 11,6
Other 1 PGM 163 17,2 0,11 Tota l 109,5 0,67 *3-5 y Operating fixed assets 0,2
Accounts receivables 2,4Other assets and l iabi l i ties -16,1
2006 PSI 1 100% 250 142,8 0,57 Tota l 76,9 0,31 *3-5 y Operating fixed assets -0,8Other l iabi l i ties 123,2
Skanska 1 2009 NoMSEK 2008 No
2007 No2006 McNicholas Holding PLC 1 100% 695 550 0,79 Tota l 112 0,16 3-6 y 34
Service contract 112
SKF 1 2009 NoMSEK
2008 PEER Bearing Company 1 100% 1094 387 0,35 Tota l 315 0,29 PPE 11Order backlog 149 Net working capita l and current taxes 13Trademark and trade names 166 Indefini te
2007 Société de Mécanique Magnétique SA 1 12,52%->100% 513 239 0,47 17 Total 268 0,52 104 Financia l l iabi l i ties 19
Net working capita l and current taxes 14ABBA Group 1 100% 417 264 0,63 Tota l 49 0,12 11 PPE -1
Financia l l iabi l i ties 12
Net working capita l and current taxes 72006 SNFA S.A.S. 1 100% 1761 368 0,21 Tota l 270 0,15 185 PPE 176
Net working capita l and current taxes 78
SSAB 1 2009 No
MSEK 2008 No
2007 No2006 No
Stora Enso 1 2009 NoMEUR 2008 No
2007 No
2006 Brazi l ian Arapoti Group 1 100% 320 0 0,00 0,00 Tangible fixed assets 75,5
Swedbank Financia l company
Swedish match 1 2009 No
MSEK 2008 No
2007 Bogaert Cigars 1 100% 409 375 0,92 Tota l 34 0,08 11
Trademarks 34 *10-20 y
Cigars International 1 100% 807 493 0,61 Tota l 149 0,18 56
Customer l i s ts , computer systems etc. 1492006 No

Tele2 1 2009 No
MSEK 2008 Teleset Ltd, UTel and Digi ta l Expans ion 1 100% 143 100 0,70 Tota l 54 0,38 11 Other long-term l iabi l i ties -25Customer agreements 1 *1-25 y
Licenses 53 *4 y
2007 Telecom Euras ia 1 100% 129 0,00 0,002006 Four GSM operators in Northwest Russ ia 1 100% 260 68 0,26 Tota l 49 0,19 12 Deferred tax assets 21
Customer agreements 27 *1-25 yLicenses 22 *4 y
Tele2 Syd 1 75,1%, PGM 486 229 0,47 19 Total 105 0,22 *1-25 y 29Customer agreements 105
TeliaSonera 1 2009 Total 1 PGM 153 75 0,49 0,00MSEK 2008 Total 1 PGM 3382 2719 0,80 0,00
2007 Cygate 1 100% 680 263 0,39 0,00
Debitel Danmark 1 100% 1020 685 0,67 0,00MCT 1 100% 1784 1497 0,84 0,00
2006 Xfera 1 16,55%->76,56%, PGM 1407 1093 0,78 0,00NextGenTel 1 82,3%, PGM 2335 1843 0,79 0,00
Tieto Corporation 1 2009 NoMEUR 2008 No
2007 Fortuna 1 100% 20 14,8 0,74 Tota l 4,9 0,25 1,7Other 1 100% 15,8 10 0,63 Tota l 4,2 0,27 1,1
2006 Manpower Bus iness Solutions Service Center AB 1 100% 25,7 23,6 0,92 Tota l 2,7 0,11 0,8Other 1 27,7 19,8 0,71 Tota l 7,4 0,27 2,3 PPE 0,3
Other non current l iabi l i ties -0,1
Trelleborg 1 2009 NoMSEK 2008 Total 1 PGM 802 322 0,40 Tota l 75 0,09 *5 y 25 Operating assets -3
2007 Total 1 PGM 616 480 0,78 0,00 PPE 4
2006 CRP 1 100% 956 680 0,71 27 0,00 PPE 130Reeves 1 100% 1333 803 0,60 0,00 Operating assets 16
Other 1 PGM 806 499 0,62 0,00 PPE 5
Volvo 1 2009 NoMSEK 2008 No
2007 Nissan Diesel 1 100% 13554 5691 0,42 Tota l 4742 0,35 2452,172432 PPE -2650Product development 2795 *3-8 y Inventories 85Trademarks 1974 *10 y Other assets 5375Other intangible assets -27 Provis ions -2667
Ingersol l Rand´s Road Development Divis ion 1 100% 8889 5604 0,63 Tota l 837 0,09 432,8275677 Loans -3149Product development 233 *3-8 y Other l iabi l i ties -275Trademarks 546 *10 y PPE 217Distribution network 745 *20 y Inventories 57Other intangible assets -687 Provis ions -748
2006 No
No of companies 43 No of acqus i tions disclos ing PPA 117 Percentage of acquis i tions resulting in GW 97% Percentage of acquis i tions resulting in IA 74% Percentage of acquis i tions resulting in reva lued TA 42%Average (GW/cons ideration transferred) 48% Average (IA/cons ideration transferred) 30%
Median (GW/cons ideration transferred) 50% Median (IA/cons ideration transferred) 19%*Useful l i fe not shown for the speci fic asset but for the company in genera lGW = Goodwi l lPGM = Purchased goodwi l l method

Appendix
Quantitative Study: Table of Impairments and Amortizations
Company CGU Revenue Revenue MSEK/CGU Impairment of GW GW Impairment of GW/GW Impairment of GW/Revenue Amortization of IA IA Amortization of IA/IA Amortization of IA/Revenue Impairment IA IA Impairment of IA/IA Impairment of IA/Revenue
ABB 2009 7 31 795 32604 0 2 817 155 1 566 27% 2% 0
MUSD 2008 6 34912 44988 0 3026 154 1 597 26% 2% 0
2007 7 24816 22835 7 1 2428 0% 0% 125 1 395 32% 1% 0
2006 7 19503 19115 0 2369 134 1 420 32% 1% 0
Alfa Laval 2009 2 26039 13020 0 6143 233 1 2719 9% 1% 0
MSEK 2008 2 27850 13925 0 5383 143 1 2029 7% 1% 0
2007 2 24849 12425 0 4459 249 1 1520 16% 1% 0
2006 2 19802 9901 0 3706 243 1 1432 17% 1% 0
Alliance Oil Co 2009 No info 5936
2008 No info 8554
Assa Abloy 2009 5 34963 6993 64 1 20397 0% 0% 162 1 2153 8% 0% 0
MSEK 2008 5 34829 6966 0 20669 124 1 2117 6% 0% 0
2007 5 33550 6710 0 17271 317 1 2446 13% 1% 0
2006 4 31137 7784 0 16683 92 1 1641 6% 0% 0
AstraZeneca 2009 1 32804 235470 0 9889 729 1 13370 5% 2% 415 1 13370 3% 1%
MUSD 2008 1 31601 244329 0 9874 807 1 13761 6% 3% 631 1 13761 5% 2%
2007 1 29559 190398 0 9884 554 1 12141 5% 2% 120 1 12141 1% 0%
2006 1 26475 181634 0 1097 325 1 3449 9% 1% 17 1 3449 0% 0%
Atlas Copco 2009 20 63762 3188 16 1 8270 0% 0% 685 1 5133 13% 1% 23 1 5133 0% 0%
MSEK 2008 20 74177 3709 0 7902 597 1 5121 12% 1% 7 1 5121 0% 0%
2007 20 63355 3168 0 7902 481 1 4244 11% 1% 0
2006 17 50512 2971 0 2571 375 1 2108 18% 1% 5 1 2108 0% 0%
Autoliv 2009 3 5120,7 12252 0 1614,4 23,1 1 137,4 17% 0% 0
MUSD 2008 3 6473,2 16683 0 1607,8 23,6 1 161 15% 0% 0
2007 3 6769 14534 0 1613,4 20,3 1 166,4 12% 0% 0
2006 3 6188 14151 0 1537,1 18,9 1 158,1 12% 0% 0
Axfood 2009 5 32378 6476 0 1539 78 1 682 11% 0% 0
MSEK 2008 5 31663 6333 0 1536 64 1 560 11% 0% 0
2007 4 29189 7297,25 0 1182 147 1 466 32% 1% 0
2006 4 28808 7202 0 1131 109 1 345 32% 0% 0
Boliden 2009 5 27635 5527 0 3328 5 1 36 14% 0% 0
MSEK 2008 5 30987 6197 0 3303 6 1 34 18% 0% 0
2007 5 33204 6641 0 3173 6 1 30 20% 0% 0
2006 5 35213 7043 0 3049 6 1 34 18% 0% 0
Castellum 2009 2694 0 0
MSEK 2008 2501 0 0
2007 2259 0 0
2006 2014 0 0
Electrolux 2009 4 109132 27283 0 2274 594 1 3593 17% 1% 0
MSEK 2008 4 104792 26198 3 1 2098 0% 0% 481 1 3347 14% 0% 43 1 3347 1% 0%
2007 3 104732 34911 0 2024 413 1 3327 12% 0% 16 1 3327 0% 0%
2006 4 103848 25962 0 1981 474 1 2847 17% 0% -1 1 2847 0% 0%
Elekta 2009 6 7392 1232 0 2224 151 1 3031 5% 2% 0
MSEK 2008 6 6689 1115 0 2390 134 1 3284 4% 2% 0
2007 7 5081 726 0 1973 104 1 790 13% 2% 0
2006 5 4525 905 0 1586 66 1 678 10% 1% 0
Ericsson 2009 3 206477 68826 0 27375 4209 1 29439 14% 2% 4412 1 29439 15% 2%
MSEK 2008 3 208930 69643 0 24877 5006 1 28937 17% 2% 562 1 28937 2% 0%
2007 3 187780 62593 0 22826 5433 1 33068 16% 3% 16 1 33068 0% 0%
2006 1 179821 179821 0 6824 4237 1 25123 17% 2% 242 1 25123 1% 0%
Fabege 2009 2194 0 0
MSEK 2008 2214 0 0
2007 2066 0 0
2006 2343 0 0
Getinge 2009 3 22816 7605 0 11319 796 1 6967 11% 3% 0
MSEK 2008 3 19272 6424 0 14183 446 1 5106 9% 2% 0
2007 3 16445 5482 0 8128 220 1 2488 9% 1% 0
2006 3 13001 4334 0 4707 84 1 893 9% 1% 0
Hakon invest Financial company
HM 2009 2 101393 50697 0 424 182 1 1432 13% 0% 0
MSEK 2008 No info 88532 0 431 109 1 1334 8% 0% 0
2007 No GW 92123 0 0 50 1 316 16% 0% 0
2006 No GW 80081 0 0 45 1 267 17% 0% 0
Hexagon 2009 6 11811 1969 0 10196 472 1 6668 7% 4% -4 1 6668 0% 0%
MSEK 2008 6 14479 2413 0 10522 418 1 6724 6% 3% -4 1 6724 0% 0%
2007 Approx 6 14587 2431 0 9523 305 1 5128 6% 2% 195 1 5128 4% 1%
2006 Approx 6 13469 2245 0 5973 261 1 4344 6% 2% 15 1 4344 0% 0%
Holmen 2009 No GW 18071 0 9 1 36 25% 0% 0
MSEK 2008 No GW 19334 0 13 1 119 11% 0% 0
2007 No info 19159 569 1 569 100% 3% 12 1 54 22% 0% 0

2006 No info 18592 0 557 7 1 77 9% 0% 0
Hufvudstaden 2009 1371,7 0 0
MSEK 2008 1347,6 0 0
2007 1276,2 0 0
2006 1152,5 0 0
Husqvarna 2009 5 34074 6815 0 6461 300 1 4805 6% 1% 94 1 4805 2% 0%
MSEK 2008 5 32342 6468 0 6788 237 1 5028 5% 1% 2 1 5028 0% 0%
2007 >2 33284 16642 0 5467 299 1 4557 7% 1% 4 1 4557 0% 0%
2006 4 29402 7351 0 1780 208 1 950 22% 1% 1 1 950 0% 0%
Industriliv Financial company
Investor Financial company
Kinnevik Financial company
Latour Financial company
Lundbergföretagen Financial company
Lundin mining 2009 2 746 2677 0 250 0
MUSD 2008 2 835 3228 237 1 480 49% 28% 0
2007 2 1060 3414 350 1 854 41% 33% 0
2006 2 540 1852 0 616 0
Meda 2009 3 13178 4393 0 13260 1364 1 28817 5% 10% 0
MSEK 2008 3 10675 3558 0 14256 1035 1 30644 3% 10% 0
2007 3 8145 2715 0 11584 695 1 13216 5% 9% 0
2006 2 5256 2628 0 5082 298 1 3841 8% 6% 0
Melker Schörling Financial company
Millicom 2009 8 3373 3026 0 548 88 1 585 15% 3% 0
MUSD 2008 7 3151 3480 3 1 510 1% 0% 66 1 549 12% 2% 0
2007 6 2631 2825 0 184 49 1 333 15% 2% 0
2006 6 1576 1802 0 196 40 1 326 12% 3% 0
MTG 2009 5 14173 2835 3252 1 8491 38% 23% 76 1 1540 5% 1% 41 1 1540 3% 0%
MSEK 2008 5 13166 2633 76 1 8874 1% 1% 105 1 1704 6% 1% 16 1 1704 1% 0%
2007 >3 11351 3784 0 2491 66 1 1189 6% 1% 13 1 1189 1% 0%
2006 >3 10136 3379 38 1 2273 2% 0% 87 1 1014 9% 1% 50 1 1014 5% 0%
NCC 2009 3 51817 17272 0 1750 21 1 136 15% -5 1 136 -4% 0%
MSEK 2008 3 57465 19155 32 1 1804 2% 0% 25 1 147 17% 147
2007 2 58397 29199 90 1 1741 5% 0% 29 1 147 20% 22 1 147 15% 0%
2006 2 55876 27938 20 1 1720 1% 0% 21 1 134 16% 134
Nordea Financial company
Oriflame 2009 4 1317 3382 0 5 3 1 15 20% 0% 0
MEUR 2008 4 1320 3609 0 5 3 1 10 30% 0% 0
2007 4 1109 2622 0 5 1,933 1 9,428 21% 0% 0
2006 4 918 2075 0 5 1,478 1 7,473 20% 0% 0
Peab 2009 12 35140 2928 9 1 1758 1% 0% 61 1 588 10% 0% 4 1 588 1% 0%
MSEK 2008 12 34132 2844 0 1781 18 1 349 5% 0% 0
2007 13 31977 2460 39 1 552 7% 0% 3 1 149 2% 0% 0
2006 9 26132 2904 0 335 0 136 19 1 136 14% 0%
Saab 2009 9 24647 2739 3457 858 1 4524 19% 3% 15 1 4524 0% 0%
MSEK 2008 9 23796 2644 103 1 3541 3% 0% 663 1 5165 13% 3% 250 1 5165 5% 1%
2007 9 23021 2558 3404 566 1 5210 11% 2% 108 1 5210 2% 0%
2006 9 21063 2340 15 1 3309 0% 0% 299 1 4906 6% 1% 80 1 4906 2% 0%
Sandvik 2009 11 71937 6540 0 11135 312 1 3115 10% 0% -67 1 3115 -2% 0%
MSEK 2008 11 92654 8423 0 9831 265 1 2544 10% 0% 74 1 2544 3% 0%
2007 10 86338 8634 0 8933 408 1 2900 14% 0% 0
2006 6 72289 12048 0 5156 283 1 1441 20% 0% 62 1 1441 4% 0%
SCA 2009 6 110857 18476 0 19147 348 1 3534 10% 0% 24 1 3534 1% 0%
MSEK 2008 6 110449 18408 0 19374 316 1 3775 8% 0% 0
2007 6 108144 18024 0 18161 299 1 3909 8% 0% 228 1 3909 6% 0%
2006 7 103744 14821 0 16997 227 1 3020 8% 0% 4 1 3020 0% 0%
Scania 2009 No info 0 1296 307 1 1328 23% 0
MSEK 2008 No info 0 1307 519 1 1543 34% 0
2007 No info 0 1221 466 1 1756 27% 0
2006 No info 0 1041 404 1 1827 22% 0
SEB Financial company
Seco Tools 2009 1 4889 4889 0 227 21 1 151 14% 0% 0
MSEK 2008 1 6536 6536 0 243 39 1 173 23% 1% 0
2007 1 6034 6034 0 157 43 1 130 33% 1% 0
2006 1 5451 5451 0 151 34 1 133 26% 1% 0
Securitas 2009 > 5 62666,7 12533 0 13558,3 76,3 1 354,7 22% 0% 0
MSEK 2008 >5 56571,6 11314 0 14104,3 68,2 1 323,4 21% 0% 0
2007 >5 62907,6 12582 349,9 1 14143,4 2% 1% 174 1 1040,9 17% 0% 8,5 1 1040,9 1% 0%
2006 >5 60532 12106 41,2 1 14072,8 0% 0% 190,7 1 819,4 23% 0% -8,2 1 819,4 -1% 0%

Skanska 2009 7 136803 19543 210 1 4573 5% 0% 109 1 934 12% 0% 0
MSEK 2008 7 143674 20525 0 4442 91 1 895 10% 0% 0
2007 7 138781 19826 0 4584 106 1 779 14% 0% 15 1 779 2% 0%
2006 7 125603 17943 0 4490 63 1 803 8% 0% 0
SKF 2009 6 56227 9371 0 293 222 1 1396 16% 0% 0
MSEK 2008 6 63361 10560 40 1 344 12% 0% 257 1 1188 22% 0% 2 1 1188 0% 0%
2007 5 58559 11712 13 1 240 5% 0% 130 1 692 19% 0% 6 1 692 1% 0%
2006 5 53101 10620 128 1 266 48% 0% 61 1 1513 4% 0% 7 1 1513 0% 0%
SSAB 2009 2 29838 14919 0 19701 907 1 8503 11% 3% 0
MSEK 2008 2 54239 27120 0 21101 934 1 9065 10% 2% 0
2007 2 47651 23826 0 30203 476 1 10921 4% 1% 0
2006 2 31054 15527 0 0 1 1 11 9% 0% 0
Stora Enso 2009 7 9117,9 13379 0 208,3 0 44,3 0
MEUR 2008 9 11149 13546 236 1 443,6 53% 2% 0 68,7 0
2007 9 13487,4 14170 233 1 735,7 32% 2% 37,5 1 217 17% 0% 20,4 1 217 9% 0%
2006 7 13322,1 17204 9 1 915,8 1% 0% -39 1 136,5 -29% 0% 5,1 1 136,5 4% 0%
Swedbank Financial company
Swedish match 2009 9 25483 2831 0 2609 128 1 1311 10% 1% 0
MSEK 2008 9 22793 2533 0 3166 139 1 1675 8% 1% 0
2007 No info 22852 0 2799 135 1 1755 8% 1% 0
2006 No info 21991 0 1991 132 1 1610 8% 1% 0
Tele2 2009 9 39265 4363 5 1 10184 0% 0% 597 1 2826 21% 2% 0
MSEK 2008 9 38272 4252 986 1 12459 8% 3% 804 1 2261 36% 2% 322 1 2261 14% 1%
2007 9 43420 4824 1315 1 13918 9% 3% 910 1 3549 26% 2% 550 1 3549 15% 1%
2006 9 43098 4789 3300 1 21791 15% 8% 1042 1 4395 24% 2% 0
TeliaSonera 2009 8 109161 13645 4 1 85741 0% 0% 2688 1 17299 16% 2% 109 1 17299 1% 0%
MSEK 2008 8 103585 12948 0 84431 2450 1 19082 13% 2% 95 1 19082 0% 0%
2007 5 96344 19269 10 1 71182 0% 0% 2615 1 15564 17% 3% 212 1 15564 1% 0%
2006 6 91060 15177 5 1 62643 0% 0% 2403 1 13950 17% 3% 13 1 13950 0% 0%
Tieto Corporation 2009 3 1723,8 5902 0 402 22,1 1 68,9 32% 1% 0
MEUR 2008 3 1876,5 6840 0 389,3 20,8 1 73,9 28% 1% 0
2007 3 1772,4 5586 40 1 455,7 9% 2% 32,7 1 99,1 33% 2% 0
2006 3 1646,5 4961 0 448,4 21,4 1 104 21% 1% 0
Trelleborg 2009 4 27059 6765 0 10 478 167 1 971 17% 1% 0
MSEK 2008 4 31263 7816 0 10901 157 1 1089 14% 1% 0
2007 4 30810 7703 53 1 9434 1% 0% 149 1 882 17% 0% 16 1 882 2% 0%
2006 5 26875 5375 157 1 9125 2% 1% 114 1 681 17% 0% 0
Volvo 2009 7 218 361 31194 0 23 837 3526 1 21415 16% 2% 0
MSEK 2008 7 303667 43381 0 24813 3286 1 22431 15% 1% 0
2007 7 285405 40772 0 19969 2719 1 19258 14% 1% 0
2006 6 258835 43139 1712 1 10561 16% 1% 1850 1 21047 9% 1% 80 1 21047 0% 0%
No of GW Impairments 38 No of IA Amortizations 149 No of IA Impairments 56
Average (Revenue(MSEK)/No of CGU) 18868 Average (GW Impairment/GW) 12% Average (IA Amortization/IA) 14% Average (IA Impairment/IA) 3%
Median (Revenue(MSEK)/No of CGU) 7202 Average (GW Impairment/Revenue) 3% Average (IA Amortization/Revenue) 1% Average (IA Impairment/Revenue) 0,3%