purification of sorbitol using reverse osmosis membrane: effect of
TRANSCRIPT
III
PURIFICATION OF SORBITOL USING REVERSE
OSMOSIS MEMBRANE: EFFECT OF CROSS
FLOW VELOCITY AND TRANSMEMBRANE
PRESSURE
NUR ATHIRAH BINTI SABARUDIN
Thesis submitted in partial fulfilment of the requirements
for the award of the degree of
Bachelor of Chemical Engineering (Biotechnology)
Faculty of Chemical & Natural Resources Engineering
UNIVERSITI MALAYSIA PAHANG
JUNE 2014
© NUR ATHIRAH BINTI SABARUDIN (2014)
VIII
ABSTRACT
Sorbitol, a sugar alcohol that has formula of C6H14O6 also known as D-Glucitol. It can
be obtained from the reduction of glucose, by changing the aldehyde group to hydroxyl
group. It is very slow to metabolize in body, which lessen the chance of increasing the
level of insulin, thus makes sorbitol is a good sweetener for diabetics. Since the use of
sorbitol in the food industry more widely, sorbitol purity is a key factor before it is used
as an additive in food. One of the method to purify sorbitol is application of membrane
technology. However the membrane application is limited due tochallenges such as
decay in permeate flux and increases the complexity of membrane operations. Thus, this
research was conducted to study the effect of cross flow velocity (CFV) and
transmembrane pressure (TMP) on the flux in purification of sorbitol using the reverse
osmosis membrane. The flux was determined from the calculated of permeate flow rate
divide by the area of spiral wound membrane. In order to study the optimize condition
for the process, the value of TMP and CFV was varied to obtained the flux value. While
varying the CFV value, the TMP value was constant and when the TMP was varied, the
CFV was constant. This study was conducted for 60 minutes, and every 10 minutes the
permeate flow rate was collected to get the flux value. The solution was prepared with
constant concentration of 10g/L in a 100 L solution in tank. The determination of
sorbitol was analyze by refractometer. Based on the result obtained, increasing in CFV
and TMP give the highest flux value.
IX
ABSTRAK
Sorbitol, sejenis gula alkohol yang mempunyai formula C6H14O6 juga dikenali sebagai
D- Glucitol Ia boleh diperolehi daripada pengurangan glukosa, dengan menukar
kumpulan aldehid kepada kumpulan hidroksil. Ia sangat lambat untuk
dimetabolismekan dalam badan , dimana dapat mengurangkan peluang peningkatan
tahap insulin maka menjadikan ianya sesuai sebagai pemanis bagi pesakit kencing
manis. Oleh kerana penggunaan sorbitol dalam industri makanan sangat meluas,
ketulenan sorbitol adalah faktor penting sebelum ia digunakan sebagai bahan tambahan
dalam makanan. Salah satu kaedah untuk menulenkan sorbitol adalah penggunaan
teknologi membran. Walau bagaimanapun penggunaan membran adalah terhad
disebabkan cabaran seperti penurunan fluks dan meningkatkan kerumitan operasi
membran. Oleh itu, kajian ini telah dijalankan untuk mengkaji kesan halaju aliran silang
(CFV) dan tekanan transmembran (TMP) pada fluks dalam penulenan sorbitol
menggunakan membran osmosis berbalik. Fluks ditentukan daripada kadar aliran
isipadu dibahagi dengan luas membran. Dalam usaha untuk mengkaji keadaan yang
paling optimum untuk proses, nilai halaju aliran silang dan tekanan transmembran telah
diubah untuk memperolehi nilai fluks. Apabila nilai nilai halaju aliran silang diubah,
maka nilai tekanan transmembran adalah tetap dan sebaliknya. Kajian ini dijalankan
selama 60 minit, dan setiap 10 minit kadar aliran isipadu dikumpulkan untuk
mendapatkan nilai fluks. Larutan sorbitol disediakan dengan kepekatan tetap pada
10g/L di dalam larutan tangki 100 L. Sorbitol ditentukan dengan menganalisis
menggunakan refraktometer. Hasil yang diperolehi menunjukkan peningkatkan halaju
aliran silang (CFV) dan tekanan transmembrane (TMP) memberi memberikan nilai
fluks yang maksimum.
X
TABLE OF CONTENTS
SUPERVISOR’S DECLARATION ............................................................................... IV
STUDENT’S DECLARATION ...................................................................................... V
Dedication ....................................................................................................................... VI
ACKNOWLEDGEMENT ............................................................................................. VII
ABSTRACT ................................................................................................................. VIII
ABSTRAK ...................................................................................................................... IX
TABLE OF CONTENTS ................................................................................................. X
LIST OF FIGURES ....................................................................................................... XII
LIST OF TABLES ....................................................................................................... XIV
LIST OF SYMBOLS .................................................................................................... XV
LIST OF ABBREVIATIONS ...................................................................................... XVI
1 INTRODUCTION .................................................................................................... 1
1.1 Background of research ...................................................................................... 1
1.2 Motivation .......................................................................................................... 3
1.3 Problem statement .............................................................................................. 4
1.4 Objectives ........................................................................................................... 4
1.5 Scope of this research ......................................................................................... 5
1.6 Thesis outline ..................................................................................................... 5
2 LITERATURE REVIEW ......................................................................................... 6
2.1 Overview ............................................................................................................ 6
2.2 Purification ......................................................................................................... 8
2.3 Reverse osmosis membrane ............................................................................. 10
2.4 Membrane applications .................................................................................... 10
2.5 Spiral wound membrane .................................................................................. 17
2.6 Flux .................................................................................................................. 20
2.7 Membrane cleaning .......................................................................................... 21
2.8 Cross flow velocity (CFV) ............................................................................... 22
2.9 Transmembrane pressure (TMP) ...................................................................... 22
2.10 Refractometer ............................................................................................... 23
2.11 Fourier transform infra-red (FTIR) .............................................................. 24
2.12 Response surface methodology (RSM) ........................................................ 24
2.13 Inductively Coupled Plasma – Mass Spectrophotemeter ............................. 25
2.14 Heavy metals ................................................................................................ 26
3 METHODOLOGY ................................................................................................. 28
3.1 Introduction ...................................................................................................... 28
3.2 General methodology ....................................................................................... 28
3.3 Fourier Transform Infrared Spectroscopy (FTIR) ........................................... 29
3.4 Heavy metal determination using ICP-MS ...................................................... 29
3.5 Preparation of sample ....................................................................................... 32
3.6 Purification process .......................................................................................... 32
3.7 Membrane cleaning .......................................................................................... 35
3.8 Brix reading ...................................................................................................... 35
3.9 Optimization of sorbitol purification using Response Surface Methodology
(RSM) ......................................................................................................................... 36
4 RESULT AND DISCUSSION ............................................................................... 39
4.1 Introduction ...................................................................................................... 39
XI
4.2 Fourier Transform Infrared spectroscopy (FTIR) ............................................ 39
4.3 Inductively Coupled Plasma –Mass Spectrophotometer (ICP-MS)................. 41
4.4 Effect of cross flow velocity on permeate flux ................................................ 42
4.4.1 Effect on flux at CFV 0.204 m/s ................................................................ 42
4.4.2 Effect on flux at CFV 1.042 m/s ................................................................ 43
4.4.3 Effect on flux at CFV 1.47 m/s .................................................................. 45
4.4.4 Effect on flux at CFV1.57 m/s ................................................................... 46
4.4.5 Comparison of effect on flux at different CFV value ................................ 47
4.5 Effects of transmembrane pressure on permeate flux. ..................................... 48
4.5.1 Effect on flux at TMP 1.5 bars .................................................................. 48
4.5.2 Effect on flux at TMP 2 bars ..................................................................... 49
4.5.3 Effect on flux at TMP 2.5 bars .................................................................. 50
4.5.4 Effect on flux at TMP 3 bars ..................................................................... 52
4.5.5 Effect on flux at different TMP values ...................................................... 53
4.6 Effect of flux declination during sorbitol purification ..................................... 54
4.7 Brix reading of sorbitol solution ...................................................................... 55
4.8 Optimization using Response Surface Methodology ....................................... 56
4.8.1 Optimization of sorbitol purification process flux .................................... 58
4.8.2 Validation of Empirical Model Adequacy ................................................ 63
5 CONCLUSION AND RECOMMENDATION ...................................................... 64
5.1 Conclusion........................................................................................................ 64
5.2 Recommendation .............................................................................................. 64
REFERENCES ............................................................................................................... 65
APPENDIX ..................................................................................................................... 69
XII
LIST OF FIGURES
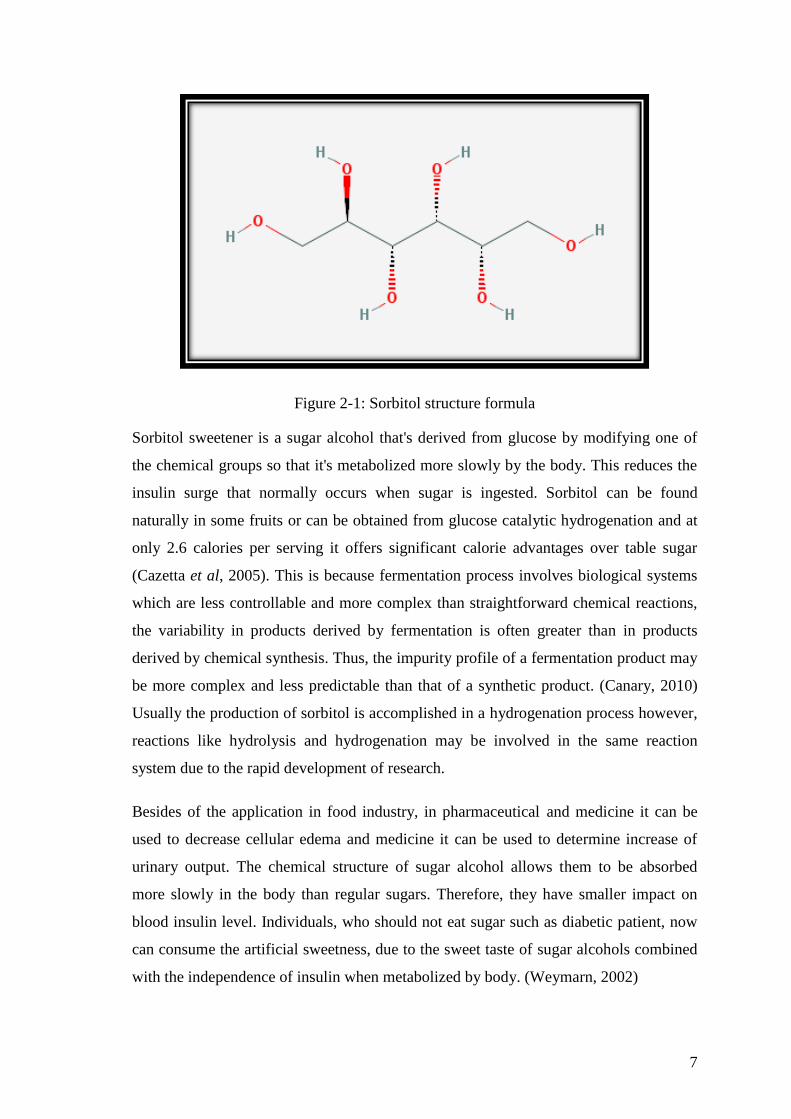
Figure 2-1: Sorbitol structure formula .............................................................................. 7
Figure 2-2: Simple osmosis ............................................................................................ 14
Figure 2-3: Simple Reverse Osmosis .............................................................................. 15
Figure 2-4: Process flow through spiral wound membrane ............................................ 18
Figure 2-5: Dead End Filtration mechanism ................................................................... 19
Figure 2-6: Cross Flow Filtration Mechanism ................................................................ 20
Figure 3-1: Process flow for sorbitol purification .......................................................... 28
Figure 3-2: ICP-MS Agilent 7500 series ........................................................................ 29
Figure 3-3: Detection and quantitation limits in micrograms per litre for ICP-MS using
internal standard manifold injection ............................................................................... 31
Figure 3-4: Reverse osmosis membrane system ............................................................. 32
Figure 3-5: Purification operation diagram .................................................................... 33
Figure 3-6: Permeate sample was collected .................................................................... 34
Figure 3-7: Collected sample .......................................................................................... 34
Figure 3-8: Membrane was cleaning using backwashing method .................................. 35
Figure 3-9: Refractometer ............................................................................................... 36
Figure 4-1: Sample before purification ........................................................................... 40
Figure 4-2: Sample after the purification ........................................................................ 40
Figure 4-3: Flux pattern at CFV of 0.204 m/s ................................................................ 43
Figure 4-4: Flux pattern at CFV of 1.042 m/s ................................................................ 44
Figure 4-5: Flux pattern at CFV of 1.47 m/s .................................................................. 45
Figure 4-6: Flux pattern at CFV of 1.57 m/s .................................................................. 46
Figure 4-7: Comparison of Flux pattern at different CFV values ................................... 48
Figure 4-8: Flux pattern at TMP of 1.5 bars ................................................................... 49
Figure 4-9:Flux pattern at TMP of 2 bars ....................................................................... 50
Figure 4-10: Flux pattern at TMP of 2.5 bars ................................................................. 51
Figure 4-11: Flux pattern at TMP of 3 bars .................................................................... 53
Figure 4-12: Comparison of permeate flux at different TMP values ............................. 54
Figure 4-13: Flux pattern at CFV 0.204 m/s ................................................................... 55
Figure 4-14: Brix reading of retentate solution with operation time .............................. 56
Figure 4-15: Normal probability plot of residual for rejection rate ................................ 60
Figure 4-16: Plot of residuals versus predicted response for rejection rate .................... 60
Figure 4-17: Normal Plot of Residuals Plot .................................................................... 61
XIII
Figure 4-18: Contour plot and response surface curves of flux for interaction of CFV
and TMP. ........................................................................................................................ 62
XIV
LIST OF TABLES
Table 2-1: Properties of sorbitol and xylitol ..................................................................... 6
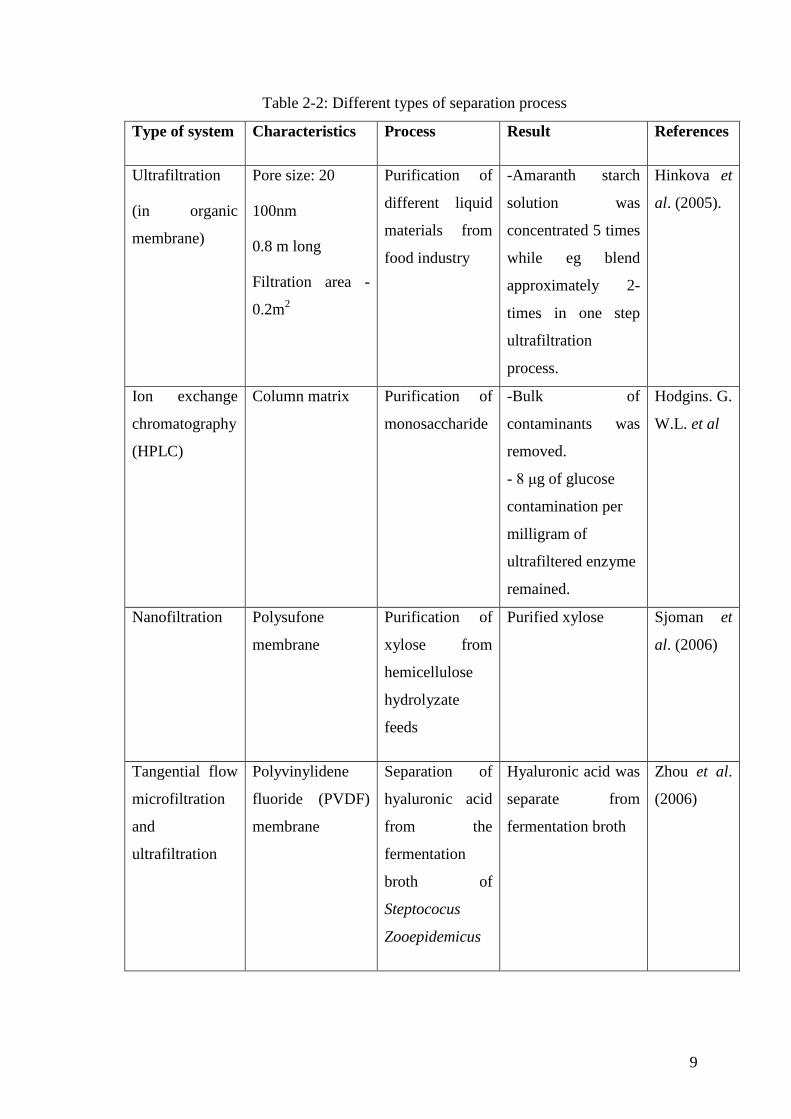
Table 2-2: Different types of separation process .............................................................. 9
Table 2-3: The MWCO for different type of membranes ............................................... 15
Table 2-4: The effect of difference types of membrane ................................................. 16
Table 2-5: Comparison between dead end filtration and cross flow filtration ............... 19
Table 3-1: Parameter and levels used in RSM ................................................................ 37
Table 3-2: Design Layout of RSM ................................................................................. 38
Table 4-1: Result of concentration of heavy metal contain in the sample ...................... 42
Table 4-2: Result of permeate flux at CFV 0.204 m/s .................................................... 42
Table 4-3: Result of permeate flux at CFV 1.042 m/s .................................................... 43
Table 4-4: Result of permeate flux at CFV 1.47 m/s ...................................................... 45
Table 4-5: Result of permeate flux at CFV 1.57 m/s ...................................................... 46
Table 4-6: Result of permeate flux at TMP 1.5 bars ...................................................... 48
Table 4-7: Result of permeate flux at TMP 2 bars ......................................................... 49
Table 4-8: Result of permeate flux at TMP 2.5 bars ...................................................... 50
Table 4-9: Result of permeate flux at TMP 3 bars ......................................................... 52
Table 4-10: Design layout and experimental result ........................................................ 57
Table 4-11: ANOVA table (partial sum of square) for quadratic model (response flux)59
Table 4-12: Results of operating conditions with experimental design in confirmation
run ................................................................................................................................... 63
XV
LIST OF SYMBOLS
J Flux
LMH Flux through the membrane
t Time
Q Volume flow rate
XVI
LIST OF ABBREVIATIONS
CCD Central Composite Design
CFV Cross flow velocity
FTIR Fourier transform infrared spectroscopy
ICP-MS Inductively coupled plasma – mass spectrophotometer
MW Molecular weight
MWCO Molecular weight cut off
OFAT One factor at a time
RO Reverse osmosis
RSM Response surface methodology
SEM Electric resistance tomography
TMP Transmembrane pressure
1
1 INTRODUCTION
1.1 Background of research
Polyols was commonly used for personal care industry, both the cosmetics and toiletries
sectors and began to play an important role in a market characterized by growing
interest in alternatives to animal-derived ingredients. Therefore, polyols were
incorporated as excipients in the manufacture of the essential ranges of personal care
products like toothpaste, creams and lotions, make-up, perfumes or deodorants.
Sugar alcohols were a class of polyols in which sugar’s carbonyl, ketone or aldehyde is
reduced to the corresponding primary or secondary hydroxyl group. Sorbitol is a sugar
alcohol that has the molecular weight of 182.17 g/mole and melting point of 95oC while
the boiling point is 296oC. The IUPAC name for sorbitol is (2S,3R,4R,5R)-hexane-
1,2,3,4,5,6-hexol. Sorbitol is about 60% as sweet as sucrose with 1/3 fewer calories. It
has been safely used in processed foods for almost half a century, also used in other
products such as pharmaceuticals and cosmetics. (Baines et al., 1975), U.S. Patent
3927201, states that the refractive index of sorbitol as a 70% solution in water is 1.45.
Developed in the 1950s, sorbitol was the most consumed sugar alcohol. In all
applications, demand for sorbitol was largely a function of its unique combination of
functional properties as a humectant, sweetener, bulking agent, stabilizer, softener,
emulsifier, and its surface-active properties. Applications in personal care products
(mainly toothpaste), food and confections and in the manufacture of vitamin C
accounted for 78% of world consumption in 2007 and continue to account for over 75%
of world demand in the near future. (Bizzari et.al)
Although sorbitol were less effective than xylitol in controlling the caries, but the lower
cost of sorbitol makes it to be more demanding to be used as the sugar substitute in the
food manufacturing. It is also be consumed by people in relatively large amount without
side-effects. However, they can act as a laxative. It does not promote caries because it
metabolized either slowly or not at all in dental plaque. For people with diabetics, there
was some restriction for them to consume the glucose continuously. But, they was
advised to take the artificial sweetener such as sorbitol, that has a fewer calories than
glucose. It has been recommended used in dietetic food products which it lends
2
palatability and bulk. It was believed converted to glycogen to be liberated as glucose
without producing hyperglycemia.
In this study, a reverse osmosis membrane was used in performing the purification
process that increased the purity of sorbitol. However, during the process problems
such as flux declination during the separation process, that can be reduced by applying a
high transmembrane pressure and high cross flow velocity, thus will improve membrane
flux and reduce the fouling of the membrane. Reverse Osmosis has many advantages
over the conventional water and wastewater treatment operations and processes. It is
able in removing many dissolved substances efficiently, yet produce good quality
finished water. It does not require any addition of chemicals into the water for
separation. The separation of the dissolved substances from the influent is achieved
physically or physico-chemically. It is essentially a molecular squeezing process, using
a semi-permeable membrane which causes water molecules to separate from the
contaminants then the separated water molecules pass through to the inside of the
membrane to a holding reservoir. Recently, reverse osmosis has been used in treating
boiler feed water, in addition to industrial and process wastewaters. Boilers are found
throughout the chemical processing industry and the primary method to treat boiler
wastewater is ion-exchange. However, reverse osmosis has been demonstrated to be
more cost effective than this demineralization process.
The International Union of Pure and Applied Chemistry (IUPAC) define reverse
osmosis as a “pressure-driven process in which applied transmembrane pressure causes
selective movement of solvent against its osmotic pressure difference” (IUPAC 1996).
Reverse osmosis (also called hyperfiltration, is capable of the highest filtration level
possible, including separating dissolved salts and removing bacteria, pathogens and
organics from water. The applications of reverse osmosis include but are not limited to
separation and concentration of solutes in many fields, such as chemical and biomedical
industry, food and beverage processing, and water and wastewater treatment.
Wide application of reverse osmosis such as for seawater desalination, groundwater
treatment, and for tertiary treatment to reclaim the secondary effluent for advance reuses
purposes. In addition to removing total dissolved solid, reverse osmosis is very effective
in reducing other minerals, ammonia, and total organic carbon (TOC). The membranes
3
remove 90 percent of total dissolved solid. It is useful for separating thermally and
chemically unstable products.
1.2 Motivation
Nowadays, the number of patients with diabetics had achieved a very alarming number.
One of the factors of diabetics is the diet that is taken by the people worlds wide besides
obesity and sedentary lifestyles (Vischer et al, 2009). Unstable diet with high content of
sugars can causes diabetics. Surprisingly, Malaysia has one of the world’s greatest
numbers of diabetic cases among its population with 2.6 million registered patients
(Adie, 2012). Untreated diabetics may cause chronic renal failure (Mauro et al, 2001).
Sugar substitute products regulate sugar intake by consumers, which helps promote
healthy weight maintenance and improve blood glucose control. Hence, play an
important role in the health and well-being of an individual. The benefits of consuming
these substitutes sugar are highly valuable for all people that also have skin smoothing
properties. (Chen, 1985)
Interest now arises because of their multiple potential health benefits. They are non-
cariogenic (sugar-free tooth-friendly), low-glycaemic (potentially helpful in diabetes
and cardiovascular disease), low-energy and low-insulinaemic (potentially helpful in
obesity), low-digestible (potentially helpful in the colon), osmotic (colon-hydrating,
laxative and purifying) carbohydrates. Glycaemic Index values on replacing sucrose
were independent of both intake (up to 50 g) and the state of carbohydrate metabolism.
Although it is not an essential nutrient, they contribute to clinically recognized
maintenance of a healthy colonic environment and function. A role for polyols to
hydrate the colonic contents and aid laxation is now recognized by physicians and
favors saccharolytic anaerobes and aciduric organisms in the colon, purifying the colon
of endotoxic, putrefying and pathological organisms, which has clinical relevance.
Polyols also contribute towards short-chain organic acid formation for a healthy colonic
epithelium.
4
1.3 Problem statement
Lacking of previous research that in purification of sorbitol using the membrane
separation techniques. The problem of this research is to find the most appropriate
condition that can enhance the purification of sorbitol using the low pressure reverse
osmosis membrane. The purification of sorbitol is important in order to remove the
impurities to produce pure product. The impurities will then reduce the quality of
sorbitol hence the economic value will be low.
Although application of membrane purification is the most effective process at present,
the challenges for membrane purification of sorbitol because of problem faced is decay
in permeate flux, which cause by fouling. In order to reduce the fouling by varying the
transmembrane pressure and cross flow velocity to the optimum condition thus
enhances the membrane flux.
Thus, this research proposed studying the purification process of sorbitol using
membrane technology and determining the factors that affect the permeate flux. The
suitable parameters that will be determined include cross flow velocity (CFV) and
transmembrane pressure (TMP).
1.4 Objectives
The main objective of this research is to purify Sorbitol by using Low Pressure Reverse
Osmosis Membrane System.
This research also has a few specific objectives that are:
i. To determine the effect of cross flow velocity and transmembrane pressure on
flux during sorbitol filtration.
ii. To determine the optimum condition of sorbitol flux using RSM.
5
1.5 Scope of this research
The scopes of study are:
1) Purification using GE Membrane was focused in this study.
2) Transmembrane pressure and cross flow velocity was adjusted to determine the
membrane flux.
3) The volume of permeate and retentate was collected every 10 minutes.
4) The sample was analyzed by Fourier Transform Infra-Red (FTIR), refractometer,
and ICPMS.
5) The optimization condition of operating parameters, including cross flow velocity
(CFV) and transmembrane pressure (TMP) has been done by the Response Surface
Methodology (RSM)
1.6 Thesis outline
This report contains five chapters that consist of first chapter that includes the
background of research, problem statement, objectives of the research, scopes of study,
and thesis outline. Second chapter is the literature review on sorbitol, purification,
membrane, CFV, TMP, membrane cleaning and analysis performed. Methodology was
discussed in chapter 3 which comprises of materials and experiment procedures. The
discussions of the findings are delivered in Chapter 4 that discusses about effect of cross
flow velocity (CFV) and transmembrane pressure (TMP) towards permeate flux. While
Chapter 5 presents the conclusion and recommendation of this study.
6
2 LITERATURE REVIEW
2.1 Overview
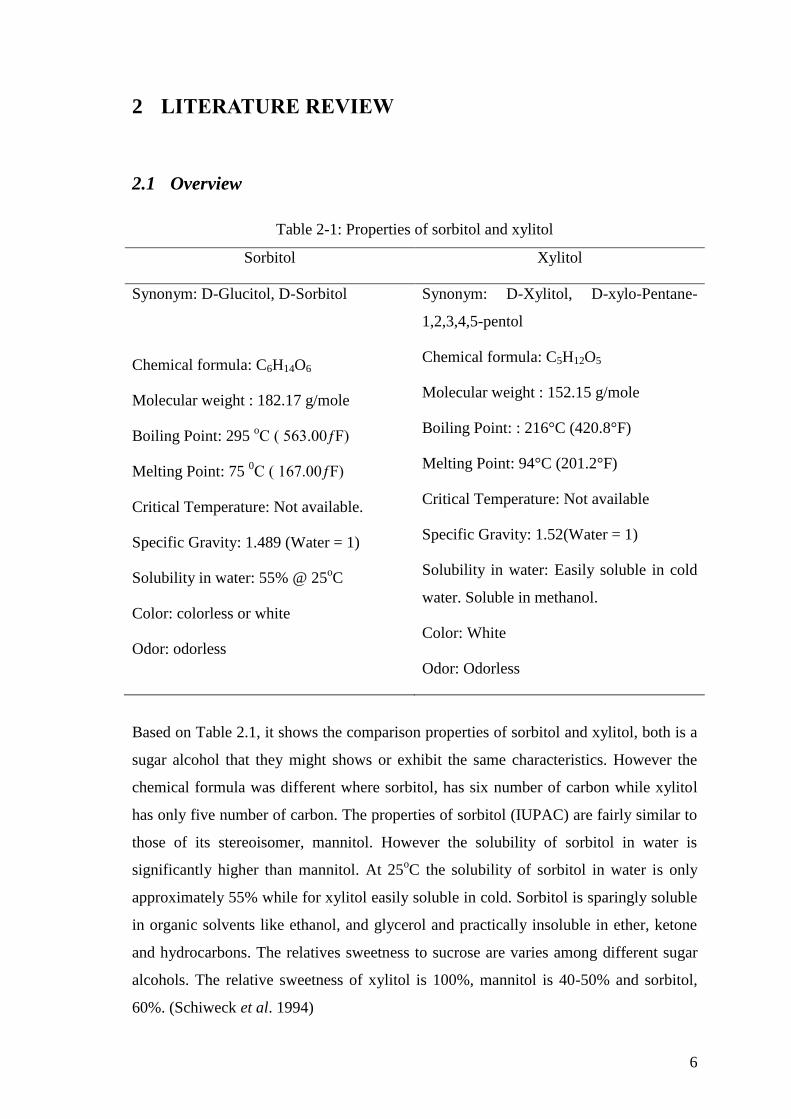
Table 2-1: Properties of sorbitol and xylitol
Sorbitol Xylitol
Synonym: D-Glucitol, D-Sorbitol
Chemical formula: C6H14O6
Molecular weight : 182.17 g/mole
Boiling Point: 295 oC ( 563.00ƒF)
Melting Point: 75 0C ( 167.00ƒF)
Critical Temperature: Not available.
Specific Gravity: 1.489 (Water = 1)
Solubility in water: 55% @ 25oC
Color: colorless or white
Odor: odorless
Synonym: D-Xylitol, D-xylo-Pentane-
1,2,3,4,5-pentol
Chemical formula: C5H12O5
Molecular weight : 152.15 g/mole
Boiling Point: : 216°C (420.8°F)
Melting Point: 94°C (201.2°F)
Critical Temperature: Not available
Specific Gravity: 1.52(Water = 1)
Solubility in water: Easily soluble in cold
water. Soluble in methanol.
Color: White
Odor: Odorless
Based on Table 2.1, it shows the comparison properties of sorbitol and xylitol, both is a
sugar alcohol that they might shows or exhibit the same characteristics. However the
chemical formula was different where sorbitol, has six number of carbon while xylitol
has only five number of carbon. The properties of sorbitol (IUPAC) are fairly similar to
those of its stereoisomer, mannitol. However the solubility of sorbitol in water is
significantly higher than mannitol. At 25oC the solubility of sorbitol in water is only
approximately 55% while for xylitol easily soluble in cold. Sorbitol is sparingly soluble
in organic solvents like ethanol, and glycerol and practically insoluble in ether, ketone
and hydrocarbons. The relatives sweetness to sucrose are varies among different sugar
alcohols. The relative sweetness of xylitol is 100%, mannitol is 40-50% and sorbitol,
60%. (Schiweck et al. 1994)
7
Figure 2-1: Sorbitol structure formula
Sorbitol sweetener is a sugar alcohol that's derived from glucose by modifying one of
the chemical groups so that it's metabolized more slowly by the body. This reduces the
insulin surge that normally occurs when sugar is ingested. Sorbitol can be found
naturally in some fruits or can be obtained from glucose catalytic hydrogenation and at
only 2.6 calories per serving it offers significant calorie advantages over table sugar
(Cazetta et al, 2005). This is because fermentation process involves biological systems
which are less controllable and more complex than straightforward chemical reactions,
the variability in products derived by fermentation is often greater than in products
derived by chemical synthesis. Thus, the impurity profile of a fermentation product may
be more complex and less predictable than that of a synthetic product. (Canary, 2010)
Usually the production of sorbitol is accomplished in a hydrogenation process however,
reactions like hydrolysis and hydrogenation may be involved in the same reaction
system due to the rapid development of research.
Besides of the application in food industry, in pharmaceutical and medicine it can be
used to decrease cellular edema and medicine it can be used to determine increase of
urinary output. The chemical structure of sugar alcohol allows them to be absorbed
more slowly in the body than regular sugars. Therefore, they have smaller impact on
blood insulin level. Individuals, who should not eat sugar such as diabetic patient, now
can consume the artificial sweetness, due to the sweet taste of sugar alcohols combined
with the independence of insulin when metabolized by body. (Weymarn, 2002)
8
The reduced caloric values are due to the facts that sugar alcohol is only partially
absorbed in the upper intestine. Thus, a large part of the ingested sugar alcohols reached
the large intestine, where bacteria degrade it. (Schiweck et al., 1994) sugar alcohol is
commonly used for production of reduced-calorie products, because of the reduced
caloric value compared to most sugar. However, incomplete absorption can results to
diarrhea, a gastrointestinal effects, hence the daily intake of polyols should not exceed
20g (Anon, 2001)
2.2 Purification
Purification is a process that removes the remaining impurities which typically are
similar to those of target product. (R. Ghosh, 2006). According to Shawn(1999), the
first chromatographic techniques that is paper and thin-layer chromatography were used
to separate sugars, but the separations were limited with respect to number of
recognized analyses, presented poor resolution and not always quantitative, while the
efficiently methods for purify specific carbohydrate to high degree of purity using the
semipermeable membrane reverse osmosis.
For the identification of all, polyols still did not have single method that is universally
applicable. In previous preliminary analyses of plant material, paper chromatography is
very frequently used where the application of this method requires little specialized
equipment and because it has proved most useful for examining material. Purification in
chemical industries is important in pharmaceutical industries such that positive results
of quality control and cost of purification step or steps are that won’t be available
without optimized process conditions and choosing the best purification
method.(Salehparhizkar, 2009).Table 2-2 summarize the different types of separation
process by using different separation methods.
9
Table 2-2: Different types of separation process
Type of system Characteristics Process Result References
Ultrafiltration
(in organic
membrane)
Pore size: 20
100nm
0.8 m long
Filtration area -
0.2m2
Purification of
different liquid
materials from
food industry
-Amaranth starch
solution was
concentrated 5 times
while eg blend
approximately 2-
times in one step
ultrafiltration
process.
Hinkova et
al. (2005).
Ion exchange
chromatography
(HPLC)
Column matrix Purification of
monosaccharide
-Bulk of
contaminants was
removed.
- 8 μg of glucose
contamination per
milligram of
ultrafiltered enzyme
remained.
Hodgins. G.
W.L. et al
Nanofiltration Polysufone
membrane
Purification of
xylose from
hemicellulose
hydrolyzate
feeds
Purified xylose Sjoman et
al. (2006)
Tangential flow
microfiltration
and
ultrafiltration
Polyvinylidene
fluoride (PVDF)
membrane
Separation of
hyaluronic acid
from the
fermentation
broth of
Steptococus
Zooepidemicus
Hyaluronic acid was
separate from
fermentation broth
Zhou et al.
(2006)
10
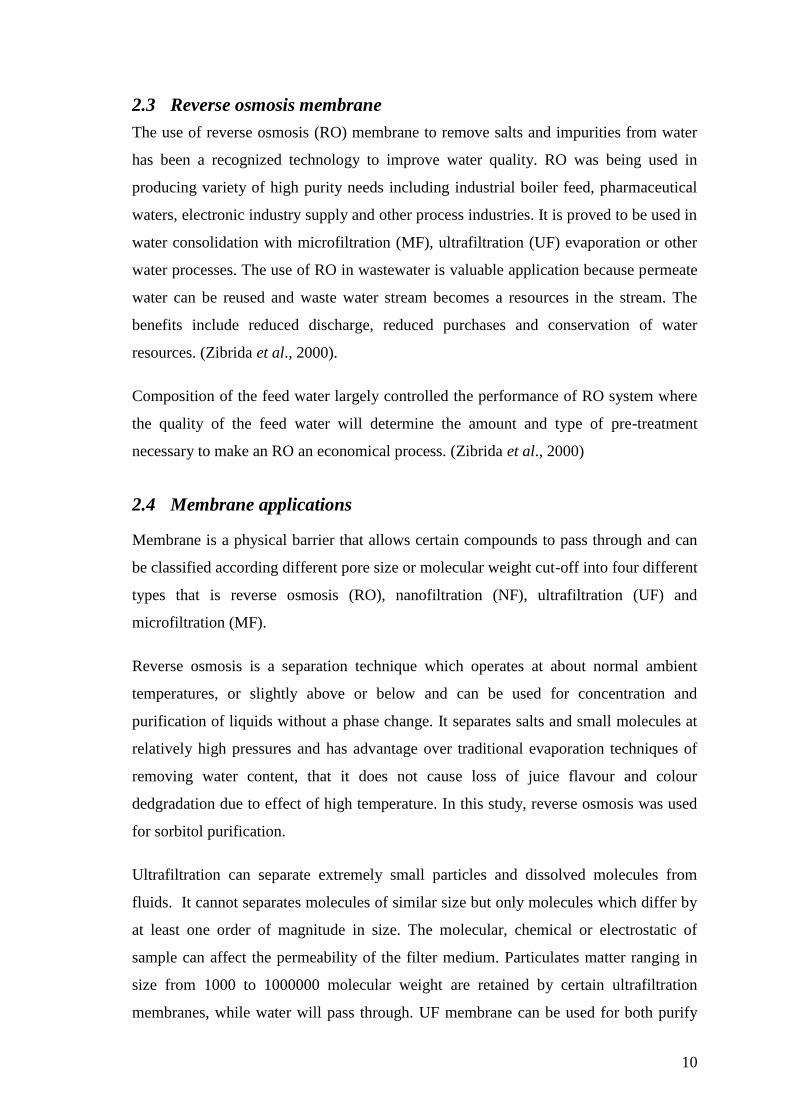
2.3 Reverse osmosis membrane
The use of reverse osmosis (RO) membrane to remove salts and impurities from water
has been a recognized technology to improve water quality. RO was being used in
producing variety of high purity needs including industrial boiler feed, pharmaceutical
waters, electronic industry supply and other process industries. It is proved to be used in
water consolidation with microfiltration (MF), ultrafiltration (UF) evaporation or other
water processes. The use of RO in wastewater is valuable application because permeate
water can be reused and waste water stream becomes a resources in the stream. The
benefits include reduced discharge, reduced purchases and conservation of water
resources. (Zibrida et al., 2000).
Composition of the feed water largely controlled the performance of RO system where
the quality of the feed water will determine the amount and type of pre-treatment
necessary to make an RO an economical process. (Zibrida et al., 2000)
2.4 Membrane applications
Membrane is a physical barrier that allows certain compounds to pass through and can
be classified according different pore size or molecular weight cut-off into four different
types that is reverse osmosis (RO), nanofiltration (NF), ultrafiltration (UF) and
microfiltration (MF).
Reverse osmosis is a separation technique which operates at about normal ambient
temperatures, or slightly above or below and can be used for concentration and
purification of liquids without a phase change. It separates salts and small molecules at
relatively high pressures and has advantage over traditional evaporation techniques of
removing water content, that it does not cause loss of juice flavour and colour
dedgradation due to effect of high temperature. In this study, reverse osmosis was used
for sorbitol purification.
Ultrafiltration can separate extremely small particles and dissolved molecules from
fluids. It cannot separates molecules of similar size but only molecules which differ by
at least one order of magnitude in size. The molecular, chemical or electrostatic of
sample can affect the permeability of the filter medium. Particulates matter ranging in
size from 1000 to 1000000 molecular weight are retained by certain ultrafiltration
membranes, while water will pass through. UF membrane can be used for both purify
11
materials passing through the filter and also to collect materials retained by the filter.
(Munir, 2006).
Microfiltration membrane can remove particles or biological entities ranging between
0.025 µm to 10 µm from fluids by passage through a microporous medium such as
membrane filter.(Munir, 2006)Reverse Osmosis is even more attractive in land-
constrained areas because it of reduced land requirement. It is anticipated that reverse
osmosis processes will be used more widely in water industry to replace the large
conventional water treatment systems. Reverse osmosis was first developed in the
1950’s by the US government to provide fresh drinking water for the Navy, and since
then, advances have made it much more feasible for obtaining purified water from
wastewater. (Tansel et al., 2000)
The uses of membrane for separations are becoming increasingly important in the
process industries, where the membrane acts as a semipermeable barrier and separation
occurs by the membrane controlling the rate of movement of various molecules between
two liquid phases, two gas phase or a liquid and a gas phase. The two fluid phases are
usually miscible and the membrane barrier prevents actual, ordinary hydrodynamic
flow.(Geankoplis., 2003)
The membrane filtration techniques becoming a mainstream technology since early
1990’s. With a number of advantages such as huge efficiency, simple equipment,
convenient operation and low energy consumption, the technology has become one of
the most important industrial separation techniques and has been applied extensively to
various fields such as food industry and pharmaceutical. (Jing Howard, 2010). Hinkova,
(2000) reported that progressively increasing transmembrane pressure and cross-flow
velocity resulted in 13-26% improvement of permeate flux.
Din et al., (2012) states that membrane technology is considered as one of the most
effective process for water and wastewater treatment. It is a compact system,
economically feasible and has high pollutant removal efficiency. In the past, pressure-
driven membrane processes such as RO had gained special attention due to its effective
removal of pollutants, especially those with low concentrations. The use of RO is
limited due to high operational cost especially when high pressure is applied. Therefore,
12
low pressure reverse osmosis membrane (LPROM) has been introduced to water and
wastewater industries in the past few years. (Din et al., 2012)
Most of LPROM are multi-layer thin film composed of complex polymers. The active
membrane surface layer normally consists of negatively charged sulphone or carboxyl
group. This helps the membranes in improving of fouling resistance against
hydrophobic colloids, proteins, oils and other organics. In order to increase water flux, a
charged hydrophilic layer is attached to a hydrophobic UF support membrane. This
makes the membrane favorable for the orientation of water dipoles. Flux is inversely
proportional to the membrane thickness. Generally, LPROM contains corrugated skin
surface that can improve flux significantly. It produces specific flux more than 60
L/m2.h MPa (flux per membrane area and per net driving pressure) at low operating
pressure. This flux rate is about double the flux of the previous generations of
composite RO membrane. (Din et al, 2012)
Some advantages the production of food by using membrane processes, which it has
better technological and nutritional functionalities, efficient use of material and
resource, and give reduced negative impact to the environment. The main benefits of
membrane is improved the production process by consistence high quality of
permeate/retentate, reduced operating costs, low maintenance and pressure drop,
chemical and temperature resistance and long membrane operating life and the recovery
of valuable products that previously would have been lost to waste. (Scott, K. 1998)
Reverse Osmosis have some advantages, over evaporation when concentrating sugar
solution that can prevent the camelization and save energy. (Yurong et al., 1987).
However, the use of membranes cannot be applied widely due to membrane fouling.
The fouling was dependent on the pore size and cause by the large particles (250nm) or
coagulants. It is influenced the rejection of particles in MF and NOM in UF and NF. It
is also stated that the low molecular weight acids that passed through the NF
membranes and the rejection are dependent on the deposit of membrane. The
mechanism of fouling can be such as pore plugging, cake formation (internal pore
adsorption that reduces the internal pore diameter and charge of the deposit. In order to
achieve unfouled membrane, the extent of rejection is influenced largely by the pore
size or molecular weight cut-off (MWCO).The charge interactions, bridging, and
hydrophobic interactions may play important role in fouling effect. For membrane
13
separation process of reverse osmosis the size of particle are about 0.001µm and the
molecular weight are in the range about 100 to 1000 Dalton. (Schafer et al., 2000)
In order to reduce the membrane fouling, the optimum condition of TMP and CFV
should be applied as shown in Table 2.2. Defrance and Jaffrin,(1998) reported that
increase in TMP will increase the membrane flux and Matsuura,(1971) shown that the
concentration of sugar increase after the membrane purification process by reverse
osmosis membrane. Due to fouling will increase in operational cost and lower the
process efficiency. (Vrouwenvelder et al., 2002)
Reverse osmosis (RO) is the most economical method of removing 95% to 99% of all
contaminants. The pore structure of RO membranes is much tighter than UF
membranes. RO membranes are capable of rejecting practically all particles, bacteria
and organics >300 daltons molecular weight (including pyrogens). Natural osmosis
occurs when solutions with two different concentrations are separated by a semi-
permeable membrane. Osmotic pressure drives water through the membrane; the water
dilutes the more concentrated solution; and the end result is equilibrium.
Because reverse osmosis membranes are very restrictive, they yield very slow flow
rates. Storage tanks are required to produce an adequate volume in a reasonable amount
of time. Reverse osmosis also involves an ionic exclusion process. Only solvent is
allowed to pass through the semi-permeable reverse osmosis membrane, while virtually
all ions and dissolved molecules are retained (including salts and sugars). The semi-
permeable membrane rejects salts (ions) by a charge phenomenon action: the greater the
charge, the greater the rejection. Therefore, the membrane rejects nearly all (>99%)
strongly ionized polyvalent ions but only 95% of the weakly ionized monovalent ions
like sodium.
Membrane separation processes find their application in almost all branches of food and
biotechnological industry. Apart from the biotechnology, the most wide-spread
applications are in dairy and beverage industries, e.g. for whey protein concentration
and purification (Sschkoda and Kessler, 1997), whey desalination and demineralisation,
milk standardisation by ultrafiltration, etc. In the beverage industry, membranes are
applied for beer and wine stabilisation to prevent the microbial decomposition, for the
yeast and colloid removal, or for non-alcoholic beer production by pervaporation
14
(Karlsson & Tragardh,1996). Membranes are also very useful in fruit and vegetable
juices production for juice purification by ultrafiltration or concentration by reverse
osmosis or nanofiltration (Koseoglu et al. 1991).
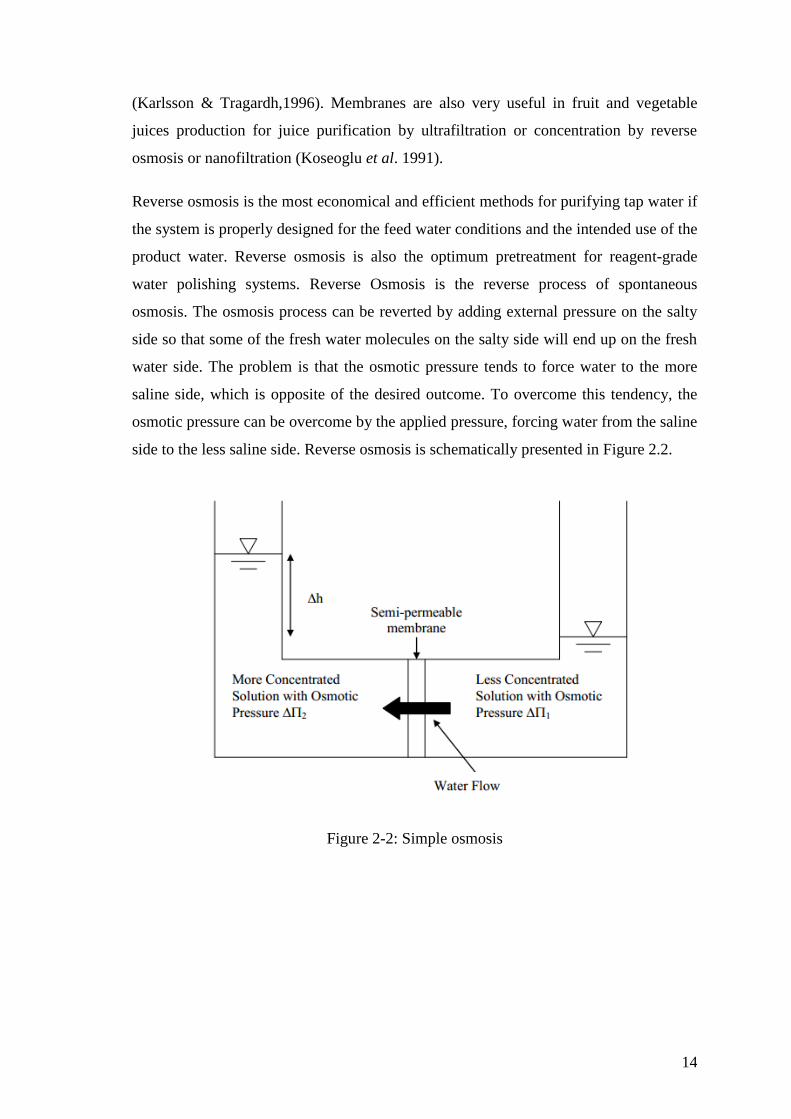
Reverse osmosis is the most economical and efficient methods for purifying tap water if
the system is properly designed for the feed water conditions and the intended use of the
product water. Reverse osmosis is also the optimum pretreatment for reagent-grade
water polishing systems. Reverse Osmosis is the reverse process of spontaneous
osmosis. The osmosis process can be reverted by adding external pressure on the salty
side so that some of the fresh water molecules on the salty side will end up on the fresh
water side. The problem is that the osmotic pressure tends to force water to the more
saline side, which is opposite of the desired outcome. To overcome this tendency, the
osmotic pressure can be overcome by the applied pressure, forcing water from the saline
side to the less saline side. Reverse osmosis is schematically presented in Figure 2.2.
Figure 2-2: Simple osmosis