purpose of this document -...
TRANSCRIPT
Purpose of this document The purpose of this booklet is to enable schools to convert raw scores from the tests to age-standardised scores and progress measures where these have not been collected via the Welsh National Tests Data Collection (WNTDC). This will be relevant for independent schools. It will also be relevant where a learner has taken a test outside of the test window or an out-of-year test for diagnostic purposes.
Please note: only progress measures can be calculated for learners taking out-of-year tests.
Calculating learners’ scores from national tests The age-standardised scores and the progress measures were established using the data submitted by all schools in Wales with learners who had taken the ‘live’ English reading tests in April/May 2017.
Age-standardised scores The age-standardised score scales make it possible to compare an individual learner’s performance on the test in 2017 with the performance of all other learners of the same age, in years and completed months, taking the test. Age-standardised scores are adjusted for age.
Working out age at date of test You can use the ‘age calculator’ tool at learning.gov.wales/resources/browse-all/reporting-and-interpreting-national-test-results-2017/?lang=en to calculate age at date of test using the learner’s date of birth and the date on which the test was taken. This will give you the learner’s age in years and completed months.
Working out an age-standardised score To work out the age-standardised score for an individual learner you will need:
their raw score (total number of marks awarded when the test was marked)
their age on the date the test was taken in years and completed months.
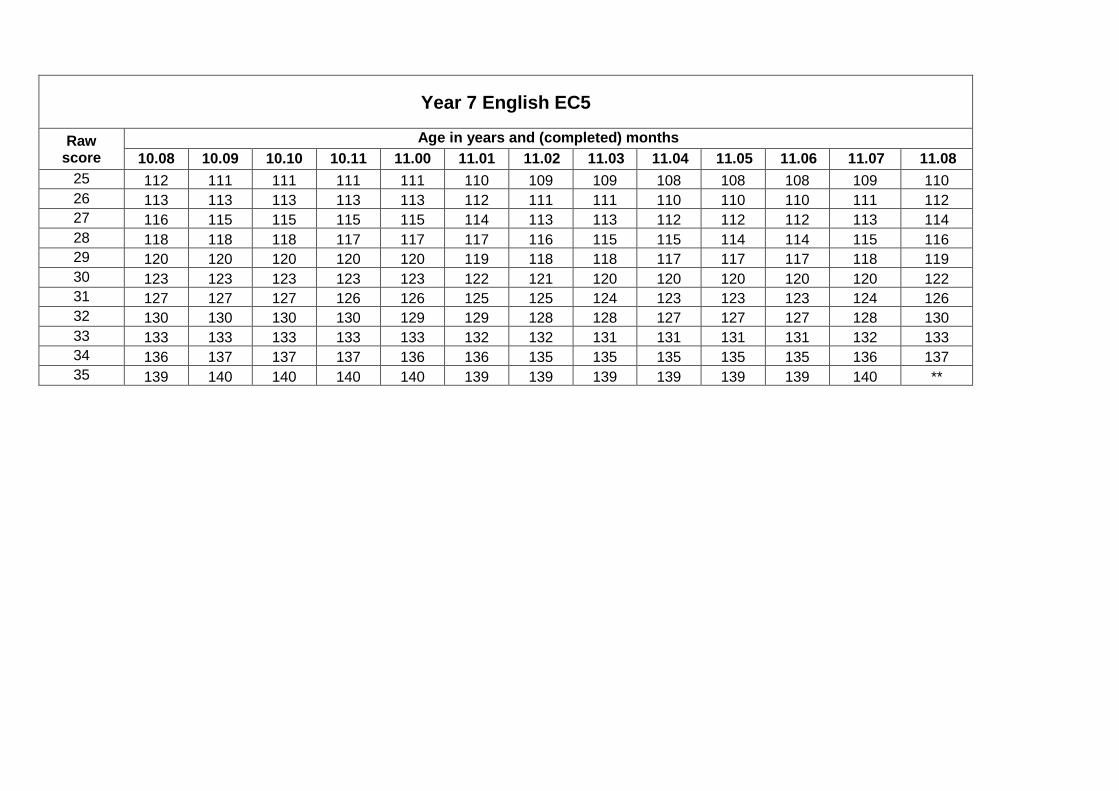
Use Tables 1 and 2 to look up the corresponding age-standardised score. Using the appropriate table for the test taken, locate the learner’s raw score on the left-hand side of the table. Then read across the row to the column headed by the learner’s age. The age-standardised score for this learner is in the cell where the row and column intersect. For example, a learner who has taken test EC5 and is 11 years and 3 months (11.03) and has a raw score of 23 would have an age-standardised score of 105.
Interpreting an age-standardised score When age-standardised score scales are developed, the average raw score for all the
learners of a given age taking the test is set to be equivalent to a standardised score of
100. About 68 per cent of learners would be expected to have age-standardised scores
between 85 and 115. An age-standardised score lower than 85 might suggest some
difficulty with reading as measured on the test. An age-standardised score greater
than 115 might suggest that a learner is performing well in comparison to other
learners of the same age and that it may be appropriate to provide them with more
challenging reading-related activities.
Very low age-standardised scores are shown in the table as * which can be interpreted
as ‘less than 70’ and very high scores are shown as ** which can be interpreted as ‘more
than 140’. The tests are designed to measure the range of performance in reading that
would be expected from learners in the specified year groups. In the case of learners
whose reading skills are developing more slowly than would be expected for their age or
learners who achieve very highly on the tests, their scores cannot be determined as
accurately as those for learners scoring within the range expected. If a school wishes to
calculate class averages, the use of 69 or 141 would be accurate enough estimates for
these learners.

Table 1: EC5 raw score to age-standardised score conversion table
Year 7 English EC5
Raw score
Age in years and (completed) months
10.08 10.09 10.10 10.11 11.00 11.01 11.02 11.03 11.04 11.05 11.06 11.07 11.08
0 * * * * * * * * * * * * *
1 * * * * * * * * * * * * *
2 * * * * * * * * * * * * *
3 71 71 71 70 70 70 * * * * * 70 70
4 74 74 74 73 73 73 72 72 72 72 72 72 73
5 77 77 77 76 76 75 75 75 74 74 74 75 76
6 80 80 80 79 79 78 78 77 77 77 77 77 78
7 82 82 82 81 81 81 80 80 80 79 79 80 81
8 84 84 84 83 83 83 82 82 81 81 81 82 83
9 86 86 85 85 85 85 84 83 83 83 83 83 84
10 88 87 87 87 87 86 86 85 85 84 84 85 86
11 89 89 89 88 88 88 87 87 86 86 86 87 88
12 91 91 90 90 90 89 89 88 88 87 87 88 89
13 93 92 92 92 91 91 90 90 89 89 89 90 91
14 94 94 93 93 93 92 92 91 91 90 90 91 92
15 96 95 95 95 94 94 93 93 92 92 92 93 94
16 97 97 96 96 96 95 95 94 94 93 94 94 95
17 99 98 98 98 97 97 96 96 95 95 95 96 97
18 100 100 99 99 99 98 98 97 97 96 97 97 98 19 102 101 101 101 100 100 99 99 98 98 98 99 100
20 103 103 103 102 102 101 101 100 100 100 100 100 102
21 105 105 104 104 103 103 102 102 101 101 101 102 103
22 106 106 106 106 105 105 104 103 103 103 103 104 105
23 108 108 108 107 107 106 106 105 105 105 105 105 107
24 110 110 109 109 109 108 108 107 107 106 106 107 108

Year 7 English EC5
Raw score
Age in years and (completed) months
11.09 11.10 11.11 12.00 12.01 12.02 12.03 12.04 12.05 12.06 12.07 12.08
0 * * * * * * * * * * * *
1 * * * * * * * * * * * *
2 * * * * * * * * * * * *
3 71 71 71 71 71 70 70 70 70 70 70 *
4 74 74 74 74 74 73 73 72 72 72 72 72
5 76 77 77 77 77 76 76 75 75 74 74 74
6 79 79 80 80 79 79 78 78 77 77 77 76
7 81 81 82 81 81 81 81 80 80 79 79 79
8 83 84 84 83 83 83 82 82 81 81 81 81
9 85 85 85 85 85 85 84 83 83 83 82 82
10 87 87 87 87 87 86 86 85 85 84 84 84
11 89 89 89 89 88 88 87 87 86 86 86 85
12 90 90 90 90 90 89 89 88 88 87 87 87
13 92 92 92 92 91 91 90 90 89 89 88 88
14 93 93 93 93 93 92 92 91 91 90 90 90
15 95 95 95 94 94 94 93 93 92 92 91 91
16 96 96 96 96 96 95 95 94 94 93 93 93
17 98 98 98 98 97 97 96 96 95 95 95 94
18 99 100 99 99 99 98 98 97 97 96 96 96
19 101 101 101 101 100 100 99 99 98 98 97 97
20 102 103 103 102 102 101 101 100 100 99 99 99
21 104 104 104 104 103 103 102 102 101 101 100 100
22 106 106 106 105 105 105 104 103 103 102 102 102
23 107 108 107 107 107 106 106 105 105 104 104 104
24 109 110 109 109 109 108 107 107 106 106 106 106
Year 7 English EC5
Raw score
Age in years and (completed) months
10.08 10.09 10.10 10.11 11.00 11.01 11.02 11.03 11.04 11.05 11.06 11.07 11.08
25 112 111 111 111 111 110 109 109 108 108 108 109 110
26 113 113 113 113 113 112 111 111 110 110 110 111 112
27 116 115 115 115 115 114 113 113 112 112 112 113 114
28 118 118 118 117 117 117 116 115 115 114 114 115 116
29 120 120 120 120 120 119 118 118 117 117 117 118 119
30 123 123 123 123 123 122 121 120 120 120 120 120 122
31 127 127 127 126 126 125 125 124 123 123 123 124 126
32 130 130 130 130 129 129 128 128 127 127 127 128 130
33 133 133 133 133 133 132 132 131 131 131 131 132 133
34 136 137 137 137 136 136 135 135 135 135 135 136 137
35 139 140 140 140 140 139 139 139 139 139 139 140 **

Year 7 English EC5
Raw score
Age in years and (completed) months
11.09 11.10 11.11 12.00 12.01 12.02 12.03 12.04 12.05 12.06 12.07 12.08
25 111 111 111 111 111 110 109 109 108 108 108 108
26 113 113 113 113 113 112 111 111 110 110 110 110
27 115 116 115 115 115 114 114 113 112 112 112 112
28 118 118 118 118 117 117 116 115 115 114 114 114
29 120 121 121 120 120 119 119 118 117 117 117 117
30 124 124 124 124 123 122 122 121 120 120 120 120
31 127 128 128 127 127 126 126 125 124 124 124 123
32 131 131 131 131 130 130 129 129 128 128 128 128
33 135 135 135 134 134 133 133 133 132 132 132 132
34 138 139 138 138 137 137 137 137 136 136 136 136
35 ** ** ** ** ** ** ** 140 140 140 ** **

Table 2: ED5 raw score to age-standardised score conversion table
Year 8/9 English ED5
Raw score
Age in years and (completed) months
12.08 12.09 12.10 12.11 13.00 13.01 13.02 13.03 13.04 13.05 13.06 13.07 13.08
0 * * * * * * * * * * * * *
1 * * * * * * * * * * * * *
2 * * * * * * * * * * * * *
3 73 73 72 72 72 71 71 71 70 70 70 * *
4 77 76 76 76 75 75 75 74 74 74 73 73 73
5 80 79 79 79 78 78 78 77 77 77 76 76 76
6 82 82 81 81 81 81 80 80 80 79 79 79 78
7 84 84 84 83 83 83 82 82 82 82 81 81 81
8 86 86 86 85 85 85 84 84 84 84 83 83 83
9 88 88 87 87 87 87 86 86 86 85 85 85 84
10 90 89 89 89 89 88 88 88 87 87 87 86 86
11 91 91 91 90 90 90 89 89 89 89 88 88 88
12 93 93 92 92 92 91 91 91 90 90 90 89 89
13 94 94 94 93 93 93 92 92 92 91 91 91 90
14 96 95 95 95 94 94 94 93 93 93 92 92 92
15 97 97 96 96 96 95 95 95 94 94 94 93 93
16 98 98 98 97 97 97 96 96 96 95 95 95 94
17 100 99 99 99 98 98 98 97 97 97 96 96 96
18 101 101 100 100 100 99 99 99 98 98 98 97 97
19 102 102 102 101 101 101 100 100 100 99 99 99 98
20 103 103 103 102 102 102 102 101 101 101 100 100 100
21 105 104 104 104 103 103 103 103 102 102 102 101 101
22 106 106 106 105 105 105 104 104 104 103 103 103 102
23 108 107 107 107 106 106 106 105 105 105 104 104 104
24 109 109 108 108 108 107 107 107 106 106 106 105 105

Year 8/9 English ED5
Raw score
Age in years and (completed) months
13.09 13.10 13.11 14.00 14.01 14.02 14.03 14.04 14.05 14.06 14.07 14.08
0 * * * * * * * * * * * *
1 * * * * * * * * * * * *
2 * * * * * * * * * * * *
3 * * * * * * * * * * * *
4 73 72 72 72 71 71 71 70 70 70 * *
5 76 75 75 75 74 74 74 73 73 73 72 72
6 78 78 77 77 77 77 76 76 76 75 75 75
7 80 80 80 79 79 79 78 78 78 77 77 77
8 82 82 82 81 81 81 80 80 80 79 79 79
9 84 84 83 83 83 82 82 82 82 81 81 81
10 86 85 85 85 84 84 84 84 83 83 83 82
11 87 87 87 86 86 86 85 85 85 84 84 84
12 89 88 88 88 87 87 87 87 86 86 86 85
13 90 90 90 89 89 89 88 88 88 87 87 87
14 92 91 91 91 90 90 90 89 89 89 88 88
15 93 93 92 92 92 91 91 91 90 90 90 89
16 94 94 94 93 93 93 92 92 92 91 91 91
17 95 95 95 95 94 94 94 93 93 93 92 92
18 97 96 96 96 95 95 95 95 94 94 94 93
19 98 98 97 97 97 96 96 96 95 95 95 95
20 99 99 99 98 98 98 97 97 97 96 96 96
21 101 100 100 100 99 99 99 98 98 98 97 97
22 102 102 101 101 101 100 100 100 99 99 99 98
23 103 103 103 102 102 102 101 101 101 100 100 100
24 105 104 104 104 103 103 103 102 102 102 101 101

Year 8/9 English ED5
Raw score
Age in years and (completed) months
12.08 12.09 12.10 12.11 13.00 13.01 13.02 13.03 13.04 13.05 13.06 13.07 13.08
25 110 110 110 109 109 109 108 108 108 107 107 107 106
26 112 112 111 111 111 110 110 110 109 109 109 108 108
27 114 113 113 113 112 112 112 111 111 111 110 110 110
28 115 115 115 114 114 114 113 113 113 112 112 112 111
29 117 117 116 116 116 115 115 115 114 114 114 113 113
30 119 119 118 118 118 117 117 117 116 116 116 115 115
31 121 121 121 120 120 120 119 119 119 118 118 117 117
32 124 123 123 123 122 122 122 121 121 121 120 120 120
33 126 126 126 125 125 125 124 124 124 123 123 123 122
34 129 129 129 128 128 128 127 127 127 126 126 126 125
35 133 133 133 132 132 132 131 131 131 130 130 130 129
36 139 139 138 138 138 137 137 137 136 136 136 135 135
37 ** ** ** ** ** ** ** ** ** ** ** ** **
38 ** ** ** ** ** ** ** ** ** ** ** ** **
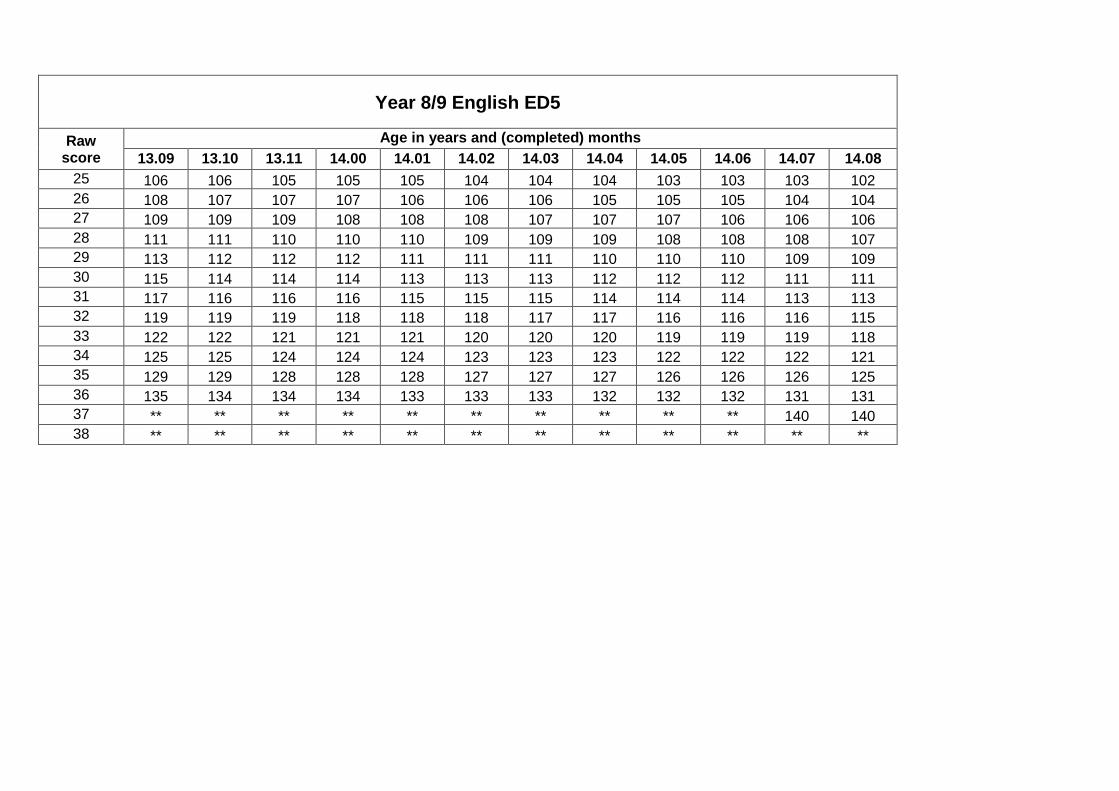
Year 8/9 English ED5
Raw score
Age in years and (completed) months
13.09 13.10 13.11 14.00 14.01 14.02 14.03 14.04 14.05 14.06 14.07 14.08
25 106 106 105 105 105 104 104 104 103 103 103 102
26 108 107 107 107 106 106 106 105 105 105 104 104
27 109 109 109 108 108 108 107 107 107 106 106 106
28 111 111 110 110 110 109 109 109 108 108 108 107
29 113 112 112 112 111 111 111 110 110 110 109 109
30 115 114 114 114 113 113 113 112 112 112 111 111
31 117 116 116 116 115 115 115 114 114 114 113 113
32 119 119 119 118 118 118 117 117 116 116 116 115
33 122 122 121 121 121 120 120 120 119 119 119 118
34 125 125 124 124 124 123 123 123 122 122 122 121
35 129 129 128 128 128 127 127 127 126 126 126 125
36 135 134 134 134 133 133 133 132 132 132 131 131
37 ** ** ** ** ** ** ** ** ** ** 140 140
38 ** ** ** ** ** ** ** ** ** ** ** **

Progress measures The progress measure scales are calculated separately for each national curriculum year group and each test.
Progress measures are not adjusted for age.
Working out a progress measure
To work out the progress measure for an individual learner you will need their raw score (total number of marks awarded when the test was marked) and their year group.
Use Tables 3 and 4 to look up the corresponding progress measure. Please ensure you
refer to the correct year group when looking up learners’ progress measures.
Using the appropriate table for the test taken, locate the learner’s raw score on the left-hand side of the table. Then read across the row to the column headed by the learner’s year group. The progress measure for this learner is in the cell where the row and column intersect.
For example, a learner in national curriculum Year 8 who has taken test ED5 and has a raw score of 20 would have a progress measure of 1002.
A learner in national curriculum Year 9 who has taken test ED5 and has a raw score of 20 would have a progress measure of 997.
Interpreting a progress measure The progress measure shows how well an individual learner has done in a given test compared with all other learners in the same national curriculum year group taking the same test. The progress measure should be presented as a time series allowing for a learner’s achievement in the tests to be tracked over time.
The mean of the progress measure for each year group is set at 1000, and the scores range from 950 to 1050. Learners achieving between 980 and 1020 (i.e. scores within one standard deviation of the mean) have a progress measure that is in line with learners in the same year group (taking the same test). Approximately 68 per cent of learners will have a score in this range. Learners scoring outside of this range (i.e. below 980 or above 1020) have a progress measure that is either below or above that of most learners in their year group.
The progress measure for 2017 should be considered alongside any previous progress measure for this learner. Progress measures that are broadly similar from year to year would suggest that a learner is making steady progress within their year group. Small variations in the score from year to year are to be expected but if there are large changes in the progress measure between one year and the next, then this suggests that a learner has made either more or less progress than the rest of the learners taking the test. Please refer to the practitioner guidance at learning.gov.wales/resources/browse-all/reporting-and-interpreting-national-test-results-2017/?lang=en for further information on interpreting progress measures.

Out-of-year testing Where a learner has taken a test that is different from their national curriculum year group test, look up their progress measure using the table appropriate for the test taken. Their progress measure compares the learner to all other learners who have taken the same test. For example, for a learner in national curriculum Year 8 who has taken test EC5 and has a raw score of 23 it is possible to look up a Year 7 progress measure. A raw score of 23 gives a Year 7 progress measure of 1008 which indicates that the learner has performed at around the same level as the average learner in Year 7.
When comparing progress measures over time it is important to consider the reference group (the national curriculum year group the learner is compared with), as this may be different from one year to the next.

Table 3: Year 7 Test EC5 raw score to progress measure conversion table
Total score Progress measure Year 7
0 950
1 950
2 956
3 962
4 966
5 969
6 972
7 975
8 977
9 979
10 982
11 984
12 986
13 988
14 990
15 992
16 994
17 996
18 998
19 1000
20 1002
21 1004
22 1006
23 1008
24 1011
25 1013
26 1016
27 1019
28 1022
29 1025
30 1029
31 1033
32 1039
33 1046
34 1050
35 1050

Table 4: Year 8 and Year 9 Test ED5 raw score to progress measure conversion table
Total score Progress measure Year 8 Progress measure Year 9
0 950 950
1 950 950
2 954 951
3 961 957
4 966 962
5 970 966
6 973 970
7 976 972
8 979 975
9 982 977
10 984 980
11 986 982
12 988 983
13 990 985
14 992 987
15 994 989
16 995 990
17 997 992
18 999 994
19 1001 995
20 1002 997
21 1004 999
22 1006 1000
23 1008 1002
24 1010 1004
25 1011 1006
26 1014 1008
27 1016 1010
28 1018 1012
29 1020 1015
30 1023 1017
31 1026 1020
32 1029 1023
33 1032 1027
34 1037 1031
35 1042 1036
36 1049 1043
37 1050 1050
38 1050 1050

© Crown copyright 2017