pushpay holdings limited -...
TRANSCRIPT

CLARE CAPITAL – PUSHPAY RESEARCH REPORT – FEBRUARY 2015
1 | www.clarecapital.co.nz l +6444985104 l Level 18, 125 The Terrace, PO Box 10269, Wellington 6143, New Zealand
Pushpay Holdings Limited
A SaaS play which makes donating and paying easy
When will Pushpay return a profit – is the wrong
question… Corporate Finance 101: focusing on near-term
profitability at the expense of longer term value creation is not the
optimal strategy – It is not in the shareholder’s best interests.
Correctly, Pushpay is currently focusing on developing and acquiring
“assets” to add long-term value.
Company Overview Founded in Auckland in 2011, Pushpay provides mobile commerce
tools that facilitate fast, secure and easy non-point of sale payments
between consumers and merchants. Pushpay services three target
markets: the Faith Sector; Non-Profit Organisations and Enterprises.
Target Price Our 12 month target price is $4.17 per share.
Key Points Note: with the exception of the “blue sky” scenarios, the valuations
in this research are based solely on Pushpay’s performance in the
US Faith Sector and Run The Red (RTR) in New Zealand.
Pushpay is a SaaS play with a large market opportunity within
the Faith Sector, high monthly recurring revenue, low churn
and >20% month on month revenue growth.
FY2015 saw the Company raise capital, successfully acquire
and integrate RTR, list on the NZAX and record a >200%
increase in the listed share price.
Near term focus for the Company is continued aggressive,
cost-effective customer acquisition, developing this “asset” to
generate future value.
Pushpay have indicated a growth path towards acquiring 20%
of large US churches – providing our current valuation of NZ
$183m.
Additional capital is likely to be required within 12 months to
fund the growth strategy – achieving a significant proportion
of this outside the existing core investors would be beneficial.
Shares in Pushpay are tightly held with low liquidity
influencing the current share price.
We expect a move to the NZX Main Board in the next 12
months.
Pushpay has the potential for significantly higher valuations
(>$500m+) by either: a move into other jurisdictions
(countries); or by targeting a larger share of the US market –
guidance and execution history is required to achieve these
valuation levels.
Valuation Summary – as at 16th Feb 2015
Enterprise Valuation NZ $m 180.4
Less Net Debt NZ $m (2.1)
Market Capitalisation NZ $m 182.5
Share Price NZ $ 3.64
Target Information
12 Month Target Price NZ $ 4.17
Market Data
NZX Code PAY
Share Price NZ $ 3.10
Market Capitalisation NZ $m 155
Financials (NZ $m) 14A 15E 16F 17F 18F
Revenue 0.3 4.5 9.8 20.3 38.8
EBITDA (1.5) (5.3) (4.5) (3.6) 2.0
EBIT (1.6) (6.2) (5.8) (4.9) 0.6
NPBT (1.6) (6.1) (5.7) (4.9) 0.6
NPAT (1.6) (6.1) (5.7) (4.9) 0.6
Metrics 14A 15E 16F 17F 18F
EBITDA (%) (459%) (118%) (46%) (18%) 5%
NPAT (%) (489%) (136%) (58%) (24%) 2%
Churches (#) 158 900 2,711 6,002 10,847
MoM (%) NA 16% 10% 7% 5%
Ann. (%) NA 470% 201% 121% 81%
ARPM (NZ$) 175 275 300 325 350
CTS/Church (NZ$) (500) (375) (125) (115) (110)
CAC Months 9 12 11 11 11
ACMR (NZ $m) 0 3 10 23 46
Contact
Kent Hammond
Associate Director
Clare Capital
+64 27 2439932
This report was commissioned by Pushpay, please refer to the
Disclosure and Disclaimer section for important disclosures and disclaimers
Thoughts on share price: Based on the view that a 20% market share
of large US churches is achievable, the current market share price is
lower than our Core Scenario share price of $3.64. If there is
continued successful execution the share price could break the $4
mark in the next 12 months.

CLARE CAPITAL – PUSHPAY RESEARCH REPORT – FEBRUARY 2015
2 | www.clarecapital.co.nz l +6444985104 l Level 18, 125 The Terrace, PO Box 10269, Wellington 6143, New Zealand
SaaS Glossary
ACMR – Annualised Committed Monthly Revenue, simply put this is CMR multiplied by 12. This metric is
often employed because in these high growth situations Year-to-Date (YTD) or Last-Twelve-Months (LTM)
metrics miss the fact that the most recent month’s revenues are the most representative of future
revenues (assuming no further growth).
ARPU – Average Revenue Per User, a key idea behind SaaS, this is the recurring amount received for each
subscription to the software product, often a monthly amount (i.e. how much the company receives each
month from each customer). Pushpay’s equivalent is Average Revenue Per Merchant (ARPM).
CAC – Customer Acquisition Costs, this is generally presented as the cost to acquire a single customer and
it encompasses all marketing and sales costs associated with acquiring the customer.
CAC Months of ARPU – Perhaps one of the most scrutinised metrics for those in the SaaS world. Instead
of presenting Customer Acquisition Costs (CAC) in terms of dollars, it relates this cost in terms of the
monthly revenue received from the customer (ARPU). So the metric is calculated as CAC divided by
monthly ARPU resulting in the number of months of revenue required to repay the cost of acquiring the
customer.
Churn – A common word in the SaaS world, churn is customer turnover, often on a monthly basis
presented as a percentage of total customers. Switching this concept on its head, the alternative is to
think about how long a customer remains with the company. A key feature of a successful SaaS business
model is low levels of churn.
CMR – Committed Monthly Revenue, how much monthly revenue the company receives from the
subscription to its software product. Very simply, it is the unit revenue (i.e. the ARPU) multiplied by the
number of customers.
CTS – Cost to Serve, again presented as cost per single customer and encompasses the cost of storing
(hosting) the customers data, operational support and customer service costs.
SaaS – Software as a Service, is both a delivery method to the market and a product in itself.

CLARE CAPITAL – PUSHPAY RESEARCH REPORT – FEBRUARY 2015
3 | www.clarecapital.co.nz l +6444985104 l Level 18, 125 The Terrace, PO Box 10269, Wellington 6143, New Zealand
Company Overview
Pushpay was incorporated in Auckland, New Zealand in 2011 by Christopher Heaslip and Eliot Crowther.
Post-acquisition of seed funding, the Company has invested in technology, developing tools that facilitate
fast, secure and easy non-point of sale mobile payments between consumers and merchants. Pushpay,
via the products they have developed, services three target markets: the Faith Sector; Non-Profit
Organisations; and Enterprises (both SME’s and large Corporate Organisations).
Pushpay’s mobile payment products are distributed to the market via a Software as a Service business
model, generating recurring monthly revenue for the payment services provided. There are two main
sources of monthly recurring revenue:
1. Subscription based fees; and
2. Volume based fees.
For simplicity, these two monthly recurring revenue streams are combined and reported by the Company
as Average Revenue Per Merchant (ARPM) which is equivalent to Average Revenue Per User (ARPU)
reported by other SaaS companies. Pushpay have reported monthly ARPM levels of $258 trending
towards $300 – 5-10x higher than other comparable successful SaaS companies.
The SaaS business model benefits both Pushpay and its customers. Pushpay centrally hosts the software
away from the individual users, meaning the company benefits from economies of scale in terms of data
storage and processing grunt, software development expertise and customer support. The customer
benefits from having access to the most up-to-date version of the software and no large up-front
installation costs.
Of Pushpay’s three target markets, the Faith Sector (churches) particularly in the US, is the current focus.
In the case of churches, donations underpin the viability of their organisation. Pushpay’s product targets
electronic, and in particular mobile donating, or as the Company’s slogan says “What if giving was
simple?” The business model in principle is simple, adding value to the churches by providing software
applications that make it easier for the attendees to donate/“give”.
The church focused business model is based on the following:
A large majority of church funding comes from donations, where many churches share a similar problem:
only 20% of the people who attend give regularly, the challenge is to engage with the other 80%. This
challenge is accentuated as the process of giving is not always easy, the use of cash and cheques is
reducing and existing electronic solutions are often complicated and time consuming. People give up, and
the church misses out on donations. As a solution, Pushpay has developed a giving platform built around
what is billed as “the world’s first 10 second giving app”. Via Pushpay, the church attendee can start the
donating process via the web, a kiosk or mobile device. The initial sign up takes less than 30 seconds after
which the attendee is invited to download the Pushpay app. Once downloaded, the app provides the
ability to donate anytime, anywhere in under 10 seconds via debit or credit card or direct bank payment
in the form of a one-off gift or by setting up a recurring payment. The ultimate result being, the church
receiving an increase in donations. The Pushpay product also helps with church administration as it
integrates directly with the church’s administrative and financial databases.
In terms of SaaS metrics, Pushpay has experienced strong performance to-date with signs and
expectations that this will continue. The Company is experiencing very high customer retention rates (or
inversely low churn, <5% annually excluding upsells), very high levels of monthly recurring revenue per
customer (ARPM), relatively low customer acquisition costs (CAC months of ARPU of less than 12),
reducing cost to serve (CTS) and strong month-on-month revenue growth (~16% for FY2015).

CLARE CAPITAL – PUSHPAY RESEARCH REPORT – FEBRUARY 2015
4 | www.clarecapital.co.nz l +6444985104 l Level 18, 125 The Terrace, PO Box 10269, Wellington 6143, New Zealand
During FY2015 Pushpay raised over $11.7 million of new capital, where up to $4.0 million of this was ear-
marked for the acquisition of the Run the Red (RTR) SMS Gateway business. In May 2014, Pushpay
acquired RTR and has successfully integrated this into the wider Pushpay group. On the 14th of August
Pushpay was listed on the NZAX at $1.00 per share, issuing 50,000,000 shares providing a market
capitalisation of $50,000,000. Movement in the share price was immediate and very positive reaching as
high as $2.75 within a week before reducing back to $2.00 for a period of time. The share price has since
risen to $3.10, with an allotment of a further 102,766 giving a total of 50,102,766 shares on issue
providing a market capitalisation for Pushpay of $155,319,000, a 200% increase on listing within 6
months.
It is important to note that this share price movement has however occurred on both a small number and
small volume of share transactions reflecting the tightly held nature of the stock. 15 investors/intuitions
hold almost 90% of the stock and the vast majority of these investors are either on the board or have
close ties to the company.
Figure 1. Pushpay Directors
Name
Bruce Patrick Gordon – Independent Chairman
Graham John Shaw – Independent Director
Douglas David Kemsley – Non-Executive Director Christopher Peter Huljich – Non-Executive Director Peter Karl Christopher Huljich – (Alternate Non-Executive Director for Christopher Peter Huljich)
Christopher Heaslip – Executive Director
Eliot Barry Crowther – Executive Director
Figure 2. Pushpay Ownership (source New Zealand Companies Office)
Name Shares %
Christopher & Banks Private Equity V Limited 11,805,188 23.6%
DDS Trustee Services Limited 7,428,037 14.8%
Eliot Barry Crowther & Dorette Crowther & Crowther Trustee Limited 7,079,744 14.1%
Douglas David Kemsley & Linda Tanu Kemsley & Michael John Roberts 4,179,501 8.3%
Heaslip Trustee (No.1) Limited & Ruth Shannon & Ross Shannon 2,372,512 4.7%
Pushpay Trustees Limited 2,214,736 4.4%
Alliance Equities 2 Limited 2,137,198 4.3%
Christopher Peter Huljich & Colin Gordon Powell 2,000,116 4.0%
Rodney Macdonald & Rex Macdonald and Leonard Gardner 1,838,434 3.7%
Christopher Peter Huljich and Connie Maria Huljich & Peter Karl Christopher Huljich & Elizabeth Anne Ferguson & Colin Gordon Powell
879,496 1.8%
Noah John Hickey & Susannah Rose Hickey & Hayman Trustees Limited 754,993 1.5%
Michael Stephen Huljich & Svetlana Sharfirov 605,683 1.2%
Papillon Technology Limited 500,000 1.0%
Jason Timothy Kilgour 450,000 0.9%
Hibiscus Independent Trustees 2011 Limited & Bradley & Jessi Dvorak 425,817 0.8%
Other 5,431,311 10.8%

CLARE CAPITAL – PUSHPAY RESEARCH REPORT – FEBRUARY 2015
5 | www.clarecapital.co.nz l +6444985104 l Level 18, 125 The Terrace, PO Box 10269, Wellington 6143, New Zealand
Key Insights
Pushpay has the core fundamentals of a good Software as a Service company
Pushpay’s Software as a Service (SaaS) business model provides a customer focused electronic payment
product, but what is SaaS?
SaaS is both a market delivery method and a product.
It is the sale of software that has day-to-day business applications – for example invoicing, payroll, or HR
software. This isn’t the new or exciting component. Instead of purchasing this software on a license with a
significant up-front cost and on-going maintenance fee, the SaaS approach delivers the product to the
market via a recurring, often monthly fee – the market delivery mechanism. This approach is attractive to
users due to lower initial setup costs and having access to the most up to date version of the product.
Another key feature is that SaaS software is often priced on usage levels, meaning that scaled down
products or reduced volume products can be offered to users. This opens the product up to a potentially
wider market. In addition, subscription based sales favour internet sales, as such the SaaS business model
has a very different sales strategy compared to non-SaaS business models and has the benefit of being
scalable outside of local markets.
As a product, SaaS differs in that the software is centrally hosted away from the individual users using
cloud applications, benefiting from economies of scale in terms of: data storage and processing grunt;
software development expertise and customer support. Essentially rather than having software and data
storage spread amongst the individual users of the product, the point of execution for this has moved
back to the developers of the software. To put it another way the concept is, rather than being sold
software to use and run (with a helpline), the user is subscribing to a product whose up-keep remains the
responsibility of those who developed it.
The key components of a successful SaaS business are:
A sizeable market opportunity and a software product that utilises this opportunity;
Low Customer Acquisition Cost (CAC) relative to recurring revenue per customer;
Strong recurring revenue, often referred to as Average Revenue Per User (ARPU) and in the
case of Pushpay they use Average Revenue Per Merchant (ARPM);
High customer retention, or inversely low churn – meaning that once a customer is acquired
they remain paying the monthly ARPM for a long period of time, essentially creating an “asset”
out of the customer;
Strong growth in both customer numbers and committed monthly revenue (often referred to as
Annualised Committed Monthly Revenue (ACMR) – the high growth nature of SaaS business
means that a simple annual average is not representative of where the company is at as next
month the company will start with all of the current customers and add from there; and
Reducing Cost to Serve (CTS) per customer – reflecting the scalable nature of the SaaS business
model.
Currently, the key focus of Pushpay’s SaaS offering is fast, secure and simple electronic donations for the
Faith Sector in the US. This is a sizeable opportunity. Although the software product can be utilised by
churches of any size (Pushpay already has churches of all size categories), it is often not cost-effective for
churches with less than 100 attendees to implement Pushpay’s product. Therefore Pushpay’s current
target market is churches with 100+ attendees, which is still a sizeable opportunity.

CLARE CAPITAL – PUSHPAY RESEARCH REPORT – FEBRUARY 2015
6 | www.clarecapital.co.nz l +6444985104 l Level 18, 125 The Terrace, PO Box 10269, Wellington 6143, New Zealand
Figure 3. US Churches by Size Category
Attendance Churches %
7-99 177,000 58.8% 100-499 105,000 34.9% 500-999 12,000 4.0% 1,000-1,999 6,000 2.0% 2,000-9,999 1,170 0.4% 10,000-plus 40 0.0% Total 301,210 100.0% >100 124,210 41.2%
Source: http://hirr.hartsem.edu/research/fastfacts/fast_facts.html
Customer Acquisition Cost (CAC) is a core component of an early stage SaaS company. If CAC is too high
relative to ARPU it can sink an aspiring SaaS business. The cost to acquire a customer is often referred to
as CAC months of ARPU – meaning how many months of monthly recurring revenue does it take to cover
the cost of acquiring the customer. An artificial standard of a “Good” SaaS company is CAC months of
ARPU of less than 12, meaning in gross terms the customer “pays” for itself within a year. “Gold”
standard would be CAC months of ARPU of less than six, and “Platinum” standard (or Holy Grail) would
be CAC months of ARPU of one, meaning after acquiring a customer and receiving the full first month’s
revenue, thereafter monthly revenue generated from that customer is “gross” profit. Pushpay’s
performance to date places them between the “Good” and “Gold” standard with a CAC months of 9-12
with guidance that this will remain below 12.
Having a big opportunity and a good product is a great start, but if the monthly return per
customer/merchant (ARPU or ARPM) is low, a company needs to service a large numbers of customers
to add value / create future profits. This is where Pushpay stands out. By nature SaaS companies often
disrupt a market by offering a low cost product at a monthly price of less than $100. For example two
listed examples on the New Zealand stock market, Xero and GeoOp have ARPU’s of slightly less than $30
and approximately $6 respectively. Whereas Pushpay’s equivalent, ARPM was $235 in June 2014
growing to $258 by December 2014 and is expected to increase to over $310 in the near term. This is a
factor of almost 10x higher than Xero – meaning Pushpay requires 10x less customers than Xero to
achieve the same levels of recurring revenue.
Churn can also sink a SaaS opportunity. There are significant costs involved in acquiring a customer and if
they leave before this is repaid a loss is made. A good product results in low churn (high customer
retention) meaning the customer becomes the “assets” of a business. An analogy is, just like in a
manufacturing business where capital is spent on an asset to generate future revenue, a SaaS business
(with low churn) spends money acquiring customers which remain for a long time producing a recurring
revenue stream. An interesting quirk of accounting here is that in the manufacturing example the
purchase of the asset would only hit the P&L via depreciation (i.e. spreading the cost of the asset over its
useful life) whereas the purchase of the SaaS “assets” i.e. the customers hits the P&L immediately
meaning the SaaS company would record a significant near term loss yet the cash flow statements for
both would be similar. It is early days yet, but Pushpay is experiencing very low levels of churn, less
than 5% annually. A very good sign of customer satisfaction, meaning that the recurring revenue of each
of the customers will be around for a long time.
Pushpay is reporting strong month-on-month growth in customer numbers. FY2015 is on track to report
16% month-on-month growth in customer numbers, or slightly less than 500% growth for the annual
period.
Pushpay is showing the scalability of its SaaS business model via a reducing Cost to Serve (CTS) per
Church. This is the other significant piece of the SaaS puzzle and is often over-looked. Even the “Gold” or
“Platinum” standard CAC can be undermined by a high CTS relative to ARPU. The worst case situation
would be that monthly CTS never reduces below monthly ARPU.

CLARE CAPITAL – PUSHPAY RESEARCH REPORT – FEBRUARY 2015
7 | www.clarecapital.co.nz l +6444985104 l Level 18, 125 The Terrace, PO Box 10269, Wellington 6143, New Zealand
Successful acquisition and integration of the Run the Red business
During FY2015 (May) Pushpay successfully acquired Run the Red (RTR) for a total consideration of
$4.5m. This consideration was in the form of:
Cash paid, totalling $3,600,000;
500,000 shares issued 17th July 2014 at $1.00 per share, totalling $500,000; and
Deferred payment payable post warranty claims, totalling $400,000.
Clients of RTR include Westpac, Sky TV, Vodafone, Z Energy, Facebook and New Zealand Post Group
including Kiwibank, New Zealand Post and Express Couriers.
Pushpay has reported the successful integration of the RTR business and that for the month of June, the
first month post integration RTR generated client revenue of around $279,000. RTR is cash flow positive,
which is a key feature. With reported revenue of $4.1m for the 12 month period ended 31 March 2014
for RTR was acquired on a revenue multiple of less than 1.2x. In terms of EBITDA multiple, a multiple
more commonly employed for profitable companies, an estimate of EBITDA of $500K – $750K for RTR
produces an EBITDA multiple range of 6 – 9x. Although these multiples could be considered at the higher
end of the range for a business like RTR, three key features make this a good strategic play:
1. RTR offers complementary products and additional access to businesses that are not currently
using Pushpay’s other products;
2. Pushpay can potentially benefit from administrative cost saving synergies, i.e. improving RTR
EBITDA; and perhaps most key;
3. On a stand-alone basis RTR was profitable providing a revenue basis to underpin growth in
Pushpay’s SaaS business and consequently the losses that Pushpay generate create a tax shield
for RTR’s profits when the businesses are combined.
Lack of liquidity in stock is influencing the market valuation
On the 14th of August 2014 Pushpay listed on the NZAX, this occurred after the company had successfully
raised over $11.7 million of new capital ($2.7 million in April followed by $9.0 million in July). The listing
share price was $1.00 with 50 million shares outstanding providing a market capitalisation of NZ$50
million. There was an immediate increase in the share price once trading commenced. Within a week the
share price increase to $2.75 albeit on a limited number of trades and limited volumes. For a brief period
the share price dropped back to $2.00 and has since risen to $3.10 with a market capitalisation value of
$155 million >200% up on listing in less than six months.
This movement in share price and therefore valuation is on the back of low liquidity on the NZAX due to
the tightly held nature of the stock. The top 15 investors/institutions hold almost 90% of the shares and
the top five hold over 65% of the shares. In both cases these investors are mostly either on the company
board or have strong connections to the board. What we are seeing is that the lack of “sellers” is
influencing the share price and therefore the market valuation.
At this early stage, low liquidity in the stock is not necessarily a bad thing. Longer term, to attract
additional investors and/or capital the Company will require greater liquidity and greater diversity in the
shareholder base. Consequently and positively we expect Pushpay to transfer its listing from the NZAX to
the Main Board within the next 12 months.

CLARE CAPITAL – PUSHPAY RESEARCH REPORT – FEBRUARY 2015
8 | www.clarecapital.co.nz l +6444985104 l Level 18, 125 The Terrace, PO Box 10269, Wellington 6143, New Zealand
Likely to require additional capital
Pushpay raised over $11.7 million in new capital in FY2015, $2.7 million in April and $9.0 million in July.
Up to $4 million of this was ear-marked for the acquisition of Run The Red (RTR), with the remainder for
technology development, operating costs and customer acquisitions. The Company announced in its 2015
Interim Results Announcement that “Pushpay finished the period with over $5.5 million in cash and cash
equivalents and no bank debt, which the Company believes is sufficient to maintain its growth trajectory
in the near term” Cash flows from RTR will help to reduce the level of cash burn, but the continued focus
on technology development and most importantly customer acquisitions means the Company will
continue to spend more than it earns for a significant period yet.
Our modelling of Pushpay’s financial performance indicates that they will require additional capital to
continue their growth trajectory. This additional capital is likely to be required within the next 12 months.
It is our opinion that the company would benefit from a significant proportion of this required capital
coming from outside the existing core investors.
Execution in current target market could see significant jump in valuation
Pushpay has the attributes of a successful SaaS business model. All of the key metrics are as good if not
better than high-quality counterparts, particularly the low levels of churn, relatively low CAC months, high
month on month growth and most importantly a very high ARPM (levels of average monthly recurring
revenue).
Assuming these and Cost to Serve continue to trend positively, Pushpay’s story becomes more about the
growth trajectory of acquiring new customers and the limits on the total number of customers that can
be acquired.
In our valuation we have overlaid an “S-curve” growth trajectory based on a combination of what the
Company has achieved to-date and growth expectations based on peers and economic theory, coupled
with a target of acquiring 20% of the large (>100 attendees) churches in the US. If Pushpay achieves
either, or both, faster than expected growth towards 20% of the target market or provides and proves
guidance towards acquiring >20% of the target market, then there could be a significant increase in the
valuations.
Additional Potential
Pushpay’s current major play is SaaS revenue from the US Faith Sector, predominately churches with
over 100 attendees. This focus caps the market size for Pushpay at around 124,000 churches, however:
1. Pushpay’s product is equally applicable to other jurisdictions (other countries); and
2. Although there is somewhat more competition, Pushpay’s product is not solely applicable for
the Faith Sector and can be utilised by non-profit organisations and enterprises.
Both of which significantly expand the market potential for Pushpay and its products. Finally, an avenue
for additional growth/value add (one which we believe Pushpay is likely to pursue in the near future) is
strategic acquisitions.
None of this potential is included in the current valuations of Pushpay, but could increase the valuation.

CLARE CAPITAL – PUSHPAY RESEARCH REPORT – FEBRUARY 2015
9 | www.clarecapital.co.nz l +6444985104 l Level 18, 125 The Terrace, PO Box 10269, Wellington 6143, New Zealand
Valuation Analysis
Target Price Pushpay is a relatively early stage growth story. We would expect a valuation of the company to be
revised on a regular basis as and when performance is continued to be proven, or the company expands
into additional jurisdictions/markets.
Our rolled forward 12 month target price for Pushpay is $4.17 per share.
Our target price is based on a DCF valuation of our Core Scenario, which we roll forward at the cost of
equity (14.1%). We do not include a revenue multiple valuation in our target price.
The omission of a revenue multiple as part of the target price was deliberate. Pushpay’s future growth is a
SaaS play, however, currently the company’s financial performance is dominated by the recently acquired
Run The Red (RTR) business. Applying a peer SaaS company revenue multiple at this stage would provide
an inaccurate valuation because of the dominance of revenue from RTR, equally applying a non-SaaS
revenue multiple would under-value Pushpay’s SaaS play.
Note: All of our scenarios focus solely on RTR and the US Faith Sector as these are the company’s current
focus. In time the company is likely to expand into other jurisdictions. The company’s disclosure
document indicates medium term plans to expand services into Canada and open an office in the United
Kingdom – events which are expected to impact positively on the share price.
DCF Valuation A Discounted Cash Flow (DCF) valuation, values a company based on the estimated future cash flow the
company will generate discounted by the Weight Average Cost of Capital (WACC) providing a Present
Valuation (PV) of the company.
A DCF valuation requires estimates of all incomings and outgoings of cash for the company, for which
there is uncertainty. This uncertainty is countered, to an extent, by the equity beta in the WACC
calculation and through the inclusion of scenario analysis. Importantly, the principles for valuing a mature
company with steady cash flows are the same as those applied for valuing a growth company like
Pushpay. The key difference being that the latter, the growth companies, will have a higher WACC, i.e.
discounting the future cash flows more heavily, and there is likely to be a considerably wider spread in the
scenario analysis for the growth company.
Within a DCF the valuation is split into:
1. Valuation of cash flows within an explicit forecast period; and
2. Valuation of cash flows post the explicit forecast period, i.e. Terminal Value (TV).
Corporate Finance 101 suggests employing a five or ten year explicit forecast period with a TV when
valuing a company. The general approach is to use five years. Our view is that this does not work for
growth companies like Pushpay. Growth companies are spending money now and in the near term (i.e.
next 2-7 years) to generate future growth. A TV based on year five’s cash flows has two key issues:
1. Revenue generation is likely to be well below what would be considered steady state levels; and
2. Costs at this relatively early stage of the company’s life cycle are disproportionally high
compared to steady state levels – this is particularly the case for Customer Acquisition Costs
(CAC) costs.

CLARE CAPITAL – PUSHPAY RESEARCH REPORT – FEBRUARY 2015
10 | www.clarecapital.co.nz l +6444985104 l Level 18, 125 The Terrace, PO Box 10269, Wellington 6143, New Zealand
A simplistic solution which is generally applied to counteract these issues is to bump up the terminal
growth rate in the TV calculation. We have not done this in our valuation of Pushpay. Our DCF valuation(s)
of Pushpay is (are) based on a 10 year explicit forecast period and a terminal valuation.
Because of its growth nature, we valued Pushpay based on a Core Scenario and have provided a range of
upside and downside scenarios. We have also included “Blue Sky” scenarios, exploring what it would take
for Pushpay to achieve particular target valuations. Details of these valuations are presented in the
following sections.
With the exception of the traditional sensitivities (discussed below), all of the scenarios employ the
following:
Figure 4. WACC assumptions
Value
Equity Beta 1.4
Tax Rate 28.0%
Risk Free Rate 5.0%
Risk Premium 7.5%
WACC 14.1%
Terminal Growth Rate 1.50%

CLARE CAPITAL – PUSHPAY RESEARCH REPORT – FEBRUARY 2015
11 | www.clarecapital.co.nz l +6444985104 l Level 18, 125 The Terrace, PO Box 10269, Wellington 6143, New Zealand
DCF Valuation – Core Scenario
DCF valuation of NZ$183m (market cap), share price NZ$3.64.
Our Core Scenario for Pushpay is a growth scenario and is based on publicly available financial
performance to date, guidance provided by the company, overlaid with expected performance and
principles of a SaaS company. The overlay can be broadly split into two components:
1. What does growth look like; and
2. Cost curves as growth occurs.
Growth
For Pushpay, at this stage, the longer term growth opportunities exist in recurring revenues from the
Faith Sector. The basis of which being the number of churches Pushpay acquires.
A key feature of the SaaS business model that Pushpay is employing is its significant scalability. As the
product establishes a proven foothold within the market, sales growth can very quickly experience growth
proportional to current sales (i.e. month on month growth of x %) – producing exponential growth.
However, this exponential growth is not perpetual in nature.
We have forecast growth in church numbers by employing an S-curve, producing an up-front “tail” of
lower growth, a period of strong growth, and finally tapering to a period of stable church numbers.
Our Core Scenario assumes that Pushpay acquires 20% of US churches with over 100+ attendees (circa
25,000 churches) within the next 10 years. This saturation limit is derived by a combination of the
company’s performance to date and indications from the company. Although this is based on acquiring
circa 25,000 churches in the US, the valuation is equally applicable to acquiring 25,000 churches across all
jurisdictions.
Figure 5. Forecast Church Numbers
-
5,000
10,000
15,000
20,000
25,000
30,000
2015 2016 2017 2018 2019 2020 2021 2022 2023 2024
Nu
mb
ers
Faith Sector

CLARE CAPITAL – PUSHPAY RESEARCH REPORT – FEBRUARY 2015
12 | www.clarecapital.co.nz l +6444985104 l Level 18, 125 The Terrace, PO Box 10269, Wellington 6143, New Zealand
Pushpay have reported monthly Average Revenue per Merchant (ARPM) levels of $258 trending to over
$310 in the near term (less than six months). For our forecasts, we allow for ARPM to grow from $275 to
$350 over a period of 36 months – a capped continuation of recent trends. To complete Pushpay’s
revenue forecasts we have included modest growth in Run The Red’s revenue (capped at $4.6m).
Further guidance from the company to the market on both expected saturation limit on church numbers
and expected ARPM would allow refining of revenue forecasts for the company.
Figure 6. Forecast Revenue
Costs
Although not currently reported as such, we have broken the company’s cost structure into a SaaS setup,
allowing greater flexibility and visibility than simply overlaying an EBITDA margin on the revenue forecast.
The company’s costs have been split into the following four categories:
1. General and Administration (G&A);
2. Research and Development (R&D);
3. Cost to Acquire (CAC); and
4. Cost to Serve (CTS).
Each of these cost categories possess distinct features relative to the company’s growth stage.
G&A – Benefits from economies of scale. In absolute terms the annual dollar amount of G&A costs are
not likely to fall, however relative to company size and revenue levels G&A costs will reduce over time.
R&D – A significant cost near term as Pushpay’s product is developed and enhanced to meet the market’s
needs, again like G&A relative to company size and revenue levels, R&D costs will reduce over time.
CAC – CAC costs are a feature of two components, how many customers are being acquired and how
much it costs to acquire each customer – CAC months of ARPU (or in Pushpay’s case CAC months of
ARPM). Our forecasts employ a U-curve approach to CAC months of ARPM for Pushpay, the logic being as
follows:
CAC months of ARPU is not static. In the beginning, only a small number of customers are being added yet
there are two key components of CAC in play here. Firstly, awareness of the product is low so there is
significant marketing cost associated with bringing in a small number of customers. Secondly, there is
often a fixed level of sales costs – the result is a relatively high near term CAC months of ARPM. As
-
20
40
60
80
100
120
2015 2016 2017 2018 2019 2020 2021 2022 2023 2024
Rev
en
ue
NZ$
m
RTR Faith Sector

CLARE CAPITAL – PUSHPAY RESEARCH REPORT – FEBRUARY 2015
13 | www.clarecapital.co.nz l +6444985104 l Level 18, 125 The Terrace, PO Box 10269, Wellington 6143, New Zealand
momentum gathers, marketing casts a wider net via feedback from the originally acquired customers –
some of this can be attributed to organic growth and marketing lessons are learnt and the money can be
funnelled into more valuable avenues. This in turn, coupled with the fact that up to a point the fixed level
of sales costs can absorb some of the additional customer acquisitions at no further cost – reducing CAC
months of ARPU.
This reducing CAC months of ARPU continues to a point where it starts becoming harder and harder
(more costly) to acquire new customers. CAC months of ARPU can begin to climb if the fixed component
of the costs cannot be minimised. This often coincides in some relation to the point on the S-curve where
month-on-month growth begins to taper. How quickly this occurs depends directly on how the CAC splits
between variable and fixed costs – high levels of fixed costs will see the CAC months of ARPU swing more
dramatically than those with higher levels of variable costs.
At the maturing/mature end of the s-curve growth profile is the fixed component of the CAC which
cannot be minimised. This is again a period of low customer acquisition for considerable cost as per the
beginning of the growth profile.
CTS – Is the combination of the cumulative number of paying churches Pushpay has at a point in time and
the average cost of serving those customers (i.e. CTS per church). The cumulative number of churches is a
function of the growth and churn (which in the case of Pushpay is very low). CTS per church benefits from
economies of scale and as such we have applied a learning curve to this cost. Long term CTS becomes the
dominant cost component for Pushpay.
Figure 7. Forecast Costs as a % of Revenue
2015 2016 2017 2018 2019 2020 2021 2022 2023 2024
G&A 66% 30% 14% 8% 6% 6% 5% 5% 5% 5%
R&D 22% 10% 7% 5% 4% 3% 2% 2% 2% 2%
CTS 80% 47% 40% 35% 33% 31% 31% 30% 30% 30%
CAC 50% 59% 57% 47% 30% 18% 10% 7% 5% 3%
-
50%
100%
150%
200%
250%
Co
st a
s a
% o
f R
eve
nu
e

CLARE CAPITAL – PUSHPAY RESEARCH REPORT – FEBRUARY 2015
14 | www.clarecapital.co.nz l +6444985104 l Level 18, 125 The Terrace, PO Box 10269, Wellington 6143, New Zealand
Forecast Income Statement(s)
The three tables below present forecast income statements for Pushpay specifically: Run The Red (RTR)
only; Faith Sector only; and Group (RTR + Faith Sector). This approach highlights the profitability of RTR
and its near term importance. For FY2015, RTR is expected to account for two-thirds of Pushpay’s
revenue. However as the Faith sector ramps up, RTR’s dominance reduces significantly.
Although at this stage of Pushpay’s evolution the focus is creating value through cost-effective customer
acquisition, rightly or wrongly the question will be asked: when will Pushpay return a profit? It is our view
that this is not completely the wrong question, however near term profitability at the expense of longer
term value creation should be avoided. In summary, don’t judge Pushpay solely on when it will record a
profit.
For those interested in near term profitability, within our Core Scenario, Pushpay is expected to return a
monthly profit in early FY2018, with FY2018 returning the first full year profit. This is later than reported
by the company in its disclosure documents.
Importantly, further delayed profitability for Pushpay is not necessarily a bad sign. Faster than expected
customer acquisition will delay near term profitability but add considerable value to the company.
However, if profitability is delayed due to administrative burden or agency costs this can destroy value. It
is therefore important to understand the cause of changes in near term profitability.
Figure 8. Run The Red forecast financial performance
NZ $m 14A 15E 16F 17F 18F … 24F
Revenue - 3.0 3.6 3.8 4.0 … 4.6
Operating Costs - (1.6) (1.9) (2.1) (2.2) … (2.5)
Admin. Costs - (0.7) (0.8) (0.8) (0.8) … (0.9)
EBITDA - 0.7 0.9 1.0 1.1 … 1.2
% - 24% 25% 26% 27% … 27%
Figure 9. Faith Sector forecast financial performance
Faith Sector NZ $m 14A 15E 16F 17F 18F … 24F
Revenue 0.3 1.5 6.2 16.5 34.8 … 102.1
Operating Costs (1.2) (5.9) (10.3) (19.7) (32.3) … (35.8)
Admin. Costs (0.6) (1.6) (1.4) (1.4) (1.6) … (3.4)
EBITDA (1.5) (6.0) (5.4) (4.6) 0.9 … 63.0
% (459%) (402%) (88%) (28%) 3% … 62%
Figure 10. Group forecast financial performance
All NZ $m 14A 15E 16F 17F 18F … 24F
Revenue 0.3 4.5 9.8 20.3 38.8 … 106.7
Operating Costs (1.2) (7.5) (12.2) (21.7) (34.4) … (38.3)
Admin. Costs (0.6) (2.3) (2.2) (2.2) (2.3) … (4.2)
EBITDA (1.5) (5.3) (4.5) (3.6) 2.0 … 64.2
% (459%) (118%) (46%) (18%) 5% … 60%

CLARE CAPITAL – PUSHPAY RESEARCH REPORT – FEBRUARY 2015
15 | www.clarecapital.co.nz l +6444985104 l Level 18, 125 The Terrace, PO Box 10269, Wellington 6143, New Zealand
Forecast Cash Flow Statement (including Cash Burn versus Cash Balance)
Assuming cost-effective value creation, cash flow and cash position become a very important
consideration in the early stages of growth.
At the close of FY2015 we expect Pushpay to have a little over NZ$2 million in the bank (and no debt). As
highlighted in the table and chart below this will not be enough to continue to fund Pushpay’s rapid
growth. We expect Pushpay will require additional capital during the mid to latter part of FY2016. Up to
NZ$9.6 million of additional capital is required to fund the growth presented in our Core Scenario. It is
however, highly likely that the company will seek to raise additional capital over and above this to
undertake strategic acquisitions which have the potential to increase Pushpay’s valuation.
Pushpay has a requirement for additional capital, and first and foremost obtaining this capital is key.
However, we believe that the Company would benefit from a significant proportion of this capital coming
from outside of the current core investors. This would help to reduce the tightly held nature of the stock,
ultimately increasing liquidity in the stock and allowing an active market valuation of the Company.
Figure 11. Pushpay Forecast Cash Flow Statement
(NZ $m) 14A 15E 16F 17F 18F … 24F
Opening Cash 0.3 2.7 2.1 (3.4) (8.5) … 148.0
Cash Received 0.2 3.4 9.6 19.9 38.1 … 106.7
Cash Paid (1.5) (8.9) (14.1) (23.4) (36.2) … (42.6)
Income Tax - - - - - … (19.4)
Interest Received - 0.1 0.1 - - … 7.4
Cap. Dev Costs (0.6) (1.2) (1.0) (1.4) (1.9) … (2.6)
Plant & Equipment (0.1) (0.2) (0.2) (0.2) (0.2) … (0.2)
Purchase of RTR - (4.0) - - - … -
Other 0.0 (0.2) - - - … -
Share Capital 4.4 10.4 - - - … -
Net Cash flow 2.5 (0.6) (5.5) (5.0) (0.1) … 49.4
Closing Cash 2.7 2.1 (3.4) (8.5) (8.6) … 197.4
* Note: there is rounding in these figures.
Figure 12. Forecast Cash Burn versus Cash Balance
* Note: the increase in burn in FY2015 corresponds to the purchase of Run The Red, and the reduction in
positive cash in FY2020 corresponds to the Company beginning to pay tax in the forecasts.
(10)
(5)
-
5
10
15
20
(1.0)
(0.5)
-
0.5
1.0
1.5
2.0
Oct
-14
Jan
-15
Apr
-15
Jul-
15
Oct
-15
Jan
-16
Apr
-16
Jul-
16
Oct
-16
Jan
-17
Apr
-17
Jul-
17
Oct
-17
Jan
-18
Apr
-18
Jul-
18
Oct
-18
Jan
-19
Apr
-19
Jul-
19
Oct
-19
Cas
h B
alan
ce (N
Z$m
)
Cas
h B
urn
(N
Z$m
)
Cash Burn Cash Balance

CLARE CAPITAL – PUSHPAY RESEARCH REPORT – FEBRUARY 2015
16 | www.clarecapital.co.nz l +6444985104 l Level 18, 125 The Terrace, PO Box 10269, Wellington 6143, New Zealand
Forecast Balance Sheet
Figure 13. Pushpay Forecast Balance Sheet
(NZ $m) 14A 15E 16F 17F 18F … 24F
Cash 2.7 2.2 (3.4) (8.4) (8.5) … 197.4
Receivables 0.2 1.6 1.8 2.1 2.8 … 4.4
Intangible Assets 0.8 6.3 6.2 6.5 7.2 … 11.2
Plant & Equipment 0.1 0.3 0.3 0.3 0.3 … 0.3
Total Assets 3.8 10.4 4.9 0.5 1.7 … 213.3
Payables 0.4 1.9 2.1 2.6 3.2 … 3.1
Other 3.7 0.1 0.1 0.1 0.1 … 0.1
Total Liabilities 4.0 2.0 2.3 2.7 3.3 … 3.2
Net Assets (0.2) 8.3 2.6 (2.2) (1.6) … 210.0
Share Capital 1.9 16.4 16.4 16.4 16.4 … 16.4
Accumulated Losses (2.2) (8.1) (13.7) (18.6) (18.0) … 193.6
Total Equity (0.2) 8.3 2.6 (2.2) (1.6) … 210.0
* Note: as previously mentioned, under this scenario the Company requires additional capital. For
illustrative purposes with have not included this additional capital in the balance sheet (this is a consistent
approach employed in the tables throughout this report).
Core SaaS Metrics
Figure 14. Forecast Key Metrics
Metrics 14A 15E 16F 17F 18F … 24F
EBITDA Margin (%) (459%) (118%) (46%) (18%) 5% … 60%
NPAT Margin (%) (489%) (136%) (58%) (24%) 2% … 47%
Church Numbers 158 900 2,711 6,002 10,847 … 24,402
Avg. MoM (%) NA 16% 10% 7% 5% … 0%
Annual Growth (%) NA 470% 201% 121% 81% … 1%
ARPM ($) 175 275 300 325 350 … 350
CTS/Church ($) (500) (375) (125) (115) (110) … (100)
CAC Months 9 12 11 11 11 … 20
ACMR ($m) 0 3 10 23 46 … 102
Valuation Sensitivity
Below we have highlighted the impact of changing what are considered traditional sensitivities to our
Core Scenario valuation of NZ$183m, $3.64 per share.
Figure 15. Traditional Sensitivities – Impact of Key Variables Changes on Valuation
Traditional Sensitivities Range DCF Share Price
Terminal Growth +/-1% +/- 10m +/- 20c
WACC +/-1% +/- 20m +/- 40c
ARPM +/-10% +/- 30m +/- 60c

CLARE CAPITAL – PUSHPAY RESEARCH REPORT – FEBRUARY 2015
17 | www.clarecapital.co.nz l +6444985104 l Level 18, 125 The Terrace, PO Box 10269, Wellington 6143, New Zealand
DCF Valuation – Scenario Analysis
Pushpay is in the early stages of its evolution which provides considerable uncertainty in the company’s
future financial performance – both upside and downside. Two key features of this uncertainty is church
numbers, being:
1. The ultimate number of churches acquired – how high; and
2. The nature of growth – how fast.
We have established three scenarios to support the Core Scenario to explore the question, how high?
These three scenarios (along with the Core Scenario) are summarised below:
A. Low Scenario – Pushpay acquires 7.5% of US churches with over 100 attendees. DCF Valuation
of NZ$74 million, NZ$1.49 per share.
B. Lower Scenario – Pushpay acquires 10% of US churches with over 100 attendees. DCF Valuation
of NZ$98 million, NZ$1.96 per share.
C. Core Scenario – Pushpay acquires 20% of US churches with over 100 attendees. DCF Valuation
of NZ$183 million, NZ$3.64 per share.
D. Upper Scenario – Pushpay acquires 25% of US churches with over 100 attendees. DCF Valuation
of NZ$223 million, NZ$4.46 per share.
Note: These scenarios are solely US focused. Pushpay has the potential and are signalling to expand this
focus which has the potential to increase the valuations in each of the scenarios.
The information below summarises church numbers and revenue profiles for each of the scenarios. The
Upper Scenario highlights Pushpay’s potential, however as is the case for SaaS companies the addressable
market and the percentage of this acquired and at what cost is key. How Pushpay performs in the near
term and any guidance the company provides on expected long term market share will influence the
company’s valuation significantly.
Figure 16. Forecast Church Numbers by Scenario
14A 15E 16F 17F 18F … 24F
Low Scenario 158 900 2,054 3,811 5,800 … 9,182
Lower Scenario 158 900 2,205 4,333 6,983 … 12,232
Core Scenario 158 900 2,711 6,002 10,847 … 24,402
Upper Scenario 158 900 2,942 6,743 12,560 … 30,475
Figure 17. Forecast Revenue (NZ $m) by Scenario
Revenue NZ $m 14A 15E 16F 17F 18F … 24F
Low Scenario 0.3 4.5 8.7 15.0 23.9 … 43.1
Lower Scenario 0.3 4.5 9.0 16.2 27.4 … 55.9
Core Scenario 0.3 4.5 9.8 20.3 38.8 … 106.7
Upper Scenario 0.3 4.5 10.2 22.1 43.8 … 132.1

CLARE CAPITAL – PUSHPAY RESEARCH REPORT – FEBRUARY 2015
18 | www.clarecapital.co.nz l +6444985104 l Level 18, 125 The Terrace, PO Box 10269, Wellington 6143, New Zealand
Supplementing the scenarios above (the how high), we have also addressed the question of how fast by
adjusting the growth profile for each of the scenarios. Figure 18 illustrates the adjustments made for the
Core Scenario (the principle is the same for all scenarios). For each scenario, along with the expected
growth profile we have included the:
1. Slow growth profile;
2. Slower growth profile; and the
3. Faster growth profile.
Figure 18. Church Numbers Sensitivity Analysis
Figure 19 illustrates the effect of these sensitivities on the valuation of each of the scenarios, highlighting
the considerable importance of how fast Pushpay adds churches. The Slow growth profile is not the basis
of a SaaS business model, but on the other hand is not completely unrealistic. This downside growth
profile reduces each of the scenario valuations by greater than 50%.
The takeaway message is that how high and how fast are both equally important to Pushpay – execution
is key.
Figure 19. Market Capitalisation by Scenario by Growth Path Sensitivity
Slow Slower Expected Faster
Low Scenario 36 66 74 78
Lower Scenario 45 85 98 102
Core Scenario 75 151 183 194
Upper Scenario 89 182 223 239
Figure 20. Share Price by Scenario by Growth Path Sensitivity
Slow Slower Expected Faster
Low Scenario 0.71 1.31 1.49 1.55
Lower Scenario 0.90 1.70 1.96 2.04
Core Scenario 1.51 3.02 3.64 3.87
Upper Scenario 1.79 3.63 4.46 4.79
-
5,000
10,000
15,000
20,000
25,000
30,000O
ct-1
3
Mar
-14
Aug
-14
Jan
-15
Jun
-15
No
v-15
Apr
-16
Sep
-16
Feb
-17
Jul-
17
Dec
-17
May
-18
Oct
-18
Mar
-19
Aug
-19
Jan
-20
Jun
-20
No
v-20
Apr
-21
Sep
-21
Feb
-22
Jul-
22
Dec
-22
May
-23
Oct
-23
Mar
-24
Nu
mb
ers
Faster Expected Slower Slow
CLARE CAPITAL – PUSHPAY RESEARCH REPORT – FEBRUARY 2015
19 | www.clarecapital.co.nz l +6444985104 l Level 18, 125 The Terrace, PO Box 10269, Wellington 6143, New Zealand
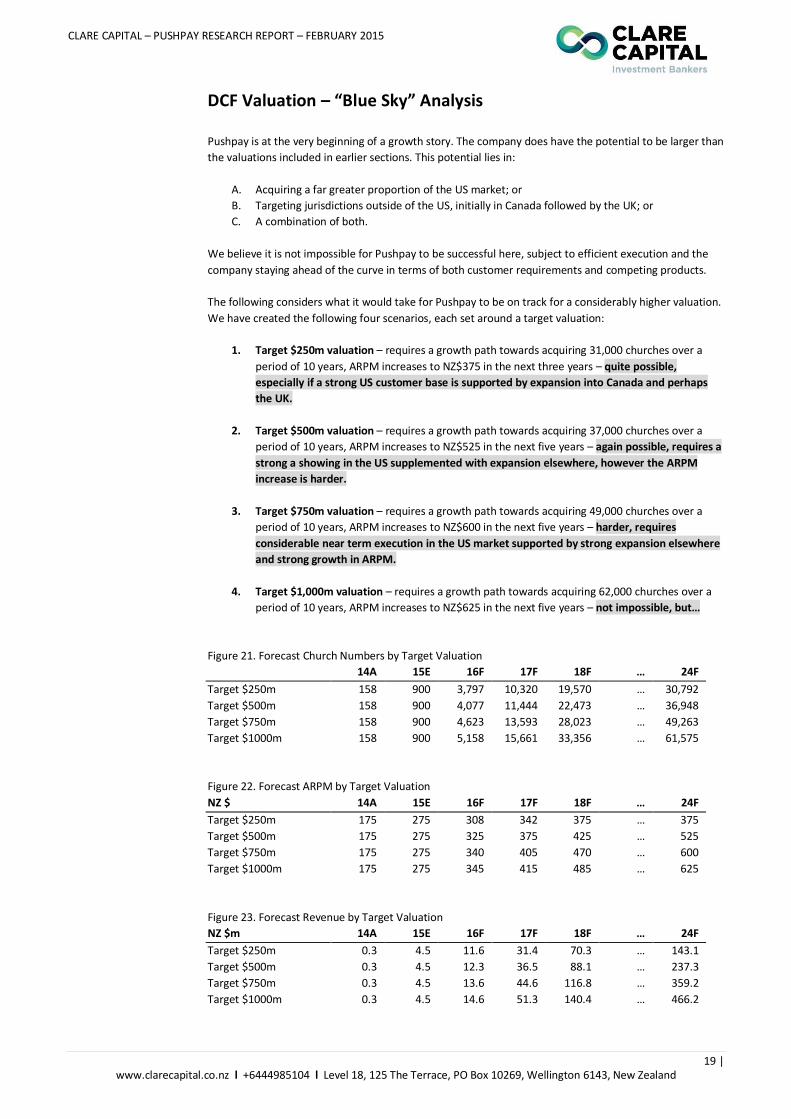
DCF Valuation – “Blue Sky” Analysis
Pushpay is at the very beginning of a growth story. The company does have the potential to be larger than
the valuations included in earlier sections. This potential lies in:
A. Acquiring a far greater proportion of the US market; or
B. Targeting jurisdictions outside of the US, initially in Canada followed by the UK; or
C. A combination of both.
We believe it is not impossible for Pushpay to be successful here, subject to efficient execution and the
company staying ahead of the curve in terms of both customer requirements and competing products.
The following considers what it would take for Pushpay to be on track for a considerably higher valuation.
We have created the following four scenarios, each set around a target valuation:
1. Target $250m valuation – requires a growth path towards acquiring 31,000 churches over a
period of 10 years, ARPM increases to NZ$375 in the next three years – quite possible,
especially if a strong US customer base is supported by expansion into Canada and perhaps
the UK.
2. Target $500m valuation – requires a growth path towards acquiring 37,000 churches over a
period of 10 years, ARPM increases to NZ$525 in the next five years – again possible, requires a
strong a showing in the US supplemented with expansion elsewhere, however the ARPM
increase is harder.
3. Target $750m valuation – requires a growth path towards acquiring 49,000 churches over a
period of 10 years, ARPM increases to NZ$600 in the next five years – harder, requires
considerable near term execution in the US market supported by strong expansion elsewhere
and strong growth in ARPM.
4. Target $1,000m valuation – requires a growth path towards acquiring 62,000 churches over a
period of 10 years, ARPM increases to NZ$625 in the next five years – not impossible, but…
Figure 21. Forecast Church Numbers by Target Valuation
14A 15E 16F 17F 18F … 24F
Target $250m 158 900 3,797 10,320 19,570 … 30,792
Target $500m 158 900 4,077 11,444 22,473 … 36,948
Target $750m 158 900 4,623 13,593 28,023 … 49,263
Target $1000m 158 900 5,158 15,661 33,356 … 61,575
Figure 22. Forecast ARPM by Target Valuation
NZ $ 14A 15E 16F 17F 18F … 24F
Target $250m 175 275 308 342 375 … 375
Target $500m 175 275 325 375 425 … 525
Target $750m 175 275 340 405 470 … 600
Target $1000m 175 275 345 415 485 … 625
Figure 23. Forecast Revenue by Target Valuation
NZ $m 14A 15E 16F 17F 18F … 24F
Target $250m 0.3 4.5 11.6 31.4 70.3 … 143.1
Target $500m 0.3 4.5 12.3 36.5 88.1 … 237.3
Target $750m 0.3 4.5 13.6 44.6 116.8 … 359.2
Target $1000m 0.3 4.5 14.6 51.3 140.4 … 466.2

CLARE CAPITAL – PUSHPAY RESEARCH REPORT – FEBRUARY 2015
20 | www.clarecapital.co.nz l +6444985104 l Level 18, 125 The Terrace, PO Box 10269, Wellington 6143, New Zealand
Thoughts on EV/Revenue Multiple
To start with, what is EV/Revenue Multiple?
Firstly, Enterprise Value (EV) is a measure of how much a company would cost, if you were to buy it
outright – free and clear of debt and cash. Therefore, Enterprise Value to Revenue Multiple (EV/Revenue)
compares a company’s enterprise value to its revenue, answering the question “What is a company being
valued at per dollar of revenue?” EV/Revenue is most commonly expressed as a number in decimal form
followed by an x, for example 3.7x.
What is EV/Revenue used for?
This metric benefits from its simplicity and is employed as:
1. One of several indicators that investors use to determine whether a stock is priced well; or
2. A method of determining a company’s valuation in the case of a potential acquisition or capital
raise quite often in the case of early stage companies with negative cash flows.
In terms of an indicator, the traditional view was that a company with a high (low) EV/Revenue Multiple is
potentially overvalued (undervalued). Put another way EV/Revenue Multiples are often used to quickly
look at a company’s value in relation to the revenue it is generating, “where all things being equal”, the
lower the ratio, the better – importantly all things are never equal.
What is considered a high or low multiple for a particular company is often based on either:
1. A general rule of thumb; or
2. On a comparison of multiples of peer companies.
A key aspect with peer companies, is not only finding the peer companies, but also the timing of the
multiple – i.e. what were the multiples of these companies when they were at the same stage as the
company in question. Meaning that multiples are not only sector specific (i.e. manufacturing company
versus a technology company) but also growth stage specific (i.e. an early stage company with
considerable growth potential would be expected to trade at a higher multiple than a mature company
with lower growth opportunities).
The reason why early stage growth companies often attract high multiples is because the multiple is
factoring in future potential. Investors usually take one of two broad approaches to valuing a company,
particularly those with current negative cash flows. Either a point-in-time metric such as an EV/Revenue
Multiple or a full Discounted Cash Flow (DCF) valuation. Both approaches are simplifying the complex
financial performance of a company into a series of relationships to estimate value. A limitation of the
multiple approach is that the only way to account for future growth is to inflate the multiple, implicitly
factoring in growth. Whereas a DCF explicitly factors in the growth, but requires considerably more inputs
and assumptions which can be hard to establish.
For a high growth company, it is expected that the company’s EV/Revenue Multiple will be at its highest
near the earliest stages of the company’s evolution. At this time the company is likely to have relatively
low levels of revenue relative to its potential – the result being a valuation that factors in this
considerable potential growth. Moving through time it is expected that a company’s EV/Revenue Multiple
will start to reduce as it “grows” into its valuation. Ultimately, the point in time where a company’s
EV/Revenue Multiple is lowest is when it reaches maturity and the company has grown into most, if not
all, of the potential that existed.
How long does it take to reach the low point in terms of EV/Revenue Multiple and, at what rate does the
EV/Revenue Multiple decay as the company grows/increases revenues? – are both interesting questions.
Again it comes down to the basis of what the multiple is factoring in, if the company’s current growth is
very high and the potential for future growth remains high the multiple in theory should also remain high.
The choice of EV/Revenue Multiple is often not a sophisticated science, it generally comes down to
company x raised capital at y multiple, or companies a, b and c in the similar sector are trading at and
have an average multiple of d.

CLARE CAPITAL – PUSHPAY RESEARCH REPORT – FEBRUARY 2015
21 | www.clarecapital.co.nz l +6444985104 l Level 18, 125 The Terrace, PO Box 10269, Wellington 6143, New Zealand
An approach that we like and have previously employed is based on a blog post by Andy Victus of Scale
Venture Partners: http://www.scalevp.com/a-valuation-framework-for-saas-companies. This approach
has limitations, but what we like about it, is that it places a framework around how to choose a multiple
for valuing a growth company. The approach employs a growth decay trajectory as a compromise
between the complexities of a time-based DCF and the simplicity of a point-in-time revenue multiple. In
essence, it relates the choice of EV/Revenue Multiple to the Compound Annual Growth Rate (CAGR) the
company is experiencing around revenue. This approach is based on the assumption that next year’s
growth is related to the current year’s growth with an element of decay. There does appear to be a range
for which the maths behind this approach works, but the key principle is that as a company’s growth rate
decays the EV/Revenue multiple responds in somewhat of a negatively exponential manner – i.e. after a
point, a small reduction in revenue growth can have a significant negative impact on the EV/Revenue
multiple.
The concluding piece of advice from the blog is “in order to build a meaningful business and secure
venture returns, it is vital to maintain exceptionally high growth rates for an extended period of time. This
is only achieved by brilliant execution as an early mover in a massive market”
What does Pushpay’s EV/Revenue Multiple look like?
There are two things to initially consider here.
Firstly, when looking into revenues for a SaaS company it is common to look at Annualised Committed
Monthly Revenues (ACMR) as opposed to the annual revenue figure. The reason for this is that the high
growth nature of SaaS business means that a simply annual average is not representative of where the
company is at as next month the company will start with all of the current customers and add from there.
Secondly, in terms of applying an EV/Revenue Multiple, not all revenue is created equal. As discussed, to
warrant a high EV/Revenue Multiple, the revenue stream requires exceptionally high growth rates and
significant potential. Pushpay’s revenue from the Faith Sector has these attributes and therefore currently
warrants a high multiple, however the revenue from Run The Red has different attributes and needs to be
considered accordingly.
Taking information from Pushpay’s January 2015 release and looking at its Market Capitalisation provides
an insight into what EV/Revenue Multiple the company is trading at:
At as 31 December 2015, the Company’s shares were trading at $2.80 providing a Market
Capitalisation of NZ$140 million;
Assuming the Company had ~NZ$2.5 million in cash, provides an Enterprise Value of NZ$137.5
million;
During the year there was a market transaction that valued Run The Red (RTR) at ~$NZ4.5
million (Pushpay’s purchase price for this company);
Therefore, the Faith Sector/SaaS component of Pushpay at this point in time had an Enterprise
Value of NZ$133 million;
At this time the Company reported they had 602 customers paying an average recurring
revenue of $258 providing monthly recurring revenue of NZ$155,316;
As an annualised figure, NZ$155,316 * 12 = NZ$1,863,792 ACMR; producing
An EV/Revenue Multiple of NZ$133 million/NZ$1,863,792 = 71.4x.
Is 71.4x high? Yes. Is it too high? – a better question…
It doesn’t appear too high when you compare the Company’s market capitalisation and therefore
enterprise value against our Core Scenario DCF valuation that extrapolates current growth rates targeting
20% of large US churches or the equivalent of 25,000 large churches worldwide over the next ten years.
Another approach to answer this question, is to compare this multiple with “peer companies”. An obvious
likely candidate is Xero. Xero currently trades at an EV/Revenue Multiple of around 20x, but Xero is
further ahead in its growth story. In addition, Xero’s current CAGR is considerably lower than Pushpay’s
and therefore warrants a lower EV/Revenue Multiple. However, early on in its evolution, Xero had an

CLARE CAPITAL – PUSHPAY RESEARCH REPORT – FEBRUARY 2015
22 | www.clarecapital.co.nz l +6444985104 l Level 18, 125 The Terrace, PO Box 10269, Wellington 6143, New Zealand
EV/Revenue Multiple of north of 100x, at the same growth stage as Pushpay’s current position, Xero had
an EV/Revenue Multiple of ~90x.
So on both counts, a DCF and in comparison to Xero, Pushpay’s current EV/Revenue Multiple is high, but
not too high – as long as the Company maintains “exceptionally high growth rates”.
At what rate will Pushpay’s EV/Revenue Multiple decay, or alternatively what would be an EV/Revenue
Multiple that can be applied to a 12-month forecast of customer numbers? Both of these questions are
often asked to allow for a simpler approach to come up with a forward valuation for the Company. The
difficulty here lies in what the multiple represents – it is factoring in all aspects of current growth, future
potential and (importantly) margins. As long as Pushpay’s growth for the next 12 months continues to be
high (as expected), and there is potential for considerable further growth (as expected) then Pushpay is
likely to remain trading on a high multiple, albeit reduced from current levels for reasons discussed in the
preceding paragraphs. Rather than “estimate” what a 12-month multiple could be an alternative is to
reverse engineer our 12-month target valuation of Pushpay to provide a future multiple. The calculation is
as follows:
12-month target Enterprise Valuation (from Core Scenario) of NZ$212 million;
Less ~$NZ5 million for RTR, provides an Enterprise Value of NZ$207 million;
12-month target customer numbers ~2,500 with an ARPM of ~NZ$300;
Providing and ACMR of NZ$9 million; providing
A 12-month target EV/Revenue Multiple of NZ$207 million/NZ$9 million = 23x.
Is this unrealistic? If the 12-month growth is as expected and there is still significant potential, the answer
is no.

CLARE CAPITAL – PUSHPAY RESEARCH REPORT – FEBRUARY 2015
23 | www.clarecapital.co.nz l +6444985104 l Level 18, 125 The Terrace, PO Box 10269, Wellington 6143, New Zealand
Comparators Figure 24. Comparators Ranked by 3-Yearr Revenue CAGR (Source: FactSet)
Ticker Company Name EV NZ $m 3-Year CAGR EV/Rev
FEYE-US FireEye, Inc. 5,681 139.5% 12.9
NOW-US ServiceNow, Inc. 12,183 114.0% 15.4
WIX-US Wix.com Ltd. 1,017 101.4% 6.3
XRO-NZ Xero Ltd. 2,075 95.8% 22.1
VEEV-US Veeva Systems, Inc. Class A 1,772 93.2% 4.7
WDAY-US Workday, Inc. Class A 11,101 90.3% 12.2
DIL-NZ Diligent Board Member Services, Inc. 354 90.0% 3.8
MKTO-US Marketo, Inc. 1,566 89.8% 8.9
DATA-US Tableau Software, Inc. Class A 3,891 89.5% 8.6
LNKD-US LinkedIn Corp. Class A 29,478 84.6% 11.3
TXTR-US Textura Corp. 843 80.7% 11.6
SPLK-US Splunk, Inc. 8,813 65.9% 16.9
CSOD-US Cornerstone Ondemand, Inc. 2,515 61.8% 8.0
MRIN-US Marin Software, Inc. 286 59.6% 2.3
RNG-US RingCentral, Inc. Class A 740 47.3% 2.8
JIVE-US Jive Software, Inc. 512 46.6% 2.3
DWRE-US Demandware, Inc. 2,313 41.4% 12.5
FLTX-US FleetMatics Group Ltd. 1,630 40.0% 5.8
BV-US Bazaarvoice, Inc. 754 37.6% 3.2
SUM-CA Solium Capital, Inc. 355 36.3% 4.0
BCOV-US Brightcove, Inc. 236 36.0% 1.5
RALY-US Rally Software Development Corp. 266 35.8% 2.5
CRM-US Salesforce.com, Inc. 46,989 34.9% 7.2
ATHN-US athenahealth, Inc. 6,088 33.6% 6.6
SPSC-US SPS Commerce, Inc. 1,019 32.8% 6.5
LOCK-US LifeLock, Inc. 1,954 31.6% 4.1
SWI-US SolarWinds, Inc. 4,708 30.1% 8.9
N-US NetSuite, Inc. 10,263 29.0% 15.4
FNGN-US Financial Engines, Inc. 2,038 28.8% 5.8
PFPT-US Proofpoint, Inc. 2,286 28.6% 9.8
SQI-US SciQuest, Inc. 448 28.5% 3.4
SNCR-US Synchronoss Technologies, Inc. 2,146 28.1% 3.9
QLIK-US Qlik Technologies Inc. 3,164 27.6% 4.6
JCOM-US j2 Global, Inc 3,816 26.8% 5.2
RP-US RealPage, Inc. 2,095 26.0% 4.1
TRAK-US Dealertrack Technologies, Inc. 3,920 25.5% 4.1
BSFT-US BroadSoft, Inc. 1,089 23.1% 4.1
ECOM-US Channeladvisor Corp. 541 22.8% 5.1
EGHT-US 8x8, Inc. 838 22.4% 4.4
ULTI-US Ultimate Software Group, Inc. 5,206 21.7% 8.3
SLI-NZ SLI Systems Ltd. 55 19.9% 2.5
MDSO-US Medidata Solutions, Inc. 3,365 18.5% 8.1
QLYS-US Qualys, Inc. 1,507 18.2% 9.2
LOGM-US LogMeIn, Inc. 1,457 18.1% 5.4
CTCT-US Constant Contact, Inc. 1,307 17.9% 3.2
LPSN-US LivePerson, Inc. 829 17.4% 3.2
EPAY-US Bottomline Technologies (de), Inc. 1,177 16.6% 2.9
CALD-US Callidus Software, Inc. 934 16.6% 5.6
SAAS-US inContact, Inc. 602 16.5% 3.0
1st Quartile 23.1% 3.8
Median Value 32.8% 5.4
3rd Quartile 61.8% 8.9
XRO-NZ 95.8% 22.1

CLARE CAPITAL – PUSHPAY RESEARCH REPORT – FEBRUARY 2015
24 | www.clarecapital.co.nz l +6444985104 l Level 18, 125 The Terrace, PO Box 10269, Wellington 6143, New Zealand
Pushpay in comparison to Xero
A SaaS company in New Zealand is always going to be compared to Xero. Although Pushpay offers a
different product and has a different target market to Xero, the SaaS governing principles of both
companies are essentially the same, particularly the cost-effective acquisition of customers paying
recurring revenue creating value.
Xero’s SaaS offering is an accounting package for small to medium enterprises with a significantly large
worldwide Total Addressable Market (TAM) in the tens of millions of potential customers. Key markets for
Xero are: New Zealand; Australia; UK; and the US, with increased focus on how Xero performs in the US.
In terms of key SaaS metrics: Xero’s current weighted Average Revenue Per User (ARPU) is around NZ$30;
weighted average CAC months of ARPU of 13-15 months; and Xero has recently reported passing the
NZ$100 million mark for Annualised Committed Monthly Revenue.
Pushpay’s SaaS offering is a mobile payment offering currently targeting the US Faith Sector, particularly
churches with 100+ attendees, providing a US focused TAM of circa 120,000 churches. In terms of key
SaaS metrics: Pushpay’s current weighted ARPM (equivalent of Xero’s ARPU) is NZ$258 trending to
NZ$310 in the medium term; and has a weighted average CAC months of ARPM of less than 12 months.
Of the metrics presented above, Pushpay records a very significant win on the ARPU/ARPM front at
almost 10x Xero’s figure. Pushpay’s current CAC months of ARPM is also almost 25% better than Xero’s,
meaning that Pushpay is more cost-effectively acquiring customers than Xero. However, assuming
efficient execution by both companies, the ultimate trump card in this equation is TAM, where Xero is the
clear winner. As stated earlier in the report, Pushpay has the ability to significantly expand its TAM by
either: as intended, moving into other jurisdictions; and/or expanding its penetration of its product with
small to medium enterprises – as and when this occurs the picture below will change.
Tracking Annualised Committed Monthly Revenue (ACMR) through time for both Pushpay (both actual
and forecast) and Xero (actual) highlights the impact of the information above. Pushpay’s considerably
higher ARPM has produced a higher ACMR than Xero for the equivalent period in Xero’s history.
Pushpay’s ACMR is expected to continue to out-pace Xero’s historical performance for further 4-5 years in
our Core Scenario before the influence of the lower TAM takes effect (see Figure 25). The Upper Scenario
for Pushpay accentuates Pushpay’s near term ACMR dominance over Xero and delays the impact of the
tapering, but ultimately TAM wins. Key Point: Pushpay needs to expand its TAM, likely through
geographical expansion or complementary product development to be in the same field as Xero.
Figure 25. ACMR Comparison with Xero
-
20
40
60
80
100
120
140
1 3 5 7 9 11 13 15 17 19 21 23 25 27 29 31
AC
MR
(N
Z $m
)
Quarter
XRO (actual) PAY (actual) Core Scn Upper Scn

CLARE CAPITAL – PUSHPAY RESEARCH REPORT – FEBRUARY 2015
25 | www.clarecapital.co.nz l +6444985104 l Level 18, 125 The Terrace, PO Box 10269, Wellington 6143, New Zealand
Another interesting point of comparison is the relationship of these two SaaS company’s Enterprise Value
(EV) and their EV/ACMR Multiple over time (Note: the time periods loosely relates to the years of the
company’s evolution).
At the outset the market values of these SaaS companies were at very high EV/ACMR Multiples – a
feature that must be factoring in significant future potential. In the early stages, Pushpay had a
considerably lower EV/ACMR multiple than Xero but almost double the EV. The lower multiple is likely to
be a combination of the lower TAM for Pushpay and increased market awareness/understand of SaaS
offerings. However the higher EV is reflective of Pushpay’s higher ARPM and possibly the supply and
demand forces that are currently impacting Pushpay’s market capitalisation.
Post this period, in Xero’s profile, there then seems to be a significant downwards adjustment in the
EV/ACMR multiple for a period of time. At the same time the amount of revenue being generated
increases, so the overall EV of the company starts to show signs of life.
In Xero’s evolution there has been three key features in the latter stages: firstly revenue has increased
significantly due to continued growth in customer numbers; secondly there has been further upward
revisions in the multiple – a feature of both: a recognition of the original promise the company had and,
the market factoring in further potential; and finally a sharp reduction in both EV/ACMR multiple and
overall EV – explained by some as a market correction. Perhaps this was a market correction and the
valuation got ahead of itself, equally, it could be a case of the market making the best use of the
imperfect information available at the time.
Given the SaaS nature of Pushpay, we expect the Company’s trajectory of EV/ACMR to follow a broadly
similar path to that of Xero’s. We expect the EV/ACMR Multiple to reduce over time, but this will be
compensated by increased revenues leading to increases in EV. Again as discussed, Pushpay’s higher
ARPM is expected to produce a higher near term EV than Xero’s, but longer term the lower TAM will
impact Pushpay’s overall market valuation in comparison to Xero. A key for Pushpay will be the indicated
expansion into other jurisdictions and into the enterprise space to increase the Company’s TAM.
Figure 26. Enterprise Value and EV/ACMR Multiple over time, Pushpay versus Xero
-
20
40
60
80
100
120
140
160
0 1 2 3 4 5 6 7 8
EV/A
CM
R
Time (Year #)XRO-NZ PAY-NZ
Size of Bubble Represents EV
CLARE CAPITAL – PUSHPAY RESEARCH REPORT – FEBRUARY 2015
26 | www.clarecapital.co.nz l +6444985104 l Level 18, 125 The Terrace, PO Box 10269, Wellington 6143, New Zealand
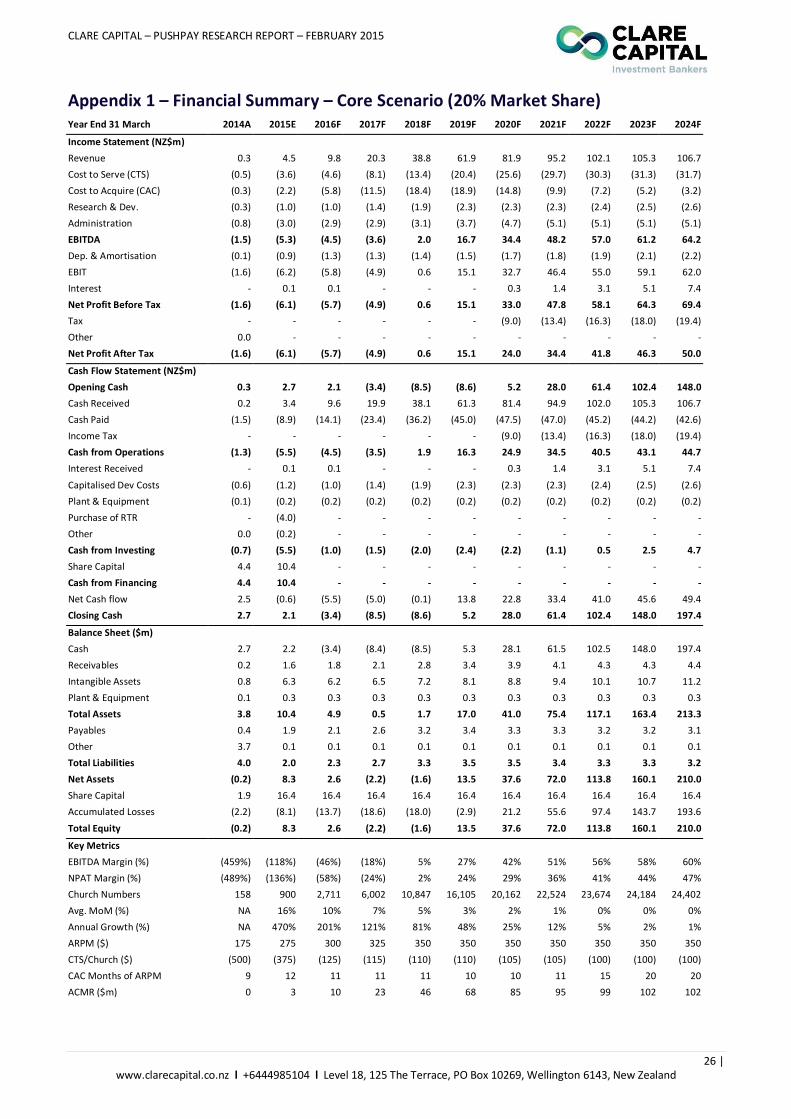
Appendix 1 – Financial Summary – Core Scenario (20% Market Share) Year End 31 March 2014A 2015E 2016F 2017F 2018F 2019F 2020F 2021F 2022F 2023F 2024F
Income Statement (NZ$m)
Revenue 0.3 4.5 9.8 20.3 38.8 61.9 81.9 95.2 102.1 105.3 106.7
Cost to Serve (CTS) (0.5) (3.6) (4.6) (8.1) (13.4) (20.4) (25.6) (29.7) (30.3) (31.3) (31.7)
Cost to Acquire (CAC) (0.3) (2.2) (5.8) (11.5) (18.4) (18.9) (14.8) (9.9) (7.2) (5.2) (3.2)
Research & Dev. (0.3) (1.0) (1.0) (1.4) (1.9) (2.3) (2.3) (2.3) (2.4) (2.5) (2.6)
Administration (0.8) (3.0) (2.9) (2.9) (3.1) (3.7) (4.7) (5.1) (5.1) (5.1) (5.1)
EBITDA (1.5) (5.3) (4.5) (3.6) 2.0 16.7 34.4 48.2 57.0 61.2 64.2
Dep. & Amortisation (0.1) (0.9) (1.3) (1.3) (1.4) (1.5) (1.7) (1.8) (1.9) (2.1) (2.2)
EBIT (1.6) (6.2) (5.8) (4.9) 0.6 15.1 32.7 46.4 55.0 59.1 62.0
Interest - 0.1 0.1 - - - 0.3 1.4 3.1 5.1 7.4
Net Profit Before Tax (1.6) (6.1) (5.7) (4.9) 0.6 15.1 33.0 47.8 58.1 64.3 69.4
Tax - - - - - - (9.0) (13.4) (16.3) (18.0) (19.4)
Other 0.0 - - - - - - - - - -
Net Profit After Tax (1.6) (6.1) (5.7) (4.9) 0.6 15.1 24.0 34.4 41.8 46.3 50.0
Cash Flow Statement (NZ$m)
Opening Cash 0.3 2.7 2.1 (3.4) (8.5) (8.6) 5.2 28.0 61.4 102.4 148.0
Cash Received 0.2 3.4 9.6 19.9 38.1 61.3 81.4 94.9 102.0 105.3 106.7
Cash Paid (1.5) (8.9) (14.1) (23.4) (36.2) (45.0) (47.5) (47.0) (45.2) (44.2) (42.6)
Income Tax - - - - - - (9.0) (13.4) (16.3) (18.0) (19.4)
Cash from Operations (1.3) (5.5) (4.5) (3.5) 1.9 16.3 24.9 34.5 40.5 43.1 44.7
Interest Received - 0.1 0.1 - - - 0.3 1.4 3.1 5.1 7.4
Capitalised Dev Costs (0.6) (1.2) (1.0) (1.4) (1.9) (2.3) (2.3) (2.3) (2.4) (2.5) (2.6)
Plant & Equipment (0.1) (0.2) (0.2) (0.2) (0.2) (0.2) (0.2) (0.2) (0.2) (0.2) (0.2)
Purchase of RTR - (4.0) - - - - - - - - -
Other 0.0 (0.2) - - - - - - - - -
Cash from Investing (0.7) (5.5) (1.0) (1.5) (2.0) (2.4) (2.2) (1.1) 0.5 2.5 4.7
Share Capital 4.4 10.4 - - - - - - - - -
Cash from Financing 4.4 10.4 - - - - - - - - -
Net Cash flow 2.5 (0.6) (5.5) (5.0) (0.1) 13.8 22.8 33.4 41.0 45.6 49.4
Closing Cash 2.7 2.1 (3.4) (8.5) (8.6) 5.2 28.0 61.4 102.4 148.0 197.4
Balance Sheet ($m)
Cash 2.7 2.2 (3.4) (8.4) (8.5) 5.3 28.1 61.5 102.5 148.0 197.4
Receivables 0.2 1.6 1.8 2.1 2.8 3.4 3.9 4.1 4.3 4.3 4.4
Intangible Assets 0.8 6.3 6.2 6.5 7.2 8.1 8.8 9.4 10.1 10.7 11.2
Plant & Equipment 0.1 0.3 0.3 0.3 0.3 0.3 0.3 0.3 0.3 0.3 0.3
Total Assets 3.8 10.4 4.9 0.5 1.7 17.0 41.0 75.4 117.1 163.4 213.3
Payables 0.4 1.9 2.1 2.6 3.2 3.4 3.3 3.3 3.2 3.2 3.1
Other 3.7 0.1 0.1 0.1 0.1 0.1 0.1 0.1 0.1 0.1 0.1
Total Liabilities 4.0 2.0 2.3 2.7 3.3 3.5 3.5 3.4 3.3 3.3 3.2
Net Assets (0.2) 8.3 2.6 (2.2) (1.6) 13.5 37.6 72.0 113.8 160.1 210.0
Share Capital 1.9 16.4 16.4 16.4 16.4 16.4 16.4 16.4 16.4 16.4 16.4
Accumulated Losses (2.2) (8.1) (13.7) (18.6) (18.0) (2.9) 21.2 55.6 97.4 143.7 193.6
Total Equity (0.2) 8.3 2.6 (2.2) (1.6) 13.5 37.6 72.0 113.8 160.1 210.0
Key Metrics
EBITDA Margin (%) (459%) (118%) (46%) (18%) 5% 27% 42% 51% 56% 58% 60%
NPAT Margin (%) (489%) (136%) (58%) (24%) 2% 24% 29% 36% 41% 44% 47%
Church Numbers 158 900 2,711 6,002 10,847 16,105 20,162 22,524 23,674 24,184 24,402
Avg. MoM (%) NA 16% 10% 7% 5% 3% 2% 1% 0% 0% 0%
Annual Growth (%) NA 470% 201% 121% 81% 48% 25% 12% 5% 2% 1%
ARPM ($) 175 275 300 325 350 350 350 350 350 350 350
CTS/Church ($) (500) (375) (125) (115) (110) (110) (105) (105) (100) (100) (100)
CAC Months of ARPM 9 12 11 11 11 10 10 11 15 20 20
ACMR ($m) 0 3 10 23 46 68 85 95 99 102 102

CLARE CAPITAL – PUSHPAY RESEARCH REPORT – FEBRUARY 2015
27 | www.clarecapital.co.nz l +6444985104 l Level 18, 125 The Terrace, PO Box 10269, Wellington 6143, New Zealand
Appendix 2 – Financial Summary – Low Scenario (7.5% Market Share) Year End 31 March 2014A 2015E 2016F 2017F 2018F 2019F 2020F 2021F 2022F 2023F 2024F
Income Statement (NZ$m)
Revenue 0.3 4.5 8.7 15.0 23.9 32.4 37.9 40.9 42.3 42.9 43.1
Cost to Serve (CTS) (0.5) (3.6) (4.2) (6.1) (8.6) (11.1) (12.4) (13.4) (13.2) (13.4) (13.5)
Cost to Acquire (CAC) (0.3) (2.2) (3.7) (6.2) (7.6) (5.8) (3.6) (2.2) (1.6) (1.3) (0.9)
Research & Dev. (0.3) (1.0) (1.0) (1.0) (1.1) (1.2) (1.2) (1.2) (1.2) (1.2) (1.2)
Administration (0.8) (3.0) (2.9) (2.9) (2.9) (3.0) (3.0) (3.0) (3.0) (3.0) (3.0)
EBITDA (1.5) (5.3) (3.0) (1.2) 3.7 11.3 17.6 21.1 23.2 23.9 24.5
Dep. & Amortisation (0.1) (0.9) (1.3) (1.2) (1.2) (1.2) (1.3) (1.3) (1.3) (1.3) (1.3)
EBIT (1.6) (6.2) (4.3) (2.4) 2.5 10.0 16.3 19.9 21.9 22.6 23.1
Interest - 0.1 0.1 - - - 0.4 1.0 1.7 2.6 3.5
Net Profit Before Tax (1.6) (6.1) (4.2) (2.4) 2.5 10.0 16.7 20.8 23.6 25.2 26.6
Tax - - - - - - (4.6) (5.8) (6.6) (7.0) (7.4)
Other 0.0 - - - - - - - - - -
Net Profit After Tax (1.6) (6.1) (4.2) (2.4) 2.5 10.0 12.1 15.0 17.0 18.1 19.1
Cash Flow Statement (NZ$m)
Opening Cash 0.3 2.7 2.1 (2.0) (4.4) (2.1) 7.6 19.4 34.2 51.1 69.2
Cash Received 0.2 3.4 8.6 14.8 23.7 32.2 37.8 40.9 42.2 42.8 43.1
Cash Paid (1.5) (8.9) (11.7) (16.0) (20.1) (21.2) (20.3) (19.8) (19.1) (18.9) (18.7)
Income Tax - - - - - - (4.6) (5.8) (6.6) (7.0) (7.4)
Cash from Operations (1.3) (5.5) (3.1) (1.2) 3.5 11.1 12.8 15.2 16.5 16.9 17.0
Interest Received - 0.1 0.1 - - - 0.4 1.0 1.7 2.6 3.5
Capitalised Dev Costs (0.6) (1.2) (1.0) (1.0) (1.1) (1.2) (1.2) (1.2) (1.2) (1.2) (1.2)
Plant & Equipment (0.1) (0.2) (0.2) (0.2) (0.2) (0.2) (0.2) (0.2) (0.2) (0.2) (0.2)
Purchase of RTR - (4.0) - - - - - - - - -
Other 0.0 (0.2) - - - - - - - - -
Cash from Investing (0.7) (5.5) (1.0) (1.1) (1.3) (1.4) (1.0) (0.4) 0.3 1.2 2.1
Share Capital 4.4 10.4 - - - - - - - - -
Cash from Financing 4.4 10.4 - - - - - - - - -
Net Cash flow 2.5 (0.6) (4.1) (2.4) 2.3 9.7 11.8 14.8 16.9 18.0 19.1
Closing Cash 2.7 2.1 (2.0) (4.4) (2.1) 7.6 19.4 34.2 51.1 69.2 88.3
Balance Sheet (NZ$m)
Cash 2.7 2.2 (1.9) (4.3) (2.0) 7.7 19.5 34.3 51.2 69.2 88.3
Receivables 0.2 1.6 1.7 1.9 2.2 2.4 2.5 2.5 2.6 2.6 2.6
Intangible Assets 0.8 6.3 6.2 6.1 6.1 6.3 6.4 6.5 6.5 6.6 6.6
Plant & Equipment 0.1 0.3 0.3 0.3 0.3 0.3 0.3 0.3 0.3 0.3 0.3
Total Assets 3.8 10.4 6.2 4.0 6.6 16.6 28.6 43.6 60.6 78.7 97.8
Payables 0.4 1.9 1.9 2.1 2.3 2.2 2.2 2.2 2.2 2.2 2.1
Other 3.7 0.1 0.1 0.1 0.1 0.1 0.1 0.1 0.1 0.1 0.1
Total Liabilities 4.0 2.0 2.1 2.3 2.4 2.4 2.3 2.3 2.3 2.3 2.3
Net Assets (0.2) 8.3 4.2 1.7 4.2 14.2 26.3 41.3 58.3 76.4 95.6
Share Capital 1.9 16.4 16.4 16.4 16.4 16.4 16.4 16.4 16.4 16.4 16.4
Accumulated Losses (2.2) (8.1) (12.2) (14.7) (12.2) (2.2) 9.9 24.9 41.9 60.0 79.2
Total Equity (0.2) 8.3 4.2 1.7 4.2 14.2 26.3 41.3 58.3 76.4 95.6
Key Metrics
EBITDA Margin (%) (459%) (118%) (35%) (8%) 15% 35% 46% 52% 55% 56% 57%
NPAT Margin (%) (489%) (136%) (48%) (16%) 10% 31% 32% 37% 40% 42% 44%
Church Numbers 158 900 2,054 3,811 5,800 7,403 8,364 8,839 9,052 9,144 9,182
Avg. MoM (%) NA 16% 7% 5% 4% 2% 1% 0% 0% 0% 0%
Annual Growth (%) NA 470% 128% 86% 52% 28% 13% 6% 2% 1% 0%
ARPM ($) 175 275 300 325 350 350 350 350 350 350 350
CTS/Church ($) (500) (375) (125) (115) (110) (110) (105) (105) (100) (100) (100)
CAC Months of ARPM 9 12 11 11 11 10 10 11 15 20 20
ACMR ($m) 0 3 7 15 24 31 35 37 38 38 39

CLARE CAPITAL – PUSHPAY RESEARCH REPORT – FEBRUARY 2015
28 | www.clarecapital.co.nz l +6444985104 l Level 18, 125 The Terrace, PO Box 10269, Wellington 6143, New Zealand
Appendix 3 – Financial Summary – Lower Scenario (10% Market Share) Year End 31 March 2014A 2015E 2016F 2017F 2018F 2019F 2020F 2021F 2022F 2023F 2024F
Income Statement (NZ$m)
Revenue 0.3 4.5 9.0 16.2 27.4 39.1 47.4 52.2 54.4 55.4 55.9
Cost to Serve (CTS) (0.5) (3.6) (4.3) (6.6) (9.8) (13.2) (15.3) (16.8) (16.7) (17.0) (17.1)
Cost to Acquire (CAC) (0.3) (2.2) (4.2) (7.5) (10.1) (8.5) (5.7) (3.5) (2.5) (1.9) (1.3)
Research & Dev. (0.3) (1.0) (1.0) (1.1) (1.3) (1.5) (1.5) (1.5) (1.5) (1.5) (1.5)
Administration (0.8) (3.0) (2.9) (2.9) (2.9) (3.0) (3.0) (3.2) (3.2) (3.2) (3.2)
EBITDA (1.5) (5.3) (3.4) (1.8) 3.4 12.9 21.9 27.4 30.6 31.9 32.8
Dep. & Amortisation (0.1) (0.9) (1.3) (1.2) (1.2) (1.3) (1.4) (1.4) (1.4) (1.5) (1.5)
EBIT (1.6) (6.2) (4.6) (3.0) 2.1 11.6 20.6 25.9 29.1 30.4 31.3
Interest - 0.1 0.1 - - - 0.4 1.1 2.1 3.2 4.4
Net Profit Before Tax (1.6) (6.1) (4.5) (3.0) 2.1 11.6 20.9 27.0 31.2 33.6 35.7
Tax - - - - - (0.0) (5.9) (7.6) (8.7) (9.4) (10.0)
Other 0.0 - - - - - - - - - -
Net Profit After Tax (1.6) (6.1) (4.5) (3.0) 2.1 11.6 15.1 19.5 22.5 24.2 25.7
Cash Flow Statement (NZ$m)
Opening Cash 0.3 2.7 2.1 (2.3) (5.3) (3.5) 7.5 22.1 41.2 63.4 87.4
Cash Received 0.2 3.4 8.8 16.0 27.1 38.8 47.2 52.1 54.4 55.4 55.9
Cash Paid (1.5) (8.9) (12.2) (17.8) (23.8) (26.2) (25.5) (24.9) (23.9) (23.6) (23.1)
Income Tax - - - - - (0.0) (5.9) (7.6) (8.7) (9.4) (10.0)
Cash from Operations (1.3) (5.5) (3.4) (1.8) 3.2 12.6 15.8 19.7 21.8 22.5 22.8
Interest Received - 0.1 0.1 - - - 0.4 1.1 2.1 3.2 4.4
Capitalised Dev Costs (0.6) (1.2) (1.0) (1.1) (1.3) (1.5) (1.5) (1.5) (1.5) (1.5) (1.5)
Plant & Equipment (0.1) (0.2) (0.2) (0.2) (0.2) (0.2) (0.2) (0.2) (0.2) (0.2) (0.2)
Purchase of RTR - (4.0) - - - - - - - - -
Other 0.0 (0.2) - - - - - - - - -
Cash from Investing (0.7) (5.5) (1.0) (1.2) (1.5) (1.6) (1.2) (0.5) 0.4 1.6 2.8
Share Capital 4.4 10.4 - - - - - - - - -
Cash from Financing 4.4 10.4 - - - - - - - - -
Net Cash flow 2.5 (0.6) (4.4) (3.0) 1.8 11.0 14.6 19.1 22.2 24.0 25.5
Closing Cash 2.7 2.1 (2.3) (5.3) (3.5) 7.5 22.1 41.2 63.4 87.4 113.0
Balance Sheet (NZ$m)
Cash 2.7 2.2 (2.2) (5.2) (3.4) 7.6 22.1 41.3 63.5 87.5 113.0
Receivables 0.2 1.6 1.7 2.0 2.3 2.6 2.8 2.9 2.9 2.9 2.9
Intangible Assets 0.8 6.3 6.2 6.2 6.4 6.7 6.9 7.1 7.3 7.5 7.6
Plant & Equipment 0.1 0.3 0.3 0.3 0.3 0.3 0.3 0.3 0.3 0.3 0.3
Total Assets 3.8 10.4 5.9 3.2 5.5 17.1 32.1 51.6 74.0 98.2 123.8
Payables 0.4 1.9 2.0 2.3 2.5 2.5 2.4 2.4 2.3 2.3 2.3
Other 3.7 0.1 0.1 0.1 0.1 0.1 0.1 0.1 0.1 0.1 0.1
Total Liabilities 4.0 2.0 2.1 2.4 2.6 2.6 2.5 2.5 2.5 2.5 2.5
Net Assets (0.2) 8.3 3.8 0.8 2.9 14.5 29.6 49.1 71.6 95.7 121.4
Share Capital 1.9 16.4 16.4 16.4 16.4 16.4 16.4 16.4 16.4 16.4 16.4
Accumulated Losses (2.2) (8.1) (12.6) (15.6) (13.5) (1.9) 13.2 32.7 55.2 79.3 105.0
Total Equity (0.2) 8.3 3.8 0.8 2.9 14.5 29.6 49.1 71.6 95.7 121.4
Key Metrics
EBITDA Margin (%) (459%) (118%) (38%) (11%) 12% 33% 46% 52% 56% 57% 59%
NPAT Margin (%) (489%) (136%) (50%) (19%) 8% 30% 32% 37% 41% 44% 46%
Church Numbers 158 900 2,205 4,333 6,983 9,336 10,859 11,648 12,009 12,165 12,232
Avg. MoM (%) NA 16% 8% 6% 4% 2% 1% 1% 0% 0% 0%
Annual Growth (%) NA 470% 145% 97% 61% 34% 16% 7% 3% 1% 1%
ARPM ($) 175 275 300 325 350 350 350 350 350 350 350
CTS/Church ($) (500) (375) (125) (115) (110) (110) (105) (105) (100) (100) (100)
CAC Months of ARPM 9 12 11 11 11 10 10 11 15 20 20
ACMR ($m) 0 3 8 17 29 39 46 49 50 51 51

CLARE CAPITAL – PUSHPAY RESEARCH REPORT – FEBRUARY 2015
29 | www.clarecapital.co.nz l +6444985104 l Level 18, 125 The Terrace, PO Box 10269, Wellington 6143, New Zealand
Appendix 4 – Financial Summary – Upper Scenario (25% Market Share) Year End 31 March 2014A 2015E 2016F 2017F 2018F 2019F 2020F 2021F 2022F 2023F 2024F
Income Statement (NZ$m)
Revenue 0.3 4.5 10.2 22.1 43.8 72.1 98.0 115.9 125.6 130.1 132.1
Cost to Serve (CTS) (0.5) (3.6) (4.8) (8.7) (15.0) (23.6) (30.4) (35.9) (37.0) (38.3) (38.9)
Cost to Acquire (CAC) (0.3) (2.2) (6.6) (13.3) (22.0) (23.8) (19.6) (13.5) (10.0) (7.1) (4.3)
Research & Dev. (0.3) (1.0) (1.0) (1.5) (2.1) (2.6) (2.6) (2.8) (3.0) (3.1) (3.2)
Administration (0.8) (3.0) (2.9) (3.0) (3.4) (4.2) (5.5) (6.0) (6.0) (6.0) (6.0)
EBITDA (1.5) (5.3) (5.1) (4.5) 1.1 17.9 39.8 57.7 69.5 75.4 79.7
Dep. & Amortisation (0.1) (0.9) (1.3) (1.3) (1.4) (1.6) (1.8) (2.0) (2.2) (2.4) (2.6)
EBIT (1.6) (6.2) (6.3) (5.7) (0.3) 16.3 37.9 55.7 67.3 73.1 77.1
Interest - 0.1 0.1 - - - 0.2 1.5 3.5 6.0 8.8
Net Profit Before Tax (1.6) (6.1) (6.2) (5.7) (0.3) 16.3 38.1 57.2 70.8 79.0 85.9
Tax - - - - - - (10.1) (16.0) (19.8) (22.1) (24.0)
Other 0.0 - - - - - - - - - -
Net Profit After Tax (1.6) (6.1) (6.2) (5.7) (0.3) 16.3 28.0 41.2 51.0 56.9 61.8
Cash Flow Statement (NZ$m)
Opening Cash 0.3 2.7 2.1 (4.0) (9.9) (11.1) 3.5 30.0 69.8 119.5 175.3
Cash Received 0.2 3.4 10.0 21.6 43.0 71.4 97.3 115.5 125.4 130.0 132.1
Cash Paid (1.5) (8.9) (15.0) (25.9) (41.9) (53.9) (58.2) (58.3) (56.2) (54.7) (52.5)
Income Tax - - - - - - (10.1) (16.0) (19.8) (22.1) (24.0)
Cash from Operations (1.3) (5.5) (5.0) (4.3) 1.1 17.5 29.0 41.2 49.4 53.2 55.5
Interest Received - 0.1 0.1 - - - 0.2 1.5 3.5 6.0 8.8
Capitalised Dev Costs (0.6) (1.2) (1.0) (1.5) (2.1) (2.6) (2.6) (2.8) (3.0) (3.1) (3.2)
Plant & Equipment (0.1) (0.2) (0.2) (0.2) (0.2) (0.2) (0.2) (0.2) (0.2) (0.2) (0.2)
Purchase of RTR - (4.0) - - - - - - - - -
Other 0.0 (0.2) - - - - - - - - -
Cash from Investing (0.7) (5.5) (1.1) (1.6) (2.3) (2.8) (2.6) (1.4) 0.3 2.7 5.4
Share Capital 4.4 10.4 - - - - - - - - -
Cash from Financing 4.4 10.4 - - - - - - - - -
Net Cash flow 2.5 (0.6) (6.1) (5.9) (1.2) 14.7 26.4 39.8 49.7 55.9 61.0
Closing Cash 2.7 2.1 (4.0) (9.9) (11.1) 3.5 30.0 69.8 119.5 175.3 236.3
Balance Sheet (NZ$m)
Cash 2.7 2.2 (3.9) (9.9) (11.1) 3.6 30.0 69.8 119.5 175.4 236.4
Receivables 0.2 1.6 1.8 2.2 3.0 3.7 4.4 4.8 4.9 5.0 5.1
Intangible Assets 0.8 6.3 6.2 6.6 7.5 8.7 9.7 10.6 11.5 12.4 13.2
Plant & Equipment 0.1 0.3 0.3 0.3 0.3 0.3 0.3 0.3 0.3 0.3 0.3
Total Assets 3.8 10.4 4.4 (0.7) (0.3) 16.3 44.3 85.5 136.3 193.2 255.0
Payables 0.4 1.9 2.2 2.8 3.5 3.8 3.8 3.7 3.6 3.6 3.5
Other 3.7 0.1 0.1 0.1 0.1 0.1 0.1 0.1 0.1 0.1 0.1
Total Liabilities 4.0 2.0 2.3 2.9 3.6 3.9 3.9 3.9 3.8 3.7 3.7
Net Assets (0.2) 8.3 2.1 (3.6) (3.9) 12.4 40.4 81.6 132.6 189.5 251.3
Share Capital 1.9 16.4 16.4 16.4 16.4 16.4 16.4 16.4 16.4 16.4 16.4
Accumulated Losses (2.2) (8.1) (14.3) (20.0) (20.3) (4.0) 24.0 65.2 116.2 173.1 234.9
Total Equity (0.2) 8.3 2.1 (3.6) (3.9) 12.4 40.4 81.6 132.6 189.5 251.3
Key Metrics
EBITDA Margin (%) (459%) (118%) (50%) (20%) 3% 25% 41% 50% 55% 58% 60%
NPAT Margin (%) (489%) (136%) (61%) (26%) (1%) 23% 29% 36% 41% 44% 47%
Church Numbers 158 900 2,942 6,743 12,560 19,195 24,578 27,827 29,441 30,166 30,475
Avg. MoM (%) NA 16% 10% 7% 5% 4% 2% 1% 0% 0% 0%
Annual Growth (%) NA 470% 227% 129% 86% 53% 28% 13% 6% 2% 1%
ARPM ($) 175 275 300 325 350 350 350 350 350 350 350
CTS/Church ($) (500) (375) (125) (115) (110) (110) (105) (105) (100) (100) (100)
CAC Months of ARPM 9 12 11 11 11 10 10 11 15 20 20
ACMR ($m) 0 3 11 26 53 81 103 117 124 127 128

CLARE CAPITAL – PUSHPAY RESEARCH REPORT – FEBRUARY 2015
30 | www.clarecapital.co.nz l +6444985104 l Level 18, 125 The Terrace, PO Box 10269, Wellington 6143, New Zealand
Disclosures and Disclaimers Clare Capital Limited (Clare Capital) has been commissioned by Pushpay to complete and release this report to the market. This
research is based on current public information that we consider reliable, be we do not represent it is accurate or complete, and it
should not be relied on as such. Clare Capital does and seeks to do business with Pushpay. As a result, investors should be aware of
the potential conflict of interest that could affect the objectivity of this report. Investors should consider this report as only a single
factor in making any decisions about Pushpay.
The information, analysis and views in this report are for class advice purposes only and do not constitute personalised advice
(whether of an investment, legal, tax, accounting or other nature) to any person, and may not be suitable for all investors. Before
making an investment decision on the basis of the information, analysis and views expressed in this report, investors should consider
whether the information, views and analysis are appropriate in light of their particular investment needs, objectives and financial
circumstances. We recommend that investors should seek advice from their usual financial advisor before taking any action.
This report has been prepared in good faith based on information obtained from sources believed to be accurate, reliable and
complete as at the date of publication. However, that information has not been independently verified or investigated by Clare
Capital. Clare Capital does not, and cannot, make any representations or warranty (express or implied) that the information is
accurate, complete or current, and Clare Capital excludes and disclaims (to the full extent permitted by law) any liability or
responsibility for any loss which may be incurred by any person as a result of that information, including any loss of profit or any
other damage, direct or consequential.
This report is intended for distribution in New Zealand and in other jurisdictions where, under relevant law, it may be lawfully
distributed. This report is not intended for distribution to any person in any jurisdiction where doing so would constitute a breach of
any relevant laws or regulations.