pushrod operation
TRANSCRIPT
8/6/2019 Pushrod Operation
http://slidepdf.com/reader/full/pushrod-operation 1/1148
SPECIAL INVESTIGATION

8/6/2019 Pushrod Operation
http://slidepdf.com/reader/full/pushrod-operation 2/11
THE FUNDAMENTALS
When one opens up the program for ‘cam design and
manufacture’ in the 4stHEAD software [1] the user is faced
with the following quotation from the writers of this
computer package. It is as follows: “There is no such thing
as cam design, there is only valve lift profile design which
requires the creation of a cam and follower mechanism to
reliably provide this designed valve lift profile.”
In Part One of this article in Race Engine Technology [2],
we described the creation of valve lift profiles. In Part Two,
we described the “creation of a cam and follower
mechanism to reliably provide this designed valve lift
profile” and in the process used a relatively simple dynamic
analysis of the mechanism to compute the Hertz stresses
and oil film characteristics at the cam and follower interface
[3]. The analytic technique employed there was not
sufficiently detailed as to ensure that the phrase
‘reliably provide this designed valve lift profile’
was completely satisfied.
Due to the sheer extent of this particular subject area it
was not possible to cover it properly in any meaningful way
in a single article in one issue of Race Engine Technology, as
the reader was initially promised by the authors. So we split
it into two parts, Part 3A and Part 3B. In Part 3A, we
examined the valvetrain dynamics of the relatively simple
case of bucket tappets, the most common of direct acting
cam follower mechanisms [4]. Here, in this final article inPart 3B, we look in detail at the most difficult of all dynamic
cases, the pushrod mechanism with particular reference to
the NASCAR engine.
Hopefully, we have now fulfilled our charter to inform
the reader how to ‘reliably provide this designed
valve lift profile’.
THE DESIGN EXEMPLAR
The pushrod mechanism in the NASCAR Nextel Cup V8
engine is used as the design example. The Cup engine, as
almost all readers will know, is a fascinating mix of the most
ancient and the most up-to-date engine technology.
Yesterday’s technology of pushrod followers, fuelling by a
carburettor and ignition by a brainless distributor are
mandated by regulation. However, there is nothing ancient
in the technology within a near 5.9 litre V8 with a bore of
some 106 mm and a stroke of some 83 mm which can
produce some 850 hp at 9500 rpm or higher!
The mean piston speed at 9500 rpm is 26.3 m/s, which is
right up there with the best of today’s Formula One or
MotoGP engines. Each NASCAR cylinder has a swept
volume of some 733 cm3 and breathes through a mandated
two-valve layout, which cylinder is more than twice the
individual cylinder swept volume in a Formula One engine
and thrice that of a typical MotoGP unit.
49
VALVETRAIN DESIGN PART 3B
This is ‘part B’ of the thirdsection of our insight into
valvetrain design. The thirdsection looks at valvetraindynamics and this part of itinvestigates valvetrain dynamicsfor a Pushrod Follower system.
As ever our guides are Prof.
Gordon Blair, CBE, FREng of Prof. Blair & Associates, CharlesD. McCartan, MEng, PhD of Queen’s University Belfast andHans Hermann of HansHermann Engineering
PushrodOperation

8/6/2019 Pushrod Operation
http://slidepdf.com/reader/full/pushrod-operation 3/11
SPECIAL INVESTIGATION
50
Fig.3 Input data requirements for the pushrod geometry.
Fig.4 A modified wedge NASCAR combustion chamber.
Fig.1 Movie snapshot of the NASCAR pushrod follower system.
Fig.2 Close-up of the cam to tappet contact.
THE PUSHROD FOLLOWER MECHANISM
In Fig.1 is shown a snapshot from the movie in the ‘cam
manufacture’ program of a pushrod mechanism in a NASCAR
engine when the valve lift profile is Design A. Design A willbe described below in detail. In Fig.2 is a close-up of the cam
and tappet contact from that same movie, but with Design E
as the valve lift profile and it too will be described below.
The geometry of the actual mechanism for one of the valves
is shown in Fig.3 and the cylinder head into which they fit is
illustrated in Fig.4. When all of this geometry and the two
valve lift profiles are inserted into a single program, as in
Fig.5, the relative motion of the valves and the piston can be
observed and their proximity to each other and to that piston
can be computed. Thus can the inter-valve clashing and
piston cut-out dimensions can be determined. Clearly, this
same basic geometry must also be numerically available in
order to conduct an analysis of the dynamics of the
valvetrain motion.
Within the numeric data shown in Fig.3, and graphically in
Figs.1-2, are encapsulated the ‘NASCAR rules’ for the flat
cam tappet. It must be 0.875 inch diameter (22.225 mm) and
it must be ‘flat’ to within a specified tolerance which equates
to a radius (Rcf) of some 1350 mm. This is actually computed
and drawn as such in Fig.2 but the radius is so large as not
to show up clearly even on the magnified graphics of this
cam to tappet contact.
THE VALVE LIFT PROFILES
In earlier articles [2-4] we described the creation of valve lift
profiles and the manufacture of the cams to work with all
types of cam follower mechanisms. Somewhat didactically,
we showed a valve lift profile as Design A and decreed it to
be unsuitable to work with a pushrod follower. Similarly and
equally didactically we showed a Design E and said that it
would work satisfactorily with a pushrod follower. Here, we
will examine these contentions closely and either prove the
point or be forced to eat ‘humble pie’.
In Fig.5, with our demonstration NASCAR engine working
to scale, the intake valve is actually 53 mm diameter which,
with an inner valve seat diameter of some 48 mm and using
a lift ratio of 40%, yields a maximum valve lift of 19.26
mm. Setting at either end an acceleration ramp of
magnitude 0.26 mm, and decreeing a valve lift duration of
180 cam degrees above that ramp, this provides the basic
specification of all of the valve lift profiles used within this
article. A ‘hot valve lash’ clearance of 0.23 mm is then
assigned to all calculations within the valvetrain dynamic
analyses so that the cam tappet indexes the cam just

8/6/2019 Pushrod Operation
http://slidepdf.com/reader/full/pushrod-operation 4/11
VALVETRAIN DESIGN PART 3B
Fig.8 The valve lift for Design A and Design E.
Fig.9 The valve acceleration for Design A and Design E.
Fig.5 Movie snapshot of NASCAR valve and piston motion.
Fig.6 Period durations for valve lift profile design.
51
before the end of the ramp.
The upshot of the valve lift profile design process for
Design A is shown in Fig.6. You will observe that the same
attention to detail in the smoothing of the profile, as
emphasised to the point of pedantry in a previous article
[2], is still maintained here.
In Fig.6 the periods assigned to the various segments of the
design process are shown; they are I (ramp), I1 (positive
acceleration), I2 (transition acceleration) and I3 (negative
acceleration). The numeric values for all valve lift profiles
are shown in Fig.7. There are some common data numbers
not listed. The ramp period I is 15 deg. The transition
acceleration I2 for Design A is 10 deg but for all others, E
through H2, it is 7 deg.
THE VALVE LIFT PROFILES FOR DESIGN A AND DESIGN E
The primary focus in this initial part of the article is on the
valvetrain dynamics of our ‘supposedly mythical’ NASCAR
engine when using valve lift profile Design A or Design E. In
Fig.7 The input data for valve lift profile Designs A-H.
DESIGN NAME NEGATIVE ACC. (UP RAMP) (UP RAMP) (DOWN RAMP) (DOWN RAMP) LIFT-DURATION
EXPONENT POSITIVE ACC. NEGATIVE ACC. POSITIVE ACC. NEGATIVE ACC. ENVELOPE RATIO
Z PERIOD I2 PERIOD I3 PERIOD I2 PERIOD I3 Kld
A 0.66 30 50 30 50 0.543
E 0.30 42 41 42 41 0.491
F1 0.30 44 41 40 41 0.493
F2 0.30 40 41 44 41 0.489
G1 0.45 42 41 42 41 0.494
G2 0.60 42 41 42 41 0.500
H1 0.30 40 43 40 43 0.498
H2 0.30 38 45 38 45 0.505

8/6/2019 Pushrod Operation
http://slidepdf.com/reader/full/pushrod-operation 5/11
Fig.8 is shown the valve lift profiles for Design A and Design
E, their acceleration profiles in Fig.9, their velocity profiles in
Fig.10 and their jerk profiles in Fig.11. Although the actual
valve lift here is higher at 19.26 mm, these diagrams have
exactly the same relative ‘shape’ as those presented in the
original article [2 in Figs.1-5]. So too are the numeric values
of their lift-duration envelope ratio, Kld, the measure of
‘aggression’ of a valve lift profile defined earlier [2 in Fig.2].
When the cam is manufactured within the 4stHEAD
software, using the follower geometry of Fig.3, the ensuing
cam profiles clearly demonstrate the more aggressive nature
of Design A, as seen in Fig.12.
THE MATHEMATICAL MODEL OF THE PUSHROD VALVETRAIN
In Part 3A [4] of the valvetrain investigation we discussed the
significance of simple and complex mathematical models of a
valvetrain. A realistic mathematical model of a pushrod
valvetrain is, by definition, even more complex than that of a
bucket tappet. It is shown in Fig.13. While the cam and
camshaft, valve head, valve stem and valve springs are treated
similarly as for a bucket tappet system, now the mass,
stiffness, inertia, etc., of the rocker and pushrod must be
added to the model. So too must be added the possibility of
separation and bounce of more components, such as at the
interfaces between rocker and valve stem, rocker and
pushrod, pushrod and cam tappet, and cam tappet and cam.
In Part 3A of this article we promised to comment on the
damping coefficients used for the spring-mass-damper
systems within the computation. Damping coefficients are not
dimensionless but have the units of force/velocity, or Ns/mm
in the case of the 4stHEAD software [1].
The literature on valvetrain dynamics is almost entirely
bereft of experimental data to use as input data numbers for
SPECIAL INVESTIGATION
52
Fig.12 The cam profile for Design A and Design E.
Fig.13 The mathematical model of a pushrod follower system.
Fig.10 The valve velocity for Design A and Design E.
Fig.11 The valve jerk for Design A and Design E.
A realistic mathematical model of a pushrod
valvetrain is, by definition, even more
complex than that of a bucket tappet”
“

8/6/2019 Pushrod Operation
http://slidepdf.com/reader/full/pushrod-operation 6/11
damping coefficients. We have established a collaboration
with Dr Keith McMullan at Cork Institute of Technology in
Ireland to measure and quantify many of these input data
numbers. In Cork, Dr McMullan and graduate student Mr
Michael Noonan have a high-quality motoring and video rig
from which the movie snapshot in Fig.14 of the valve springs
of a pushrod follower system is acquired.
By tracking the motion of each spring coil and comparing it
to the predictions given by the 4stHEAD software, it is
possible to derive damping coefficients for the coils of the
valve springs. Similar methods are employed for other
components such as the valve, the pushrod, etc., but
component specific rigs are also used to obtain data such as
stiffnesses, damping coefficients and natural frequencies,
when that particular component is isolated from the others.
THE VALVES AND VALVE SPRINGS FOR
THE PUSHROD VALVETRAIN
The methodology of input data creation for valves and valve
springs were discussed in Part 3A [4] and we will not repeat it
here except to say that, by definition, these intake and
exhaust titanium NASCAR valves are larger at 53 and 43 mm
diameter, heavier at 71.5 and 57.8 g, respectively, but not any
stiffer either in the stem or the head. The inner and outer
valve springs are also made with thicker wire and are larger
in outside diameter, with stiffness levels at 57 and 23 N/mm,
with outside diameters of 41 and 26 mm, each with a wire
thickness of 5.5 and 3.5 mm, with 5.5 and 7.5 coils, each
with a mass of 106 and 41 g, and with identical natural
frequencies of 441 Hz, respectively.
THE PUSHROD
The input data for the pushrod must be very detailed in terms
of its dimensions and its material to acquire the necessary
data to execute the mathematical model in Fig.13. The
relevant input data page is shown in Fig.15. Of interest here
is the computed lateral (whipping mode) stiffness of only 3%
of its axial stiffness and a lateral natural frequency of just 521
Hz. Clearly, it would be illogical to design the natural
frequency of the valve springs and the pushrod to be
identical, as a device for the encouragement of mechanical
resonance could hardly be bettered.
THE ROCKER
The input data for the rocker is equally detailed and requires
not only the geometry of Fig.3 but also its mass, inertia and
stiffness. This data can be obtained from a CAD system but it
can also be measured and the relevant input data page
describes how to do just that.
53
VALVETRAIN DESIGN PART 3B
Fig.16 Motoring dynamic valve lift for Design A.
Fig.17 Motoring dynamic valve lift for Design E.
Fig.14 Experimental work at Cork Institute of Technology.
Fig.15 Input data requirements for the pushrod.

8/6/2019 Pushrod Operation
http://slidepdf.com/reader/full/pushrod-operation 7/11
DYNAMIC ANALYSIS OF DESIGNS A AND E WHILE
MOTORING AT 9500 RPM
The dynamic analysis is conducted while theoretically
motoring the valvetrain at an engine speed of 9500 rpm, or
4750 rpm at the camshaft. Motoring a valvetrain is the
normal experimental procedure adopted by the racing
industry, and the NASCAR teams are no different. All
calculations described, and all Figures presented, below are
conducted at this camshaft rotational speed of 4750 rpm.
In Figs.16 and 17 are plotted the dynamic valve lift
characteristics for Design A and Design E together with their
static lift values for comparison. It can be seen that the
dynamic lift of Design A contains valve bounce up to 0.5 mm
at the valve closure point. Design E shows almost no
inclination to provide valve bounce at the same location; in
actual fact it does bounce but only to 0.018 mm.
That the valve bounce of Design A is unacceptable becomes
clear when examining the dynamic acceleration of the head
of the valve shown in Fig.18. The equivalent picture for
Design E is shown in Fig.19. The acceleration of the valve
head rises to 0.22 mm/deg2 whereas that for Design E is only
0.02 mm/deg2. As acceleration is linearly related to force,
that raises the force on the valve head for Design A to an
order of magnitude above that for Design E.
This can be seen in Fig.20 where the forces on the valve
head are plotted. The maximum/minimum forces for Design E
amount to +600/-700 N but for Design A that rises to +1000/-
4000 N. The valve head experiencing the Design A lift profile
is being bent or stretched with an impact force of up to 4000
N (408 kgf or 913 lbf) and on a 53 mm diameter titanium
intake valve it is most unlikely to keep doing it for very long.
Further evidence of the unsuitability of Design A with a
pushrod follower system is shown in Figs.21-23. Here are
plotted the pushrod acceleration, pushrod forces and cam
tappet forces for both Designs A and E. Although the
computation calculates this data at all locations along a
pushrod, we plot here the acceleration at its centre, and the
SPECIAL INVESTIGATION
54
Fig.20 Motoring valve head force for Designs A and E.
Fig.21 Motoring pushrod acceleration for Designs A and E.
Fig.18 Motoring valve acceleration for Design A.
Fig.19 Motoring valve acceleration for Design E.
Motoring a valvetrain
is the normal
experimental
procedure adopted
by NASCAR teams”
“

8/6/2019 Pushrod Operation
http://slidepdf.com/reader/full/pushrod-operation 8/1155
VALVETRAIN DESIGN PART 3B
force at its ‘attachment’ point to the rocker, where that force
is plotted as a ratio to that which would cause a catastrophic
buckling of the pushrod.
The violent shaking of the pushrod when actuated by Design
A can be clearly seen in Fig.21, not only at the valve closure
point but also at two other locations around maximum valve
lift. The origins of these locations can be identified in Fig.22
where the force (ratio) goes to zero twice for Design A,
whereas it does so for Design E only around valve closure.
The significance of the force at the top of the pushrod going
to zero is that it does so by separating its contact with the
rocker, thereby releasing all of the stored energy in the
pushrod to shake it at its natural frequency. We can plot the
same force data anywhere along this pushrod but it is more
informative to plot it at its cam tappet end to see if it has
similarly waltzed away into free space and at the same
junctures in the cam angle diagram!
In Fig.23 we show the cam-tappet forces and, sure enough,
the cam tappet with Design A has separated its contact from
the cam at the same intervals as the top of the pushrod with
the rocker, but for even longer periods at the cam tappet end.
Even Design E is not immune from separation of the cam
tappet from the cam. The cam-tappet forces with Design A are
some 25% higher than with Design E which means that the
Hertz stresses at the cam and tappet interface at those
junctures have been raised by the same proportion.
DYNAMIC ANALYSIS OF DESIGN A AND E WHILE
FIRING AT 9500 RPM
The effect on the valvetrain dynamics of the exposure of an
exhaust or an intake valve to the cylinder pressure was
debated earlier in Part 3A of this investigation [4]. Here we
repeat the analysis for the pushrod follower system and, to
make comparisons even more relevant, we will use exactly
the same cylinder pressure diagram [4 in Fig.25]. This is quite
logical as the brake mean effective pressure (bmep) in both
example engines are virtually identical as are the exhaust and
intake tuning behaviour.
The results for the dynamic lift of the exhaust and intake
valve for Design A are shown in Figs.24-25 and similarly for
Design E in Figs.26-27. As a pushrod system is normally
much less stiff than a bucket tappet device, the exhaust valve
opening is even further delayed. The delay on exhaust valve
opening shown in Figs.24 and 26 is 11 degrees at the
camshaft which is 22 degrees at the crankshaft whereas that
of the bucket tappet was just 4 camshaft degrees [4].
The wobbly nature of the dynamic valve lift around the
maximum valve lift for Design A is even further exaggerated
and the valve bounce at valve closure with Design A has
increased to 0.75 mm. Design E is no longer immune to
valve bounce under ‘firing’ conditions but it is contained
to just 0.07 mm.
Fig.24 Firing dynamic exhaust valve lift for Design A.
Fig.25 Firing dynamic intake valve lift for Design A.
Fig.22 Motoring pushrod force ratio for Designs A and E.
Fig.23 Motoring cam-to-tappet force for Designs A and E.

8/6/2019 Pushrod Operation
http://slidepdf.com/reader/full/pushrod-operation 9/11
The case of the intake valve under firing conditions
continues the pattern seen previously [4]. With Design A the
dynamic lift ‘wobble’ at maximum valve lift is still present but
somewhat reduced as is the valve bounce at valve closure
which is now just 0.065 mm. For Design E, the valve bounce
is identical to the motoring case at 0.02 mm.
THE DESIGN IMPLICATIONS OF THE VALVETRAIN
DYNAMIC ANALYSES
Quite irrespective of the vindication of our opinion [2] that
a valve lift profile like Design A is unsuitable for use with a
pushrod actuated valvetrain, as in this NASCAR engine
exemplar, the fundamental message to the designers of such
engines is that there is a limit to the aggression that can be
applied to the valve lift profile in such engines. Design E is
acceptable, but how much more aggressive can it be
made before it too becomes unacceptable? That is the
real design question.
The subsidiary information from the above analyses of the
firing case, perhaps even more vital, is that the ‘acceptable’
valve lift profile for an exhaust valve is not the same as for an
intake valve and the optimum profile design for either valve is
not going to be found by conducting analyses under motoring
conditions either theoretically on a computer or
experimentally with a motoring rig.
A further implication, and a major complication, concerns
the use of an engine simulation [5] by the designer to
optimise the performance characteristics of an engine. Apart
from loading in all of the geometrical and thermodynamic
data for the engine to that simulation, an extensive exercise
in itself, the valve lift characteristics for the intake and
exhaust valve(s) must also be inserted.
Clearly the only relevant data for this purpose is the actual
valve lift profile under dynamic/firing conditions at any
given engine speed otherwise the simulation cannot possibly
predict the instantaneous gas flow into, through, and out of,
the engine cylinders during the engine cycle. The static
valve lift is clearly useless for this purpose but the motoring
data is little better as a true representation of how the
valve(s) move under firing conditions. So what is the
solution to this problem?
Experimentally, one must measure the dynamic valve lift
under firing conditions at every engine speed and use that
within the engine simulation for further theoretical
optimisation of the engine; this is an almost impossible task.
Theoretically, if one uses a valvetrain dynamic analysis which
correlates well with experimental data acquired
experimentally while motoring the valvetrain, it should be
capable of being programmed to accurately predict the
dynamic valve lift under firing conditions which data can
then be exported to the engine simulation. Even so, it must
SPECIAL INVESTIGATION
56
Fig.28 Static valve acceleration diagrams for Designs E and F.
Fig.29 Motoring dynamic valve lift for Designs E and F.
Fig.26 Firing dynamic exhaust valve lift for Design E.
Fig.27 Firing dynamic intake valve lift for Design E.
8/6/2019 Pushrod Operation
http://slidepdf.com/reader/full/pushrod-operation 10/11
needs be an accurate engine simulation [5], a point we have
emphasised, nay belaboured, many times [6].
OPTIMISATION OF A VALVE LIFT PROFILE IN
A PUSHROD ENGINE
As we write above, ‘Design A has proven to be unacceptable
and Design E is acceptable, but how much more aggressive
can it be made before it too becomes unacceptable?’
As seen in Fig.7, the lift-duration envelope ratio Kld for
Design A is 0.543 while that for Design E is 0.491. That is a
gas flow time-area disadvantage for Design E of almost 11%,
which could be crudely interpreted to infer a potential 11%
reduction of torque or bmep or power accruing to its use,
compared to employing Design A.
In Fig.7, we show the data for the creation of valve lift
profile Designs G1 and G2, F1 and F2, and H1 and H2,
almost all of which marginally raise the Kld value of the
profile over that for Design E. As these latter Kld values
exhibit only marginal gains over Design E, it could be argued
that they are not worth the investigation time involved. Not
necessarily so because (a) the NASCAR designer will
cheerfully tell you that he will ‘kill’ for but a few more
horsepower, (b) the intake valve can tolerate more lift profile
aggression under firing conditions than the exhaust valve and
one of these latter designs F-H may fall into that category of
‘success’ and (c) as we never cease to be amazed at the
minute differences in valve lift profile which exhibit ‘better’
or ‘worse’ valve bounce behaviour in what is fundamentally a
highly non-linear mechanical system then one of these F-G
profiles could well prove worthy of designer-time to click that
mouse but a few times more.
In Fig.28 are the acceleration diagrams of Design E (shown
as a green line in all of these final Figures) and Design F1 and
Design F2. The objective is to vary the positive acceleration
periods I2 while retaining all other characteristics but
rendering the lift diagram to be asymmetrical by a few
degrees. The dynamic valve lifts under motoring conditions
57
VALVETRAIN DESIGN PART 3B
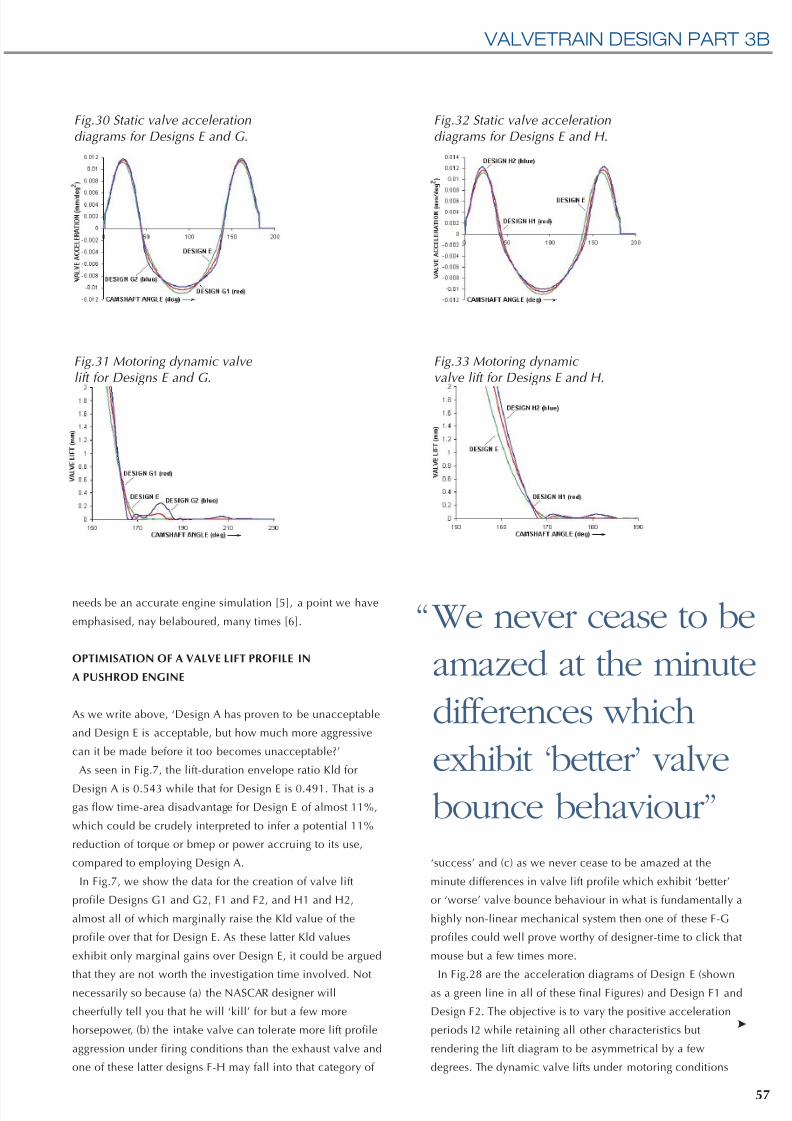
Fig.32 Static valve acceleration diagrams for Designs E and H.
Fig.33 Motoring dynamic valve lift for Designs E and H.
Fig.30 Static valve acceleration diagrams for Designs E and G.
Fig.31 Motoring dynamic valve lift for Designs E and G.
We never cease to be
amazed at the minute
differences which
exhibit ‘better’ valve
bounce behaviour”
“

8/6/2019 Pushrod Operation
http://slidepdf.com/reader/full/pushrod-operation 11/11
for the Designs E and F are shown expanded around the valve
closure period in Fig.29. Both Design F1 and F2 bounce more
than Design E, but Design F1 might have some potential for
an intake valve profile under firing conditions.
In Fig.30 are the acceleration diagrams of Design E andDesign G1 and Design G2. The objective is to retain all
other characteristics of Design E but increase the negative
acceleration exponent Z in order to increase their Kld
values. The dynamic valve lifts under motoring conditions
for the Designs E and G are shown expanded around the
valve closure period in Fig.31.
Both Design G1 and G2 bounce more than Design E,
Design G2 unacceptably in amplitude terms, but Design G1
might also have some potential as an intake valve profile
under firing conditions.
In Fig.32 are the acceleration diagrams of Design E and
Design H1 and Design H2. The objective is to retain allother characteristics of Design E but progressively decrease
the positive acceleration period I1, and correspondingly
increase the negative acceleration period I3, to increase the
Kld values for Designs H1 and H2. The dynamic valve lifts
under motoring conditions for the Designs E and H are
shown in Fig.33.
Both Design H1 and H2 bounce more than Design E,
Design H2 unacceptably if not in amplitude at least in
duration, but Design H1 might possibly make an intake valve
profile under firing conditions.
In short, our minor changes to the valve lift profile have not
produced any ‘magic’ improvement in the valve bounce
behaviour over the ‘successful’ Design E, which is an
experience not unknown to the NASCAR experimenters on
their motoring valvetrain rigs while testing a multitude of
camshafts! What it does emphasise is that a realistic
valvetrain computation that includes separation and bounce
of the components is capable of detecting the effect of even a
minor change to the input data.
Put rather more bluntly, more elaborate computation models
have been produced with valves, valve springs, rockers and
pushrods rendered in the FEM manner, and they are
admittedly very pretty to watch. However, if they cannot
incorporate component separation and bounce everywhere
and cannot incorporate cylinder pressure conditions facing
the valves, they do not constitute a design tool.
CONCLUSIONS
It is possible today to model valvetrain dynamics with some
considerable accuracy provided that the mathematical model
is sufficiently extensive. We regret that it is not possible, dueto space limitations here, to describe the effects on valvetrain
dynamics of a host of other input data variables. Needless to
add, a minor variation of the numeric value of almost every
single input data value in this non-linear system can have a
profound effect on the outcome.
We hope that the tyro has found these four articles on
valvetrain design to be educational and possibly the
experienced designer has also found them useful through the
discussion of a particular topic from a viewpoint outside that
experience. We enjoyed writing them so we can but hope
that you enjoyed reading them.
REFERENCES
[1] 4stHEAD design software, Prof. Blair and Associates,
Belfast, Northern Ireland (see
www.profblairandassociates.com).
[2] G.P. Blair, C.D. McCartan, H. Hermann, “The Right Lift”,
Race Engine Technology, Issue 009, July 2005 (see
www.racetechmag.com and also
www.profblairandassociates.com).
[3] G.P. Blair, C.D. McCartan, H. Hermann, “Making the
Right Cam”, Race Engine Technology, Issue 010, September
2005 (see www.racetechmag.com and also
www.profblairandassociates.com).
[4] G.P. Blair, C.D. McCartan, H. Hermann, “Bucket
Operation”, Race Engine Technology, Issue 011, November
2005 (see www.racetechmag.com and also
www.profblairandassociates.com).
[5] VIRTUAL ENGINES Engine Simulation Software, VIRTUAL
4-Stroke and VIRTUAL 2-Stroke, Optimum Power Technology,
Bridgeville, PA. (see www.optimum-power.com)
[6] G.P. Blair, “Design and Simulation of Four-Stroke
Engines”, Society of Automotive Engineers, 1998, SAE
reference R-186.
Such a realistic valvetrain computation is
capable of detecting the effect of evena minor change to the input data”
“
SPECIAL INVESTIGATION