putnam variable trustputnam variable trust putnam vt international growth fund important notice:...
TRANSCRIPT
Putnam Variable TrustPutnam VT International Growth Fund
IMPORTANT NOTICE: Delivery of paper fund reportsIn accordance with regulations adopted by the Securities and Exchange Commission, beginning on or after January 1, 2021, at the election of your insurance provider, you may not receive paper reports like this one in the mail from the insurance provider that offers your variable annuity contract or variable life insurance policy unless you specifically request it. Instead, they will be available on a website, and your insurance provider will notify you by mail whenever a new one is available, and provide you with a website link to access the report.
If you wish to continue to receive paper reports free of charge after January 1, 2021, please contact your insurance provider.
If you already receive these reports electronically, no action is required.
Semiannual report 6 | 30 | 19
Message from the TrusteesAugust 7, 2019
Dear Shareholder:
If there is any lesson to be learned from constantly changing financial markets, it is the importance of positioning your investment portfolio for your long-term goals. We believe that one strategy is to diversify across different asset classes and investment approaches.
We also believe your mutual fund investment offers a number of advantages, including constant monitoring by experienced investment professionals who maintain a long-term perspective. Putnam’s portfolio managers and analysts take a research-intensive approach that includes risk management strategies designed to serve you through changing conditions.
Another key strategy, in our view, is seeking the counsel of a financial advisor. For over 80 years, Putnam has recognized the importance of professional investment advice. Your financial advisor can help in many ways, including defining and planning for goals such as retirement, evaluating the level of risk appropriate for you, and reviewing your investments on a regular basis and making adjustments as necessary.
As always, your fund’s Board of Trustees remains committed to protecting the interests of Putnam shareholders like you, and we thank you for investing with Putnam.
Respectfully yours,
Robert L. ReynoldsPresident and Chief Executive OfficerPutnam Investments
Kenneth R. LeiblerChair, Board of Trustees
The views expressed in this report are exclusively those of Putnam Management and are subject to change. They are not meant as investment advice. Please note that the holdings discussed in this report may not have been held by the fund for the entire period. Portfolio composition is subject to review in accordance with the fund’s investment strategy and may vary in the future.
Consider these risks before investing: International investing involves currency, economic, and political risks. Emerging-market securities carry illiquidity and volatility risks. Investments in small and/or midsize companies increase the risk of greater price fluctuations. Growth stocks may be more susceptible to earnings disappointments, and the market may not favor growth-style investing. The value of investments in the fund’s portfolio may fall or fail to rise over extended periods of time for a variety of reasons, including general economic, political or financial market conditions, investor sentiment and market perceptions, government actions, geopolitical events or changes, and factors related to a specific issuer, geography, industry or sector. These and other factors may lead to increased volatility and reduced liquidity in the fund’s portfolio holdings. Risks associated with derivatives include increased investment exposure (which may be considered leverage) and, in the case of over-the-counter instruments, the poten-tial inability to terminate or sell derivatives positions and the potential failure of the other party to the instrument to meet its obligations. You can lose money by investing in the fund.
Putnam VT International Growth Fund 1
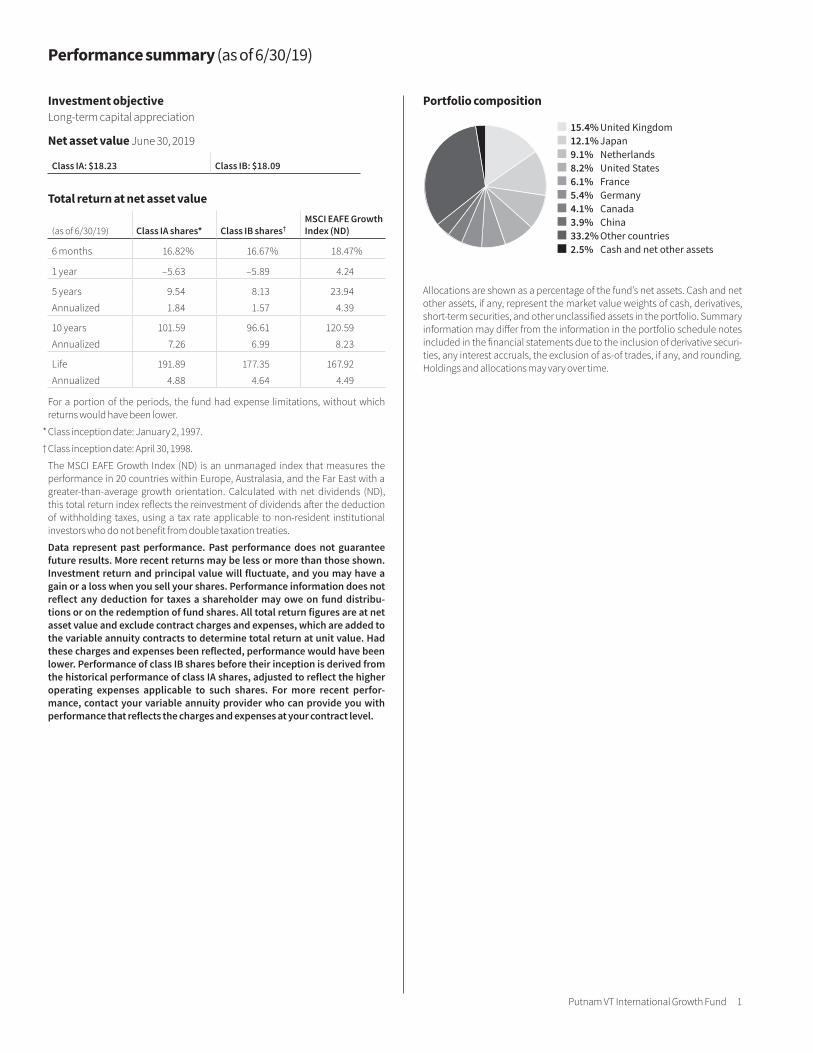
Portfolio composition
Allocations are shown as a percentage of the fund’s net assets. Cash and net other assets, if any, represent the market value weights of cash, derivatives, short-term securities, and other unclassified assets in the portfolio. Summary information may differ from the information in the portfolio schedule notes included in the financial statements due to the inclusion of derivative securi-ties, any interest accruals, the exclusion of as-of trades, if any, and rounding. Holdings and allocations may vary over time.
15.4% United Kingdom 12.1% Japan 9.1% Netherlands 8.2% United States 6.1% France 5.4% Germany 4.1% Canada 3.9% China 33.2% Other countries 2.5% Cash and net other assets
Performance summary (as of 6/30/19)
Investment objectiveLong-term capital appreciation
Net asset value June 30, 2019
Class IA: $18.23 Class IB: $18.09
Total return at net asset value
(as of 6/30/19) Class IA shares* Class IB shares†MSCI EAFE Growth Index (ND)
6 months 16.82% 16.67% 18.47%
1 year –5.63 –5.89 4.24
5 years 9.54 8.13 23.94
Annualized 1.84 1.57 4.39
10 years 101.59 96.61 120.59
Annualized 7.26 6.99 8.23
Life 191.89 177.35 167.92
Annualized 4.88 4.64 4.49
For a portion of the periods, the fund had expense limitations, without which returns would have been lower.
* Class inception date: January 2, 1997.
† Class inception date: April 30, 1998.
The MSCI EAFE Growth Index (ND) is an unmanaged index that measures the performance in 20 countries within Europe, Australasia, and the Far East with a greater-than-average growth orientation. Calculated with net dividends (ND), this total return index reflects the reinvestment of dividends after the deduction of withholding taxes, using a tax rate applicable to non-resident institutional investors who do not benefit from double taxation treaties.
Data represent past performance. Past performance does not guarantee future results. More recent returns may be less or more than those shown. Investment return and principal value will fluctuate, and you may have a gain or a loss when you sell your shares. Performance information does not reflect any deduction for taxes a shareholder may owe on fund distribu-tions or on the redemption of fund shares. All total return figures are at net asset value and exclude contract charges and expenses, which are added to the variable annuity contracts to determine total return at unit value. Had these charges and expenses been reflected, performance would have been lower. Performance of class IB shares before their inception is derived from the historical performance of class IA shares, adjusted to reflect the higher operating expenses applicable to such shares. For more recent perfor-mance, contact your variable annuity provider who can provide you with performance that reflects the charges and expenses at your contract level.
2 Putnam VT International Growth Fund
Understanding your fund’s expenses
As an investor in a variable annuity product that invests in a registered investment company, you pay ongoing expenses, such as management fees, distribution fees (12b-1 fees), and other expenses. In the most recent six-month period, your fund’s expenses were limited; had expenses not been limited, they would have been higher. Using the following informa-tion, you can estimate how these expenses affect your investment and compare them with the expenses of other funds. You may also pay one-time transaction expenses, which are not shown in this section and would result in higher total expenses. Charges and expenses at the insurance company separate account level are not reflected. For more information, see your fund’s prospectus or talk to your financial representative.
Review your fund’s expensesThe two left-hand columns of the Expenses per $1,000 table show the expenses you would have paid on a $1,000 investment in your fund from 1/1/19 to 6/30/19. They also show how much a $1,000 invest-ment would be worth at the close of the period, assuming actual returns and expenses. To estimate the ongoing expenses you paid over the period, divide your account value by $1,000, then multiply the result by the number in the first line for the class of shares you own.
Compare your fund’s expenses with those of other fundsThe two right-hand columns of the Expenses per $1,000 table show your fund’s expenses based on a $1,000 investment, assuming a hypothetical 5% annualized return. You can use this information to compare the ongoing expenses (but not transaction expenses or total costs) of investing in the fund with those of other funds. All shareholder reports of mutual funds and funds serving as variable annuity vehicles will provide this information to help you make this comparison. Please note that you cannot use this information to esti-mate your actual ending account balance and expenses paid during the period.
Expense ratiosClass IA Class IB
Net expenses for the fiscal year ended 12/31/18* 1.09% 1.34%
Total annual operating expenses for the fiscal year ended 12/31/18 1.30% 1.55%
Annualized expense ratio for the six-month period ended 6/30/19 1.09% 1.34%
Fiscal-year expense information in this table is taken from the most recent prospectus, is subject to change, and may differ from that shown for the annualized expense ratio and in the financial highlights of this report.
Expenses are shown as a percentage of average net assets.
*Reflects Putnam Management’s contractual obligation to limit certain fund expenses through 4/30/20.
Expenses per $1,000
Expenses and value for a $1,000 investment, assuming actual returns for the 6 months ended 6/30/19
Expenses and value for a $1,000 investment, assuming a hypothetical 5% annualized return for the 6 months ended 6/30/19
Class IA Class IB Class IA Class IB
Expenses paid per $1,000*† $5.86 $7.20 $5.46 $6.71
Ending value (after expenses) $1,168.20 $1,166.70 $1,019.39 $1,018.15
*Expenses for each share class are calculated using the fund’s annualized expense ratio for each class, which represents the ongoing expenses as a percentage of average net assets for the six months ended 6/30/19. The expense ratio may differ for each share class.
†Expenses based on actual returns are calculated by multiplying the expense ratio by the average account value for the period; then multiplying the result by the number of days in the period; and then dividing that result by the number of days in the year. Expenses based on a hypothetical 5% return are calculated by multi-plying the expense ratio by the average account value for the six-month period; then multiplying the result by the number of days in the six-month period; and then dividing that result by the number of days in the year.
Your fund’s managerPortfolio Manager Jeffrey B. Sacknowitz, CFA, joined Putnam in 1999 and has been in the investment industry since 1993.
Your fund’s manager also manages other accounts advised by Putnam Management or an affiliate, including retail mutual fund counterparts to the funds in Putnam Variable Trust.
Putnam VT International Growth Fund 3
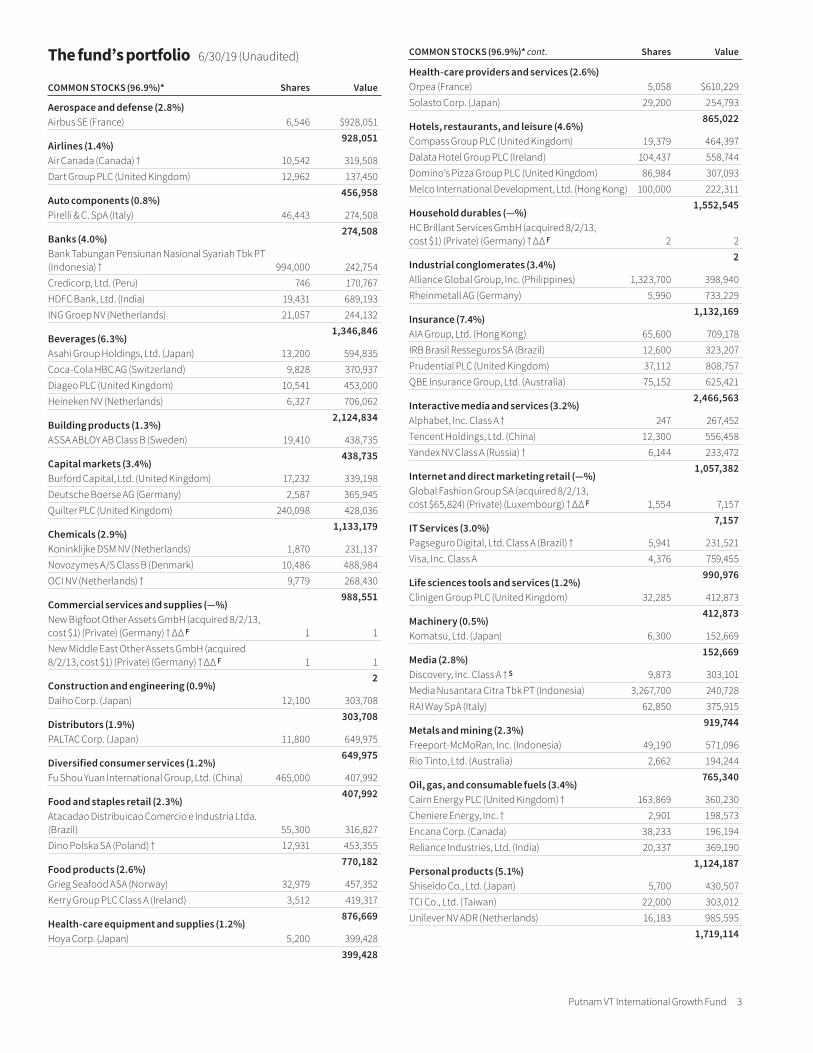
COMMON STOCKS (96.9%)* Shares Value
Aerospace and defense (2.8%)Airbus SE (France) 6,546 $928,051 928,051Airlines (1.4%)Air Canada (Canada) † 10,542 319,508Dart Group PLC (United Kingdom) 12,962 137,450 456,958Auto components (0.8%)Pirelli & C. SpA (Italy) 46,443 274,508 274,508Banks (4.0%)Bank Tabungan Pensiunan Nasional Syariah Tbk PT (Indonesia) † 994,000 242,754Credicorp, Ltd. (Peru) 746 170,767HDFC Bank, Ltd. (India) 19,431 689,193ING Groep NV (Netherlands) 21,057 244,132 1,346,846Beverages (6.3%)Asahi Group Holdings, Ltd. (Japan) 13,200 594,835Coca-Cola HBC AG (Switzerland) 9,828 370,937Diageo PLC (United Kingdom) 10,541 453,000Heineken NV (Netherlands) 6,327 706,062 2,124,834Building products (1.3%)ASSA ABLOY AB Class B (Sweden) 19,410 438,735 438,735Capital markets (3.4%)Burford Capital, Ltd. (United Kingdom) 17,232 339,198Deutsche Boerse AG (Germany) 2,587 365,945Quilter PLC (United Kingdom) 240,098 428,036 1,133,179Chemicals (2.9%)Koninklijke DSM NV (Netherlands) 1,870 231,137Novozymes A/S Class B (Denmark) 10,486 488,984OCI NV (Netherlands) † 9,779 268,430 988,551Commercial services and supplies (—%)New Bigfoot Other Assets GmbH (acquired 8/2/13, cost $1) (Private) (Germany) † ∆∆ F 1 1New Middle East Other Assets GmbH (acquired 8/2/13, cost $1) (Private) (Germany) † ∆∆ F 1 1 2Construction and engineering (0.9%)Daiho Corp. (Japan) 12,100 303,708 303,708Distributors (1.9%)PALTAC Corp. (Japan) 11,800 649,975 649,975Diversified consumer services (1.2%)Fu Shou Yuan International Group, Ltd. (China) 465,000 407,992 407,992Food and staples retail (2.3%)Atacadao Distribuicao Comercio e Industria Ltda. (Brazil) 55,300 316,827Dino Polska SA (Poland) † 12,931 453,355 770,182Food products (2.6%)Grieg Seafood ASA (Norway) 32,979 457,352Kerry Group PLC Class A (Ireland) 3,512 419,317 876,669Health-care equipment and supplies (1.2%)Hoya Corp. (Japan) 5,200 399,428 399,428
Health-care providers and services (2.6%)Orpea (France) 5,058 $610,229Solasto Corp. (Japan) 29,200 254,793 865,022Hotels, restaurants, and leisure (4.6%)Compass Group PLC (United Kingdom) 19,379 464,397Dalata Hotel Group PLC (Ireland) 104,437 558,744Domino’s Pizza Group PLC (United Kingdom) 86,984 307,093Melco International Development, Ltd. (Hong Kong) 100,000 222,311 1,552,545Household durables (—%)HC Brillant Services GmbH (acquired 8/2/13, cost $1) (Private) (Germany) † ∆∆ F 2 2 2Industrial conglomerates (3.4%)Alliance Global Group, Inc. (Philippines) 1,323,700 398,940Rheinmetall AG (Germany) 5,990 733,229 1,132,169Insurance (7.4%)AIA Group, Ltd. (Hong Kong) 65,600 709,178IRB Brasil Resseguros SA (Brazil) 12,600 323,207Prudential PLC (United Kingdom) 37,112 808,757QBE Insurance Group, Ltd. (Australia) 75,152 625,421 2,466,563Interactive media and services (3.2%)Alphabet, Inc. Class A † 247 267,452Tencent Holdings, Ltd. (China) 12,300 556,458Yandex NV Class A (Russia) † 6,144 233,472 1,057,382Internet and direct marketing retail (—%)Global Fashion Group SA (acquired 8/2/13, cost $65,824) (Private) (Luxembourg) † ∆∆ F 1,554 7,157 7,157IT Services (3.0%)Pagseguro Digital, Ltd. Class A (Brazil) † 5,941 231,521Visa, Inc. Class A 4,376 759,455 990,976Life sciences tools and services (1.2%)Clinigen Group PLC (United Kingdom) 32,285 412,873 412,873Machinery (0.5%)Komatsu, Ltd. (Japan) 6,300 152,669 152,669Media (2.8%)Discovery, Inc. Class A † S 9,873 303,101Media Nusantara Citra Tbk PT (Indonesia) 3,267,700 240,728RAI Way SpA (Italy) 62,850 375,915 919,744Metals and mining (2.3%)Freeport-McMoRan, Inc. (Indonesia) 49,190 571,096Rio Tinto, Ltd. (Australia) 2,662 194,244 765,340Oil, gas, and consumable fuels (3.4%)Cairn Energy PLC (United Kingdom) † 163,869 360,230Cheniere Energy, Inc. † 2,901 198,573Encana Corp. (Canada) 38,233 196,194Reliance Industries, Ltd. (India) 20,337 369,190 1,124,187Personal products (5.1%)Shiseido Co., Ltd. (Japan) 5,700 430,507TCI Co., Ltd. (Taiwan) 22,000 303,012Unilever NV ADR (Netherlands) 16,183 985,595 1,719,114
COMMON STOCKS (96.9%)* cont. Shares ValueThe fund’s portfolio 6/30/19 (Unaudited)
4 Putnam VT International Growth Fund
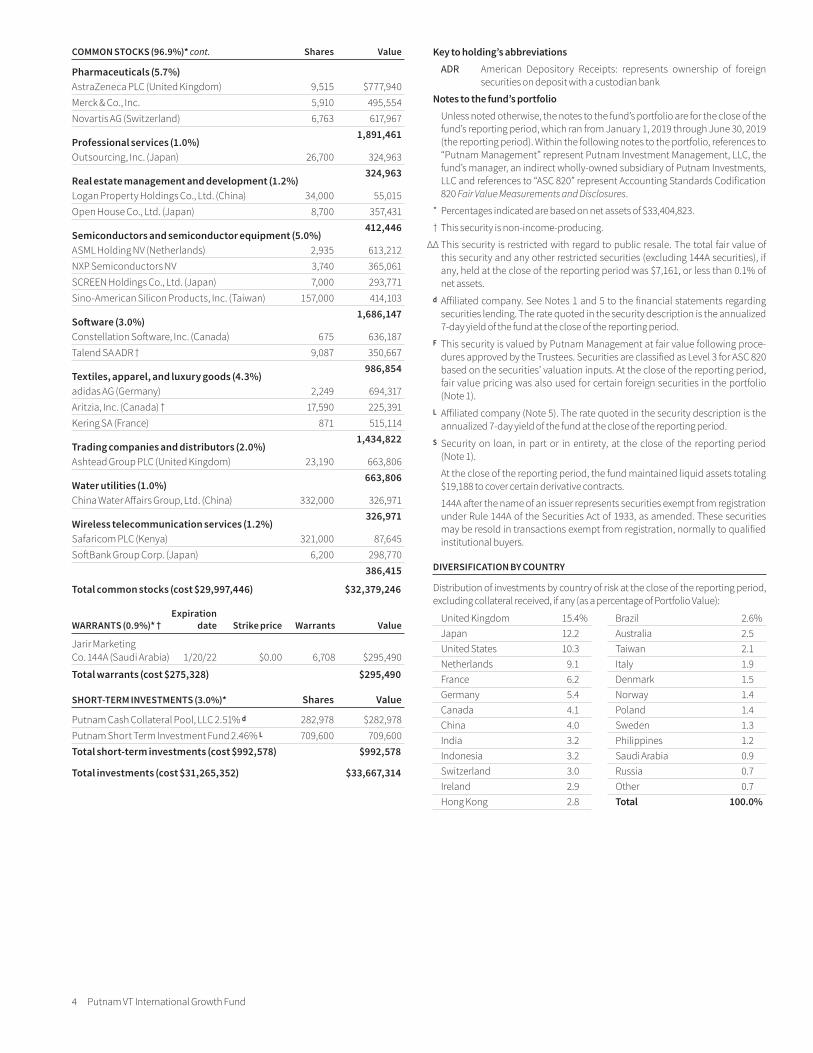
Pharmaceuticals (5.7%)AstraZeneca PLC (United Kingdom) 9,515 $777,940Merck & Co., Inc. 5,910 495,554Novartis AG (Switzerland) 6,763 617,967 1,891,461Professional services (1.0%)Outsourcing, Inc. (Japan) 26,700 324,963 324,963Real estate management and development (1.2%)Logan Property Holdings Co., Ltd. (China) 34,000 55,015Open House Co., Ltd. (Japan) 8,700 357,431 412,446Semiconductors and semiconductor equipment (5.0%)ASML Holding NV (Netherlands) 2,935 613,212NXP Semiconductors NV 3,740 365,061SCREEN Holdings Co., Ltd. (Japan) 7,000 293,771Sino-American Silicon Products, Inc. (Taiwan) 157,000 414,103 1,686,147Software (3.0%)Constellation Software, Inc. (Canada) 675 636,187Talend SA ADR † 9,087 350,667 986,854Textiles, apparel, and luxury goods (4.3%)adidas AG (Germany) 2,249 694,317Aritzia, Inc. (Canada) † 17,590 225,391Kering SA (France) 871 515,114 1,434,822Trading companies and distributors (2.0%)Ashtead Group PLC (United Kingdom) 23,190 663,806 663,806Water utilities (1.0%)China Water Affairs Group, Ltd. (China) 332,000 326,971 326,971Wireless telecommunication services (1.2%)Safaricom PLC (Kenya) 321,000 87,645SoftBank Group Corp. (Japan) 6,200 298,770 386,415
Total common stocks (cost $29,997,446) $32,379,246
Expiration WARRANTS (0.9%)* † date Strike price Warrants Value
Jarir Marketing Co. 144A (Saudi Arabia) 1/20/22 $0.00 6,708 $295,490
Total warrants (cost $275,328) $295,490
SHORT-TERM INVESTMENTS (3.0%)* Shares Value
Putnam Cash Collateral Pool, LLC 2.51% d 282,978 $282,978Putnam Short Term Investment Fund 2.46% L 709,600 709,600Total short-term investments (cost $992,578) $992,578
Total investments (cost $31,265,352) $33,667,314
Key to holding’s abbreviations ADR American Depository Receipts: represents ownership of foreign
securities on deposit with a custodian bank
Notes to the fund’s portfolio Unless noted otherwise, the notes to the fund’s portfolio are for the close of the
fund’s reporting period, which ran from January 1, 2019 through June 30, 2019 (the reporting period). Within the following notes to the portfolio, references to “Putnam Management” represent Putnam Investment Management, LLC, the fund’s manager, an indirect wholly-owned subsidiary of Putnam Investments, LLC and references to “ASC 820” represent Accounting Standards Codification 820 Fair Value Measurements and Disclosures.
* Percentages indicated are based on net assets of $33,404,823.
† This security is non-income-producing.
∆∆ This security is restricted with regard to public resale. The total fair value of this security and any other restricted securities (excluding 144A securities), if any, held at the close of the reporting period was $7,161, or less than 0.1% of net assets.
d Affiliated company. See Notes 1 and 5 to the financial statements regarding securities lending. The rate quoted in the security description is the annualized 7-day yield of the fund at the close of the reporting period.
F This security is valued by Putnam Management at fair value following proce-dures approved by the Trustees. Securities are classified as Level 3 for ASC 820 based on the securities’ valuation inputs. At the close of the reporting period, fair value pricing was also used for certain foreign securities in the portfolio (Note 1).
L Affiliated company (Note 5). The rate quoted in the security description is the annualized 7-day yield of the fund at the close of the reporting period.
S Security on loan, in part or in entirety, at the close of the reporting period (Note 1).
At the close of the reporting period, the fund maintained liquid assets totaling $19,188 to cover certain derivative contracts.
144A after the name of an issuer represents securities exempt from registration under Rule 144A of the Securities Act of 1933, as amended. These securities may be resold in transactions exempt from registration, normally to qualified institutional buyers.
DIVERSIFICATION BY COUNTRY
Distribution of investments by country of risk at the close of the reporting period, excluding collateral received, if any (as a percentage of Portfolio Value):
United Kingdom 15.4% Japan 12.2 United States 10.3 Netherlands 9.1 France 6.2 Germany 5.4 Canada 4.1 China 4.0 India 3.2 Indonesia 3.2 Switzerland 3.0 Ireland 2.9 Hong Kong 2.8
Brazil 2.6% Australia 2.5 Taiwan 2.1 Italy 1.9 Denmark 1.5 Norway 1.4 Poland 1.4 Sweden 1.3 Philippines 1.2 Saudi Arabia 0.9 Russia 0.7 Other 0.7 Total 100.0%
COMMON STOCKS (96.9%)* cont. Shares Value
Putnam VT International Growth Fund 5
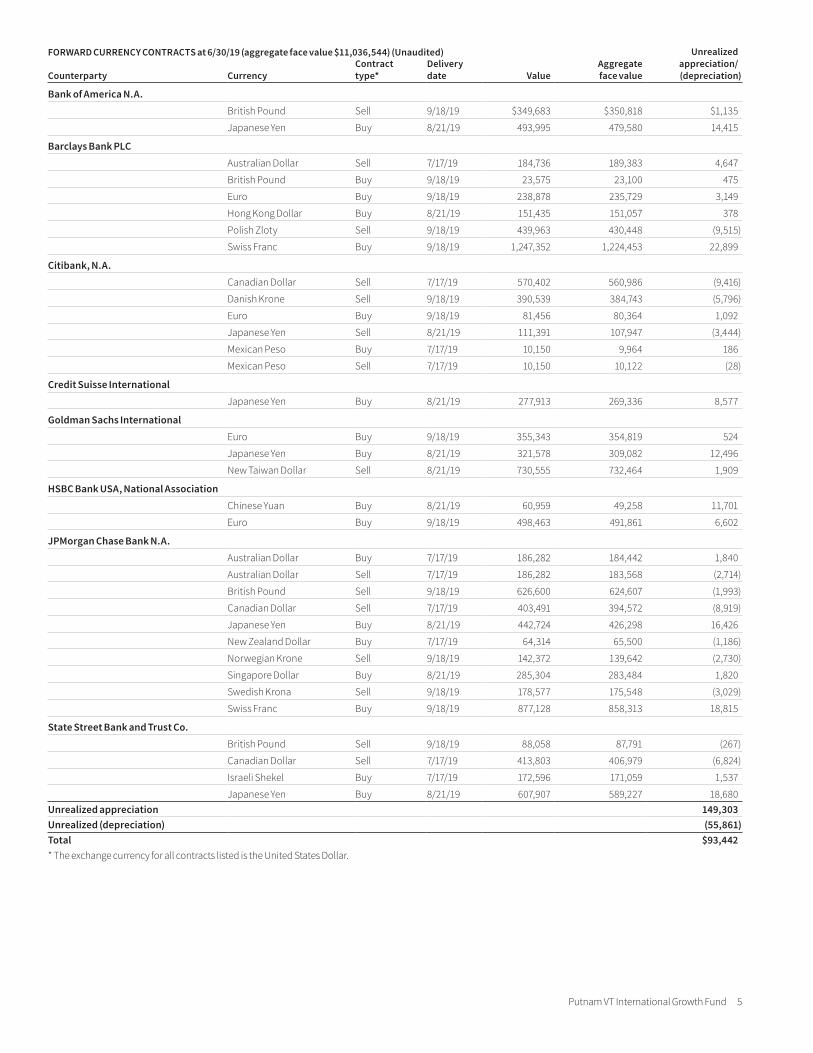
FORWARD CURRENCY CONTRACTS at 6/30/19 (aggregate face value $11,036,544) (Unaudited) Unrealized appreciation/ (depreciation)Counterparty Currency
Contract type*
Delivery date Value
Aggregate face value
Bank of America N.A.British Pound Sell 9/18/19 $349,683 $350,818 $1,135
Japanese Yen Buy 8/21/19 493,995 479,580 14,415
Barclays Bank PLCAustralian Dollar Sell 7/17/19 184,736 189,383 4,647
British Pound Buy 9/18/19 23,575 23,100 475
Euro Buy 9/18/19 238,878 235,729 3,149
Hong Kong Dollar Buy 8/21/19 151,435 151,057 378
Polish Zloty Sell 9/18/19 439,963 430,448 (9,515)
Swiss Franc Buy 9/18/19 1,247,352 1,224,453 22,899
Citibank, N.A.Canadian Dollar Sell 7/17/19 570,402 560,986 (9,416)
Danish Krone Sell 9/18/19 390,539 384,743 (5,796)
Euro Buy 9/18/19 81,456 80,364 1,092
Japanese Yen Sell 8/21/19 111,391 107,947 (3,444)
Mexican Peso Buy 7/17/19 10,150 9,964 186
Mexican Peso Sell 7/17/19 10,150 10,122 (28)
Credit Suisse InternationalJapanese Yen Buy 8/21/19 277,913 269,336 8,577
Goldman Sachs InternationalEuro Buy 9/18/19 355,343 354,819 524
Japanese Yen Buy 8/21/19 321,578 309,082 12,496
New Taiwan Dollar Sell 8/21/19 730,555 732,464 1,909
HSBC Bank USA, National AssociationChinese Yuan Buy 8/21/19 60,959 49,258 11,701
Euro Buy 9/18/19 498,463 491,861 6,602
JPMorgan Chase Bank N.A.Australian Dollar Buy 7/17/19 186,282 184,442 1,840
Australian Dollar Sell 7/17/19 186,282 183,568 (2,714)
British Pound Sell 9/18/19 626,600 624,607 (1,993)
Canadian Dollar Sell 7/17/19 403,491 394,572 (8,919)
Japanese Yen Buy 8/21/19 442,724 426,298 16,426
New Zealand Dollar Buy 7/17/19 64,314 65,500 (1,186)
Norwegian Krone Sell 9/18/19 142,372 139,642 (2,730)
Singapore Dollar Buy 8/21/19 285,304 283,484 1,820
Swedish Krona Sell 9/18/19 178,577 175,548 (3,029)
Swiss Franc Buy 9/18/19 877,128 858,313 18,815
State Street Bank and Trust Co.British Pound Sell 9/18/19 88,058 87,791 (267)
Canadian Dollar Sell 7/17/19 413,803 406,979 (6,824)
Israeli Shekel Buy 7/17/19 172,596 171,059 1,537
Japanese Yen Buy 8/21/19 607,907 589,227 18,680 Unrealized appreciation 149,303 Unrealized (depreciation) (55,861)Total $93,442 * The exchange currency for all contracts listed is the United States Dollar.
6 Putnam VT International Growth Fund
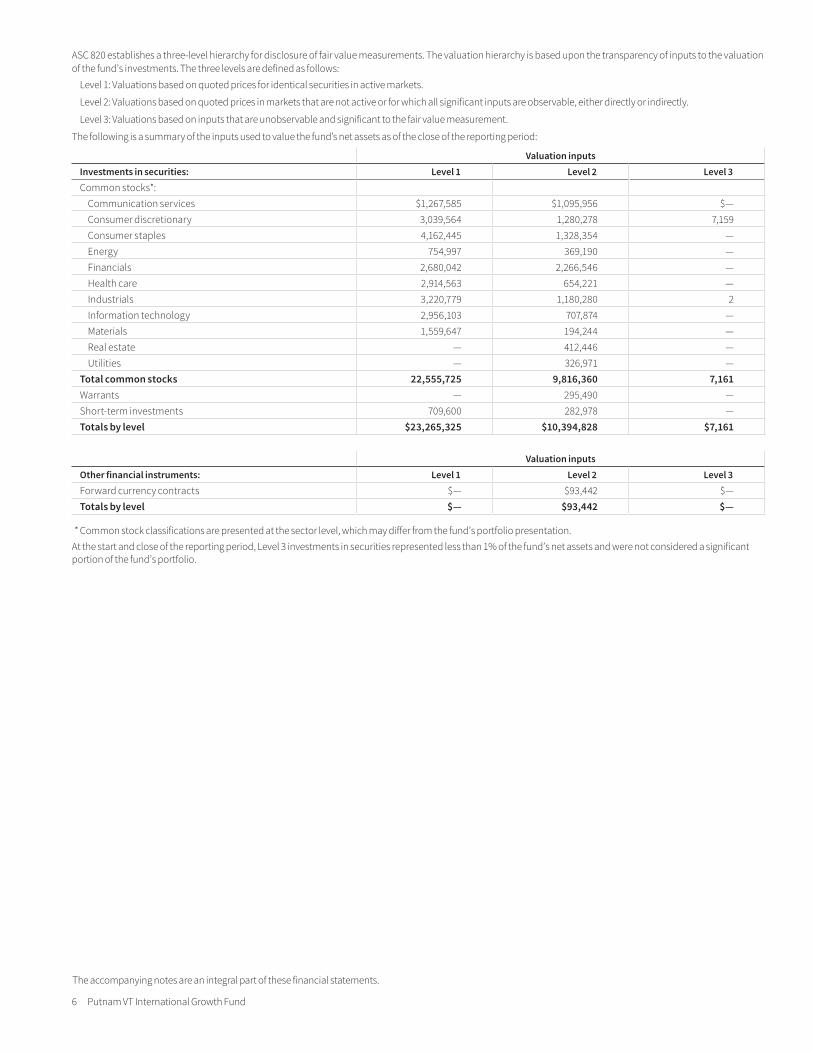
ASC 820 establishes a three-level hierarchy for disclosure of fair value measurements. The valuation hierarchy is based upon the transparency of inputs to the valuation of the fund’s investments. The three levels are defined as follows:
Level 1: Valuations based on quoted prices for identical securities in active markets.
Level 2: Valuations based on quoted prices in markets that are not active or for which all significant inputs are observable, either directly or indirectly.
Level 3: Valuations based on inputs that are unobservable and significant to the fair value measurement.
The following is a summary of the inputs used to value the fund’s net assets as of the close of the reporting period:
Valuation inputsInvestments in securities: Level 1 Level 2 Level 3Common stocks*:
Communication services $1,267,585 $1,095,956 $— Consumer discretionary 3,039,564 1,280,278 7,159Consumer staples 4,162,445 1,328,354 — Energy 754,997 369,190 — Financials 2,680,042 2,266,546 — Health care 2,914,563 654,221 — Industrials 3,220,779 1,180,280 2Information technology 2,956,103 707,874 — Materials 1,559,647 194,244 — Real estate — 412,446 — Utilities — 326,971 —
Total common stocks 22,555,725 9,816,360 7,161Warrants — 295,490 — Short-term investments 709,600 282,978 — Totals by level $23,265,325 $10,394,828 $7,161
Valuation inputsOther financial instruments: Level 1 Level 2 Level 3Forward currency contracts $— $93,442 $— Totals by level $— $93,442 $—
* Common stock classifications are presented at the sector level, which may differ from the fund’s portfolio presentation.At the start and close of the reporting period, Level 3 investments in securities represented less than 1% of the fund’s net assets and were not considered a significant portion of the fund’s portfolio.
The accompanying notes are an integral part of these financial statements.
Putnam VT International Growth Fund 7
The accompanying notes are an integral part of these financial statements.
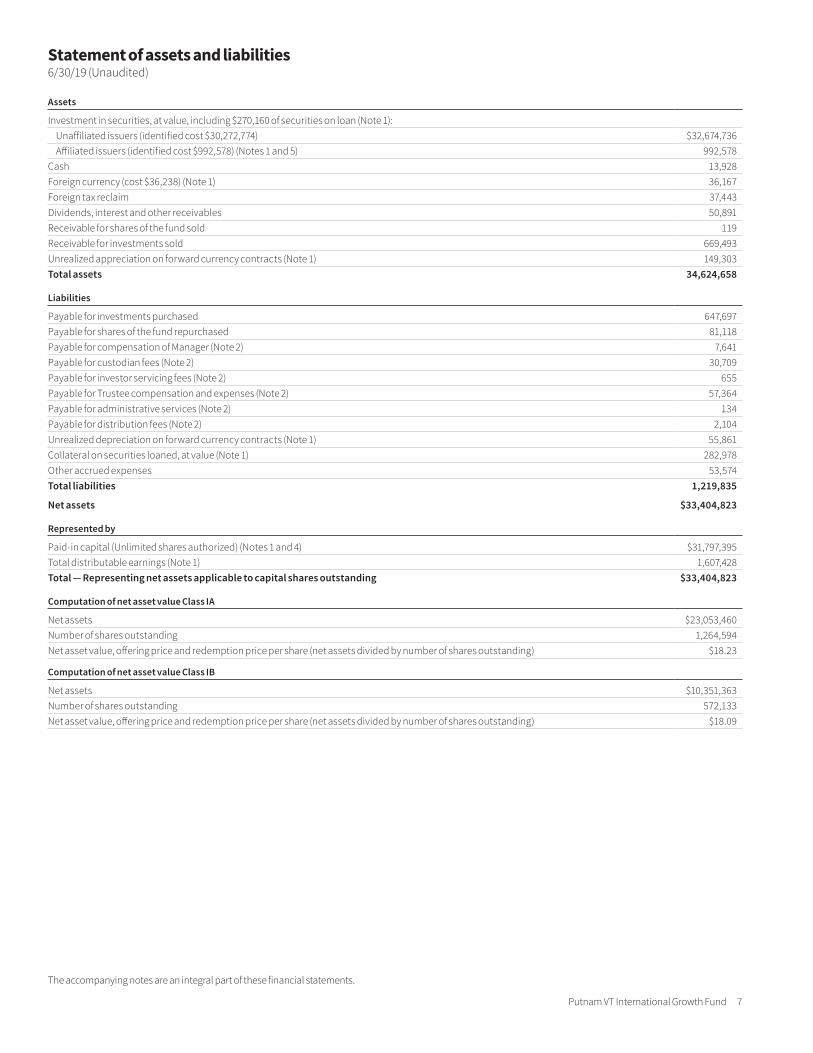
Statement of assets and liabilities6/30/19 (Unaudited)
Assets
Investment in securities, at value, including $270,160 of securities on loan (Note 1):Unaffiliated issuers (identified cost $30,272,774) $32,674,736 Affiliated issuers (identified cost $992,578) (Notes 1 and 5) 992,578
Cash 13,928 Foreign currency (cost $36,238) (Note 1) 36,167 Foreign tax reclaim 37,443 Dividends, interest and other receivables 50,891 Receivable for shares of the fund sold 119 Receivable for investments sold 669,493 Unrealized appreciation on forward currency contracts (Note 1) 149,303 Total assets 34,624,658
Liabilities
Payable for investments purchased 647,697 Payable for shares of the fund repurchased 81,118 Payable for compensation of Manager (Note 2) 7,641 Payable for custodian fees (Note 2) 30,709 Payable for investor servicing fees (Note 2) 655 Payable for Trustee compensation and expenses (Note 2) 57,364 Payable for administrative services (Note 2) 134 Payable for distribution fees (Note 2) 2,104 Unrealized depreciation on forward currency contracts (Note 1) 55,861 Collateral on securities loaned, at value (Note 1) 282,978 Other accrued expenses 53,574 Total liabilities 1,219,835
Net assets $33,404,823
Represented by
Paid-in capital (Unlimited shares authorized) (Notes 1 and 4) $31,797,395 Total distributable earnings (Note 1) 1,607,428 Total — Representing net assets applicable to capital shares outstanding $33,404,823
Computation of net asset value Class IA
Net assets $23,053,460 Number of shares outstanding 1,264,594 Net asset value, offering price and redemption price per share (net assets divided by number of shares outstanding) $18.23
Computation of net asset value Class IB
Net assets $10,351,363 Number of shares outstanding 572,133 Net asset value, offering price and redemption price per share (net assets divided by number of shares outstanding) $18.09
8 Putnam VT International Growth Fund
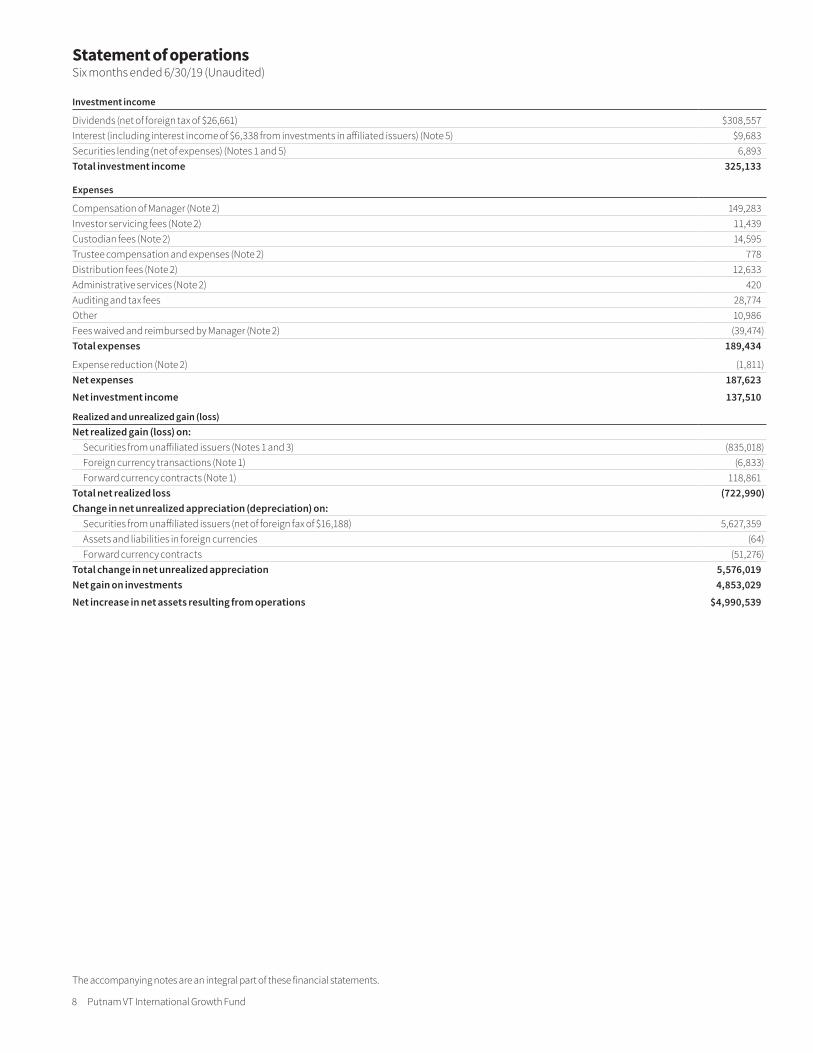
Statement of operationsSix months ended 6/30/19 (Unaudited)
Investment income
Dividends (net of foreign tax of $26,661) $308,557 Interest (including interest income of $6,338 from investments in affiliated issuers) (Note 5) $9,683 Securities lending (net of expenses) (Notes 1 and 5) 6,893 Total investment income 325,133
Expenses
Compensation of Manager (Note 2) 149,283 Investor servicing fees (Note 2) 11,439 Custodian fees (Note 2) 14,595 Trustee compensation and expenses (Note 2) 778 Distribution fees (Note 2) 12,633 Administrative services (Note 2) 420 Auditing and tax fees 28,774 Other 10,986 Fees waived and reimbursed by Manager (Note 2) (39,474)Total expenses 189,434
Expense reduction (Note 2) (1,811)Net expenses 187,623
Net investment income 137,510
Realized and unrealized gain (loss)Net realized gain (loss) on:
Securities from unaffiliated issuers (Notes 1 and 3) (835,018)Foreign currency transactions (Note 1) (6,833)Forward currency contracts (Note 1) 118,861
Total net realized loss (722,990)Change in net unrealized appreciation (depreciation) on:
Securities from unaffiliated issuers (net of foreign fax of $16,188) 5,627,359Assets and liabilities in foreign currencies (64)Forward currency contracts (51,276)
Total change in net unrealized appreciation 5,576,019 Net gain on investments 4,853,029
Net increase in net assets resulting from operations $4,990,539
The accompanying notes are an integral part of these financial statements.
Putnam VT International Growth Fund 9
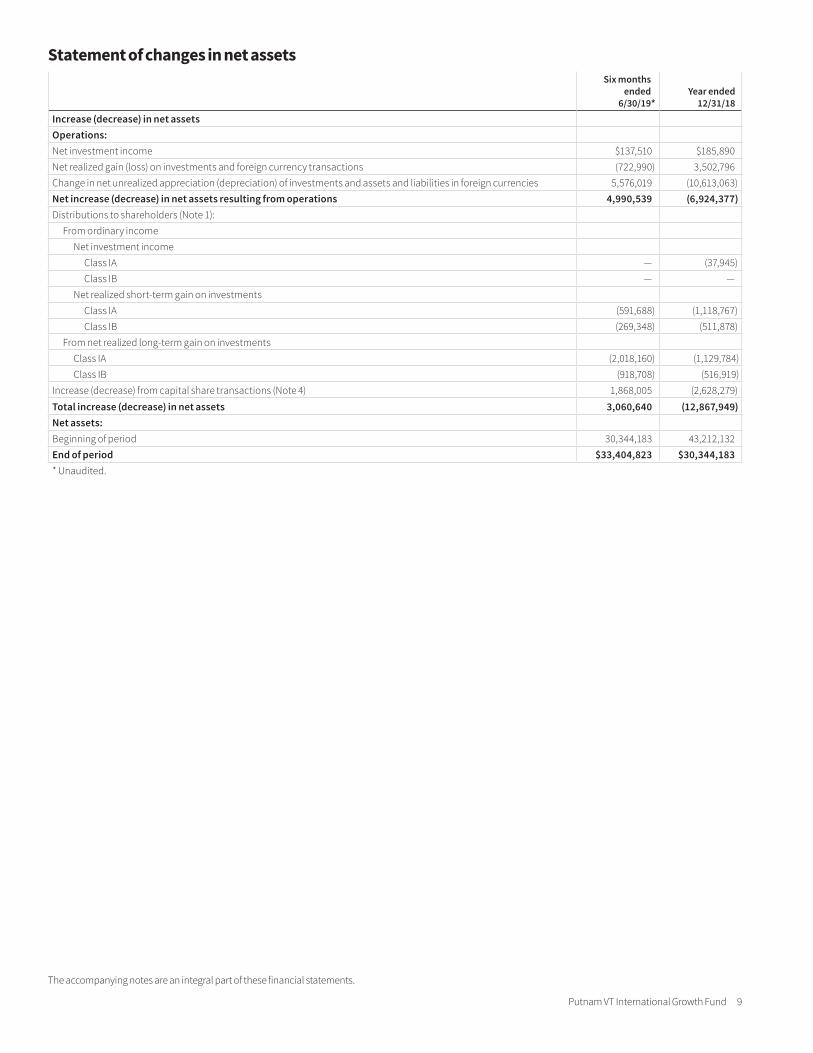
Statement of changes in net assets Six months ended
6/30/19*Year ended
12/31/18Increase (decrease) in net assetsOperations:Net investment income $137,510 $185,890 Net realized gain (loss) on investments and foreign currency transactions (722,990) 3,502,796 Change in net unrealized appreciation (depreciation) of investments and assets and liabilities in foreign currencies 5,576,019 (10,613,063)Net increase (decrease) in net assets resulting from operations 4,990,539 (6,924,377)Distributions to shareholders (Note 1):
From ordinary incomeNet investment income
Class IA — (37,945)Class IB — —
Net realized short-term gain on investmentsClass IA (591,688) (1,118,767)Class IB (269,348) (511,878)
From net realized long-term gain on investmentsClass IA (2,018,160) (1,129,784)Class IB (918,708) (516,919)
Increase (decrease) from capital share transactions (Note 4) 1,868,005 (2,628,279)
Total increase (decrease) in net assets 3,060,640 (12,867,949)Net assets:Beginning of period 30,344,183 43,212,132 End of period $33,404,823 $30,344,183 * Unaudited.
The accompanying notes are an integral part of these financial statements.
10 Putnam VT International Growth Fund
The accompanying notes are an integral part of these financial statements.
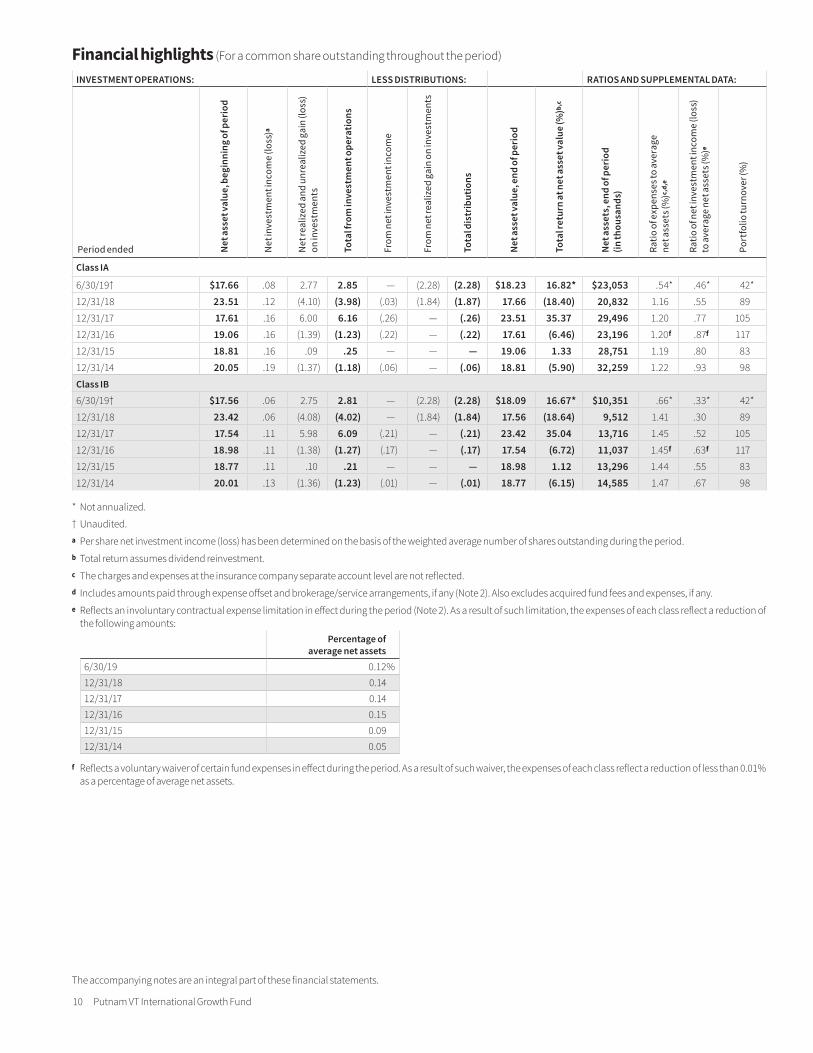
* Not annualized.
† Unaudited.a Per share net investment income (loss) has been determined on the basis of the weighted average number of shares outstanding during the period.b Total return assumes dividend reinvestment.c The charges and expenses at the insurance company separate account level are not reflected.d Includes amounts paid through expense offset and brokerage/service arrangements, if any (Note 2). Also excludes acquired fund fees and expenses, if any.e Reflects an involuntary contractual expense limitation in effect during the period (Note 2). As a result of such limitation, the expenses of each class reflect a reduction of
the following amounts:Percentage of
average net assets6/30/19 0.12%12/31/18 0.1412/31/17 0.1412/31/16 0.1512/31/15 0.0912/31/14 0.05
f Reflects a voluntary waiver of certain fund expenses in effect during the period. As a result of such waiver, the expenses of each class reflect a reduction of less than 0.01% as a percentage of average net assets.
Financial highlights (For a common share outstanding throughout the period)
INVESTMENT OPERATIONS: LESS DISTRIBUTIONS: RATIOS AND SUPPLEMENTAL DATA:
Period ended Net
ass
et va
lue,
beg
inni
ng o
f per
iod
Net
inve
stm
ent i
ncom
e (lo
ss ) a
Net
real
ized
and
unr
ealiz
ed g
ain
(loss
) on
inve
stm
ents
Tota
l fro
m in
vest
men
t ope
ratio
ns
From
net
inve
stm
ent i
ncom
e
From
net
real
ized
gai
n on
inve
stm
ents
Tota
l dis
tri b
u tio
ns
Net
ass
et va
lue,
end
of p
erio
d
Tota
l ret
urn
at n
et a
sset
valu
e (%
) b,c
Net
ass
ets,
end
of p
erio
d (in
thou
sand
s )
Ratio
of e
xpen
ses t
o av
erag
e ne
t ass
ets (
% ) c
,d,e
Ratio
of n
et in
vest
men
t inc
ome
(loss
) to
ave
rage
net
ass
ets (
% ) e
Port
folio
turn
over
(% )
Class IA
6/30/19 † $17.66 .08 2.77 2.85 — (2.28 ) (2.28 ) $18.23 16.82 * $23,053 .54 * .46 * 42 *
12/31/18 23.51 .12 (4.10 ) (3.98 ) (.03 ) (1.84 ) (1.87 ) 17.66 (18.40 ) 20,832 1.16 .55 89
12/31/17 17.61 .16 6.00 6.16 (.26 ) — (.26 ) 23.51 35.37 29,496 1.20 .77 105
12/31/16 19.06 .16 (1.39 ) (1.23 ) (.22 ) — (.22 ) 17.61 (6.46 ) 23,196 1.20 f .87 f 117
12/31/15 18.81 .16 .09 .25 — — — 19.06 1.33 28,751 1.19 .80 83
12/31/14 20.05 .19 (1.37 ) (1.18 ) (.06 ) — (.06 ) 18.81 (5.90 ) 32,259 1.22 .93 98
Class IB
6/30/19 † $17.56 .06 2.75 2.81 — (2.28 ) (2.28 ) $18.09 16.67 * $10,351 .66 * .33 * 42 *
12/31/18 23.42 .06 (4.08 ) (4.02 ) — (1.84 ) (1.84 ) 17.56 (18.64 ) 9,512 1.41 .30 89
12/31/17 17.54 .11 5.98 6.09 (.21 ) — (.21 ) 23.42 35.04 13,716 1.45 .52 105
12/31/16 18.98 .11 (1.38 ) (1.27 ) (.17 ) — (.17 ) 17.54 (6.72 ) 11,037 1.45 f .63 f 117
12/31/15 18.77 .11 .10 .21 — — — 18.98 1.12 13,296 1.44 .55 83
12/31/14 20.01 .13 (1.36 ) (1.23 ) (.01 ) — (.01 ) 18.77 (6.15 ) 14,585 1.47 .67 98
Putnam VT International Growth Fund 11
Notes to financial statements 6/30/19 (Unaudited)
Within the following Notes to financial statements, references to “State Street” represent State Street Bank and Trust Company, references to “the SEC” represent the Securities and Exchange Commission, references to “Putnam Management” represent Putnam Investment Management, LLC, the fund’s manager, an indirect wholly-owned subsidiary of Putnam Investments, LLC and references to “OTC”, if any, represent over-the-counter. Unless otherwise noted, the “reporting period” represents the period from January 1, 2019 through June 30, 2019.
Putnam VT International Growth Fund (the fund) is a diversified series of Putnam Variable Trust (the Trust), a Massachusetts business trust registered under the Investment Company Act of 1940, as amended, as an open-end manage-ment investment company. The goal of the fund is to seek long-term capital appreciation. The fund invests mainly in common stocks of companies of any size in established and emerging markets outside the United States. The fund invests mainly in growth stocks, which are issued by companies whose earn-ings are expected to grow faster than those of similar firms and whose business growth and other characteristics may lead to an increase in stock price. Putnam Management may consider, among other factors, a company’s valuation, finan-cial strength, growth potential, competitive position in its industry, projected future earnings, cash flows and dividends when deciding whether to buy or sell investments. The fund may also use derivatives, such as futures, options, certain foreign currency transactions, warrants and swap contracts, for both hedging and non-hedging purposes.
The fund offers class IA and class IB shares of beneficial interest. Class IA shares are offered at net asset value and are not subject to a distribution fee. Class IB shares are offered at net asset value and pay an ongoing distribution fee, which is identified in Note 2.
In the normal course of business, the fund enters into contracts that may include agreements to indemnify another party under given circumstances. The fund’s maximum exposure under these arrangements is unknown as this would involve future claims that may be, but have not yet been, made against the fund. However, the fund’s management team expects the risk of material loss to be remote.
The fund has entered into contractual arrangements with an investment adviser, administrator, distributor, shareholder servicing agent and custodian, who each provide services to the fund. Unless expressly stated otherwise, shareholders are not parties to, or intended beneficiaries of these contractual arrangements, and these contractual arrangements are not intended to create any shareholder right to enforce them against the service providers or to seek any remedy under them against the service providers, either directly or on behalf of the fund.
Under the fund’s Amended and Restated Agreement and Declaration of Trust, any claims asserted against or on behalf of the Putnam Funds, including claims against Trustees and Officers, must be brought in state and federal courts located within the Commonwealth of Massachusetts.
Note 1 — Significant accounting policiesThe following is a summary of significant accounting policies consistently followed by the fund in the preparation of its financial statements. The prepara-tion of financial statements is in conformity with accounting principles generally accepted in the United States of America and requires management to make esti-mates and assumptions that affect the reported amounts of assets and liabilities in the financial statements and the reported amounts of increases and decreases in net assets from operations. Actual results could differ from those estimates. Subsequent events after the Statement of assets and liabilities date through the date that the financial statements were issued have been evaluated in the preparation of the financial statements.
Investment income, realized and unrealized gains and losses and expenses of the fund are borne pro-rata based on the relative net assets of each class to the total net assets of the fund, except that each class bears expenses unique to that class (including the distribution fees applicable to such classes). Each class votes as a class only with respect to its own distribution plan or other matters on which a class vote is required by law or determined by the Trustees. If the fund were liqui-dated, shares of each class would receive their pro-rata share of the net assets of the fund. In addition, the Trustees declare separate dividends on each class of shares.
Security valuation Portfolio securities and other investments are valued using policies and procedures adopted by the Board of Trustees. The Trustees have formed a Pricing Committee to oversee the implementation of these procedures and have delegated responsibility for valuing the fund’s assets in accordance with these procedures to Putnam Management. Putnam Management has established
an internal Valuation Committee that is responsible for making fair value deter-minations, evaluating the effectiveness of the pricing policies of the fund and reporting to the Pricing Committee.
Investments for which market quotations are readily available are valued at the last reported sales price on their principal exchange, or official closing price for certain markets, and are classified as Level 1 securities under Accounting Standards Codification 820 Fair Value Measurements and Disclosures (ASC 820). If no sales are reported, as in the case of some securities that are traded OTC, a security is valued at its last reported bid price and is generally categorized as a Level 2 security.
Investments in open-end investment companies (excluding exchange-traded funds), if any, which can be classified as Level 1 or Level 2 securities, are valued based on their net asset value. The net asset value of such investment companies equals the total value of their assets less their liabilities and divided by the number of their outstanding shares.
Many securities markets and exchanges outside the U.S. close prior to the sched-uled close of the New York Stock Exchange and therefore the closing prices for securities in such markets or on such exchanges may not fully reflect events that occur after such close but before the scheduled close of the New York Stock Exchange. Accordingly, on certain days, the fund will fair value certain foreign equity securities taking into account multiple factors including movements in the U.S. securities markets, currency valuations and comparisons to the valuation of American Depository Receipts, exchange-traded funds and futures contracts. The foreign equity securities, which would generally be classified as Level 1 securities, will be transferred to Level 2 of the fair value hierarchy when they are valued at fair value. The number of days on which fair value prices will be used will depend on market activity and it is possible that fair value prices will be used by the fund to a significant extent. At the close of the reporting period, fair value pricing was used for certain foreign securities in the portfolio. Securities quoted in foreign currencies, if any, are translated into U.S. dollars at the current exchange rate. Short-term securities with remaining maturities of 60 days or less are valued using an independent pricing service approved by the Trustees, and are classified as Level 2 securities.
To the extent a pricing service or dealer is unable to value a security or provides a valuation that Putnam Management does not believe accurately reflects the secu-rity’s fair value, the security will be valued at fair value by Putnam Management in accordance with policies and procedures approved by the Trustees. Certain investments, including certain restricted and illiquid securities and derivatives, are also valued at fair value following procedures approved by the Trustees. These valuations consider such factors as significant market or specific security events such as interest rate or credit quality changes, various relationships with other securities, discount rates, U.S. Treasury, U.S. swap and credit yields, index levels, convexity exposures, recovery rates, sales and other multiples and resale restrictions. These securities are classified as Level 2 or as Level 3 depending on the priority of the significant inputs.
To assess the continuing appropriateness of fair valuations, the Valuation Committee reviews and affirms the reasonableness of such valuations on a regular basis after considering all relevant information that is reasonably avail-able. Such valuations and procedures are reviewed periodically by the Trustees. The fair value of securities is generally determined as the amount that the fund could reasonably expect to realize from an orderly disposition of such securities over a reasonable period of time. By its nature, a fair value price is a good faith estimate of the value of a security in a current sale and does not reflect an actual market price, which may be different by a material amount.
Security transactions and related investment income Security transactions are recorded on the trade date (the date the order to buy or sell is executed). Gains or losses on securities sold are determined on the identified cost basis.
Interest income, net of any applicable withholding taxes and including amorti-zation and accretion of premiums and discounts on debt securities, is recorded on the accrual basis. Dividend income, net of any applicable withholding taxes, is recognized on the ex-dividend date except that certain dividends from foreign securities, if any, are recognized as soon as the fund is informed of the ex-dividend date. Non-cash dividends, if any, are recorded at the fair value of the securities received. Dividends representing a return of capital or capital gains, if any, are reflected as a reduction of cost and/or as a realized gain.
Foreign currency translation The accounting records of the fund are main-tained in U.S. dollars. The fair value of foreign securities, currency holdings, and other assets and liabilities is recorded in the books and records of the fund after
12 Putnam VT International Growth Fund
translation to U.S. dollars based on the exchange rates on that day. The cost of each security is determined using historical exchange rates. Income and with-holding taxes are translated at prevailing exchange rates when earned or incurred. The fund does not isolate that portion of realized or unrealized gains or losses resulting from changes in the foreign exchange rate on investments from fluctu-ations arising from changes in the market prices of the securities. Such gains and losses are included with the net realized and unrealized gain or loss on invest-ments. Net realized gains and losses on foreign currency transactions represent net realized exchange gains or losses on disposition of foreign currencies, currency gains and losses realized between the trade and settlement dates on securities transactions and the difference between the amount of investment income and foreign withholding taxes recorded on the fund’s books and the U.S. dollar equiv-alent amounts actually received or paid. Net unrealized appreciation and depreci-ation of assets and liabilities in foreign currencies arise from changes in the value of assets and liabilities other than investments at the period end, resulting from changes in the exchange rate.
Forward currency contracts The fund buys and sells forward currency contracts, which are agreements between two parties to buy and sell currencies at a set price on a future date. These contracts are used to hedge foreign exchange risk.
The U.S. dollar value of forward currency contracts is determined using current forward currency exchange rates supplied by a quotation service. The fair value of the contract will fluctuate with changes in currency exchange rates. The contract is marked to market daily and the change in fair value is recorded as an unreal-ized gain or loss. The fund records a realized gain or loss equal to the difference between the value of the contract at the time it was opened and the value at the time it was closed when the contract matures or by delivery of the currency. The fund could be exposed to risk if the value of the currency changes unfavorably, if the counterparties to the contracts are unable to meet the terms of their contracts or if the fund is unable to enter into a closing position. Risks may exceed amounts recognized on the Statement of assets and liabilities.
Forward currency contracts outstanding at period end, if any, are listed after the fund’s portfolio.
Master agreements The fund is a party to ISDA (International Swaps and Derivatives Association, Inc.) Master Agreements (Master Agreements) with certain counterparties that govern OTC derivative and foreign exchange contracts entered into from time to time. The Master Agreements may contain provisions regarding, among other things, the parties’ general obligations, representa-tions, agreements, collateral requirements, events of default and early termina-tion. With respect to certain counterparties, in accordance with the terms of the Master Agreements, collateral posted to the fund is held in a segregated account by the fund’s custodian and, with respect to those amounts which can be sold or repledged, is presented in the fund’s portfolio.
Collateral pledged by the fund is segregated by the fund’s custodian and identi-fied in the fund’s portfolio. Collateral can be in the form of cash or debt securities issued by the U.S. Government or related agencies or other securities as agreed to by the fund and the applicable counterparty. Collateral requirements are determined based on the fund’s net position with each counterparty.
Termination events applicable to the fund may occur upon a decline in the fund’s net assets below a specified threshold over a certain period of time. Termination events applicable to counterparties may occur upon a decline in the counterpar-ty’s long-term and short-term credit ratings below a specified level. In each case, upon occurrence, the other party may elect to terminate early and cause settle-ment of all derivative and foreign exchange contracts outstanding, including the payment of any losses and costs resulting from such early termination, as reasonably determined by the terminating party. Any decision by one or more of the fund’s counterparties to elect early termination could impact the fund’s future derivative activity.
At the close of the reporting period, the fund had a net liability position of $17,406 on open derivative contracts subject to the Master Agreements. There was no collateral posted by the fund at period end for these agreements.
Securities lending The fund may lend securities, through its agent, to qualified borrowers in order to earn additional income. The loans are collateralized by cash in an amount at least equal to the fair value of the securities loaned. The fair value of securities loaned is determined daily and any additional required collateral is allocated to the fund on the next business day. The remaining maturities of the securities lending transactions are considered overnight and continuous. The risk of borrower default will be borne by the fund’s agent; the fund will bear the risk of loss with respect to the investment of the cash collateral. Income from securi-ties lending, net of expenses, is included in investment income on the Statement of operations. Cash collateral is invested in Putnam Cash Collateral Pool, LLC,
a limited liability company managed by an affiliate of Putnam Management. Investments in Putnam Cash Collateral Pool, LLC are valued at its closing net asset value each business day. There are no management fees charged to Putnam Cash Collateral Pool, LLC. At the close of the reporting period, the fund received cash collateral of $282,978 and the value of securities loaned amounted to $284,031. Certain of these securities were sold prior to the close of the reporting period and are included in Receivable for investments sold on the Statement of assets and liabilities.
Interfund lending The fund, along with other Putnam funds, may participate in an interfund lending program pursuant to an exemptive order issued by the SEC. This program allows the fund to borrow from or lend to other Putnam funds that permit such transactions. Interfund lending transactions are subject to each fund’s investment policies and borrowing and lending limits. Interest earned or paid on the interfund lending transaction will be based on the average of certain current market rates. During the reporting period, the fund did not utilize the program.
Lines of credit The fund participates, along with other Putnam funds, in a $317.5 million unsecured committed line of credit and a $235.5 million unsecured uncommitted line of credit, both provided by State Street. Borrowings may be made for temporary or emergency purposes, including the funding of shareholder redemption requests and trade settlements. Interest is charged to the fund based on the fund’s borrowing at a rate equal to 1.25% plus the higher of (1) the Federal Funds rate and (2) the overnight LIBOR for the committed line of credit and the Federal Funds rate plus 1.30% for the uncommitted line of credit. A closing fee equal to 0.04% of the committed line of credit and 0.04% of the uncommitted line of credit has been paid by the participating funds. In addition, a commit-ment fee of 0.21% per annum on any unutilized portion of the committed line of credit is allocated to the participating funds based on their relative net assets and paid quarterly. During the reporting period, the fund had no borrowings against these arrangements.
Federal taxes It is the policy of the fund to distribute all of its taxable income within the prescribed time period and otherwise comply with the provisions of the Internal Revenue Code of 1986, as amended (the Code), applicable to regulated investment companies.
The fund is subject to the provisions of Accounting Standards Codification 740 Income Taxes (ASC 740). ASC 740 sets forth a minimum threshold for financial statement recognition of the benefit of a tax position taken or expected to be taken in a tax return. The fund did not have a liability to record for any unrecog-nized tax benefits in the accompanying financial statements. No provision has been made for federal taxes on income, capital gains or unrealized appreciation on securities held nor for excise tax on income and capital gains. Each of the fund’s federal tax returns for the prior three fiscal years remains subject to examination by the Internal Revenue Service.
The fund may also be subject to taxes imposed by governments of countries in which it invests. Such taxes are generally based on either income or gains earned or repatriated. The fund accrues and applies such taxes to net investment income, net realized gains and net unrealized gains as income and/or capital gains are earned. In some cases, the fund may be entitled to reclaim all or a portion of such taxes, and such reclaim amounts, if any, are reflected as an asset on the fund’s books. In many cases, however, the fund may not receive such amounts for an extended period of time, depending on the country of investment.
Tax cost of investments includes adjustments to net unrealized appreciation (depreciation) which may not necessarily be final tax cost basis adjustments, but closely approximate the tax basis unrealized gains and losses that may be realized and distributed to shareholders. The aggregate identified cost on a tax basis is $31,436,379, resulting in gross unrealized appreciation and deprecia-tion of $3,754,767 and $1,430,390, respectively, or net unrealized appreciation of $2,324,377.
Distributions to shareholders Distributions to shareholders from net invest-ment income are recorded by the fund on the ex-dividend date. Distributions from capital gains, if any, are recorded on the ex-dividend date and paid at least annu-ally. The amount and character of income and gains to be distributed are deter-mined in accordance with income tax regulations, which may differ from generally accepted accounting principles. Dividend sources are estimated at the time of declaration. Actual results may vary. Any non-taxable return of capital cannot be determined until final tax calculations are completed after the end of the fund’s fiscal year. Reclassifications are made to the fund’s capital accounts to reflect income and gains available for distribution (or available capital loss carryovers) under income tax regulations.
Expenses of the Trust Expenses directly charged or attributable to any fund will be paid from the assets of that fund. Generally, expenses of the Trust will
Putnam VT International Growth Fund 13
be allocated among and charged to the assets of each fund on a basis that the Trustees deem fair and equitable, which may be based on the relative assets of each fund or the nature of the services performed and relative applicability to each fund.
Beneficial interest At the close of the reporting period, insurance companies or their separate accounts were record owners of all but a de minimis number of the shares of the fund. Approximately 40.2% of the fund is owned by accounts of one insurance company.
Note 2 — Management fee, administrative services and other transactionsThe fund pays Putnam Management a management fee (based on the fund’s average net assets and computed and paid monthly) at annual rates that may vary based on the average of the aggregate net assets of all open-end mutual funds sponsored by Putnam Management (excluding net assets of funds that are invested in, or that are invested in by, other Putnam funds to the extent necessary to avoid “double counting” of those assets). Such annual rates may vary as follows:
1.080% of the first $5 billion,1.030% of the next $5 billion,0.980% of the next $10 billion,0.930% of the next $10 billion,0.880% of the next $50 billion,0.860% of the next $50 billion,0.850% of the next $100 billion and0.845% of any excess thereafter.
For the reporting period, the management fee represented an effective rate (excluding the impact from any expense waivers in effect) of 0.457% of the fund’s average net assets.
Putnam Management has contractually agreed to waive fees (and, to the extent necessary, bear other expenses) of the fund through April 30, 2021, to the extent that total expenses of the fund (excluding brokerage, interest, taxes, investment-related expenses, payments under distribution plans, extraordinary expenses and acquired fund fees and expenses) would exceed an annual rate of 1.09% of the fund’s average net assets. During the reporting period, the fund’s expenses were reduced by $16,473 as a result of this limit.
Putnam Management has also contractually agreed, through April 30, 2021, to waive fees and/or reimburse the fund’s expenses to the extent necessary to limit the cumulative expenses of the fund, exclusive of brokerage, interest, taxes, investment-related expenses, extraordinary expenses, acquired fund fees and expenses and payments under the fund’s investor servicing contract, investment management contract and distribution plans, on a fiscal year-to-date basis to an annual rate of 0.20% of the fund’s average net assets over such fiscal year-to-date period. During the reporting period, the fund’s expenses were reduced by $23,001 as a result of this limit.
Putnam Investments Limited (PIL), an affiliate of Putnam Management, is autho-rized by the Trustees to manage a separate portion of the assets of the fund as determined by Putnam Management from time to time. PIL did not manage any portion of the assets of the fund during the reporting period. If Putnam Management were to engage the services of PIL, Putnam Management would pay a quarterly sub-management fee to PIL for its services at an annual rate of 0.35% of the average net assets of the portion of the fund managed by PIL.
The Putnam Advisory Company, LLC (PAC), an affiliate of Putnam Management, is authorized by the Trustees to manage a separate portion of the assets of the fund, as designated from time to time by Putnam Management or PIL. PAC did not manage any portion of the assets of the fund during the reporting period. If Putnam Management or PIL were to engage the services of PAC, Putnam Management or PIL, as applicable, would pay a quarterly sub-advisory fee to PAC for its services at the annual rate of 0.35% of the average net assets of the portion of the fund’s assets for which PAC is engaged as sub-adviser.
The fund reimburses Putnam Management an allocated amount for the compen-sation and related expenses of certain officers of the fund and their staff who provide administrative services to the fund. The aggregate amount of all such reimbursements is determined annually by the Trustees.
Custodial functions for the fund’s assets are provided by State Street. Custody fees are based on the fund’s asset level, the number of its security holdings and transaction volumes.
Putnam Investor Services, Inc., an affiliate of Putnam Management, provides investor servicing agent functions to the fund. Putnam Investor Services, Inc. was paid a monthly fee for investor servicing at an annual rate of 0.07% of the fund’s average daily net assets. During the reporting period, the expenses for each class of shares related to investor servicing fees were as follows:
Class IA $7,872Class IB 3,567
Total $11,439
The fund has entered into expense offset arrangements with Putnam Investor Services, Inc. and State Street whereby Putnam Investor Services, Inc.’s and State Street’s fees are reduced by credits allowed on cash balances. The fund also reduced expenses through brokerage/service arrangements. For the reporting period, the fund’s expenses were reduced by $24 under the expense offset arrangements and by $1,787 under the brokerage/service arrangements.
Each Independent Trustee of the fund receives an annual Trustee fee, of which $23, as a quarterly retainer, has been allocated to the fund, and an additional fee for each Trustees meeting attended. Trustees also are reimbursed for expenses they incur relating to their services as Trustees.
The fund has adopted a Trustee Fee Deferral Plan (the Deferral Plan) which allows the Trustees to defer the receipt of all or a portion of Trustees fees payable on or after July 1, 1995. The deferred fees remain invested in certain Putnam funds until distribution in accordance with the Deferral Plan.
The fund has adopted an unfunded noncontributory defined benefit pension plan (the Pension Plan) covering all Trustees of the fund who have served as a Trustee for at least five years and were first elected prior to 2004. Benefits under the Pension Plan are equal to 50% of the Trustee’s average annual attendance and retainer fees for the three years ended December 31, 2005. The retirement benefit is payable during a Trustee’s lifetime, beginning the year following retirement, for the number of years of service through December 31, 2006. Pension expense for the fund is included in Trustee compensation and expenses in the Statement of operations. Accrued pension liability is included in Payable for Trustee compen-sation and expenses in the Statement of assets and liabilities. The Trustees have terminated the Pension Plan with respect to any Trustee first elected after 2003.
The fund has adopted a distribution plan (the Plan) with respect to its class IB shares pursuant to Rule 12b–1 under the Investment Company Act of 1940. The purpose of the Plan is to compensate Putnam Retail Management Limited Partnership, an indirect wholly-owned subsidiary of Putnam Investments, LLC, for services provided and expenses incurred in distributing shares of the fund. The Plan provides for payment by the fund to Putnam Retail Management Limited Partnership at an annual rate of up to 0.35% of the average net assets attributable to the fund’s class IB shares. The Trustees have approved payment by the fund at an annual rate of 0.25% of the average net assets attributable to the fund’s class IB shares. The expenses related to distribution fees during the reporting period are included in Distribution fees in the Statement of operations.
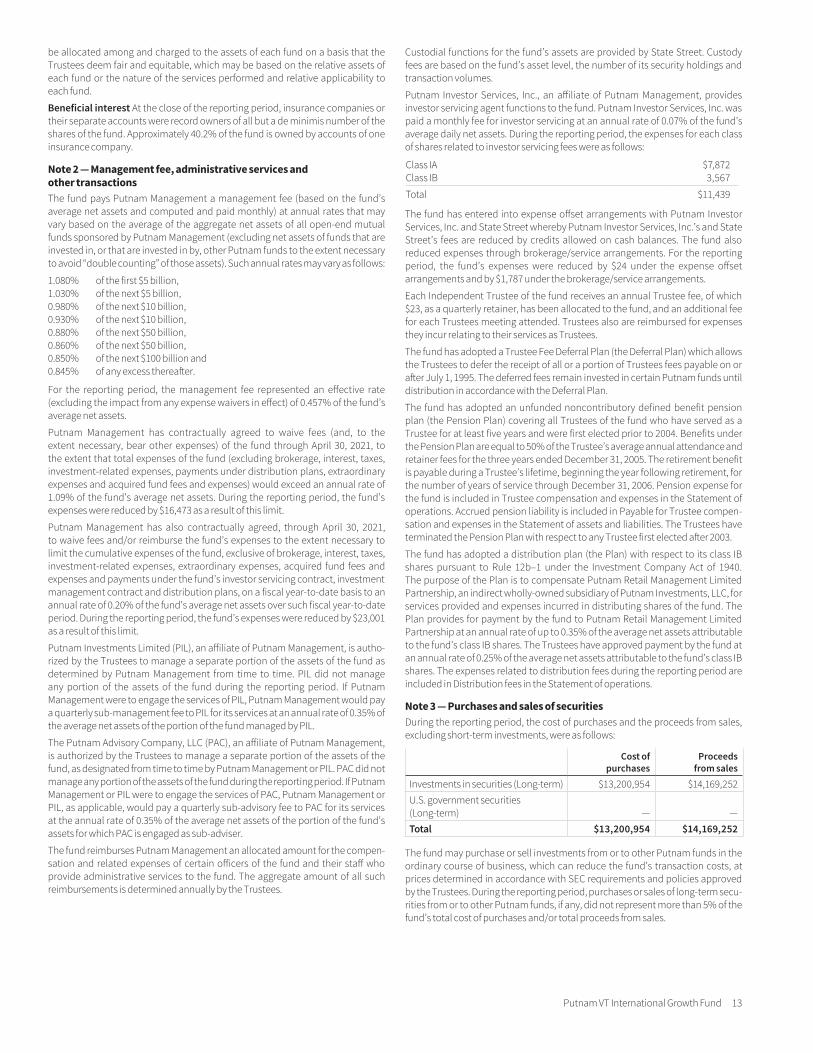
Note 3 — Purchases and sales of securitiesDuring the reporting period, the cost of purchases and the proceeds from sales, excluding short-term investments, were as follows:
Cost of purchases
Proceeds from sales
Investments in securities (Long-term) $13,200,954 $14,169,252U.S. government securities (Long-term) — —Total $13,200,954 $14,169,252
The fund may purchase or sell investments from or to other Putnam funds in the ordinary course of business, which can reduce the fund’s transaction costs, at prices determined in accordance with SEC requirements and policies approved by the Trustees. During the reporting period, purchases or sales of long-term secu-rities from or to other Putnam funds, if any, did not represent more than 5% of the fund’s total cost of purchases and/or total proceeds from sales.
14 Putnam VT International Growth Fund
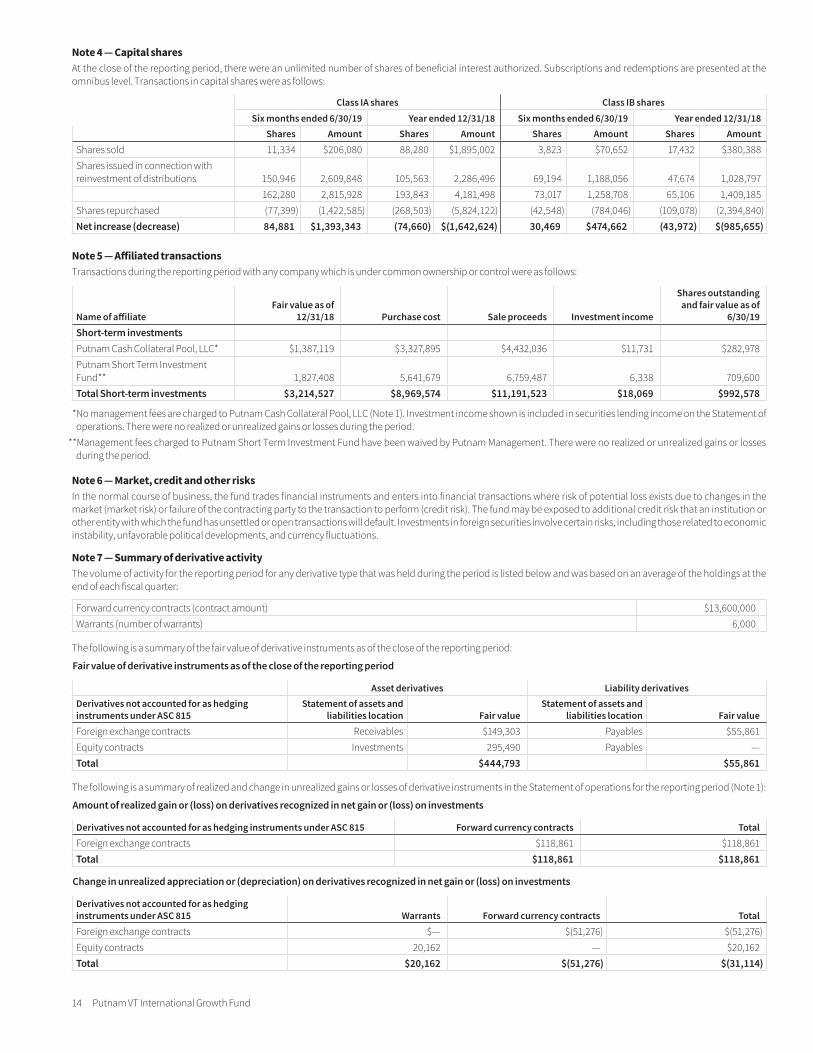
Note 4 — Capital sharesAt the close of the reporting period, there were an unlimited number of shares of beneficial interest authorized. Subscriptions and redemptions are presented at the omnibus level. Transactions in capital shares were as follows:
Class IA shares Class IB sharesSix months ended 6/30/19 Year ended 12/31/18 Six months ended 6/30/19 Year ended 12/31/18
Shares Amount Shares Amount Shares Amount Shares AmountShares sold 11,334 $206,080 88,280 $1,895,002 3,823 $70,652 17,432 $380,388Shares issued in connection with reinvestment of distributions 150,946 2,609,848 105,563 2,286,496 69,194 1,188,056 47,674 1,028,797
162,280 2,815,928 193,843 4,181,498 73,017 1,258,708 65,106 1,409,185Shares repurchased (77,399 ) (1,422,585 ) (268,503 ) (5,824,122 ) (42,548 ) (784,046 ) (109,078 ) (2,394,840 )Net increase (decrease) 84,881 $1,393,343 (74,660 ) $(1,642,624 ) 30,469 $474,662 (43,972 ) $(985,655 )
Note 5 — Affiliated transactionsTransactions during the reporting period with any company which is under common ownership or control were as follows:
Name of affiliateFair value as of
12/31/18 Purchase cost Sale proceeds Investment income
Shares outstanding and fair value as of
6/30/19Short-term investmentsPutnam Cash Collateral Pool, LLC* $1,387,119 $3,327,895 $4,432,036 $11,731 $282,978Putnam Short Term Investment Fund** 1,827,408 5,641,679 6,759,487 6,338 709,600Total Short-term investments $3,214,527 $8,969,574 $11,191,523 $18,069 $992,578
* No management fees are charged to Putnam Cash Collateral Pool, LLC (Note 1). Investment income shown is included in securities lending income on the Statement of operations. There were no realized or unrealized gains or losses during the period.
** Management fees charged to Putnam Short Term Investment Fund have been waived by Putnam Management. There were no realized or unrealized gains or losses during the period.
Note 6 — Market, credit and other risksIn the normal course of business, the fund trades financial instruments and enters into financial transactions where risk of potential loss exists due to changes in the market (market risk) or failure of the contracting party to the transaction to perform (credit risk). The fund may be exposed to additional credit risk that an institution or other entity with which the fund has unsettled or open transactions will default. Investments in foreign securities involve certain risks, including those related to economic instability, unfavorable political developments, and currency fluctuations.
Note 7 — Summary of derivative activityThe volume of activity for the reporting period for any derivative type that was held during the period is listed below and was based on an average of the holdings at the end of each fiscal quarter:
Forward currency contracts (contract amount) $13,600,000Warrants (number of warrants) 6,000
The following is a summary of the fair value of derivative instruments as of the close of the reporting period:
Fair value of derivative instruments as of the close of the reporting period
Asset derivatives Liability derivativesDerivatives not accounted for as hedging instruments under ASC 815
Statement of assets and liabilities location Fair value
Statement of assets and liabilities location Fair value
Foreign exchange contracts Receivables $149,303 Payables $55,861Equity contracts Investments 295,490 Payables —Total $444,793 $55,861
The following is a summary of realized and change in unrealized gains or losses of derivative instruments in the Statement of operations for the reporting period (Note 1):
Amount of realized gain or (loss) on derivatives recognized in net gain or (loss) on investments
Derivatives not accounted for as hedging instruments under ASC 815 Forward currency contracts TotalForeign exchange contracts $118,861 $118,861Total $118,861 $118,861
Change in unrealized appreciation or (depreciation) on derivatives recognized in net gain or (loss) on investments
Derivatives not accounted for as hedging instruments under ASC 815 Warrants Forward currency contracts TotalForeign exchange contracts $— $(51,276 ) $(51,276 )Equity contracts 20,162 — $20,162Total $20,162 $(51,276 ) $(31,114 )
Putnam VT International Growth Fund 15
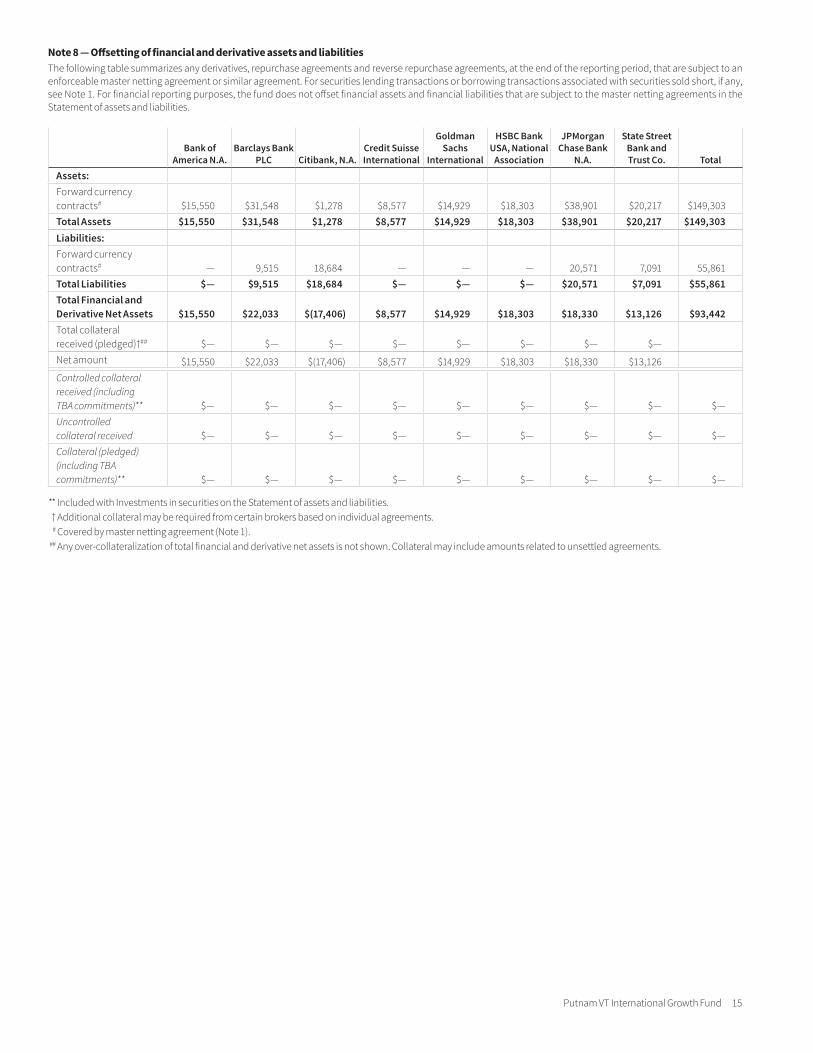
Note 8 — Offsetting of financial and derivative assets and liabilitiesThe following table summarizes any derivatives, repurchase agreements and reverse repurchase agreements, at the end of the reporting period, that are subject to an enforceable master netting agreement or similar agreement. For securities lending transactions or borrowing transactions associated with securities sold short, if any, see Note 1. For financial reporting purposes, the fund does not offset financial assets and financial liabilities that are subject to the master netting agreements in the Statement of assets and liabilities.
Bank of America N.A.
Barclays Bank PLC Citibank, N.A.
Credit Suisse International
Goldman Sachs
International
HSBC Bank USA, National
Association
JPMorgan Chase Bank
N.A.
State Street Bank and Trust Co. Total
Assets:Forward currency contracts# $15,550 $31,548 $1,278 $8,577 $14,929 $18,303 $38,901 $20,217 $149,303Total Assets $15,550 $31,548 $1,278 $8,577 $14,929 $18,303 $38,901 $20,217 $149,303Liabilities:Forward currency contracts# — 9,515 18,684 — — — 20,571 7,091 55,861Total Liabilities $— $9,515 $18,684 $— $— $— $20,571 $7,091 $55,861Total Financial and Derivative Net Assets $15,550 $22,033 $(17,406) $8,577 $14,929 $18,303 $18,330 $13,126 $93,442Total collateral received (pledged)†## $— $— $— $— $— $— $— $—Net amount $15,550 $22,033 $(17,406) $8,577 $14,929 $18,303 $18,330 $13,126Controlled collateral received (including TBA commitments)** $— $— $— $— $— $— $— $— $—Uncontrolled collateral received $— $— $— $— $— $— $— $— $—Collateral (pledged) (including TBA commitments)** $— $— $— $— $— $— $— $— $—
** Included with Investments in securities on the Statement of assets and liabilities.† Additional collateral may be required from certain brokers based on individual agreements.# Covered by master netting agreement (Note 1).
## Any over-collateralization of total financial and derivative net assets is not shown. Collateral may include amounts related to unsettled agreements.
16 Putnam VT International Growth Fund
General conclusionsThe Board of Trustees of The Putnam Funds oversees the management of each fund and, as required by law, determines annually whether to approve the continuance of your fund’s management contract with Putnam Investment Management, LLC (“Putnam Management”), the sub-management contract with respect to your fund between Putnam Management and its affiliate, Putnam Investments Limited (“PIL”), and the sub-advisory contract among Putnam Management, PIL, and another affiliate, The Putnam Advisory Company (“PAC”). The Board, with the assistance of its Contract Committee, requests and evaluates all information it deems reasonably necessary under the circumstances in connection with its annual contract review. The Contract Committee consists solely of Trustees who are not “interested persons” (as this term is defined in the Investment Company Act of 1940, as amended (the “1940 Act”)) of The Putnam Funds (“Independent Trustees”).
At the outset of the review process, members of the Board’s independent staff and independent legal counsel discussed with representatives of Putnam Management the annual contract review materials furnished to the Contract Committee during the course of the previous year’s review, identifying possible changes in these materials that might be necessary or desirable for the coming year. Following these discussions and in consultation with the Contract Committee, the Independent Trustees’ independent legal counsel requested that Putnam Management and its affiliates furnish specified information, together with any additional infor-mation that Putnam Management considered relevant, to the Contract Committee. Over the course of several months ending in June 2019, the Contract Committee met on a number of occasions with representatives of Putnam Management, and separately in executive session, to consider the information that Putnam Management provided. Throughout this process, the Contract Committee was assisted by the members of the Board’s independent staff and by independent legal counsel for The Putnam Funds and the Independent Trustees.
In May 2019, the Contract Committee met in executive session to discuss and consider its recommendations with respect to the continuance of the contracts. At the Trustees’ June 2019 meeting, the Contract Committee met in executive session with the other Independent Trustees to review a summary of the key financial, performance and other data that the Contract Committee considered in the course of its review. The Contract Committee then presented its written report, which summarized the key factors that the Committee had considered and set forth its recommen-dations. The Contract Committee recommended, and the Independent Trustees approved, the continuance of your fund’s management, sub-management and sub-advisory contracts, effective July 1, 2019. (Because PIL and PAC are affiliates of Putnam Management and Putnam Manage-ment remains fully responsible for all services provided by PIL and PAC, the Trustees have not attempted to evaluate PIL or PAC as separate entities, and all subsequent references to Putnam Management below should be deemed to include reference to PIL and PAC as necessary or appropriate in the context.)
The Independent Trustees’ approval was based on the following conclusions:
• That the fee schedule in effect for your fund represented reasonable compensation in light of the nature and quality of the services being provided to the fund, the fees paid by competitive funds, the costs incurred by Putnam Management in providing services to the fund, and the application of certain reductions and waivers noted below; and
• That the fee schedule in effect for your fund represented an appropriate sharing between fund shareholders and Putnam Management of such economies of scale as may exist in the management of the fund at current asset levels.
These conclusions were based on a comprehensive consideration of all information provided to the Trustees and were not the result of any single factor. Some of the factors that figured particularly in the Trustees’ delib-erations and how the Trustees considered these factors are described below, although individual Trustees may have evaluated the informa-tion presented differently, giving different weights to various factors. It is also important to recognize that the management arrangements for your fund and the other Putnam funds are the result of many years of review and discussion between the Independent Trustees and Putnam Management, that some aspects of the arrangements may receive greater scrutiny in some years than others, and that the Trustees’ conclu-sions may be based, in part, on their consideration of fee arrangements in previous years. For example, with some minor exceptions, the funds’ current fee arrangements under the management contracts were first implemented at the beginning of 2010 following extensive review by the Contract Committee and discussions with representatives of Putnam Management, as well as approval by shareholders.
Management fee schedules and total expensesThe Trustees reviewed the management fee schedules in effect for all Putnam funds, including fee levels and breakpoints. The Trustees also reviewed the total expenses of each Putnam fund, recognizing that in most cases management fees represented the major, but not the sole, determinant of total costs to fund shareholders. (Two funds have imple-mented so-called “all-in” management fees covering substantially all routine fund operating costs.)
In reviewing fees and expenses, the Trustees generally focus their atten-tion on material changes in circumstances — for example, changes in assets under management, changes in a fund’s investment strategy, changes in Putnam Management’s operating costs or profitability, or changes in competitive practices in the mutual fund industry — that suggest that consideration of fee changes might be warranted. The Trustees concluded that the circumstances did not indicate that changes to the management fee structure for your fund would be appropriate at this time.
Under its management contract, your fund has the benefit of break-points in its management fee schedule that provide shareholders with economies of scale in the form of reduced fee rates as assets under management in the Putnam family of funds increase. The Trustees concluded that the fee schedule in effect for your fund represented an appropriate sharing of economies of scale between fund shareholders and Putnam Management.
As in the past, the Trustees also focused on the competitiveness of each fund’s total expense ratio. In order to support the effort to have fund expenses meet competitive standards, the Trustees and Putnam Manage-ment and the funds’ investor servicing agent, Putnam Investor Services, Inc. (“PSERV”), have implemented expense limitations that were in effect during your fund’s fiscal year ending in 2018. These expense limitations were: (i) a contractual expense limitation applicable to all open-end funds of 25 basis points on investor servicing fees and expenses and (ii) a contractual expense limitation applicable to specified open-end funds, including your fund, of 20 basis points on so-called “other expenses” (i.e.,
Trustee approval of management contract
Putnam VT International Growth Fund 17
all expenses exclusive of management fees, distribution fees, investor servicing fees, investment-related expenses, interest, taxes, brokerage commissions, acquired fund fees and expenses and extraordinary expenses). These expense limitations attempt to maintain competitive expense levels for the funds. Most funds had sufficiently low expenses that these expense limitations were not operative during their fiscal years ending in 2018. However, in the case of your fund, the second of the expense limitations applied during its fiscal year ending in 2018. Putnam Management and PSERV have agreed to maintain these expense limi-tations until at least April 30, 2021. In addition, Putnam Management contractually agreed to waive fees and/or reimburse expenses of your fund to the extent that expenses of the fund (excluding payments under the fund’s distribution plans, brokerage, interest, taxes, investment-related expenses, extraordinary expenses, and acquired fund fees and expenses) would exceed an annual rate of 1.09% of its average net assets through at least April 30, 2021. During its fiscal year ending in 2018, your fund’s expenses were reduced as a result of this expense limitation. The support of Putnam Management and PSERV for these expense limita-tion arrangements was an important factor in the Trustees’ decision to approve the continuance of your fund’s management, sub-management and sub-advisory contracts.
The Trustees reviewed comparative fee and expense information for a custom group of competitive funds selected by Broadridge Financial Solutions, Inc. (“Broadridge”). This comparative information included your fund’s percentile ranking for effective management fees and total expenses (excluding any applicable 12b-1 fees), which provides a general indication of your fund’s relative standing. In the custom peer group, your fund ranked in the fifth quintile in effective management fees (determined for your fund and the other funds in the custom peer group based on fund asset size and the applicable contractual management fee schedule) and in the fourth quintile in total expenses (excluding any applicable 12b-1 fees) as of December 31, 2018. The first quintile represents the least expensive funds and the fifth quintile the most expensive funds. The fee and expense data reported by Broadridge as of December 31, 2018 reflected the most recent fiscal year-end data available in Broadridge’s database at that time.
In connection with their review of fund management fees and total expenses, the Trustees also reviewed the costs of the services provided and the profits realized by Putnam Management and its affiliates from their contractual relationships with the funds. This information included trends in revenues, expenses and profitability of Putnam Manage-ment and its affiliates relating to the investment management, investor servicing and distribution services provided to the funds. In this regard, the Trustees also reviewed an analysis of Putnam Management’s reve-nues, expenses and profitability, allocated on a fund-by-fund basis, with respect to the funds’ management, distribution, and investor servicing contracts. For each fund, the analysis presented information about reve-nues, expenses and profitability for each of the agreements separately and for the agreements taken together on a combined basis. The Trustees concluded that, at current asset levels, the fee schedules in place repre-sented reasonable compensation for the services being provided and represented an appropriate sharing between fund shareholders and Putnam Management of such economies of scale as may exist in the management of the Putnam funds at that time.
The information examined by the Trustees in connection with their annual contract review for the Putnam funds included information regarding fees charged by Putnam Management and its affiliates to institutional clients, including defined benefit pension and profit-sharing plans and
sub-advised mutual funds. This information included, in cases where an institutional product’s investment strategy corresponds with a fund’s strategy, comparisons of those fees with fees charged to the Putnam funds, as well as an assessment of the differences in the services provided to these different types of clients as compared to the services provided to the Putnam funds. The Trustees observed that the differences in fee rates between these clients and the Putnam funds are by no means uniform when examined by individual asset sectors, suggesting that differences in the pricing of investment management services to these types of clients may reflect, among other things, historical competitive forces operating in separate markets. The Trustees considered the fact that in many cases fee rates across different asset classes are higher on average for mutual funds than for institutional clients, and the Trustees also considered the differences between the services that Putnam Management provides to the Putnam funds and those that it provides to its other clients. The Trustees did not rely on these comparisons to any significant extent in concluding that the management fees paid by your fund are reasonable.
Investment performanceThe quality of the investment process provided by Putnam Management represented a major factor in the Trustees’ evaluation of the quality of services provided by Putnam Management under your fund’s manage-ment contract. The Trustees were assisted in their review of the Putnam funds’ investment process and performance by the work of the invest-ment oversight committees of the Trustees and the full Board of Trustees, which meet on a regular basis with the funds’ portfolio teams and with the Chief Investment Officers and other senior members of Putnam Management’s Investment Division throughout the year. The Trustees concluded that Putnam Management generally provides a high-quality investment process — based on the experience and skills of the indi-viduals assigned to the management of fund portfolios, the resources made available to them, and in general Putnam Management’s ability to attract and retain high-quality personnel — but also recognized that this does not guarantee favorable investment results for every fund in every time period.
The Trustees considered that, after a strong start to the year, 2018 was a mixed year for The Putnam Funds, with the Putnam open-end Funds’ performance, on an asset-weighted basis, ranking in the 54th percentile of their Lipper Inc. (“Lipper”) peers (excluding those Putnam funds that are evaluated based on their total returns versus selected investment benchmarks). The Trustees also noted that The Putnam Funds were ranked by the Barron’s/Lipper Fund Families survey as the 41st-best performing mutual fund complex out of 57 complexes for the one-year period ended December 31, 2018 and the 29th-best performing mutual fund complex out of 55 complexes for the five-year period ended December 31, 2018. The Trustees observed that The Putnam Funds’ performance over the longer-term continued to be strong, ranking 6th out of 49 mutual fund complexes in the survey over the ten-year period ended 2018. In addition, the Trustees noted that 22 of the funds were four- or five-star rated by Morningstar Inc. at the end of 2018. They also noted, however, the disappointing investment performance of some funds for periods ended December 31, 2018 and considered information provided by Putnam Management regarding the factors contributing to the under-performance and actions being taken to improve the performance of these particular funds. The Trustees indicated their intention to continue to monitor closely the performance of those funds, including the effec-tiveness of any efforts Putnam Management has undertaken to address underperformance and whether additional actions to address areas of underperformance are warranted.
18 Putnam VT International Growth Fund
For purposes of the Trustees’ evaluation of the Putnam Funds’ invest-ment performance, the Trustees generally focus on a competitive industry ranking of each fund’s total net return over a one-year, three-year and five-year period. For a number of Putnam funds with relatively unique investment mandates for which Putnam Management informed the Trustees that meaningful competitive performance rankings are not considered to be available, the Trustees evaluated performance based on their total gross and net returns and comparisons of those returns with the returns of selected investment benchmarks. In the case of your fund, the Trustees considered that its class IA share cumulative total return performance at net asset value was in the following quartiles of its Lipper peer group (Lipper VP (Underlying Funds) — International Multi-Cap Growth Funds) for the one-year, three-year and five-year periods ended December 31, 2018 (the first quartile representing the best-performing funds and the fourth quartile the worst-performing funds):
One-year period Three-year period Five-year period
4th 4th 4th
Over the one-year, three-year and five-year periods ended December 31, 2018, there were 78, 72 and 72 funds, respectively, in your fund’s Lipper peer group. (When considering performance information, share-holders should be mindful that past performance is not a guarantee of future results.)
The Trustees expressed concern about your fund’s fourth quartile performance over the one-year, three-year and five-year periods ended December 31, 2018 and considered the circumstances that may have contributed to this disappointing performance. The Trustees noted that Putnam Management believed that the fund’s fourth quartile perfor-mance was driven by several factors. The Trustees considered Putnam Management’s observation that security selection within certain sectors (particularly, the consumer discretionary and industrials sectors) and an overweight allocation to smaller-cap stocks detracted from the fund’s performance. The Trustees additionally noted Putnam Management’s view that the fund’s focus on companies priced attractively with strong growth prospects detracted from the fund’s performance in 2016 and the second half of 2018, during which an economic slowdown and concerns regarding deflation drove the outperformance of higher quality stocks with lower growth prospects.
The Trustees noted the fund’s stronger performance in 2017 when the economic environment was more favorable for growth stocks. The Trustees considered that Putnam Management remained confident in the fund’s portfolio manager. The Trustees also considered Putnam Management’s continued efforts to support fund performance through initiatives including structuring compensation for portfolio managers and research analysts to enhance accountability for fund performance, emphasizing accountability in the portfolio management process, and affirming its commitment to a fundamental-driven approach to investing. The Trustees noted further that Putnam Management had made selective hires in 2018 to strengthen its investment team.
As a general matter, the Trustees believe that cooperative efforts between the Trustees and Putnam Management represent the most effective way
to address investment performance concerns that may arise from time to time. The Trustees noted that investors in the Putnam funds have, in effect, placed their trust in the Putnam organization, under the over-sight of the funds’ Trustees, to make appropriate decisions regarding the management of the funds. Based on Putnam Management’s willing-ness to take appropriate measures to address fund performance issues and Putnam Management’s responsiveness to Trustee concerns about investment performance, the Trustees concluded that it continues to be advisable to seek change within Putnam Management to address perfor-mance shortcomings. In the Trustees’ view, the alternative of engaging a new investment adviser for an underperforming fund, with all the atten-dant risks and disruptions, would not likely provide any greater assurance of improved investment performance.
Brokerage and soft-dollar allocations; investor servicingThe Trustees considered various potential benefits that Putnam Manage-ment may receive in connection with the services it provides under the management contract with your fund. These include benefits related to brokerage allocation and the use of soft dollars, whereby a portion of the commissions paid by a fund for brokerage may be used to acquire research services that are expected to be useful to Putnam Manage-ment in managing the assets of the fund and of other clients. Subject to policies established by the Trustees, soft dollars generated by these means are used predominantly to acquire brokerage and research services (including third-party research and market data) that enhance Putnam Management’s investment capabilities and supplement Putnam Management’s internal research efforts. However, the Trustees noted that a portion of available soft dollars continues to be used to pay fund exp enses. The Trustees indicated their continued intent to monitor regulatory and industry developments in this area with the assistance of their Brokerage Committee. The Trustees also indicated their continued intent to monitor the allocation of the Putnam funds’ brokerage in order to ensure that the principle of seeking best price and execution remains paramount in the portfolio trading process.
Putnam Management may also receive benefits from payments that the funds make to Putnam Management’s affiliates for investor or distri-bution services. In conjunction with the annual review of your fund’s management, sub-management and sub-advisory contracts, the Trustees reviewed your fund’s investor servicing agreement with PSERV and its distributor’s contracts and distribution plans with Putnam Retail Management Limited Partnership (“PRM”), both of which are affiliates of Putnam Management. The Trustees concluded that the fees payable by the funds to PSERV and PRM, as applicable, for such services are fair and reasonable in relation to the nature and quality of such services, the fees paid by competitive funds, and the costs incurred by PSERV and PRM, as applicable, in providing such services. Furthermore, the Trustees were of the view that the services provided were required for the operation of the funds, and that they were of a quality at least equal to those provided by other providers.

Putnam VT International Growth Fund 19
This page intentionally left blank.

20 Putnam VT International Growth Fund
This page intentionally left blank.
Putnam VT International Growth Fund 21
Investment ManagerPutnam Investment Management, LLC100 Federal StreetBoston, MA 02110
Investment Sub-AdvisorsPutnam Investments Limited16 St James’s StreetLondon, England SW1A 1ER
The Putnam Advisory Company, LLC100 Federal StreetBoston, MA 02110
Marketing ServicesPutnam Retail Management100 Federal StreetBoston, MA 02110
Investor Servicing AgentPutnam InvestmentsMailing address:P.O. Box 219697Kansas City, MO 64121-96971-800-225-1581
CustodianState Street Bank and Trust Company
Legal CounselRopes & Gray LLP
TrusteesKenneth R. Leibler, ChairLiaquat AhamedRavi AkhouryBarbara M. BaumannKatinka DomotorffyCatharine Bond HillPaul L. JoskowRobert E. PattersonGeorge Putnam, IIIRobert L. ReynoldsManoj P. Singh
Other important informationProxy votingPutnam is committed to managing our mutual funds in the best interests of our shareholders. The Putnam funds’ proxy voting guidelines and proce-dures, as well as information regarding how your fund voted proxies relating to portfolio securities during the 12-month period ended June 30, 2019, are available in the Individual Investors section of putnam.com and on the Securities and Exchange Commission’s (SEC) website at www.sec.gov. If you have questions about finding forms on the SEC’s website, you may call the SEC at 1-800-SEC-0330. You may also obtain the Putnam funds’ proxy voting guidelines and procedures at no charge by calling Putnam’s Shareholder Services at 1-800-225-1581.
Fund portfolio holdingsThe fund will file a complete schedule of its portfolio holdings with the SEC for the first and third quarters of each fiscal year on Form N-PORT within 60 days of the end of such fiscal quarter. Shareholders may obtain the fund’s Form N-PORT from the SEC’s website at www.sec.gov.
Prior to its use of Form N-PORT, the fund filed its complete schedule of its portfolio holdings with the SEC on Form N-Q, which is available online at www.sec.gov.
Fund information
The fund’s Statement of Additional Information contains additional information about the fund’s Trustees and is available without charge upon request by calling 1-800-225-1581.

This report has been prepared for the shareholders of Putnam VT International Growth Fund.
TR514 VTSA010 317445 8/19