putting a price on carbon: reducing emissions · carbon tax or a cap-and-trade program—can help...
TRANSCRIPT

PUTTING A PRICE ON CARBON: REDUCING EMISSIONSNOAH KAUFMAN, MICHAEL OBEITER, AND ELEANOR KRAUSE
EXECUTIVE SUMMARY
The United States will need new legislation to achieve its long-term target of reducing greenhouse gas (GHG) emissions by more than 80 percent by 2050. In this issue brief, we show how a national carbon price—in the form of either a carbon tax or a cap-and-trade program—can help the United States achieve this target by inducing emissions reductions in sectors across the economy.
When GHG emissions are unpriced, the costs of climate change are borne by third parties unrelated to the activities generating the emissions. A carbon price shifts these costs from society as a whole to those who buy and sell carbon-intensive products. In every energy-intensive sector of the economy, opportunities exist for individuals and businesses to adjust their behavior in ways that reduce emissions. When carbon is priced more appropriately, many buyers and sellers will be guided by financial self-interest to do so.
ISSUE BRIEF
WRI.ORG

2 |
1 Executive Summary
5 Introduction
6 Economics of Emissions Reductions From a Carbon Price
6 Mechanisms for Emissions Reductions Across Sectors
7 Electricity Sector
18 Transportation Sector
25 Summary of Economy-Wide Emissions Reductions
27 Reducing Emissions with Carbon Taxes and Cap-and-Trade
29 Discussion
30 References
33 Endnotes
CONTENTSThe electricity sector offers the greatest potential for major, and immediate, change. A strong carbon price will make many coal-fired power plants more expensive than their competition, and systems are in place to ensure that lower-carbon generation alternatives are dis-patched and built. Higher prices will also encourage consumers to use less electricity and producers to develop new clean energy technologies and improve existing technologies like solar and wind energy.
Emissions reductions outside of the electricity sector may occur more gradually. In the transporta-tion sector, substitutes for gasoline and diesel fuel may currently be too expensive for a carbon price to induce a large behavioral shift. Auto manufacturers are relatively locked-in to current production lines, and consumers take time to re-evaluate their transportation purchasing deci-sions. Short-term increases in gaso-line prices have not led to significant changes in behavior but a sustained signal in the form of a carbon price encourages consumers to seek out less carbon-intensive transportation alternatives, and encourages produc-ers to develop fuel-efficient vehicles.
Additional policies can play impor-tant roles in complementing a carbon price in situations where price signals are likely to be ineffective or insufficient. For example, without funding for research, development and deployment (RD&D), the private sector underinvests in energy RD&D because the benefits of these invest-ments are shared with society as a whole. Support for clean energy RD&D can help to spur the tech-nological advancements needed to
achieve long-term emissions tar-gets, and a carbon price can help to ensure that a market exists for such technologies once they are devel-oped. Another example is energy efficiency programs and standards, which can encourage cost-effective energy-saving activities that would otherwise be ignored due to a lack of information or misaligned incen-tives. Finally, because a carbon price must be implemented by Congress, the price may be set at a level that is lower than ideal, and complementary policies will be needed to stimulate the necessary action.
However, compared to alternative approaches to reducing emissions, carbon pricing is more effective and less expensive. Unlike a carbon price, performance standards encourage emissions reductions from certain sources but not others. Technology standards, renewable portfolio standards, and clean-energy standards all encourage low-carbon electricity production, but they do not encourage consumers to use less electricity. Energy-efficiency programs are undermined by the “rebound effect”: in the absence of a carbon price, consumers will use these efficient products more often. And finally, targeted subsidies require the government to forecast the most effective technologies, effectively, to “pick winners”; they run the risk of government backing the “wrong” technologies.
Forecasts from energy/economic models are highly influential in shaping opinions on the effective-ness of carbon pricing in reducing emissions, and no analysis is more influential than U.S. Energy Informa-tion Administration's (EIA's) Annual

Putting a Price on Carbon: Reducing Emissions
ISSUE BRIEF | January 2016 | 3
Energy Outlook (AEO). EIA’s AEO 2014 analysis shows that if a $25 per metric ton carbon price were implemented this year on energy sector CO2 emissions and increased by 5 percent per year, emissions would fall 22 percent below a refer-ence scenario (with no carbon price) and 27 percent below 2005 levels by 2025. Comparable energy/economic models have shown similar results. But EIA’s forecasts are conserva-tive—they portray only the emissions reductions that are virtually certain to take place under a carbon price,
while accounting for few emissions reductions that are encouraged but less predictable. Figure ES-1 dis-plays EIA’s forecasts of emissions across sectors for its carbon pricing scenario and its reference scenario (identical except no carbon price). The response to a carbon price out-side of the electricity sector is almost trivially small, despite the financial incentives for individuals and busi-nesses to change their behavior in all energy-intensive sectors. In other words, with minor exceptions, EIA assumes that households and busi-
nesses will not respond to increasing heating bills, manufacturers will not adjust to rising input costs, and neither producers nor consumers will adjust to the increased costs of transportation fuels. In addition, EIA assumes very little technological progress—for example, solar energy does not become significantly less expensive than it is today, advanced “smart grids” do not enable consum-ers to respond more rapidly to price signals, and alternative-fuel vehicles remain uncompetitive with gasoline-powered vehicles.
FIG
UR
E ES
-1
EIA’S PESSIMISTIC FORECAST OF CO2 EMISSIONS REDUCTIONS FROM A CARBON PRICE
Notes: Data from EIA’s Annual Energy Outlook 2014. EIA Reference Case (dark + light blue) scenario is a forecast of the U.S. energy system assuming only “on the books” policies as of late 2013, and its carbon pricing scenario (light blue area only) scenario reflects a $25 per metric ton carbon price implemented in 2015 and increasing 5% per year thereafter. Emissions from the transportation, industrial, commercial, and residential sectors exclude emissions from electricity generation.
0
1
2
3
4
5
6
2015 2020 2025 2030
Ener
gy S
ecto
r CO 2 E
mis
sion
s (b
illio
n m
etric
tons
)
OTHER COVERED SECTORS (INDUSTRIAL, COMMERCIAL, RESIDENTIAL): Remaining Emissions
TRANSPORTATION SECTOR: Remaining Emissions
ELECTRICITY SECTOR: Remaining Emissions
ELECTRICITY SECTOR: Reductions (due to a carbon price)
TRANSPORTATION SECTOR: Emissions Reductions
OTHER COVERED SECTORS: Emissions Reductions
EIA forecast total emissions of 28% below
Reference Case and 32% below 2005 levels
after 15 years

4 |
If, instead, producers and consumers across the economy respond to incentives, and if recent progress in clean energy technologies continues, the EIA’s forecast greatly underestimates the effectiveness of a carbon price at reducing emissions.
While real-world experience with strong economy-wide carbon prices is limited, the existing empirical evidence suggests that price signals cause significant behavioral changes both within and outside of the electricity sector. In British Columbia, a carbon tax of C$10 per metric ton was implemented in 2008 and increased by C$5 per year until 2012. Over those five years, despite starting with over 90 percent renewable electricity generation and very little fossil-fuel generation (the “low-hanging fruit”), CO2 emissions in British Columbia decreased by 5 to 15 percent compared to a no-policy scenario (Murray and Rivers 2015), and the decline in gasoline usage has been over five times larger than expected (Rivers and Schaufele 2014). In the United States, a combination of lower natural gas prices and environmental regulations has increased the relative cost of coal generation in recent years, leading to a decline in coal usage from about 50 percent of U.S. electricity generation in 2008 to under 40 percent in 2014.1 There is little doubt that a strong national carbon price would cause a rapid acceleration of this trend, thus reducing CO2 emissions, just as EIA’s analysis predicts.
We conclude that a strong carbon price is a reliable policy for the United States, which can serve as the centerpiece of wider efforts to achieve national emissions targets, for the following key reasons:
▪ The near certain emissions reductions are sufficient to make meaningful progress toward achieving the U.S. emissions reduction targets;
▪ The broad-based incentives encourage countless additional emissions reductions across the economy as well as innovation in clean energy technologies; and
▪ Emissions reductions are cost-effective, because only actions less expensive than the carbon price are encouraged, and tax/auction revenues can be used for other productive purposes.
Carbon taxes and cap-and-trade programs differ in the ways in which they lead to emissions reductions. A cap-and-trade program can promise a precise level of emissions reductions with near certainty, whereas a carbon tax cannot. However, unless a carbon tax is severely less effective than expected, the benefit of precise emissions forecasts (at the national level) diminishes in importance, given the much larger uncertainties related to the effects of global climate change. As we show, if policy expectations are based on the results of energy/economic models, a carbon tax is more likely to lead to larger-than-expected emissions reductions. Nevertheless, in our judgment, the similarities between carbon taxes and cap-and-trade programs far outweigh their differences. Both policies encourage cost-effective emissions reductions in energy-intensive sectors across the economy. Either policy can play an important role in driving the energy transformation needed if the United States is to achieve its long-run emissions objectives.

Putting a Price on Carbon: Reducing Emissions
ISSUE BRIEF | January 2016 | 5
INTRODUCTION Last year, WRI published Putting a Price on Carbon: A Handbook for U.S. Policymakers, which provides a summary of the key issues associated with a national carbon price in the United States. Building on the information provided in the Handbook, WRI is releasing a series of issue briefs that will provide a more in-depth analysis of specific topics of particular importance. In this issue brief, we describe how a national carbon price will lead to lower greenhouse gas emissions across the U.S. economy.
The major countries of the world have committed to keeping the average global temperature change within 2 degrees Celsius above pre-industrial levels to avoid the worst effects of climate change (UNFCCC 2009). To do its part, the United States has com-mitted to reducing its greenhouse gas emissions by 26 to 28 percent below 2005 levels by 2025 and 83 percent by 2050 (UNFCCC 2009). As WRI has shown in previous work, staying on track to achieve the deeper emis-sions reductions will require substan-tial policy action beyond the current
authority of the federal government (Hausker et al. 2015).
The concept of putting a price on activities that produce environmental damages dates back nearly a century and, in the next section of this issue brief of this Issue Brief, we provide an overview of the general theory of emissions reductions under a carbon price. The economic theory is both simple and compelling: greenhouse gas emissions lead to the harmful impacts of climate change. Pricing greenhouse gas emissions shifts these costs away from the broader society to those responsible for the emissions. The resulting higher prices of carbon-intensive goods and services provide incentives to reduce emissions, with higher carbon prices leading to larger emissions reductions.
We then describe how and when, we describe how and when emissions reductions from a national carbon price are likely to take place in key sectors. We show that a strong car-bon price will be transformative in the electricity sector where systems are in place to shift production away from high-carbon fuels when
it becomes cost-effective to do so. Change is likely to be more gradual in the transportation sector, where cost-effective alternatives to current modes of transportation are less prevalent. Households, businesses, and investors across a wide range of sectors will respond to a carbon price by shifting their business and investments to more cost-effective low-carbon alternatives, thus reduc-ing emissions.
Wherever possible, we include empiri-cal evidence on the emissions reduc-tions caused by carbon pricing or similar price signals. We also present forecasts of the effects of a national carbon price from the National Energy Modeling System (NEMS) of the U.S. Energy Information Administration (EIA), which is the country’s most fre-quently used and cited energy model. A common and valid concern about carbon pricing is that computer models cannot be relied upon to forecast emis-sions reductions with accuracy. Using the detailed EIA modeling results, we show that model forecasts of emissions reductions are conservative, in that they account almost exclusively for emissions reductions that are virtually certain to take place under a carbon
BOX
1 WHAT DO WE MEAN BY A CARBON PRICE?While there are other approaches to pricing carbon, in this Issue Brief, a carbon price refers to either a carbon tax (or fee) or a cap-and-trade pro-gram. A carbon tax directly establishes a price on carbon in dollars per ton of emissions, which is factored into the price of goods and services based on their carbon content. A cap-and-trade program establishes the price indirectly by placing a limit on the total quantity of emissions. This limit is enforced using tradable emission permits, typically called “allowances”, that any emissions source must own to cover its emissions. The market for these allowances creates the carbon price in a cap-and-trade program. Throughout most of this brief, we do not differentiate between carbon taxes and cap-and-trade programs, because both policies incentivize cost-effective emissions reductions at the rate of the carbon price. However, in two instances we stray from our general language of “carbon pricing.” We provide certin concrete examples of the lessons learned from prominent carbon taxes and cap-and-trade programs. Following the sector-specific discussions, we provide a brief description of the differences between carbon taxes and cap-and-trade programs in the context of this Issue Brief. For instance, a well-designed cap-and-trade program can ensure a given level of emissions reductions, whereas a carbon tax ensures a predictable price on carbon and encourages additional emissions reductions if technological progress or the response to the price signal is larger than anticipated.

6 |
price. Consequently, a carbon price is likely to be more effective at reducing emissions than the model predicts. Nevertheless, EIA modeling shows that even modest carbon prices would be sufficient to achieve substantial short-term emissions reductions, roughly in line with the U.S. targets.
These results, combined with the theoretical and empirical evidence showing how consumers and produc-ers are likely to respond to a carbon price, lead us to conclude that a well-designed carbon pricing policy can build on emissions reduction policies already in place and serve as the centerpiece of the U.S. strategy to achieve its long-term emissions reduction targets.
ECONOMICS OF EMISSIONS REDUCTIONS FROM A CARBON PRICEEconomists have long understood both the advantages and the limita-tions of markets. Price signals help to ensure that the amount of a good produced is roughly equal to the amount that consumers want to buy. If a product is scarce, its price increases, encouraging sellers to produce more and buyers to buy less. As long as consumers and producers incur the full cost of transactions, market prices will adjust to ensure that all parties affected by the trans-action come out ahead—buyers value the product more than the money they spend on it, and the price is suf-ficient to cover the costs of production. However, if the production or consumption of the product imposes costs for third parties, an unregu-lated market will not provide signals to sellers and buyers to account
for these costs. In such situations, government intervention may be warranted to ensure that produc-ers and consumers factor the third party-costs into their decisions. Otherwise, too much of the product will be produced and consumed. Unpriced CO2 emissions are a prime example of the full social cost of a product not being reflected in its market price. In the absence of climate change policy, when carbon-intensive goods are purchased, neither producers nor consumers pay for the damages caused by climate change. Instead, these damages are borne by society at large, which would be better off if fewer carbon-intensive products were used. Regulation to reduce CO2 emissions can take many forms. The govern-ment can subsidize lower-carbon products, it can mandate changes to higher-carbon products or ban them altogether, or it can impose a carbon price. A carbon price works by increasing the price of carbon-intensive products, which encour-ages consumers to purchase less of that product or a different product altogether, and it encourages produc-ers to develop less carbon-intensive products. Importantly, markets still function just as efficiently as they did before the carbon price was imposed, but polluters are now forced to pay for the damages to third parties caused by their activities. A national carbon price has two major benefits over alternative emissions reduction policies. First, it encourages emissions reductions wherever and however they can be achieved most cost-effectively. Miti-gation opportunities less expensive than the carbon price will be under-taken, because the regulated entity would prefer to reduce emissions,
rather than pay the carbon price. Alternative forms of regulations are likely to be more expensive, because regulators cannot accurately forecast which mitigation opportunities will be most cost-effective years ahead of time. Carbon pricing is somewhat unique in encouraging the lowest-cost emissions reduction opportuni-ties without anyone needing to know beforehand what these cost-effective solutions will be.
Second, a national carbon price can generate substantial government revenues that can be used in produc-tive ways,2 which might include: (1) compensating businesses or indi-viduals who are adversely affected by the higher prices; (2) promoting economic growth by lowering other taxes or reducing the deficit; and (3) investing in clean energy technolo-gies or climate change adaptation infrastructure. Studies have shown that the benefits to the economy of certain productive revenue uses can rival or outweigh the harm to the economy caused by a carbon price (Jorgenson et al. 2013).
MECHANISMS FOR EMISSIONS REDUCTIONS ACROSS SECTORSThe general theory of carbon pric-ing is applicable to any sector of the economy, but the specific mecha-nisms for emissions reductions differ across sectors. This section focuses on the emissions reductions that can be expected in two sectors—electric-ity and transportation—because they are the largest contributors to climate change, accounting for nearly 60 percent of total U.S. greenhouse gas emissions (Figure 1), and because these two sectors illustrate how the pace of change is likely to dif-

Putting a Price on Carbon: Reducing Emissions
ISSUE BRIEF | January 2016 | 7
FIG
UR
E 1
TOTAL U.S. GREENHOUSE GAS EMISSIONS BY SECTOR IN 2013
fer across sectors. At the end of the section, we provide a summary of the economy-wide effects.
We divide the sector discussions based on when emissions reduc-tions can be expected to take place in response to a carbon price. We identify four categories of rates of change. Emissions reductions take place in the “very short run” if pre-existing systems are in place to respond quickly to price changes. In the “short run”, households and busi-nesses can respond to price changes in some ways that reduce emissions, but they are inhibited by existing commitments; for example, business cannot replace inefficient facilities or major equipment overnight, and households purchase new vehicles and appliances only occasionally. In the “long run”, households and busi-nesses have full flexibility to change their behavior and equipment in response to economic opportuni-
Note: Calculations in terms of CO2-equivalent emissions
Source: U.S. Environmental Protection Agency (2013a)
ties. Finally, in the “very long run”, price changes induce technological progress, giving households and businesses access to lower-carbon goods and services than existed prior to the implementation of the policy. We do not attempt to precisely define the length of time for each of these periods. Still, we hope this frame-work will serve to elucidate the major similarities and differences in emis-sions reductions across sectors.
Electricity SectorThe electricity sector produces more greenhouse gas emissions than any other sector in the United States. Over four billion megawatt hours of electricity are produced each year, approximately two thirds of which are produced using fossil fuels (U.S. EIA 2015a). The result is over 2 billion metric tons of annual CO2-equivalent emissions, which comprise roughly one third of total U.S. greenhouse gas emissions (U.S. EPA 2013a).
For the United States to meet its emissions reduction targets, fossil-fuel usage in the electricity sector must be significantly curtailed. Fortunately, there are viable alter-natives. Nuclear energy provides nearly 20 percent of total electricity generation, and renewables provide another 13 percent (U.S. EIA 2015b). The amount of electricity produced by solar and wind energy in particu-lar has increased dramatically in the past decade as the costs of these technologies have plummeted (Feld-man et al. 2012), making them a more viable alternative to fossil-fuel generation each year.
Still, absent strong climate change policies, the transition away from fossil fuels is unlikely to occur quickly enough to enable the United States to achieve its emissions targets. Accounting for the effects of the Clean Power Plan (the regula-tion of greenhouse gas emissions from existing power plants), the U.S. Environmental Protection Agency (EPA) forecasts that fossil fuels will still comprise about 60 percent of U.S. electricity generation in 2030.As explained below, carbon pricing can have dramatic effects on emis-sions in the electricity sector. As soon as the policy is implemented, high-carbon generating units will operate less often because of higher operat-ing costs. The carbon price will also change decisions about how much electricity to consume, which plants to build, and what efficiency mea-sures to implement. Simultaneously, pricing carbon will induce invest-ments in low-carbon technologies, the development of which will be crucial if the United States is to meet its long-term emissions targets.
31% Electricity
9% Agriculture
12% Commercial & Residential
21% Industry
27% Transportation

8 |
Very Short-run Response to a Carbon Price in the Electricity SectorA carbon price translates societal costs of climate change into explicit costs to electricity producers, and the price of electricity will incorporate these additional costs. In response, some producers and consumers will adjust their behavior to save money, as they would in response to any other increase in costs. Unlike in other sectors, where change takes place gradually, the electricity sector has systems in place to adjust to the carbon price virtually immediately. In any power system, due to the difficulties of storing electricity, producers build sufficient generat-ing capacity to exceed customers’ maximum demand levels. As a result, significantly more resources are
usually available to serve customers than are needed on a daily basis. The resources operating at any given time depend on a multitude of fac-tors—including geographic location, the costs of starting and stopping power plants, and whether plants are engaged in a bilateral contract—but no factor is as important as operating costs (U.S. EIA 2012). In simplified terms, power plants with the lowest costs of operation are “dispatched” first, and those with higher costs are brought on line sequentially as demand increases (U.S. EIA 2012.) Because demand for electricity is constantly fluctuating, the dispatch of power plants changes frequently as well. Electricity grids are therefore designed to respond almost imme-diately to changes in the cost of fuel (due to a carbon price or any other
without carbonpricing
with carbonpricing
Renewables15 GW
15 GW
20 GW
20 GW
40 GW
15 GW
25 GW
50 GW
Nuclear
Coal
Natural Gas
$0
$10
$20
$30
$40
$50
$60
$70
0 10 20 30 40 50 60 70 80 90 100
Available Capacity (GW)
Dis
patc
h C
ost (
$/M
Wh)
Renewables
Nuclear
Coal (without carbon pricing)
Coal (with carbon pricing)Natural Gas (with
carbon pricing)
Natural Gas (without carbon pricing)
TOTA
L D
EMA
ND
: 10
0 G
W
FIG
UR
E 2
HYPOTHETICAL DISPATCH CURVES WITH AND WITHOUT A CARBON PRICE
reason). Figure 2 displays a hypo-thetical (and greatly oversimplified) electricity grid “dispatch curve,” with and without a carbon price.
Because a carbon price increases the costs of operating fossil-fuel units in proportion to the carbon content of the fuel, the primary consequence (in the very short run) is a reduc-tion in generation from coal units, which have the highest emissions rate of any electricity source. The biggest beneficiaries of this immedi-ate adjustment are natural gas units, whose operating costs (with no carbon price) are higher than coal plants on average (U.S. EIA 2015c) but, because of the lower carbon content of natural gas, pay a carbon price that is only 50 to 60 percent of the price paid by coal plants for the

Putting a Price on Carbon: Reducing Emissions
ISSUE BRIEF | January 2016 | 9
$2
$3
$4
$5
$6
$7
$8
30%
35%
40%
45%
50%
55%
60%
Natural Gas Price
Natu
ral G
as P
rice
($/1
000
cubi
c fe
et) Coal Usage (%
of total U.S. Generation)
Coal Usage
2009 2010 2011 2012 2013 2014 2015
same generation (U.S. EIA 2015d). Once built, the costs of operating nuclear and renewable energy units are typically much lower than those of coal or natural gas plants, so a carbon price will not significantly affect the usage of these units in the very short run (but a carbon price does incentivize the construction of more renewable plants, as explained below). Indeed, changes in operat-ing costs have caused large fluctua-tions in coal and natural gas usage
in recent years (see Box 2 below), confirming the intuition of Figure 2. Short-run Effects of Carbon Pricing in the Electricity SectorIn the short run, responses to a car-bon price in the electricity sector are somewhat constrained by existing commitments and the lags associated with construction and large pur-chases. Nevertheless, both producers and consumers will begin to change their behavior in the short run when
the costs of carbon-intensive goods and services increase.
Owners of electricity generation facilities can retrofit or refurbish fossil-fuel power plants so that they produce the same amount of electricity while burning less carbon. A coal plant operator will find that efficiency alternatives that were too costly without a carbon price are cost-effective with one. A study by Resources for the Future concluded
BOX
2 PRICE SIGNALS AND THE RECENT DECLINE IN COAL USAGEThe decline of coal usage in recent years is primarily due to the responses of the electricity system to price signals (although environmental regulations have contributed as well) (Burtraw et al. 2012). The influx of shale gas caused the price of natural gas to fall precipitously in 2010 and 2011, both in absolute terms and relative to coal prices (which remained relatively flat). As a result, natural gas generation was used more frequently at times and in places where previously coal units had been used. Coal usage rebounded in 2012/2013 as natural gas prices increased. Figure 3 shows the correlation between natural gas prices and coal usage, illustrating just how rapidly coal usage declines when it is no longer a low-cost option.
While these changes were unrelated to climate change regulations, the implementation of a carbon price would provide a similar price signal, raising the price of coal compared to natural gas, and causing emissions to fall immediately due to the reduced coal usage (Jorgenson et al. 2013). This is precisely what happened in the first year of the European Union’s cap-and-trade program (the EU-ETS), where carbon prices of 20 to 30 Euro per metric ton (Ellerman and Joskow 2008) caused a shift from coal to gas generation that led to emissions reductions of 4 to 5 percent (Laing et al. 2013).
Notes: Data from the U.S. Energy Information AdministrationPrices are for natural gas used by electric generators.
FIGURE 3: RELATIONSHIP BETWEEN PRICE OF NATURAL GAS AND COAL GENERATION IN THE UNITED STATES

10 |
that a carbon price of $10 per metric ton would lead to reductions in emissions rates at coal plants of 1 to 2 percent, with higher prices leading to greater efficiencies (Linn et al. 2014). Because the carbon price also encourages reduced usage of coal-fired power plants, the efficiency gains will lead to emissions reductions (in contrast, policies that mandate efficiency improvements can encourage coal units to operate more often, because more efficient plants are less costly to operate) (Linn et al. 2014).
A carbon price also affects electricity consumption decisions. When the price of electricity increases, con-sumers tend to use less of it (EPRI 2008). Lower demand for electricity
will typically lead to a fall in usage of fossil-fuel power plants because they have the highest operating costs. Reduced electricity usage also implies lower electricity bills, and the net effect of a carbon price on electricity bills depends on the extent to which consumers respond to the price change.3
Economists have exhaustively studied the extent to which electricity demand decreases when prices increase (referred to as the “price elasticity of demand”). Table 1 displays the results of recent studies of the short-run (i.e. usually within the first few years, although definitions vary) and long-run responsiveness of U.S. electricity consumers to electricity price
changes. In the short run, consumers respond to changes in electricity prices by reducing their demand for electricity, but they do not respond as much as they do over longer periods, when consumers have had the opportunity to invest in more efficient machinery and appliances.
Short-run elasticities between −0.1 and −0.4 imply that a 10 percent price increase would only lead to a 1−4 percent reduction in electricity use. Some consumers may at first perceive the price change to be tem-porary (if they notice it at all), and others may not adjust their behavior until they purchase new equipment or appliances.
PRICE ELASTICITIES OF DEMAND FOR ELECTRICITY
TABL
E 1
Notes: A price elasticity demand of −0.2 implies that a 10% increase in electricity price leads to a 2% decrease in demand. Data from Paul, Myers, and Palmer (2009), Bernstein and Griffin (2005), and EPRI (2008). Methodology and assumptions differ across studies.
Study Short-run Long-run
RESIDENTIAL CUSTOMERS: NREL (2006) −0.24 −0.32
EPRI (2008) −0.30 −0.90
Paul, Myers, and Palmer (2009) −0.13 −0.40
Bernstein and Griffin (2005) −0.24 −0.32
Dahl and Roman (2004) −0.23 −0.43
Espey and Espey (2004) −0.35 −0.85
COMMERCIAL CUSTOMERS: NREL (2006) −0.21 −0.97
EPRI (2008) −0.30 −1.00
Paul, Myers, and Palmer (2009) −0.11 −0.29
Bernstein and Griffin (2005) −0.21 −0.97
INDUSTRIAL CUSTOMERS: EPRI (2008) −0.20 −1.20
Paul, Myers, and Palmer (2009) −0.16 −0.40
Dahl and Roman (2004) −0.14 −0.56

Putting a Price on Carbon: Reducing Emissions
ISSUE BRIEF | January 2016 | 11
Long-run Effects of Carbon Pricing in the Electricity SectorIn the long run, consumers are more responsive to a carbon price, in large part because they are less constrained by currently installed technologies. The long-run price elasticities in Table 1 imply that a 10 percent elec-tricity price increase will lead to an average of 3 to 12 percent reductions in electricity use. Such a wide range should not be surprising, consider-ing the diversity of consumers and electricity uses across the economy.
Consumer responses to a carbon price may be larger than are sug-gested by these empirical estimates based on general electricity price changes, for several reasons. First, a carbon price may be perceived as more permanent, which could cause consumers to change their behavior rather than wait for tem-porary price increases to subside. In addition, the salience of the tax may coax consumers into fundamentally reducing electricity consumption, either to save money or for altruistic reasons (Chetty et al. 2007). The UK introduced a “Climate Change Levy” in 2001 that taxed electricity use at roughly 10 percent. A study of manu-facturing plants and other commer-cial users found that electricity use declined by over 22 percent at plants subject to the tax compared to plants that were eligible to opt out (Martin et al. 2011), which implies a much larger response than the elasticities presented above. (The authors of the study caution that some of this shift away from electricity in the UK may have been toward gas and coal, which were taxed at lower rates, thus offsetting the emissions reductions from the policy.) Finally, prog-ress with “smart grids” and home energy management products could
enable individuals and businesses to respond more efficiently to price signals than they have in the past.
A carbon price will also have long-run effects on electricity production. Hundreds of new electricity generat-ing units are brought online each year in the United States, either to meet additional demand for electric-ity or to replace older generating units (U.S. EIA 2015e). A carbon price would have a substantial impact on decisions regarding which plants are most cost-effective to build and operate over their lifetimes. A useful (though imperfect) metric to compare the costs of different types of new power plants is the levelized cost of electricity (LCOE), which depicts the lifetime costs of produc-
ing a given amount of electricity, including the costs of building and operating the plant. Figure 4 displays LCOE estimates from the company Lazard, with and without illustrative carbon prices of $25 and $50 per metric ton. Coal plants are omitted because few are likely to be built in the United States going forward.4
Figure 4 shows that with a carbon price, wind and solar become more competitive with natural gas, which has been the dominant source of fossil-fuel electricity being added to the grid for more than a decade (Shellenberger et al. 2014). While (unsubsidized) solar would remain more expensive than natural gas in some regions of the country at today’s prices, this will change if the
BOX
3 CARBON PRICING AND THE CLEAN POWER PLAN
U.S. EPA finalized the Clean Power Plan (CPP) in August 2015 to fulfill its obligation to regulate greenhouse gas emissions from existing power plants. Under the CPP, states must meet emissions or emissions-rate targets between 2022 and 2030. Modeling by EPA projects that, with the CPP in effect, emissions in the power sector will fall 30 percent below 2005 levels by 2030.
States have significant flexibility to design their own implementation plans, which must be proposed to EPA by September 2016 (with extensions available to 2018). Carbon pricing programs are encouraged by EPA—particularly cap-and-trade programs, but also carbon taxes or fees—and many states are likely to take advantage of that option. The linking of state programs is also encouraged by allowing states to trade emissions allowances. Califor-nia and the northeastern states that comprise the Regional Greenhouse Gas Initiative (RGGI) can comply with the CPP using their pre-existing cap-and-trade programs (or modified ver-sions of these programs). The number of carbon pricing programs in the country may grow substantially if additional states elect to comply using cap-and-trade or carbon taxes.
Well-designed carbon pricing programs will lead to less expensive emissions reduc-tions compared to alternative state implementation plans. They may provide revenues that can be used to reduce taxes or invest in clean energy, among other possibilities (although states may instead choose to freely allocate allowances to regulated entities under cap-and-trade, in which case there would be no government revenues from the program). Carbon pricing programs would also encourage technological progress, enabling states to achieve emissions reductions beyond those required by the CPP.

12 |
FIG
UR
E 4
LEVELIZED COST OF ELECTRICITY (UNSUBSIDIZED) WITH AND WITHOUT ILLUSTRATIVE CARBON PRICES
Notes: Data and assumptions from Lazard Levelized Cost of Energy Analysis, Version 9.0, November 2015.The levelized costs do not factor in any effects of U.S. federal tax subsidies or reliability-related concerns.
$ pe
r MW
h
Natural gas(combined cycle)
Nuclear Wind Solar photovoltaic(utility-scale)
Levelized cost without tax ($/MWh)
Levelized cost with a $25 per ton carbon price
Levelized cost with a $50 per ton carbon price
0
25
50
75
100
125
150
cost of solar energy continues to fall (Feldman et al. 2012). Building wind and solar units in lieu of natural gas plants avoids decades of emissions that would come from those plants (although it also introduces chal-lenges associated with more unpre-dictable generation sources).
Forecasts of Emissions Reductions in the Electricity Sector A carbon price will cause grid operators to dispatch lower-carbon generation alternatives, producers to retrofit existing power plants and build new lower-carbon plants, and consumers to use less electricity. Taken together, these actions will lead to substantial emissions reduc-tions in the electricity sector.
U.S. EIA estimated the effects of a national carbon price in its 2014 Annual Energy Outlook Report (U.S. EIA 2014a).5 EIA’s modeling is widely cited and highly influential, and its results are broadly similar to other prominent energy/economic models (Fawcett et al. 2015) (many of which rely in part on information from EIA). We display results for EIA’s carbon price scenarios that start at a price of $25 per metric ton (in 2012 dollars) in 2015, growing at 5 percent per year. This carbon price trajectory is comparable to certain projections of carbon prices from the cap-and-trade program that passed the U.S. House of Representatives in 2009 (as part of the American Clean Energy and Security Act, commonly known as “Waxman-Markey”) (U.S.
EIA 2009). However, the price trajectory is low compared to econo-mists’ and scientists’ best estimates of the carbon prices needed to achieve long-term emissions tar-gets.6 While implementation of a national economy-wide carbon price in the next few years is unlikely, EIA’s results should be viewed as illustrative of how a model of the U.S. economy and energy system forecasts the impacts of a carbon price over the first 10 to 15 years of implementation.
Table 2 displays the results of EIA’s analysis for the electricity sector. Retail electricity prices increase by 14 percent in 2030 compared to the Reference Case (which differs only in its lack of a carbon price), leading

Putting a Price on Carbon: Reducing Emissions
ISSUE BRIEF | January 2016 | 13
to a reduction in electricity usage of 6 percent. Recall that the best estimates of long-run price elastici-ties from Table 1 range from -0.3 to -1.2, implying that a 14 percent price increase would lead to a decrease in demand between 4 and 17 percent. EIA’s forecast of 6 percent is near the bottom of that range.
On the supply side, the carbon price causes coal use to decline by 85 percent below the Reference Case level in 2030. (For comparison, EPA projects the Clean Power Plan to cause a reduction in coal usage of 22 to 23 percent by 2030 (U.S. EPA 2015).) Natural gas usage increases rapidly in the initial years to replace this coal generation. By 2030, with higher carbon prices and more time to build new infrastructure, renew-
able energy increasingly replaces coal (and to some extent natural gas) generation.
EIA’s forecasts of changes in electric-ity supply are pessimistic in that the model does not consider the pos-sibility of transformative changes or disruptive technological progress. It assumes that no new technologies provide meaningful competition to fossil fuels, even though a carbon price will increase the incentive for technological progress (discussed in the next section). In fact, the recent trends of rapidly decreasing costs of solar and wind technologies are assumed not to continue—for example, the projected costs of build-ing utility-scale solar photovoltaic generating plants are assumed to remain higher through 2025 than
typical cost estimates from 2014.7 Consequently, the extent to which wind and solar generation is avail-able to replace coal and natural gas generation is constrained in EIA’s analysis, and consumers are not increasingly responsive to price changes due to innovative “smart grid” technologies.
Still, EIA projects that the carbon price reduces electricity sector emis-sions in 2030 by over 60 percent below Reference Case emissions levels. Actual emissions reductions in the sector could be larger or smaller. But if clean energy technologies continue to improve, it is far more likely that a carbon price will cause larger emissions reductions than are predicted in these conservative forecasts.
Source: U.S. EIA’s Annual Energy Outlook 2014. The Reference Case scenario is identical to the $25 carbon price scenario except for the lack of a carbon price.
EIA PROJECTIONS OF THE EFFECTS OF A $25/METRIC TON CARBON PRICE IN THE ELECTRICITY SECTOR TA
BLE
2
EIA $25 Carbon Price Scenario
2015 2020 2025 2030
CARBON PRICES (2012 DOLLARS PER METRIC TON) $25 $32 $41 $52
PERCENTAGE CHANGE VERSUS REFERENCE CASE:
Retail Electricity Prices 6% 11% 14% 14%
Electricity Demand -1% -4% -5% -6%
Coal Usage -18% -64% -74% -85%
Natural Gas Usage 16% 51% 50% 27%
Renewables Usage 10% 24% 25% 51%
Electricity Sector Carbon Dioxide Emissions -12% -40% -49% -63%

14 |
Very Long-run Effects of Carbon Pricing in the Electricity Sector For the United States to meet its goal of over 80 percent emissions reductions by 2050, a transformation of the electricity sector is essential. This will occur only through the development and scaling of new technologies. Most studies of carbon pricing focus on the effects described above because they are relatively predictable. We can measure how consumer demand changes with electricity prices and how low-carbon supply options become more competitive when a carbon price is implemented. But CO2 stays in the atmosphere for hundreds of years and, while the climate is changing today, the worst damages from climate change are decades or centuries away. For that reason, the most important effects of carbon pricing occur over
BOX
4 A PRICE ON SO2 EMISSIONS LED TO DRAMATIC EMISSIONS REDUCTIONS
Pricing emissions in the electricity sector is not just a theoretical concept. With the Clean Air Act Amendments of 1990, the United States implemented the “Acid Rain Program” to regulate sulfur dioxide (SO
2) emissions, a harmful air pollutant emitted primarily from
coal-fired power plants. The Acid Rain Program put a price on SO2 emissions using a cap-
and-trade program. The administration of George H.W. Bush and Republicans in Congress supported the policy largely because of its reliance on market mechanisms to achieve environmental protection (Chan et al. 2012).
Under the Acid Rain Program, SO2 emissions from power plants decreased 36 percent
between 1990 and 2004, despite electricity generation from coal power plants increas-ing by 25 percent over the same period (Chan et al. 2012). Various studies have con-cluded that the emissions reductions due to the price on SO
2 occurred more quickly and
cost-effectively compared to the reductions that would have been achieved under a more traditional non-market regulatory policy (Burtraw and Palmer 2004). The success of the Acid Rain Program helped to inspire the EU-ETS and other CO
2 cap-and-trade programs in
the 2000s.
a long-term time scale. A major benefit of carbon pricing policies is that they encourage technological change, so the menu of cost-effective low-carbon alternatives available to producers and consumers will expand over time.
The process that drives technological change is complex and not entirely understood. It includes the invention of new technologies, improvements to existing technologies, and the adoption and diffusion of technolo-gies throughout the economy (Jaffe et al. 2003). We refer to inducing technological change as a “very long-run” effect because it can take decades for new technologies to mature, but the advancements can occur quickly as well (particularly improvements and cost reductions for existing technologies).
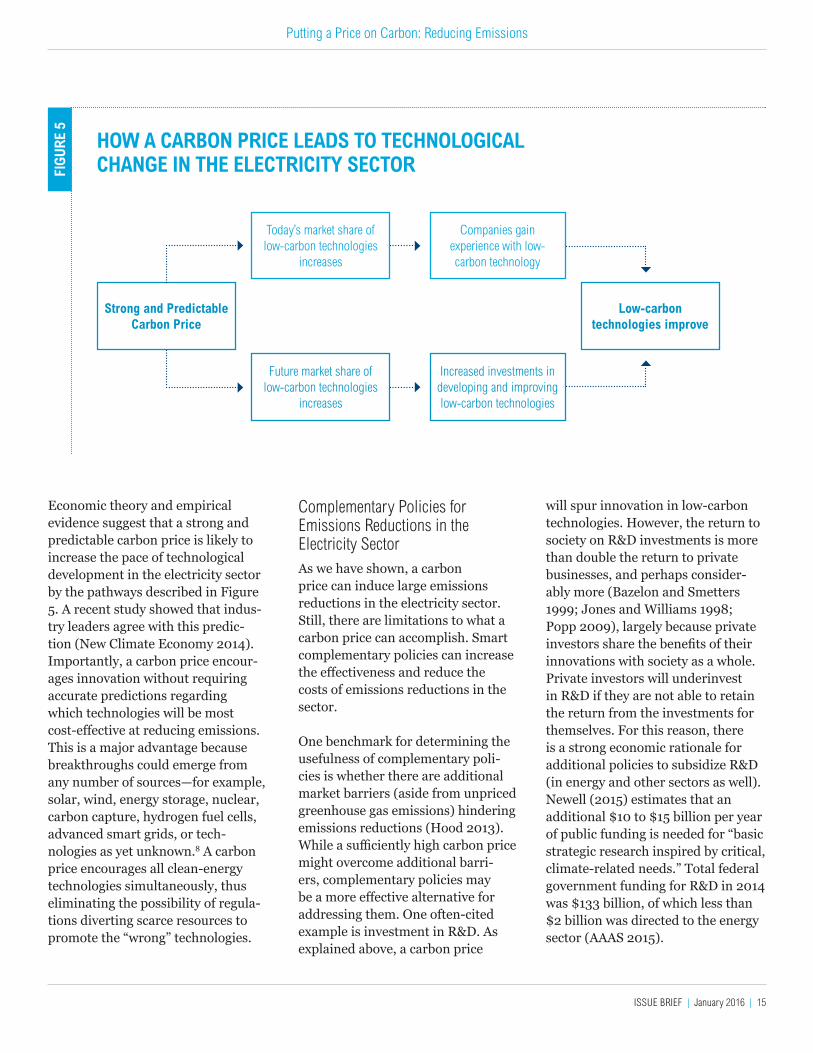
Private businesses fund over 60 per-cent and perform over 70 percent of total R&D in the United States, with industry responsible for even larger portions of applied research and product development (Newell 2015). A carbon price increases incentives for private businesses to invest in low-carbon technologies because it affects the expected return on invest-ments. A strong and predictable car-bon price will ensure that the price of producing electricity with fossil fuels incorporates the costs to society of burning these fuels, thus making new low-carbon technologies more competitive if and when they become available. Larger anticipated market shares for low-carbon innovations imply greater expected returns on investments today. Investments flow toward opportunities with higher expected returns, so a carbon price encourages investments in low-car-bon technologies, and these invest-ments are what drive innovation.
Increased experience with low-carbon technologies will also lead to productivity gains over time. This effect—often referred to as “learning-by-doing”—is responsible for major decreases in the costs of solar photovoltaic energy in recent years (Bollinger and Gillingham 2014). Economists attribute a significant portion of the technological progress across the economy to learning-by-doing (Arrow 1962).
Figure 5 summarizes the pathways by which a carbon price will lead to emissions reductions via technologi-cal change.
Putting a Price on Carbon: Reducing Emissions
ISSUE BRIEF | January 2016 | 15
FIG
UR
E 5
HOW A CARBON PRICE LEADS TO TECHNOLOGICAL CHANGE IN THE ELECTRICITY SECTOR
Strong and Predictable Carbon Price
Low-carbon technologies improve
Today’s market share of low-carbon technologies
increases
Future market share of low-carbon technologies
increases
Companies gain experience with low-carbon technology
Increased investments in developing and improving low-carbon technologies
Economic theory and empirical evidence suggest that a strong and predictable carbon price is likely to increase the pace of technological development in the electricity sector by the pathways described in Figure 5. A recent study showed that indus-try leaders agree with this predic-tion (New Climate Economy 2014). Importantly, a carbon price encour-ages innovation without requiring accurate predictions regarding which technologies will be most cost-effective at reducing emissions. This is a major advantage because breakthroughs could emerge from any number of sources—for example, solar, wind, energy storage, nuclear, carbon capture, hydrogen fuel cells, advanced smart grids, or tech-nologies as yet unknown.8 A carbon price encourages all clean-energy technologies simultaneously, thus eliminating the possibility of regula-tions diverting scarce resources to promote the “wrong” technologies.
Complementary Policies for Emissions Reductions in the Electricity Sector As we have shown, a carbon price can induce large emissions reductions in the electricity sector. Still, there are limitations to what a carbon price can accomplish. Smart complementary policies can increase the effectiveness and reduce the costs of emissions reductions in the sector. One benchmark for determining the usefulness of complementary poli-cies is whether there are additional market barriers (aside from unpriced greenhouse gas emissions) hindering emissions reductions (Hood 2013). While a sufficiently high carbon price might overcome additional barri-ers, complementary policies may be a more effective alternative for addressing them. One often-cited example is investment in R&D. As explained above, a carbon price
will spur innovation in low-carbon technologies. However, the return to society on R&D investments is more than double the return to private businesses, and perhaps consider-ably more (Bazelon and Smetters 1999; Jones and Williams 1998; Popp 2009), largely because private investors share the benefits of their innovations with society as a whole. Private investors will underinvest in R&D if they are not able to retain the return from the investments for themselves. For this reason, there is a strong economic rationale for additional policies to subsidize R&D (in energy and other sectors as well). Newell (2015) estimates that an additional $10 to $15 billion per year of public funding is needed for “basic strategic research inspired by critical, climate-related needs.” Total federal government funding for R&D in 2014 was $133 billion, of which less than $2 billion was directed to the energy sector (AAAS 2015).

16 |
BOX
5 TECHNOLOGY-FORCING EFFECTS OF REGULATIONSEconomists have long understood that regulations can induce technological change (Jaffe et al. 2003; Bellas and Lange 2011). Indeed, with the Clean Air Act Amendments of 1970, Congress required emissions reductions from the auto industry that were unachievable with existing technologies (Gerard and Lave 2003). The Department of Energy assumed that its 2001 efficiency standards would force “top-loading” clothes washers out of the market by 2007 but the efficiency of these washers improved dramatically following the regulation, and they were able to retain their market share (Taylor et al. 2015).
Some studies have claimed that, by drawing attention to market inefficiencies and providing incentives to innovate beyond the standards, well-designed policies spur innovation to such a large degree that they often lead to long-run cost reductions that more than offset the compliance costs of the policies (referred to as the “Porter Hypothesis”) (Porter and van de Linde 1995). Empirical support for the Porter Hypothesis is mixed (Ambec et al. 2013), but even skeptics of Porter acknowledge that the “technology-forcing” effect of regulations (and in particular, market-based regulations) is larger than zero (Palmer et al. 1995), as energy/economic models typically assume.
Measuring the magnitude of induced technological change is difficult. The process of innovation takes years and existing carbon pricing pro-grams are generally too new to display the long-term effects of spurred innovation. However, initial signs indicate that programs such as the EU-ETS are successfully spurring innovation. For example, a 2011 study surveyed manufacturing companies and found a strong positive association between firms’ expectations on the stringency of the cap and overall innovation in emissions-saving processes or products (Martin et al. 2011). A separate study compared the patenting activity (as a proxy for innovation) of thousands of companies that were either regulated by the EU-ETS or exempt from regulation. Figure 6 displays the results of the study, which estimated that the EU-ETS increased low-carbon (or “green”) patent-ing by 36 percent compared to what would have been expected without the EU-ETS (Calel and Dechezlepretre 2012).
Source: Calel and Dechezlepretre (2012).
FIGURE 6: THE EU-ETS AND LOW-CARBON PATENTS
Num
ber o
f low
-car
bon
pate
nts
0
2000 2002 2004 2006 2008
20
40
60
80
100
EU ETS firms
non-EU ETS firms
EU ETS

Putting a Price on Carbon: Reducing Emissions
ISSUE BRIEF | January 2016 | 17
A carbon price encourages reduced electricity usage, but it is unlikely to incentivize consumers to take all cost-effective energy-saving actions. An International Energy Agency study (Ryan et al. 2011) summarizes the various market barriers inhibit-ing cost-effective energy efficiency, which include:
▪ INFORMATIONAL FAILURES OR ASYMMETRIES. Consumers often have insufficient or inaccurate information regarding energy use or the energy-efficiency char-acteristics of goods and services.
▪ SPLIT INCENTIVES. Those pur-chasing major appliances (e.g. landlords) are often not the same people as those who pay the elec-tricity bills (e.g. tenants).
▪ BOUNDED RATIONALITY. Consum-ers often do not perform the calculations needed to determine whether energy-efficient prod-ucts will be cost-effective.
Targeted energy-efficiency policies can be used to overcome these bar-riers (at least to some extent) and lower the costs of achieving emis-sions targets.
Policies that encourage clean-energy innovation and energy efficiency are often more effective at reducing emissions when a carbon price is in place. A carbon price helps to ensure the deployment and diffusion of new technologies. Energy-efficiency policies encourage more efficient electricity use, but they also often reduce the cost of activities that require electricity—for example, if a more efficient air condi-tioner is less expensive to run, it may be run more often—which offsets some of the effect of these policies on emissions (referred to as the “rebound effect”) (Shellenberger et al. 2011). A strong car-
bon price could ensure that the cost of the carbon-intensive activity increases, thus reducing a rebound effect.
Finally, given that the U.S. Congress would need to pass a national carbon price, it is not difficult to imagine that a carbon tax or emissions cap would be set at levels that are insuf-ficiently stringent to achieve the necessary emissions reductions. In such cases, while a more stringent carbon price may be preferable, complementary policies that further reduce emissions may be the “second best” alternative. Alternative Policies for Emissions Reductions in the Electricity SectorAlongside smart complementary policies, a carbon price is a highly effective tool for achieving emissions reductions in the electricity sector. Other forms of regulations do not provide the same breadth of incen-tives for emissions reductions.
Technology standards, renewable portfolio standards, and clean-energy standards, all encourage low-carbon electricity production, but they do not encourage consumers to use less electricity. As noted above, efficiency standards encourage more efficient electricity use, but decreased costs can actually increase the use of energy services via the “rebound effect” (Linn et al. 2014). A carbon price provides unambiguous incen-tives to consumers and producers to reduce electricity use and utilize lower-carbon technologies.
The future costs of electricity pro-duction cannot be projected with any degree of precision. Unforeseen events and technological advance-ments will determine the most cost-effective ways to reduce emissions in
the sector over the coming decades. This uncertainty does not impede the success of a carbon price, which uses market forces to encourage which-ever emissions reductions activities turn out to be most cost-effective. Policies that favor particular climate change solutions risk backing the wrong technology, and thus wasting scarce resources and making it more difficult for non-incentivized tech-nologies to succeed.
Alternative emissions reduction policies (of comparable stringency) also are more often limited in their ability to induce the adoption and diffusion of new technologies (Jaffe et al. 2003). Unlike technology and performance standards that are satisfied once a power plant achieves a particular performance level, a carbon price rewards the continued reduction of emissions beyond the level required by a standard. Under a carbon tax, for example, a firm will benefit as long as it can continue to lower its tax burden by reducing emissions. The same is true under a cap-and-trade program as long as the total emissions covered by the policy do not fall below the emissions cap. Indeed, studies have shown that market-based instru-ments have been significantly more effective at promoting the adoption of new technologies than the poli-cies they replaced (Jaffe et al. 2003; Keohane 2002).
Finally, although political momen-tum is notoriously difficult to predict, a national carbon price may be more likely to achieve bipartisan support than alternative emissions reduction strategies that require a significant increase in government spend-ing. Indeed, a growing number of prominent conservatives support a revenue-neutral carbon tax (Carbon Tax Center 2015).

18 |
Transportation SectorThe transportation sector is the country’s second largest contribu-tor to climate change. In 2013, the sector was responsible for 1.8 billion metric tons of CO2-equivalent emis-sions, comprising 27 percent of total U.S. greenhouse gas emissions and roughly one third of CO2 emissions from fossil fuels (U.S. EPA 2013b). Reducing emissions in the transporta-tion sector will be critical to achieving U.S. long-term emissions targets and, in this section, we describe the ways in which a carbon price encourages emissions reductions in the sector.
Cars and light trucks are responsible for over 60 percent of transportation sector carbon dioxide emissions, freight trucks comprise nearly a quarter of sector emissions, and aircraft, pipelines, trains, and ships contribute a small percentage each (U.S. EPA 2013a). A key difference between the transportation and electricity sectors is that the fossil fuel responsible for the vast majority of transportation sector emissions is oil. Per unit of energy produced, oil-based products produce roughly 25 percent fewer CO2 emissions than coal, but roughly 33 percent more CO2 emissions than natural gas (U.S. EIA 2015f). Two thirds of the oil consumed in the transportation sec-tor is motor gasoline, with diesel and jet fuel consuming lesser amounts (Center for Climate and Energy Solu-tions 2014). As in the electricity sector, a carbon price will lead to emissions reduc-tions in the transportation sector through numerous mechanisms, involving behavioral changes by consumers, producers, and inves-tors. However, substantial emissions reductions in the transportation
sector are unlikely to occur as rapidly and as inexpensively as in the electricity sector. First, compared to the burgeoning renewable industry in the electricity sector, there are fewer cost-effective alternatives to fossil fuels currently available in the transportation sector. Second, a carbon price has a smaller effect on the price of petroleum products than it does on the price of coal—every $1 increase in the carbon price would increase the price of gasoline and diesel by only around 1 cent per gallon (Aldy et al. 2012). Finally, there is no equivalent to electricity markets which immediately encour-age cost-effective alternatives to be adopted. For these reasons, there is no category of “very short-run” emis-sions reductions in the transporta-tion sector, so we skip directly to the “short-run” effects of carbon pricing in the sector.
Short-run Effects of Carbon Pricing in the Transportation SectorRecall that, in the “short run,” the response of households and busi-nesses to a carbon price is somewhat muted due to existing commitments. In the transportation sector, con-sumers only occasionally reevaluate their transportation alternatives and producers cannot immediately adjust their supply chains or investments.
Short-run effects are also con-strained because of the relative lack of low-carbon substitute products in the transportation sector. A carbon price encourages producers and consumers of petroleum products to switch to fuels with potentially lower life-cycle emissions, but options are limited. Some consumers will switch to other transportation options (e.g. public transit, walking, bicycling), but absent drastic changes in gaso-
line prices, the vast majority will continue to drive their vehicles (U.S. EIA 2014b).
Producers can blend biofuels like ethanol with gasoline to produce a lower-carbon fuel. According to EPA, the life-cycle emissions reductions in comparison to gasoline are about 20 percent for corn-based ethanol and 60 percent for sugarcane-based etha-nol (U.S. EPA 2010), and the share of biofuels in U.S. gasoline increased from under 4 percent in 2006 to nearly 10 percent in 2013 (U.S. EIA 2014c). In Brazil, sugarcane ethanol accounts for over 50 percent of fuel demand, and drivers commonly calculate whether it is cheaper to purchase fuel from the gasoline or ethanol pump before filling their tanks after accounting for the dif-fering energy content of the fuels (Khanna and Mingo, 2015). How-ever, it is unlikely that a carbon price would cause a significant increase in biofuel usage in the United States, for both technological (UCS 2013) and environmental reasons.9
The most visible effect of a carbon price in the transportation sector is the increase in the price of gasoline. Higher gasoline prices incentivize consumers to drive less and more efficiently. As a result, less gasoline is purchased and less oil is produced, causing emissions to decline.
Given the lack of substitute fuels, it is perhaps not surprising that consum-ers are even less responsive to the price of gasoline than to the price of electricity. In the first year following a price change, studies have found price elasticities of roughly –0.1 to –0.25 (IPCC 2014), implying that a 10 percent price increase would lead to a reduction in demand for gasoline

Putting a Price on Carbon: Reducing Emissions
ISSUE BRIEF | January 2016 | 19
BOX
6 GASOLINE PRICES, CONSUMER PREFERENCES, AND VEHICLE FUEL-ECONOMY STANDARDSWhen fuel prices are relatively high, both consumers and government regulators demand more fuel-efficient vehicles (Ramey and Vine 2010). Figure 7 shows the correlation between gasoline prices and the fuel economy of new U.S. cars over the past 40 years. The oil embargo of 1973–1974 caused oil prices to rise dramatically—gasoline prices were constrained by price controls, but gasoline shortages occurred instead. This event provided a major impetus for Congress to pass the Corporate Average Fuel Economy (CAFE) standards for new passenger vehicles in 1975 (UCS 2015), which led to significant increases in vehicle fuel economy in the late 1970s and early 1980s. From the 1980s to the early 2000s, gasoline prices were relatively low, consumers worried less about fuel economy, and fuel-economy standards remained virtually constant. As gas prices rose again in the mid-2000s, the average fuel economy of new light-duty vehicles sold in the United States began to increase once again, from under 29 miles per gallon in 2001 to over 35 miles per gallon in 2013 (U.S. DOT 2015). At the same time, the Energy Independence and Security Act of 2007 made fuel-economy standards for future car and truck sales significantly more stringent. With gasoline prices at high levels once again following the financial crisis, the Obama administration finalized rules that raised fuel-economy standards even further (U.S. Government 2012).
Gasoline prices in major European countries are more than twice as high as U.S. prices, and the fuel-economy standards for light-duty vehicles in the European Union were roughly 10 miles per gallon higher than in the United States as of 2013 (International Council on Clean Transporta-tion 2015). A carbon price in the United States would not raise gasoline prices to European levels, so it is unrealistic to expect the U.S. fleet to transform into the European fleet overnight. Still, over time, historical trends indicate that a credible promise of higher future gasoline prices would cause consumers and government regulators to demand more fuel-efficient vehicles.
Notes: Retail gasoline price is the average annual gasoline pump price in constant US dollars, according to the U.S. Department of Energy.10 Adjusted fuel economy reflects the fleet-wide average fuel economy of new cars in each model year, according to the U.S. EPA.11
FIGURE 7: GASOLINE PRICES AND FUEL ECONOMY
13.0
16.0
19.0
22.0
25.0
28.0
31.0
$1.00
$1.50
$2.00
$2.50
$3.00
$3.50
$4.00
Adjusted Fuel Economy (M
PG)
Pric
e (U
S do
llars
)
Retail Gasoline Price (Constant 2013 dollars/gallon) Adj. Fuel Economy for Cars (MPG)
1973 1977 1981 1985 1989 1993 1997 2001 2005 2009 2013
Gasoline shortages; CAFE standards first established in
1975
More stringent CAFE standards adopted in 2007
and 2009

20 |
of 1 to 2.5 percent. The U.S. EIA argues that U.S. drivers have barely responded at all to gasoline price changes in recent years, with short-run elasticities of just –0.02 to –0.04 (U.S. EIA 2014b). If these estimates are indicative of the consumer response to a carbon price, then the short-run reduction in gasoline usage will be small.
Long-run Effects of Carbon Pricing in the Transportation SectorIn the long run, consumers and pro-ducers have more flexibility to take advantage of the economic opportu-nities encouraged by a carbon price. Consumers are far more responsive to changes in gasoline prices in the long run, perhaps due to reevaluat-ing their commuting habits and making long-term investments in vehicles. Studies suggest that aver-age long-run price elasticities range from –0.6 to –0.8, implying that a 10 percent increase in gasoline prices leads to a 6 to 8 percent decrease in demand (IPCC 2014; Brons et al. 2008; Hamilton 2008). To the extent that a carbon price provides a more permanent and salient signal to consumers than general price fluctuations, the consumer response may be larger (as it has been in Brit-ish Columbia, discussed in Box 7). On the other hand, if EIA’s finding of low short-term elasticities for U.S. drivers (U.S. EIA 2014b) is indicative of a longer-term trend, the consumer response may be smaller.
The major substitutions in the transportation sector may occur at the vehicle level. The price of gaso-line changes the cost of owning a vehicle over its lifetime, so increases in gasoline prices cause consumers to place more value on fuel economy, which causes producers to build and
BOX
7 BRITISH COLUMBIA’S CARBON TAXBritish Columbia implemented a carbon tax of C$10 per metric ton of CO
2 equivalent in
July 2008, which increased by C$5 per year to C$30 per metric ton in 2012. The tax covers most of the carbon dioxide emissions in the economy, but since British Columbia produces the vast majority of its electricity with renewable sources, the tax primarily affects the trans-portation sector.
The carbon tax is less than a decade old, so it is far too early to expect long-run effects to have materialized, but the evidence thus far is promising. Fuel consumption per capita declined by 17 percent compared to the year prior to implementation, and by 19 percent compared to the rest of Canada. The consumer response to fuel-price changes has been over five times larger than anticipated for a general price change, perhaps due to the prominence and perceived permanence of the carbon tax (Rivers and Schaufele 2014). Compared to a “no carbon tax” scenario, Murray and Rivers (2015) conclude that the carbon tax reduced emissions by 5 to 15 percent in the first five years. These emissions reductions have been achieved with no signs that the tax has harmed the BC economy (Murray and Rivers 2015) or low-income households (Beck et al. 2015).
Time will tell how successful British Columbia’s carbon tax will be at reducing emissions once all the short- and long-run effects have been realized. British Columbia’s carbon pricing policy appears to have had a highly successful start. And, if the response to the tax is indicative of how American drivers would respond, then a carbon price will lead to much larger emissions reductions in the U.S. transportation sector than energy/economic models currently predict.
sell more fuel-efficient vehicles (see Box 6). The extent of this effect is dif-ficult to measure empirically (Greene 2010), but recent studies suggest that consumers’ willingness to pay for a new vehicle increases nearly propor-tionately with the expected lifetime costs of gasoline.
Carbon prices will also encourage a shift away from vehicles powered by combustion engines that run on gasoline. Purchasers of light-duty vehicles can switch to hybrids or electric vehicles, the sales of which have accelerated rapidly in recent years (U.S. DOE 2015). Purchasers of trucks can switch from diesel to natural gas, which reduces tailpipe CO2 emissions by roughly 30 per-cent,12 and vehicles that run on diesel
fuel can run on biodiesel instead. Such vehicles are in their relative infancy compared to low-carbon alternatives for electricity genera-tion—the share of electric vehicles as a percentage of total vehicle sales is less than 1 percent, and natural gas trucks comprise less than 10 percent of the heavy-duty vehicle market (ACT 2012). Still, if the prices of electric vehicles continue to fall and performance and infrastructure continue to improve, the effects of a carbon price could increase dra-matically, because consumers would have viable alternatives to gasoline-powered vehicles.
Cars and trucks generate more than 80 percent of transportation sec-tor emissions (Center for Climate
Putting a Price on Carbon: Reducing Emissions
ISSUE BRIEF | January 2016 | 21
and Energy Solutions 2014) so they will also be responsible for the vast majority of emissions reductions in the sector. But a major advantage of a carbon price is that it provides incentives for emissions reductions in other parts of the sector as well--including from trains, airplanes, and ships—where significant efficiency improvements may be attainable (IPCC 2014).
Forecasts of Emissions Reductions in the Transportation SectorA carbon price is likely to have a modest effect on fuel prices, at least in the first decades of implementation. A common “rule of thumb” is that each additional dollar of a carbon price will raise gas prices by about 1 cent per gallon or slightly less, so a $25 per metric ton carbon price may raise the price of gasoline by 20 to 25 cents per gallon (Aldy et al. 2012). This would reflect a 7.5 percent increase over the 2014 average U.S. price of $3.34 per
gallon at the pump (AAA 2014). Using the best estimates of long-run con-sumer responses to gasoline prices, a 7.5 percent increase in gas price would lead to an overall reduction in demand of about 4.5 to 6 percent, and thus a similar reduction in emissions.
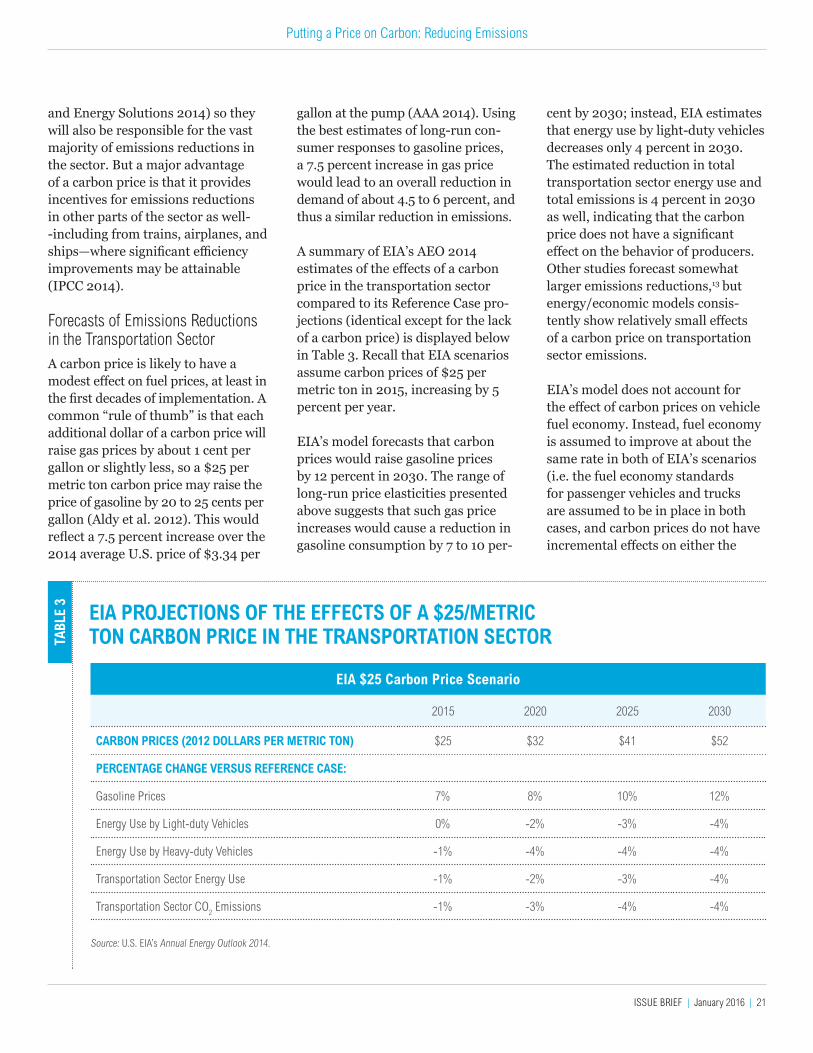
A summary of EIA’s AEO 2014 estimates of the effects of a carbon price in the transportation sector compared to its Reference Case pro-jections (identical except for the lack of a carbon price) is displayed below in Table 3. Recall that EIA scenarios assume carbon prices of $25 per metric ton in 2015, increasing by 5 percent per year.
EIA’s model forecasts that carbon prices would raise gasoline prices by 12 percent in 2030. The range of long-run price elasticities presented above suggests that such gas price increases would cause a reduction in gasoline consumption by 7 to 10 per-
Source: U.S. EIA’s Annual Energy Outlook 2014.
EIA PROJECTIONS OF THE EFFECTS OF A $25/METRIC TON CARBON PRICE IN THE TRANSPORTATION SECTOR TA
BLE
3
EIA $25 Carbon Price Scenario
2015 2020 2025 2030
CARBON PRICES (2012 DOLLARS PER METRIC TON) $25 $32 $41 $52
PERCENTAGE CHANGE VERSUS REFERENCE CASE:
Gasoline Prices 7% 8% 10% 12%
Energy Use by Light-duty Vehicles 0% -2% -3% -4%
Energy Use by Heavy-duty Vehicles -1% -4% -4% -4%
Transportation Sector Energy Use -1% -2% -3% -4%
Transportation Sector CO2 Emissions -1% -3% -4% -4%
cent by 2030; instead, EIA estimates that energy use by light-duty vehicles decreases only 4 percent in 2030. The estimated reduction in total transportation sector energy use and total emissions is 4 percent in 2030 as well, indicating that the carbon price does not have a significant effect on the behavior of producers. Other studies forecast somewhat larger emissions reductions,13 but energy/economic models consis-tently show relatively small effects of a carbon price on transportation sector emissions.
EIA’s model does not account for the effect of carbon prices on vehicle fuel economy. Instead, fuel economy is assumed to improve at about the same rate in both of EIA’s scenarios (i.e. the fuel economy standards for passenger vehicles and trucks are assumed to be in place in both cases, and carbon prices do not have incremental effects on either the

22 |
standards or actual fuel economy). As in the electricity sector, the model assumes that disruptive technol-ogy changes do not occur, with or without a carbon price. For example, the trends of decreasing prices of electric vehicles (see Box 8) or move-ment toward a “sharing economy” (e.g. Uber, Lyft) are assumed not to continue in any meaningful way.
EIA’s estimates likely demonstrate the low end of what a carbon price can accomplish in the transportation sector over the first 10 to 15 years fol-lowing implementation. If the initial result of the British Columbia carbon tax (see Box 7) is at all indicative of how U.S. drivers would respond, larger behavioral changes may be realized. And, if technologies progress such that alternative-fuel vehicles become more competitive with gaso-line- and diesel-fuel vehicles, a carbon price could cause more transforma-tive changes to the sector. Very Long-run Effects of Carbon Pricing in the Transportation SectorWhile the United States can achieve its short-run emissions targets with relatively small changes to the trans-portation sector (Hausker et al. 2015), it is difficult to find a pathway for achieving the country’s long-run emis-sions targets absent a transformation of the sector to low-carbon technolo-gies. The numbers simply do not add up—to reduce emissions to 20 percent of today’s levels by 2050 (roughly the U.S. long-run goal) with minimal contribution from the transportation sector, emissions in every other sector would need to be reduced to zero (or technology would need to be devel-oped to safely capture CO2 from the air and store it underground).
A carbon price that steadily increases over time (as economists agree it should14) could eventually have a substantial effect on gasoline prices, providing a strong signal to develop-ers of low-carbon technologies that the costs of driving gas-powered vehicles will remain high in the future. The mechanisms for encour-aging technological change in the transportation sector are virtually identical to those in the electricity sector (summarized in Figure 5). In short, a carbon price—and more importantly, the credible promise of a high future carbon price—would increase the expected returns on investments in future low-carbon technologies and increase the market share of current low-carbon alterna-tives, both of which would increase the likelihood of the development and diffusion of breakthrough low-carbon technologies in the transpor-tation sector.
The signal provided by a strong carbon price may have a special importance in the transportation sector because of the collective action problems associated with transportation systems. Whether it is a network of charging stations for electric vehicles or improved public transport within and across cities, large-scale improvements in the transportation sector are typically characterized by large upfront invest-ments in infrastructure. A carbon price would reduce the financial risks associated with such investments.
While a carbon price will encourage technological change in the transpor-tation sector, it is difficult to predict the specific technologies that will be capable of cost-effectively trans-forming the sector. A carbon price does not favor any particular low-
carbon technology, so it encourages transformation without requiring any predictions of how it will occur. Technological breakthroughs could come from known technologies such as electric vehicles, hydrogen fuel cell vehicles or advanced biofuels;15 from transformations in city designs or toward vehicle-sharing models; or perhaps from a low-carbon technol-ogy less well known today.
Complementary Policies in the Transportation SectorThe relatively small projected impact of a carbon price in the transporta-tion sector does not in itself imply that other emissions reduction poli-cies are necessary in the sector. After all, if less expensive emissions reduc-tions are available in other sectors, a cost-effective policy would encourage those opportunities to be undertaken first. However, this argument ignores the following economic and political realities that strongly suggest addi-tional policies should be used to help reduce emissions in the sector.
▪ There have been massive in-vestments in infrastructure to support the current fossil-fuel-based transportation system. The existing network of fueling sta-tions across the country benefits drivers of gasoline- and diesel-fuel vehicles and thus encour-ages consumers not to purchase alternative-fuel vehicles. For this reason, as part of the American Recovery and Reinvestment Act, the U.S. government spent over $100 million to help install more than 118,000 electric vehicle chargers across the country (U.S. DOE 2014a). Making public transportation systems less carbon-intensive will require policy support as well.

Putting a Price on Carbon: Reducing Emissions
ISSUE BRIEF | January 2016 | 23
BOX
8 HOW TESLA MAY CHANGE THE EFFECTIVENESS OF CARBON PRICING IN THE TRANSPORTATION SECTOR
If a carbon price has only a small effect on behavior in the transportation sector, it will be due to a lack of cost-competitive substitutes to gasoline-powered vehicles. This was not always the case. In the first decade of the 1900s, electric cars represented about a third of all vehicles on the road (U.S. DOE 2014a). Gas vehicles were powerful and flexible, but electric vehicles were cleaner, quieter, easier to start, and ran on an engine that was much simpler to build and service. Consumers had a choice. Then, thanks in large part to the affordable Model T, gas vehicles became far more affordable, which led to the near-eradication of electric vehicles from the roads by the 1930s (U.S. DOE 2014a).
Since then, electric-car companies have faced seemingly insurmountable hurdles to increasing their market shares. First, electric-car owners had no comparable infrastructure to the network of refueling stations, dealerships, and repair shops servicing gas vehicles. Second, electric cars had limited range and power. Third, the highly concentrated U.S. automobile industry was virtually impossible to enter for any company, let alone an electric-car company—the last successful startup car company of the 20th century in the United States was Chrysler in 1925.
Electric cars may be on the verge of overcoming all three hurdles, thanks in large part to the emergence of Tesla Motors, an independent auto-maker founded in 2003. Tesla’s luxury vehicles have outperformed comparable gas vehicles with regard to power and performance (DeMorrow 2012; DeMorrow 2013), and driving range is far less of a barrier than it used to be due to a nationwide network of charging stations and on-the-road charging technology.16 Tesla’s market capitalization is now larger than Chrysler’s, and over half that of Ford and General Motors.17 The price of Tesla vehicles has so far been prohibitively high for most consumers ($70,000 and up), but the company plans to transition its business to selling more affordable electric vehicles as quickly as it can.
After years of eschewing investments in electric vehicles, the established auto companies are now following Tesla’s lead in developing electric vehicles, and in turn, adding to the electric-vehicle infrastructure in the country. Nissan, Ford, Chevy, BMW, Mercedes, Volkswagen, Fiat, Kia, and Mitsubishi all sell electric vehicles. There are more than 234,000 plug-in electric vehicles on the road in the United States (U.S. DOE 2014a), compared with fewer than 10,000 in 1999 (U.S. DOE 2014b). Other automobile manufacturers like Toyota and Honda are betting heavily on hydrogen fuel-cell vehicles, which use compressed hydrogen gas to produce the electricity that powers the motor (Mearian 2015).
A modest carbon price is currently not sufficient to have transformative effects on the U.S. automobile industry. But, if current trends of increas-ing affordability and performance continue, electric vehicles will become viable substitutes for a large portion of the U.S. fleet. (On the other hand, inexpensive gasoline makes competition for alternative-fuel vehicles more difficult.) At that point, the effects of a carbon price in the transportation sector may start to look a lot more like the effects in the electricity sector.
▪ While a carbon price will increase innovation in the transportation sector, policies promoting R&D or the next gen-eration of low-carbon technolo-gies in the sector may be neces-sary to ensure that a carbon price will lead to significant long-run emissions reductions. Otherwise, entrepreneurs will not be ad-equately incentivized to develop new technologies, because the payoffs of these investments occur far in the future—due to
slow vehicle-fleet turnover and infrastructure development—and because investors will not reap the full social benefits of any breakthrough innovations (as previously discussed with respect to electricity sector technological breakthroughs).
▪ As in the electricity sector, if Congress passes a carbon price that is not sufficient to put the United States on a pathway to achieving its long-term goals,
complementary policies will be necessary to provide the addi-tional emissions reductions.
Fuel-economy standards encour-age investment in and deployment of fuel-efficient and alternative-fuel vehicles, and therefore may have an important role to play in comple-menting a carbon pricing policy. The United States has relied on fuel-economy standards to achieve efficiency improvements since 1978 for passenger cars and light trucks
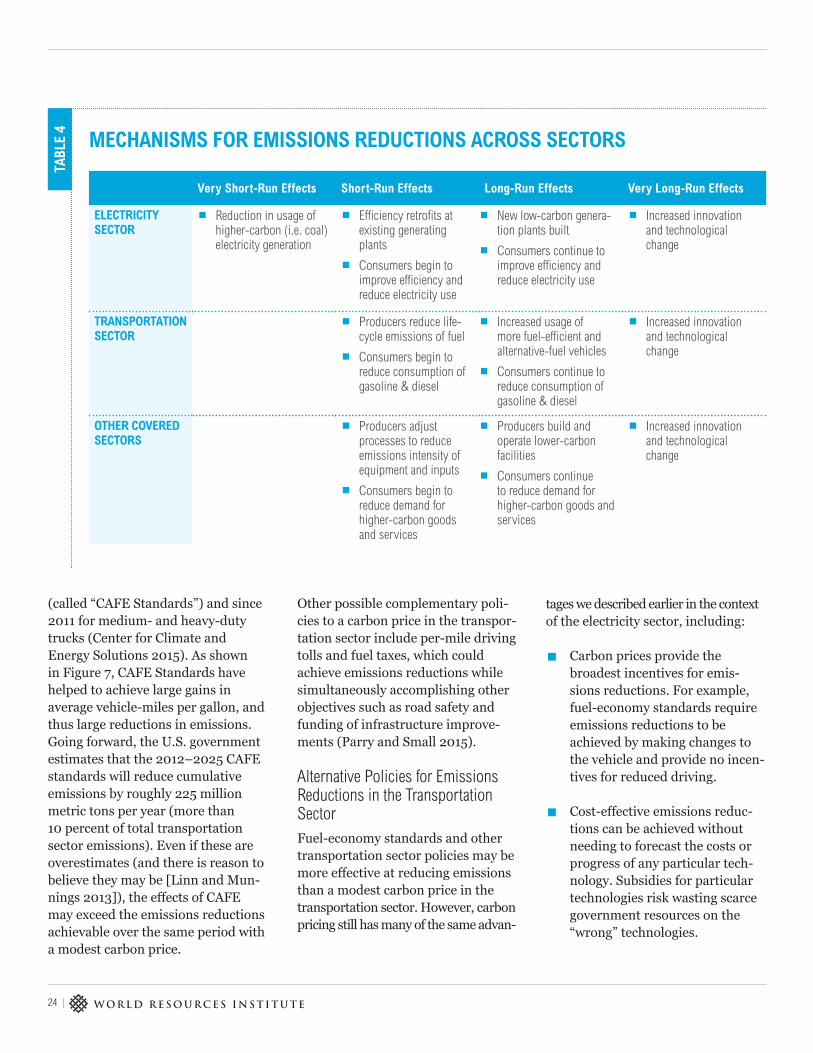
24 |
(called “CAFE Standards”) and since 2011 for medium- and heavy-duty trucks (Center for Climate and Energy Solutions 2015). As shown in Figure 7, CAFE Standards have helped to achieve large gains in average vehicle-miles per gallon, and thus large reductions in emissions. Going forward, the U.S. government estimates that the 2012–2025 CAFE standards will reduce cumulative emissions by roughly 225 million metric tons per year (more than 10 percent of total transportation sector emissions). Even if these are overestimates (and there is reason to believe they may be [Linn and Mun-nings 2013]), the effects of CAFE may exceed the emissions reductions achievable over the same period with a modest carbon price.
Other possible complementary poli-cies to a carbon price in the transpor-tation sector include per-mile driving tolls and fuel taxes, which could achieve emissions reductions while simultaneously accomplishing other objectives such as road safety and funding of infrastructure improve-ments (Parry and Small 2015).
Alternative Policies for Emissions Reductions in the Transportation SectorFuel-economy standards and other transportation sector policies may be more effective at reducing emissions than a modest carbon price in the transportation sector. However, carbon pricing still has many of the same advan-
MECHANISMS FOR EMISSIONS REDUCTIONS ACROSS SECTORS
TABL
E 4
Very Short-Run Effects Short-Run Effects Long-Run Effects Very Long-Run Effects
ELECTRICITY SECTOR
▪ Reduction in usage of higher-carbon (i.e. coal) electricity generation
▪ Efficiency retrofits at existing generating plants
▪ Consumers begin to improve efficiency and reduce electricity use
▪ New low-carbon genera-tion plants built
▪ Consumers continue to improve efficiency and reduce electricity use
▪ Increased innovation and technological change
TRANSPORTATION SECTOR
▪ Producers reduce life-cycle emissions of fuel
▪ Consumers begin to reduce consumption of gasoline & diesel
▪ Increased usage of more fuel-efficient and alternative-fuel vehicles
▪ Consumers continue to reduce consumption of gasoline & diesel
▪ Increased innovation and technological change
OTHER COVERED SECTORS
▪ Producers adjust processes to reduce emissions intensity of equipment and inputs
▪ Consumers begin to reduce demand for higher-carbon goods and services
▪ Producers build and operate lower-carbon facilities
▪ Consumers continue to reduce demand for higher-carbon goods and services
▪ Increased innovation and technological change
tages we described earlier in the context of the electricity sector, including:
▪ Carbon prices provide the broadest incentives for emis-sions reductions. For example, fuel-economy standards require emissions reductions to be achieved by making changes to the vehicle and provide no incen-tives for reduced driving.
▪ Cost-effective emissions reduc-tions can be achieved without needing to forecast the costs or progress of any particular tech-nology. Subsidies for particular technologies risk wasting scarce government resources on the “wrong” technologies.

Putting a Price on Carbon: Reducing Emissions
ISSUE BRIEF | January 2016 | 25
▪ A carbon price encourages tech-nological change by incentivizing regulated entities to continue to reduce emissions beyond any given target. For example, in a study of the phase-out of lead in gasoline, Kerr and Newell (2003) found that the rate of technological adoption was con-siderably faster when a mar-ket-based policy was in effect (compared to when regulated entities had to meet standards individually).
Summary of Economy-wide Emissions Reductions By raising the price of carbon-inten-sive goods and services, a carbon price provides incentives for emis-sions reductions across the economy. Table 4 provides an overview of the mechanisms through which a carbon price encourages emissions reduc-tions. Electricity is the only sector with “very short-run” effects, because the electricity system is uniquely poised to make adjustments based on a carbon price almost immediately. In encouraging technological change, the mechanisms for “very long-run” effects are similar across sectors, although of course, the timing and technologies will differ greatly.
“Other covered sectors” for a carbon pricing policy would likely include (non-electricity) emissions from resi-dential, commercial, and industrial sources. Commercial and residential emissions arise from fossil fuels burned for heating, cooking, and water heating, but also include leaks of refrigerants from air conditioning and refrigeration systems in homes and businesses and methane emis-sions from landfills and wastewater treatment plants (U.S. EPA 2013c). Industrial sector emissions include the burning of fossil fuels for energy and chemical reactions necessary to produce goods from raw materials (at manufacturing plants, petroleum refineries, etc.). Under a carbon
FIG
UR
E 8
EIA’S PESSIMISTIC FORECAST OF ENERGY SECTOR CO2 EMISSIONS REDUCTIONS FROM A CARBON PRICE
Notes:Data from EIA’s Annual Energy Outlook 2014. EIA Reference Case (solid + shaded area) scenario is a forecast of the U.S. energy system assuming only “on the books” policies as of late 2013, and its carbon pricing scenario (solid area only) scenario reflects a $25 per metric ton carbon price implemented in 2015 and increasing 5% per year thereafter. Emissions from the transportation, industrial, commercial, and residential sectors exclude emissions from electricity generation.
0
1
2
3
4
5
6
2015 2020 2025 2030
Ener
gy S
ecto
r CO 2 E
mis
sion
s (b
illio
n m
etric
tons
)
OTHER COVERED SECTORS (INDUSTRIAL, COMMERCIAL, RESIDENTIAL): Remaining Emissions
TRANSPORTATION SECTOR: Remaining Emissions
ELECTRICITY SECTOR: Remaining Emissions
ELECTRICITY SECTOR: Reductions (due to a carbon price)
TRANSPORTATION SECTOR: Emissions Reductions
OTHER COVERED SECTORS: Emissions Reductions
EIA forecast total emissions of 28% below
Reference Case and 32% below 2005 levels
after 15 years

26 |
FIG
UR
E 9
EIA ESTIMATES FOR ECONOMY-WIDE EMISSIONS REDUCTIONS FROM CARBON PRICES
Notes: The Reference Case in EIA’s forecast assumes only public policies that are “on the books” at the time of the forecast. It is identical to EIA’s carbon pricing scenario except for the lack of a carbon price. Source: U.S. EIA’s Annual Energy Outlook 2014.
Chan
ge in
Ene
rgy
Sect
or C
O 2 Em
issi
ons
-35%
-30%
-25%
-20%
-15%
-10%
-5%
0%
Total Emissions vs Reference Case Total Emissions vs 2005 Emissions
2015 2020 2025 2030
-28%
-32%
price, businesses responsible for such emissions will have a financial incentive to seek out lower-carbon production processes, and consum-ers will have a financial incentive to purchase fewer carbon-intensive products or to seek out lower-carbon substitute products. Previous work by WRI has shown that considerable opportunities for emissions reduc-tions are available in these other sectors (Bianco et al. 2013).
Similar to the transportation sector, models of the effects of economy-wide carbon prices typically assume that producers and consumers in “other covered sectors” largely ignore
the financial incentives to reduce emissions. Figure 8 shows the emis-sions reductions across sectors pro-jected by EIA in its AEO 2014 carbon price scenario of $25 per metric ton, implemented in 2015 and rising by 5 percent per year. Projected emissions reductions outside of the electricity sector are almost trivially small. With minor exceptions, EIA predicts that households and businesses will not change their behavior in response to increased heating bills, manufactur-ers will not adjust their production processes in the face of rising input costs, and a sustained increase in the costs of transportation fuels will
not lead to changes on the part of producers or consumers.
Despite these conservative assump-tions, Figure 9 shows the consider-able economy-wide emissions reduc-tions projected by EIA, compared to both EIA’s Reference Case (identical except for the lack of a carbon price) and to 2005 emissions. The results show that a carbon price of $25 per metric ton—implemented in 2015 and rising 5 percent per year—would reduce emissions 22 percent below Reference Case emissions and 27 percent below 2005 emissions by 2025, and 28 percent below Refer-ence Case emissions and 32 percent below 2005 emissions by 2030.

Putting a Price on Carbon: Reducing Emissions
ISSUE BRIEF | January 2016 | 27
StudyTax rate in 2015
($/metric ton CO2e)Annual increase
in tax rateEmissions reductions in
2030 (vs baseline)
McKibben et al. (2012) $17.76 4.0% 11%
Paltsev et al. (2007) $21.16 4.0% 31%
Rausch & Reilly (2012) $21.63 4.0% 19%
Shapiro et al. (2008) $27.27 $1.80 30%
Rausch et al. (2010) $28.99 4.0% 25%
ESTIMATES OF EMISSIONS REDUCTIONS FROM A NATIONAL CARBON PRICE
TABL
E 5
Source: Adapted from Morris and Mathur (2014).
Table 5 shows comparable estimates from the academic literature on carbon pricing. EIA’s estimate of 28 percent below a reference case sce-nario is within the range, displayed in Table 5, of 11 to 31 percent. Of course, higher carbon prices would lead to greater emissions reductions. As we have discussed, modeling fore-casts of emissions reductions tend to depict only those that are virtually certain to take place—that is, the shift away from coal in the electricity sector and conservative estimates of consumer responses to price signals. Various mechanisms described in Table 4 are not accounted for at all, such as the reduced costs of renew-able energy and improvements to the vehicle fleet. This leads us to two related conclusions: (1) such modeling results should be viewed as low-end estimates of the emissions reductions from a carbon price (as
opposed to most likely estimates); and (2) there is relatively little danger that emissions reductions will be lower than these results suggest. The one-sidedness of the emissions uncertainty may have important implications for policy design, as discussed in the next section.
REDUCING EMISSIONS WITH CARBON TAXES AND CAP-AND-TRADEA carbon tax would directly establish a price on carbon dioxide emissions, whereas a cap-and-trade program would establish the price indirectly by limiting total emissions and issu-ing tradable emissions allowances. Both carbon taxes and cap-and-trade programs are characterized by explicit carbon prices that provide all of the short-run and long-run incentives for emissions reductions
described in the previous sections. Both policies also encourage cost-effective emissions reductions, in that they provide incentives to undertake the lowest-cost abate-ment opportunities (absent other market barriers), and both policies can generate revenues that can be used in productive ways. As a result, in energy/economic models like EIA’s, achieving a given emissions target with carbon pricing requires the same trajectory of carbon prices, whether imposed via a carbon tax or cap-and-trade. The price trajec-tory may of course differ based on real-world uncertainties and model-ing design decisions—for example, allowing “offsets” (emissions from sources that are not covered by the policy, such as sources in other countries) can significantly lower the carbon price in a cap-and-trade program.

28 |
Despite their similarities, much ink has been spilled debating which carbon pricing policy is superior. We summarized these differences in Putting a Price on Carbon: A Handbook for U.S. Policymakers (Kennedy et al. 2015) so, for the purposes of this Issue Brief, we focus only on differences in emissions reductions caused by a carbon tax and a cap-and-trade program of equal stringency (i.e. expected to produce an identical trajectory of carbon prices).
As explained in the sections above, U.S. climate change policy should include a portfolio of smart complementary policies alongside a carbon price. Complementary policies can induce additional emissions reductions beyond those encouraged by a carbon tax. Under a cap-and-trade program, emissions reductions from complementary policies are likely to be offset by emissions increases elsewhere.
The advantage of cap-and-trade programs is that they ensure a given level of emissions reductions. Since emissions caps are pre-ordained, the United States could say with near certainty that, under a cap-and-trade program, it will meet its commitment to reduce emissions by 26 to 28 percent relative to 2005 levels by 2030 and by more than 80 percent by 2050. Under a carbon tax, emissions reductions are impossible to predict with certainty. Advocates of cap-and-trade stress the benefits of “emissions certainty” because
climate change damages do not increase linearly with temperature changes, so it is important to keep temperatures below certain thresholds (Repetto 2013). An emissions cap (at the global level) could help ensure that dangerous temperature thresholds are avoided.
On the other hand, scientists do not know exactly how much temperatures will change under any given emissions trajectory or exactly what temperature changes could lead to catastrophic outcomes. Consequently, while the stringency of a carbon pricing policy is critical, policy uncertainties (at the national level) are likely to be lost in the noise of the much larger uncertainties related to the effects of global climate change (Pizer 1997). Put another way, the benefits of precise emissions forecasts may be small unless a carbon tax is severely less effective than expected.
As we have shown, if policy expectations are based on the results of energy/economic models, it is more likely that a carbon price will be significantly more effective than expected. In such circumstances, a carbon tax will lead to larger-than-expected emissions reductions. In contrast, under a cap-and-trade program (without a price floor), emissions reductions are not encouraged below the level of the cap.
A well-designed carbon tax also provides predictability concerning the magnitude of future carbon prices, which encourages long-term investments (and thus innovation) in low-carbon technologies. It ensures that the price signal will not weaken based on unforeseen economic circumstances. Indeed, in the initial stages of the EU-ETS, modeling by the European Commission predicted that allowance prices would steadily increase to roughly 39 Euros per metric ton by 2020 (Capros et al. 2008). Instead, prices have fallen to as low as 4 Euros per metric ton in recent years. The EU would have achieved massive additional emissions reductions if it had opted for a tax at the expected allowance price levels. On the other hand, a tax may not have been a politically viable option. Despite these differences, in the words of Jean Tirole, the 2014 winner of the Nobel Prize in Economics, the debate between cap-and-trade and carbon taxes is “of second order importance” compared to addressing the risks of climate change (Tirole 2012). In fact, “hybrid” policies that utilize “price collars” or automatic tax adjustments could combine the best elements of both. So, while there are legitimate reasons to prefer one policy to the other, both carbon taxes and cap-and-trade are reliable policies that can provide clear and strong economic incentives for reducing emissions in the United States.

Putting a Price on Carbon: Reducing Emissions
ISSUE BRIEF | January 2016 | 29
DISCUSSIONIn this Issue Brief, we described the incentives that a carbon price provides for emissions reductions across sectors of the U.S. economy. A carbon price can transform the electricity sector by dramatically reducing coal generation and increasing the penetration of renewables. In the transportation sector, consumers will drive less and demand more fuel-efficient and alternative-fuel vehicles. Across all sectors, producers, consumers, and investors will be encouraged to find less carbon-intensive products and processes. These incentives, combined with other major benefits of carbon pricing that we describe in Putting a Price on Carbon: A Handbook for U.S. Policymakers, lead us to conclude that a national carbon price can and should be the centerpiece of the U.S. climate strategy.
Congressional action is needed if the United States is to achieve its long-term emissions targets. Accord-ing to recent polls, well over half of Americans support some form of carbon pricing (RFF 2015; Leise-rowitz et al. 2015). Recent federal legislative proposals for carbon pricing policies—including those by Sheldon Whitehouse (D-RI) and Brian Schatz (D-HI) in the Senate, and by Jim McDermott (D-WA) in the House—have all been carbon taxes, at least in part due to the perception that such policies could garner bipartisan support. Indeed, while Republicans almost universally condemn increased EPA regula-tion and cap-and-trade, a growing number of prominent Republicans have expressed support for a carbon tax because it is consistent with conservative and libertarian prin-ciples (Mooney 2015). As we have shown, carbon taxes harness free market forces to achieve emissions reductions. Carbon taxes can also raise revenue to achieve conservative objectives such as reduced taxes and deficits, and they do not require an increase in the size of government.
Absent major political shifts, a national carbon pricing policy is unlikely to pass the U.S. Congress in the next few years, so the cor-nerstone of U.S. efforts to meet its short-term emissions targets will be President Obama’s Climate Action Plan. Fortunately, states are given considerable flexibility to implement the Clean Power Plan (CPP) using carbon pricing programs with multi-state trading.
Both cap-and-trade programs and carbon taxes can be reliable methods of reducing emissions. We have shown that, even in highly pessimistic scenarios, a carbon price starting at $25 per metric ton would generate emissions reductions that are roughly in line with the U.S. short-term targets. In addition, both theory and historical evidence tell us that the breadth of incentives provided by a carbon price would lead to additional emissions reductions that are typically not predicted in model forecasts. Perhaps most importantly, the price signal would encourage investors and entrepreneurs to develop the low-carbon technologies that can drive the transformation to a low-carbon economy in the United States.

30 |
REFERENCESAAA. 2014. “Americans Saved $14 Billion on Gasoline this Year.” AAA Fuel Gauge Report. December. http://fuelgaugereport.aaa.com/ameri-cans-saved-14-billion-on-gasoline-this-year/.
AAAS (American Association for the Advancement of Science). 2015. “Historical Trends in Federal R&D.” Washington, D.C.: AAAS. http://www.aaas.org/page/historical-trends-federal-rd
AAP (Australian Associated Press). 2015. “Carbon Tax Repeal Sparks Jump in Australia’s Electricity Emis-sions.” The Guardian. July 5. http://www.theguardian.com/environment/2015/jul/05/carbon-tax-repeal-sparks-jump-in-australias-electricity-emissions.
ACT (Americas Commercial Transportation Research). 2012. “The Future of Natural Gas Engines in Heavy Duty Trucks: The Diesel of Tomorrow?” ACT Research Co., LLC. August. http://www.actresearch.net/wp-content/uploads/2013/04/ACT_NGP.pdf.
Alvarez, R.A., S.W. Pacala, J.J. Winebrake, W.L. Chameides, and S.P. Hamburg. 2012. “Greater Focus Needed on Methane Leakage from Natural Gas Infrastructure.” Proceedings of the National Academy of Sciences 109(17): 6435–6440. http://www.pnas.org/content/109/17/6435.full.pdf.
Arrow, K.J. 1962. “The Economic Implications of Learning by Doing.” The Review of Economic Studies 29(3): 155–173.
Bazelon, C., and K. Smetters. 1999. “Discounting Inside the Washington D.C. Beltway.” American Economic Association. Journal of Economic Perspectives 13(4): 213–228.
Beck, M., N. Rivers, R. Wigle, and H. Yonezaw. 2015. “Carbon Tax and Revenue Recycling: Impacts on Households in British Columbia.” Resource and Energy Economics 41.
Bellas, A.S. and I. Lange. 2011.“Evidence of Innovation and Diffusion Under Tradable Permit Programs.” International Review of Environmental and Resource Economics 5(1): 1-22.
Bernstein, M.A. and J. Griffin. 2006. “Regional Differences in the Price-Elasticity of Demand for Energy.” National Renewable Energy Laboratory Subcontract Report 620-39512. Santa Monica, CA: RAND Corporation.
Bianco, N., F. Litz, K. Meek, and R. Gasper. 2013. “Can the U.S. Get There from Here? Using Existing Federal Laws and State Action to Reduce Greenhouse Gas Emissions.” Washington, D.C.: World Resources Institute. http://www.wri.org/publication/can-us-get-there-here.
Bianco, N., K. Meek, R. Gasper, M. Obeiter, S. Forbes, and N. Aden. 2014. “Seeing is Believing: Creating a New Climate Economy in the United States.” Washington, D.C.: World Resources Insti-tute. http://www.wri.org/publication/seeing-believ-ing-creating-new-climate-economy-united-states.
Bollinger, B., and K. Gillingham. 2014. “Learn-ing-by-Doing in Solar Photovoltaic Installations.” Working Paper. New Haven, CT: Yale University.
Brons, M., P. Nijkamp, E. Peels, and P. Rietveld. 2008. “A Meta-Analysis of the Price Elasticity of Gasoline Demand: A SUR Approach.” Energy Economics 30(5): 2105–2122.
Burtraw, D., and K. Palmer. 2004. “SO2 Cap-and-Trade Program in the United States.” Chapter 2 in Choosing Environmental Policy: Comparing Instruments and Outcomes in the United States and Europe. Washington, D.C.: Resources for the Future Press. https://books.google.com/books?id=_1tN6S88HPYC&pg=PA48&dq=so2+trading+program+reductions&lr=&source=gbs_selected_pages&cad=3#v=onepage&q=so2%20trading%20program%20reductions&f=false.
Burtraw, D., K.L. Palmer, A. Paul, and M. Woerman. 2012. “Secular Trends, Environ-mental Regulations, and Electricity Markets.” The Electricity Journal 25(6): 35–47. http://www.sciencedirect.com/science/article/pii/S1040619012001546?np=y.
Calel, R., and A. Dechezlepretre. 2012. “Envi-ronmental Policy and Directed Technological Change: Evidence from the European Carbon Market.” Review of Economics and Statistics.
Capros, P., L. Mantzos, V. Papandreou, and N. Tasios. 2008. “Model-based Analysis of the 2008 EU Policy Package on Climate Change and Renewables.” Report to the European Commis-sion. http://ec.europa.eu/clima/policies/package/docs/analysis_en.pdf.
Carbon Tax Center. 2015. “Conservatives.” New York, NY: CTC. http://www.carbontax.org/conser-vatives/
Center for Climate and Energy Solutions. 2014. “Transportation Overview.” Center for Climate and Energy Solutions Climate Techbook. http://www.c2es.org/energy/use/transportation.
Center for Climate and Energy Solutions. 2015. “Federal Vehicle Standards.” http://www.c2es.org/federal/executive/vehicle-standards
Chan, G., R. Stavins, R. Stowe, and R. Sweeney. 2012. “The SO2 Allowance Trading System and the Clean Air Act Amendments of 1990: Reflec-tions on Twenty Years of Policy Innovation.” Cambridge, MA: Harvard Kennedy School. http://www.hks.harvard.edu/m-rcbg/heep/papers/SO2-Brief_digital_final.pdf.
Chetty, R., A. Looney, and K. Kroft. 2007. “Salience and Taxation: Theory and Evidence.” NBER Working Paper No. 13330. http://www.nber.org/papers/w13330.
DeMorro, C., 2012. “2013 Motor Trend Car of the Year is the Tesla Model S.” Motor Trend Magazine. http://gas2.org/2012/11/13/2013-motor-trend-car-of-the-year-is-the-tesla-model-s/.
DeMorro, C., 2013. “Tesla Model S Scores 99/100 on Consumer Reports Test.” Consumer Reports. http://gas2.org/2013/05/10/tesla-model-s-scores-99100-on-consumer-reports-test/.
Elgie, S. 2014. “British Columbia’s Carbon Tax Shift: An Environmental and Economic Success.” Washington, D.C.: The World Bank. http://blogs.worldbank.org/climatechange/british-columbia-s-carbon-tax-shift-environmental-and-economic-success.
Ellerman, A.D., and P.L. Joskow. 2008. “The European Union’s Emissions Trading System in Perspective.” Prepared for the Pew Center on Global Climate Change.” May.http://www.c2es.org/docUploads/EU-ETS-In-Perspective-Report.pdf.
EPRI (Electric Power Research Institute). 2008. “Price Elasticity of Demand for Electricity: A Primer and Synthesis.” EPRI Report. http://www.epri.com/abstracts/Pages/ProductAbstract.aspx?ProductId=000000000001016264&Mode=download
Fawcett, A., L. Clarke, and J. Weyant. 2015. “Car-bon Taxes to Achieve Emissions Targets: Insights from EMF-24.” In Implementing a US Carbon Tax: Challenges and Debates. Edited by I. Parry, A. Mor-ris, and R.C. Williams III. London, UK and New York, NY: Routledge.
Feldman, D., G. Barbose, R. Margolis, R. Wiser, N. Darghouth, and A. Goodrich. 2012. “Photovol-taic (PV) Pricing Trends: Historical, Recent, and Near-Term Projections.” Technical Report. Berke-ley, CA: National Renewable Energy Laboratory and Lawrence Berkeley National Laboratory.
Gerard, D., and L. B. Lave. 2003. “Implement-ing Technology-Forcing Policies: The 1970 Clean Air Act Amendments and the Introduction of Advanced Automotive Emissions Controls.” Technological Forecasting and Social Change 72(7): 761–778.

Putting a Price on Carbon: Reducing Emissions
ISSUE BRIEF | January 2016 | 31
Goulder, L.H. 2010. “Using Cap and Trade to Reduce Greenhouse Gas Emissions.” Washington, D.C.: Resources for the Future. http://www.rff.org/RFF/Documents/RFF-BCK-Goulder-CT.pdf.
Greene, D.L. 2010. “How Consumers Value Fuel Economy: A Literature Review.” Prepared for US EPA.
Hamilton, J.D. 2008. “Understanding Crude Oil Prices.” NBER Working Paper Series. http://www.nber.org/papers/w14492.pdf.
Hausker, K., K. Meek, R. Gasper, N. Aden and M. Obeiter. 2015. “Delivering on the U.S. Climate Commitment: A 10-Point Plan Toward a Low-Carbon Future.” Washington, D.C.: World Resources Institute. https://unfccc.int/files/meetings/cop_15/copenhagen_accord/application/pdf/unitedstatesc-phaccord_app.1.pdf.
Hood, C. 2013. “Managing Interactions Between Carbon Pricing and Existing Energy Policies: Guidance for Policymakers.” Insights Series. Paris, France: International Energy Agency.
ICCT (The International Council on Clean Transpor-tation). 2014. “Global Passenger Vehicle Standards.” ICCT Info & Tools. http://www.theicct.org/info-tools/global-passenger-vehicle-standards.
International Council on Clean Transportation. 2015. “Global Passenger Vehicle Standards.” Blog. Accessed August 1, 2015. http://www.theicct.org/info-tools/global-passenger-vehicle-standards.
IIASA (International Institute for Applied Systems Analysis). 2015. “AR 5 Scenario Database.” Sci-ence for Global Insight. Laxenburg, Austria: IIASA. https://secure.iiasa.ac.at/web-apps/ene/AR5DB/dsd?Action=htmlpage&page=about.
IPCC (Intergovernmental Panel on Climate Change). 2014. “Climate Change 2014: Mitigation of Climate Change.” Working Group III Contribution to the Fifth Assessment Report of the Intergovernmental Panel on Climate Change. Cambridge, UK and New York, NY: Cambridge University Press.
Jaffe, A.B., R.G. Newell, and R.N. Stavins. 2003.“Technological Change and the Environment.” Handbook of Environmental Economics 1: 461–516. http://www.sciencedirect.com/science/article/pii/S1574009903010167.
Jones, C.I., and J.C. Williams. 1998.“Measuring the Social Return to R&D.” Quarterly Journal of Economics 113, 1119–1135.
Jorgenson, D.W., R.J. Goettle, M.S. Ho, and P.J. Wilcoxen. 2013. “Double Dividend: Environmental Taxes and Fiscal Reform in the United States.” Cambridge, MA: MIT Press.
Kennedy, K., M. Obeiter, and N. Kaufman. 2015. “Putting a Price on Carbon: A Handbook for U.S. Policymakers.” Washington, D.C.: World Resources Institute. http://www.wri.org/sites/default/files/carbonpricing_april_2015.pdf.
Keohane, N.O. 2002. “Environmental Policy and the Choice of Abatement Technique: Evidence from Coal-fired Power Plants.” Working Paper. New Haven, CT: Yale School of Management.
Kerr, S., and R.G. Newell. 2003. “Policy-Induced Technology Adoption: Evidence from the U.S. Lead Phasedown.” Journal of Industrial Econom-ics 51: 317–343. http://papers.ssrn.com/sol3/papers.cfm?abstract_id=444351.
Khanna, T., and S. Mingo. 2015. “Brazilian Lessons for Industrial Policy.” Policy Innovations. http://www.policyinnovations.org/ideas/briefings/data/000166/:pf_printable.
Laing, T., M. Sato, M. Grubb, and C. Comberti. 2013. “Assessing the Effectiveness of the EU Emissions Trading System.” Centre for Change Economics and Policy Working Paper No. 126. http://www.lse.ac.uk/GranthamInstitute/wp-content/uploads/2014/02/WP106-effectiveness-eu-emissions-trading-system.pdf.
Leiserowitz, A., E. Maiback, C. Roser-Renouf, G. Feinberg, and S. Rosenthal. 2015. “Climate Change in the American Mind: March, 2015.” New Haven, CT and Fairfax, VA: Yale University and George Mason University. Yale Project on Climate Change Communication.
Linn, J., and C. Munnings. 2013.“How Much Do Fuel Economy Standards Reduce Greenhouse Gas Emissions?” Washington, D.C.: Resources for the Future, Common Resources. http://common-resources.org/2013/how-much-do-fuel-economy-standards-reduce-greenhouse-gas-emissions/.
Linn, J., E. Mastrangelo, and D. Burtraw. 2014.“Regulating Greenhouse Gas from Coal Power Plants Under the Clean Air Act.” Journal of the Association of Environmental and Resource Economists 1(1): 97-134.
Martin, R., L. de Preux, and U. Wagner. 2011. “The Impacts of the Climate Change Levy on Manufacturing: Evidence from Microdata.” NBER Working Paper No. 17446. http://www.nber.org/papers/w17446.
McKibbin, W.J., A.C. Morris, and P.J. Wilcoxen. 2012. “The Potential Role of a Carbon Tax in U.S. Fiscal Reform.” Climate and Energy Economics Discussion Paper. Washington, D.C.: The Brook-ings Institution. http://www.brookings.edu/~/media/research/files/papers/2012/7/carbon-tax-mckibbin-morris-wilcoxen/carbon-tax-mckibbin-morriswilcoxen.pdf.
Mearian, L. 2015. “Toyota, Nissan and Honda to Back Hydrogen Fuel Cell Infrastructure.” Computer World. July 1. http://www.comput-erworld.com/article/2943206/sustainable-it/toyota-nissan-and-honda-to-back-hydrogen-fuel-cell-infrastructure.html.
Mooney, C. 2015. “More and More Conservative Thinkers Want to Tax Carbon. Will Politicians and Activists Follow?” The Washington Post. May 15. http://www.washingtonpost.com/news/energy-environment/wp/2015/05/15/more-and-more-thinkers-on-the-right-want-to-tax-carbon-will-politicians-and-activists-follow/.
Morris, A., and A. Mathur. 2014. “A Carbon Tax in Broader U.S. Fiscal Reform.” Center for Climate and Energy Solutions. http://www.brookings.edu/~/media/research/files/papers/2014/05/22-carbon-tax-broader-us-fiscal-regulation-morris/05222014_carbon_tax_broader_us_fis-cal_reform_morrisa_mathura.pdf.
Murray, B., and N. Rivers. 2015. “British Colum-bia’s Revenue-Neutral Carbon Tax: A Review of the Latest “Grand Experiment” in Environmental Policy.” Energy Policy 86: 674-683.
Murray, B., and P. T. Maniloff. 2015. “Why Have Greenhouse Emissions in RGGI States Declined? An Econometric Attribution to Economic, Energy Market, and Policy Factors.” Energy Economics 51: 581–89.
New Climate Economy. 2014. “Innovation.” Chapter 7 in Better Growth, Better Climate: The New Climate Economy Report. Washington, D.C.: World Resources Institute.
Newell. R.G. 2015. “The Role of Energy Technol-ogy Policy Alongside Carbon Pricing.” Chapter 10 in Implementing a U.S. Carbon Tax: Chal-lenges and Debates. Edited by I. Parry, A. Morris and R. Williams II. London, UK and New York, NY: Routledge.
Palmer, K., W.E. Oates, and P.R. Portney. 1995. “Tightening Environmental Standards: The Benefit-Cost or the No-Cost Paradigm?” The Journal of Economic Perspectives 9(4): 119–132. http://www.ucl.ac.uk/cserge/Palmer%20et%20al%201995.pdf.

32 |
Parry, I., and K. Small. 2015. “Implications of Carbon Taxes for Transportation Policies.” Chapter 12 in Implementing a U.S. Carbon Tax: Challenges and Debates. Edited by I. Parry, A. Morris and R. Williams II. London, UK and New York, NY: Routledge.
Paul, A., E. Myers and K. Palmer. 2009. “A Partial Adjustment Model of U.S. Electricity Demand by Region, Season, and Sector.” RFF Discussion Paper 08-50. Washington, D.C.: Resources for the Future. http://www.rff.org/files/sharepoint/Wor-kImages/Download/RFF-DP-08-50.pdf.
Pizer, W.A. 1997. “Prices vs. Quantities Revisited: The Case of Climate Change.” RFF Discussion Paper 98–02. Washington, D.C.: Resources for the Future. http://www.rff.org/documents/RFF-DP-98-02.pdf.
Popp, D. 2009. “Policies for the Development and Transfer of Eco-Innovations: Lessons from the Literature.” Paris, France: OECD Environ-ment Working Papers No. 10. DOI:http://dx.doi.org/10.1787/218676702383.
Porter, M.E., and C. van der Linde. 1995. “Green and Competitive: Ending the Stalemate.” Harvard Business Review 73(5).
Ramey, V.A., and D.J. Vine. 2010. “Oil, Automo-biles, and the U.S. Economy: How Much have Things Really Changed?” NBER Working Paper Series. http://www.nber.org/papers/w16067.pdf.
Ramseur, J.L. 2015. “The Regional Greenhouse Gas Initiative: Lessons Learned and Issues for Congress.” Congressional Research Service. https://www.fas.org/sgp/crs/misc/R41836.pdf.
Rausch, S., G.E. Metcalf, J.M. Reilly, and S. Palt-sev. 2010. “Distributional Implications of Alterna-tive U.S. Greenhouse Gas Control Measures.” The B.E. Journal of Economic Analysis & Policy 10, no. 2: Article 1.
Rausch, S., and J. Reilly. 2012. “Carbon Tax Revenue and the Budget Deficit: A Win-Win-Win Solution?” Report No. 228. Boston, MA: MIT Joint Program on the Science and Policy of Global Change. http://globalchange.mit.edu/files/document/MITJPSPGC_Rpt228.pdf.
Repetto, R. 2013. “Cap and Trade is Better Climate Policy than a Carbon Tax.” United Nations Founda-tion. http://www.energyfuturecoalition.org/files/web-fmuploads/captrade_paper_revised_rd_clean.pdf.
RFF (Resources for the Future). 2015. “Surveying American Attitudes toward Climate Change and Clean Energy.” Washington, D.C.: RFF. http://www.rff.org/research/collection/surveying-american-attitudes-toward-climate-change-and-clean-energy
Rivers, N., and B. Schaufele. 2014. “Salience of Carbon Taxes in the Gasoline Market.” Social Sci-ence Research Network. Available at http://papers.ssrn.com/sol3/papers.cfm?abstract_id=2131468.
Ryan, L., S. Moarif, E. Levina, and R. Baron. 2011. “Energy Efficiency Policy and Carbon Pricing.” Energy Efficiency Series Information Paper. Paris, France: International Energy Agency Energy. https://www.iea.org/publications/freepub-lications/publication/EE_Carbon_Pricing.pdf.
Searchinger, T., and R. Heimlich. 2015. “Avoiding Bioenergy Competition for Food Crops and Land.” Washington, D.C.: World Resources Institute. http://www.wri.org/sites/default/files/avoiding_bio-energy_competition_food_crops_land.pdf.
Shapiro, R., N. Pham, and A. Malik. 2008. “Address-ing Climate Change Without Impairing the U.S. Economy: The Economics and Environmental Science of Combining a Carbon-Based Tax and Tax Relief.” Washington, D.C.: The U.S. Climate Task Force. http://www.sonecon.com/docs/studies/CarbonTaxReport-RobertShapiro-2008.pdf.
Shellenberger, M., M. Swain, A. Trembath, and T. Nordhaus. 2014. “Natural Gas Overwhelmingly Replaces Coal.” The Breakthrough Institute. http://thebreakthrough.org/index.php/issues/natural-gas/natural-gas-overwhelmingly-replaces-coal.
Shellenberger, M., T. Nordhaus, and J. Jenkins. 2011. “Energy Emergence: Rebound and Backfire as Emergent Phenomena.” Oakland, CA: The Breakthrough Institute. http://thebreakthrough.org/archive/new_report_how_efficiency_can.
Taylor, M., C. Anna Spurlock, and Hung-Chia Yang. 2015. “Confronting Regulatory Cost and Quality Expectations: An Exploration of Techni-cal Change in Minimum Efficiency Performance Standards.” Berkeley, CA: Lawrence Berkeley National Laboratory. http://eetd.lbl.gov/publica-tions/confronting-regulatory-cost-and-quali
Tirole, J. 2012. “Some Political Economy of Global Warming.” Economics of Energy & Environmental Policy 1(1).
UCS (Union of Concerned Scientists). 2013. “The Blend Wall and the Future of the Renewable Fuels Standard.” Cambridge, MA: UCS. http://www.ucsusa.org/sites/default/files/legacy/assets/documents/clean_vehicles/RFS-Blend-Wall-Factsheet.pdf).
UCS. 2015. “Fuel Economy Basics.” Cambridge, MA: UCS. Accessed August 1, 2015. http://www.ucsusa.org/clean_vehicles/smart-transportation-solutions/better-fuel-efficiency/fuel-economy-basics.html#.VZPwVvloKUk.
UNFCCC (United Nations Framework Conven-tion on Climate Change). 2009. “Copenhagen Accord.” United Nations Conference of the Parties fifteenth session. December 2009. http://unfccc.int/resource/docs/2009/cop15/eng/l07.pdf.
U.S. DOE (U.S. Department of Energy). 2014a. “The History of the Electric Car.” Energy.Gov article. Washington, D.C.: U.S. DOE. September 15. http://energy.gov/articles/history-electric-car.
U.S. DOE. 2014b. “Alternative Fuel Vehicles in Use.” Washington, D.C.: U.S. Department of Energy, Alternative Fuels Data Center. http://www.afdc.energy.gov/data/10300.
U.S. DOE. 2015. “U.S. HEV Sales by Model.” Washington, D.C.: U.S. Department of Energy, Alternative Fuels Data Center. http://www.afdc.energy.gov/data/10301.
U.S. DOT (U.S. Department of Transportation). 2015. Table 4–23: Average Fuel Efficiency of U.S. Light Vehicles. Washington, D.C.: DOT Bureau of Transportation Statistics. http://www.rita.dot.gov/bts/sites/rita.dot.gov.bts/files/publications/national_transportation_statistics/html/table_04_23.html.
U.S. EIA (U.S. Energy Information Administra-tion). 2009. “Energy Market and Economic Impacts of H.R. 2454, the American Clean Energy and Security Act of 2009.” U.S. Depart-ment of Energy. http://www.eia.gov/analysis/requests/2009/hr2454/pdf/sroiaf(2009)05.pdf.
U.S. EIA. 2012. “Electric Generator Dispatch Depends on System Demand and the Relative Cost of Operation.” Today in Energy. August 17. Washington, D.C.: U.S. Department of Energy.
U.S. EIA. 2014a. “Annual Energy Outlook 2014 with Projections to 2040.” Washington, D.C.: U.S. Department of Energy. April. http://www.eia.gov/forecasts/aeo/pdf/0383(2014).pdf.
U.S. EIA. 2014b. “Gasoline Prices Tend to Have Little Effect on Demand For Travel.” Today in Energy. Washington, D.C.: U.S. Department of Energy. December. http://www.eia.gov/todayinen-ergy/detail.cfm?id=19191.
U.S. EIA. 2014c. “Increasing Ethanol Use Has Reduced the Average Energy Content of Retail Motor Gasoline.” Today in Energy. Washington, D.C.: U.S. Department of Energy. October. http://www.eia.gov/todayinenergy/detail.cfm?id=18551#.

Putting a Price on Carbon: Reducing Emissions
ISSUE BRIEF | January 2016 | 33
U.S. EIA. 2015a. “Electric Power Monthly.” Table 1.1. Net Generation by Energy Source: Total (All Sectors), 2005-August 2015. Washington, D.C.: U.S. EIA. http://www.eia.gov/electricity/monthly/epm_table_grapher.cfm?t=epmt_1_1.
U.S. EIA. 2015b. “What is U.S. Electricity Generation by Energy Source?” Frequently Asked Questions. Last updated March 31, 2015. Washinton, D.C.: U.S. EIA. http://www.eia.gov/tools/faqs/faq.cfm?id=427&t=3.
U.S. EIA. 2015c. “Levelized Cost and Levelized Avoided Cost of New Generation Resources in the Annual Energy Outlook 2015.” Annual Energy Out-look 2015. Washington, D.C.: U.S. EIA. http://www.eia.gov/forecasts/aeo/electricity_generation.cfm.
U.S. EIA. 2015d. “How Much Carbon Dioxide is Produced per Kilowatt/hour When Generating Electricity with Fossil Fuels?” Frequently Asked Questions. Last updated March 30, 2015. Wash-ington, D.C. U.S. EIA. http://www.eia.gov/tools/faqs/faq.cfm?id=74&t=11.
U.S. EIA. 2015e. “Scheduled 2015 Capacity Addi-tions Mostly Wind and Natural Gas; Retirements Mostly Coal.” Today in Energy. Washington, D.C.: U.S. Department of Energy. March. http://www.eia.gov/todayinenergy/detail.cfm?id=20292.
U.S. EIA. 2015f. “How Much Carbon Dioxide is Produced When Different Fuels are Burned?” Washington, D.C.: U.S. Department of Energy. http://www.eia.gov/tools/faqs/faq.cfm?id=73&t=11.
U.S. EPA. 2010. “U.S. Life Cycle Greenhouse Gas Emissions of Biofuels.” Washington, D.C.: U.S. EPA, Renewable Fuel Standard Program (RFS2) Regulatory Impact Analysis. Accessed via U.S. DOE, Alternative Fuels Data Center. http://www.afdc.energy.gov/data/widgets/10328.
U.S. EPA (U.S. Environmental Protection Agency). 2013a. “Inventory of U.S. Greenhouse Gas Emis-sions and Sinks.” Washington, D.C.: U.S. EPA. http://www.epa.gov/climatechange/ghgemissions/usinventoryreport.html.
U.S. EPA. 2013b. “Sources of Greenhouse Gas Emissions: Transportation.” Washington, D.C.: U.S. EPA. http://www3.epa.gov/climatechange/ghgemis-sions/sources/transportation.html.
U.S. EPA. 2013c. “Sources of Greenhouse Gas Emissions: Commercial and Residential.” Washington, D.C.: U.S. EPA. http://www3.epa.gov/climatechange/ghgemissions/sources/.
U.S. EPA. 2015. “Regulatory Impact Analysis for the Clean Power Plan Final Rule.” Washington, D.C.: U.S. EPA. http://www2.epa.gov/sites/production/files/2015-08/documents/cpp-final-rule-ria.pdf.
U.S. Government. 2012. “Obama Administration Finalizes Historic 54.5 MPG Fuel Efficiency Stan-dards.” Washington, D.C.: The White House, Office of the Press Secretary. April 28. https://www.white-house.gov/the-press-office/2012/08/28/obama-administration-finalizes-historic-545-mpg-fuel-efficiency-standard.
Wynn, G. 2014. “U.S. Rollout of Electric Charging Stations Slowing Down.” Climate Home. April 30. http://www.climatechangenews.com/2014/04/30/us-rollout-of-electric-charging-stations-slowing-down/.
ENDNOTES1. See data from U.S. Energy Information
Administration at: http://www.eia.gov/electricity/monthly/epm_table_grapher.cfm?t=epmt_1_01.
2. Under a cap-and-trade program, the carbon price generates government revenue only if emissions allowances are auctioned instead of freely allocated.
3. To the extent that the burden of higher electric-ity prices falls on low-income households, it is important that the carbon price is designed (or alternative policies are implemented) to ensure that these households are compensated for the price change. WRI is publishing an Issue Brief in 2016 on the regional and socioeconomic effects of a carbon pricing policy.
4. Natural gas plants are less expensive, and EPA’s proposed greenhouse gas emissions regulations for new power plants requires at least partial carbon capture and storage at all new coal-fired power plants.
5. The 2015 Annual Energy Report was released in April 2015, but it does not include any carbon pricing scenarios.
6. For example, see the carbon prices required to meet the 450 ppm targets at the IPCC AR5 Scenario Database (IIASA 2015).
7. For example, see the costs of renewables used by EPA in its recent analysis of the Clean Power Plan using the IPM model: http://www.epa.gov/airmarkets/programs/ipm/psmo-del515.html.
8. For further description of the technologies listed here, as well as additional examples, see http://www.wri.org/publication/seeing-believing-creating-new-climate-economy-united-states.
9. The overall benefits of biofuels are highly controversial—Searchinger and Heimlich (2015) argue that once factors such as land use and the effects on food prices are fac-tored in, biofuels are an extremely inefficient energy alternative. See: http://www.wri.org/sites/default/files/avoiding_bioenergy_com-petition_food_crops_land.pdf
10. See http://energy.gov/eere/vehicles/downloads/fact-835-august-25-2014-average-annual-gasoline-pump-price-1929-2013-dataset.
11. Adjusted fuel economy data retrieved from Table 3.3.1 in “Full Report Tables” (http://www.epa.gov/oms/fetrends-complete.htm).
12. Note that this does not include the potential effects of methane releases from the process of producing natural gas. http://www.scdigest.com/gsc/NEWS/15-05-27-1.php?CID=9341 Studies have shown that for natural gas to present lifetime climate benefits compared to diesel, the upstream methane leakage rate must be kept to 1 percent or less. See Alvarez et al. (2012).
13. For example, Goulder’s (2010) model of the cap-and-trade program proposed as part of the “Waxman-Markey” bill forecasted transportation sector emissions reductions of roughly 6 to 7 percent in 2030.
14. There are multiple reasons for increas-ing carbon prices. First, future emissions are projected to produce larger damages, because physical and economic systems become more stressed over time in response to climate change (see the U.S. Interagency Working Group on the Social Cost of Carbon). Second, an increasing carbon price could induce more gradual changes to the economy, thus reducing the costs of transition. Finally, carbon permits will tend to increase at the rate of interest; otherwise arbitrage opportunities would exist.
15. For further description of the technologies listed here, as well as additional examples, see Bianco et al. (2014).
16. For a map of all Supercharger stations, see http://www.teslamotors.com/supercharger.
17. For the most recent financial data for Tesla and its competitors, see http://finance.yahoo.com/q/co?s=TSLA.

34 |
ABOUT THE AUTHORSNoah Kaufman is an economist for the U.S. Climate Initiative in the Global Climate Program. The focus of his work is on carbon pricing and the economic impacts of climate change policies. Prior to joining WRI, Noah worked for the Environment Practice at NERA Economic Consulting. Noah has published peer-reviewed journal articles on the topics of the social cost of carbon dioxide emissions, the role of risk aversion in environmental policy evaluations, and the design of incentives to support green consumer products and energy-efficiency pro-grams run by electric and gas utilities. His Ph.D. dissertation examined optimal policy responses to climate change.
Contact: [email protected]@wri.org
Michael Obeiter was formerly a Senior Associate in WRI’s Global Climate Program. As a member of the U.S. Climate Initiative, he worked to advance climate and clean energy policies at the national level. His work focused on methane emissions from natural gas, power plant standards, and carbon taxes.
Contact: [email protected]
Eleanor Krause conducts research and analy-sis for WRI's Carbon Pricing program through the U.S. Climate Initiative. She will complete her MPA at the University of Washington's Evans School of Public Policy and Governance in June 2016. Her research focuses on the nexus of economics, climate change, and domestic energy policy.
Contact: [email protected]
ACKNOWLEDGMENTS The authors would like to thank the follow-ing individuals for their valuable insights and critical reviews of this work: Sam Adams, Juan Carlos Altamirano, Christina DeConcini, Karl Hausker, Noah Kirsch, Ray Kopp, Larry Linden, Doug Scott, Ranping Song, Letha Tawney, and Roger Ullman. The authors would also like to thank Emily Matthews for copyediting and proofreading. In addition, we thank Carni Klirs, and Julie Moretti for publication layout and design. Funding for this project was provided by the Linden Trust for Conservation. While our reviewers were very generous with their time and advice, this working paper represents the views of the authors alone.

Each World Resources Institute issue brief represents a timely, scholarly treatment of a subject of public concern. WRI takes responsibility for choosing the study topics and guaranteeing its authors and researchers freedom of inquiry. It also solicits and responds to the guidance of advisory panels and
expert reviewers. Unless otherwise stated, however, all the interpretation and findings set forth in WRI publications are those of the authors.
Copyright 2016 World Resources Institute. This work is licensed under the Creative Commons Attribution 4.0 International License. To view a copy of the license, visit http://creativecommons.org/licenses/by/4.0/
ABOUT WRI World Resources Institute is a global research organization that turns big ideas into action at the nexus of environment, economic opportunity and human well-being.
Our ChallengeNatural resources are at the foundation of economic opportunity and human well-being. But today, we are depleting Earth’s resources at rates that are not sustainable, endangering economies and people’s lives. People depend on clean water, fertile land, healthy forests, and a stable climate. Livable cities and clean energy are essential for a sustainable planet. We must address these urgent, global challenges this decade.
Our VisionWe envision an equitable and prosperous planet driven by the wise management of natural resources. We aspire to create a world where the actions of government, business, and communities combine to eliminate poverty and sustain the natural environment for all people.
Our Approach
COUNT ITWe start with data. We conduct independent research and draw on the latest technology to develop new insights and recommendations. Our rigorous analysis identifies risks, unveils opportunities, and informs smart strategies. We focus our efforts on influential and emerging economies where the future of sustainability will be determined.
CHANGE ITWe use our research to influence government policies, business strategies, and civil society action. We test projects with communities, companies, and government agencies to build a strong evidence base. Then, we work with partners to deliver change on the ground that alleviates poverty and strengthens society. We hold ourselves accountable to ensure our outcomes will be bold and enduring.
SCALE ITWe don’t think small. Once tested, we work with partners to adopt and expand our efforts regionally and globally. We engage with decision-makers to carry out our ideas and elevate our impact. We measure success through government and business actions that improve people’s lives and sustain a healthy environment.

10 G STREET NE SUITE 800WASHINGTON, DC 20002, USA+1 (202) 729-7600WWW.WRI.ORG 978-1-56973-882-5