putting the magnet market trends together - magmatllc.com 2018 - big picture... · slide 1 title...
TRANSCRIPT

Slide 1
Title Here
Author
Venue
Date
The Big Picture
Putting the Magnet Market Trends Together
Steve Constantinides
Orlando, Florida, February 8, 2018

Slide 2
Preface
Population World Forecast World Net
2017 Share 2030 Share Change
Asia 4,504,428,373 59.7% 5,039,637,399 58.2% 535,209,026
Africa 1,256,268,025 16.6% 1,699,457,399 19.6% 443,189,374
Europe 742,073,853 9.8% 749,229,191 8.7% 7,155,338
Latin America and
the Caribbean645,593,253 8.6% 729,201,164 8.4% 83,607,911
North America 361,207,811 4.8% 394,151,461 4.6% 32,943,650
Oceania 40,690,786 0.5% 48,249,541 0.6% 7,558,755
World 7,550,262,101 8,659,926,155
Region
http://www.worldometers.info/world-population/population-by-country/
World Population by Region
Slide 3
Agenda
Magnet Production & Material Supply
Applications
Hard Disk Drives
Transportation
Wind Power
Magnetic Refrigeration
Summary Comments
Balancing Supply and Demand

Slide 4
Commercially available magnets
Permanent magnets
• Alnico
• Ferrite (strontium ferrite, ceramic)
• Neodymium iron boron (“Neo”)
• Samarium cobalt
• Samarium iron nitride
• Bonded magnets
– Include all of the materials listed above singly or in combination
– Are produced in four forms / methods
Compression bonded, Injection molded, Extruded, Calendered
Semi-hard magnets
• FeCrCo
• Vicalloy

Slide 5
Global Sales of Permanent Magnets
Sources: Multiple including Benecki, Clagett and Trout; JL Mag; Yang Luo; Wang et al; numerous industry sources.
Data updated as of 2/1/17.
tons % $million % $/kg tons % $million % $/kg
NdFeB 80,900 12.3% 6,850 65.2% 84.67 105,000 13.1% 7,250 52.7% 69.05
SmCo 2,310 0.4% 270 2.6% 116.88 3,864 0.5% 345 2.5% 89.29
Ferrite 567,000 86.4% 2,950 28.1% 5.20 685,000 85.5% 5,625 40.9% 8.21
Alnico 5,555 0.8% 375 3.6% 67.51 5,950 0.7% 375 2.7% 63.03
Other 540 0.1% 65 0.6% 120.37 1,450 0.2% 170 1.2% 117.24
Totals 656,305 100.0% 10,510 100.0% 16.01 801,264 100.0% 13,765 100.0% 17.18
2010 Actual 2016 Estimate

Slide 6
Global production of REO (USGS)
Phosphors for color TVs
and fluorescent lights
SmCo permanent magnets
NdFeB permanent magnets
Slide 7
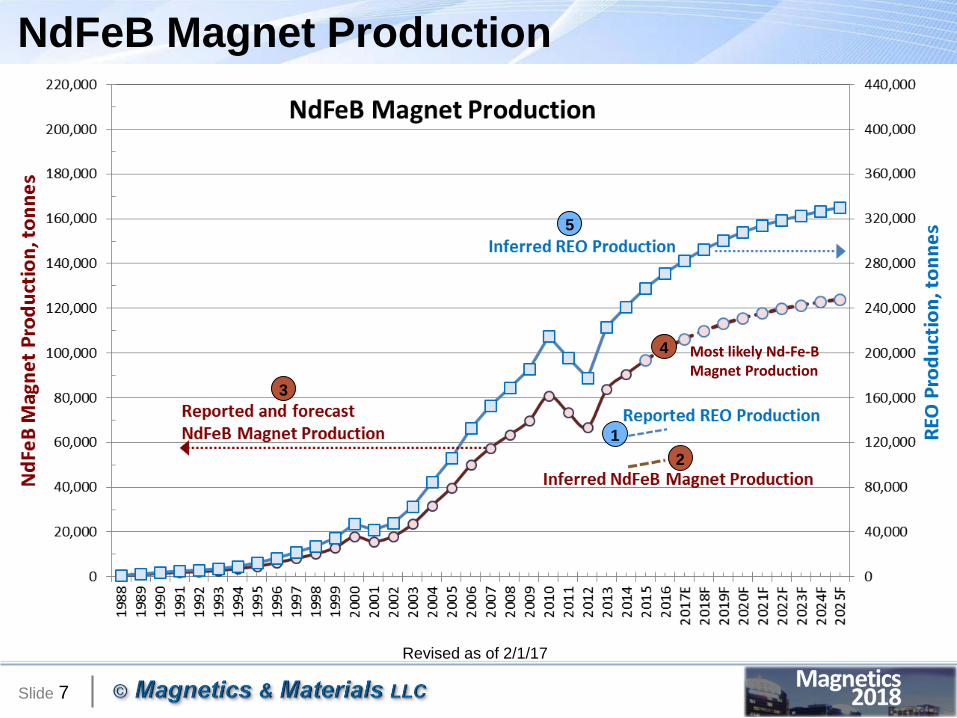
NdFeB Magnet Production
3
5
1
2
4 Most likely Nd-Fe-B Magnet Production
Revised as of 2/1/17

Slide 8
Lynas Production of REO
• Malawi operations
– Since fiscal year 2012, no further capital investment has been made on the
Kangankunde Rare Earths (“KGK”) resource development in Malawi
– Project remains on hold
• Ready-for-Sale tonnage

Slide 9
Agenda
Magnet Production & Material Supply
Applications
Hard Disk Drives
Transportation
Wind Power
Magnetic Refrigeration
Summary Comments

Slide 10
• HDD (Global): Magnet total weight consumed in 2016 was = 6,370 tonnes
• Hybrid and electric cars & trucks (Global): in growth phase
– Total neo magnet usage in 2015 = 3,850 rising to 18,025 tpa in 2020
• EB (electric bicycles, primarily in Asia): large and growing application
– Annual neo magnet usage in 2015 = 9,580 rising to 13,000 tpa by 2020
• Wind turbines (Global): use of PM generators mostly in China until 2020
– Global 2015 consumption = 16,600 tonnes rising to 29,000 tpa in 2020
• Cooling, Refrigeration (rapid growth primarily southeast Asia and India)
– Neo usage in 2015= >5,000 tpa growing to 7,000 tpa om 2020
– Magnetocaloric cooling potential new application starting in early 2020s
• Acoustic transducers and miniature applications– Speakers in transportation – more than 280 million speakers per year (ferrite+Neo)
– Speakers, ear buds, headphones Neo usage in 2015 = 7,470 tpa
• Other applications using permanent magnets– Motors and generators in aircraft– Oil and gas well directional drilling– Building elevators (lifts)– Over 100 magnets in a typical car – more than a dozen applications
Major and Developing Uses of Neo Magnets
2015: 6.8 billion cell phones are connected

Slide 11
Agenda
Magnet Production & Material Supply
Applications
Hard Disk Drives
Transportation
Wind Power
Magnetic Refrigeration
Summary Comments

Slide 12
HDD to SSD Conversion

Slide 13
HDD Production (per Statistica)
Peaked at 650 million shipped units in 2010
Slide 14
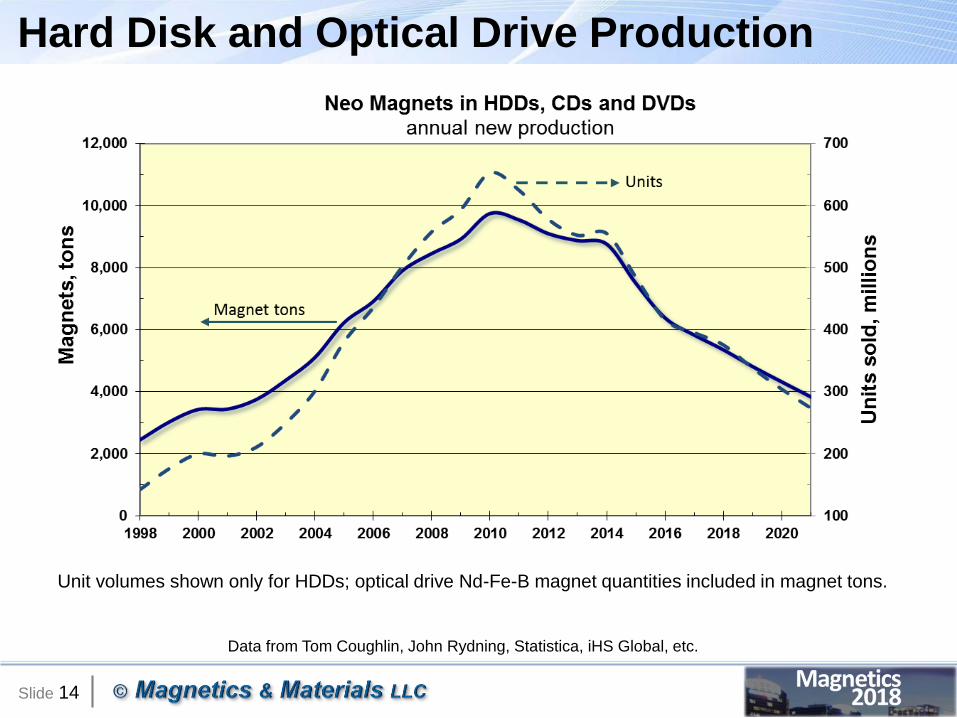
Hard Disk and Optical Drive Production
Data from Tom Coughlin, John Rydning, Statistica, iHS Global, etc.
Unit volumes shown only for HDDs; optical drive Nd-Fe-B magnet quantities included in magnet tons.

Slide 15
Agenda
Magnet Production & Material Supply
Applications
Hard Disk Drives
Transportation
Wind Power
Magnetic Refrigeration
Summary Comments

Slide 16
ICE Vehicle Energy BudgetF
uel E
nerg
y
Inertia & Braking ….. 8%
Aerodynamic drag …….. 2%
Rolling resistance …………..3%
37%
Exhaust
heat
25%
Cooling
system
12%
Pumping
losses
9%
Trans-
mission
3%
Driveline
friction
1%
Accessories
13% To Wheels
100 units of input energy result in only 13 units of
usable propulsion energy
Adapted from - Direct Conversion of Heat to Electricity, T.A. Keim and I. Celanovic, Convergence 2008
And from - Energy Storage in Transportation, Dr. J.M. Miller, presentation at Florida State University
EVs to have large impact on these

Slide 17
Growth forecast for emerging markets

Slide 18
% of total Mkt 1.99% 0.42% 0.48% 0.00% 0.01% 0.79% 3.68%
2017
2016
Manufacturer Hybrid PHEV BEV CNG FCEV Diesel Total Total%
Accura 2,680 - - - - - 2,680 0.41%
Audi - 2,877 - - - 415 3,292 0.50%
BMW - 14,457 6,276 - - 5,211 25,944 3.96%
GM 5,902 20,573 23,320 - - 14,597 64,392 9.82%
Fiat - Chrysler - 2,981 3,336 - - 7,839 14,156 2.16%
Ford 73,655 17,772 1,817 - - 44,576 137,820 21.02%
Honda 22,781 903 1,121 - 432 - 25,237 3.85%
Hyundai 20,315 1,092 432 - 28 - 21,867 3.33%
Infiniti 1,226 - - - - - 1,226 0.19%
Jaguar - - - - - 4,565 4,565 0.70%
Jeep - - - - - 725 725 0.11%
Kia 32,774 1,512 2,157 - - - 36,443 5.56%
Land Rover - - - - - 5,707 5,707 0.87%
Lexus 22,144 - - - - - 22,144 3.38%
Mercedes 3 1,946 744 - - 106 2,799 0.43%
Mini Cooper - 475 - - - - 475 0.07%
Mitsubishi - - 6 - - - 6 0.00%
Nissan 1,455 - 11,230 - - - 12,685 1.93%
Porsche - 1,592 - - - - 1,592 0.24%
Smart - - 544 - - - 544 0.08%
Subaru 45 - - - - - 45 0.01%
Tesla - - 49,970 - - - 49,970 7.62%
Toyota 181,124 20,936 - - 1,838 - 203,898 31.09%
Volkswagen 70 - 3,534 - - 11,069 14,673 2.24%
Volvo - 2,876 - - - - 2,876 0.44%
TOTAL 364,174 89,992 104,487 0 2,298 94,810 655,761 100.00%
% of alt. fuel 55.53% 13.72% 15.93% 0.00% 0.35% 14.46% 100.00%
% of total Mkt 2.13% 0.53% 0.61% 0.00% 0.01% 0.55% 3.83%
2017 annual sales based on sales through December
Sale
s o
f alt
ern
ati
ve d
rive c
ars
an
d s
mall
tru
cks,
US
A

Slide 19
Global Market for BEV & PHEV
These include all global BEV and PHEV passenger cars sales, light
trucks in USA/Canada and light commercial vehicle in Europe.

Slide 20
Commodity Requirements for EVs
Incremental Commodity Demand in a 100 percent EV World - UBS – 2017
Also see page 74 of: http://www.advantagelithium.com/_resources/pdf/UBS-Article.pdf

Slide 21
Buffet on ICE
According to BNEF, the world's biggest auto manufacturers are only
planning to sell a combined 8 million electric cars per year by 2030.Stephen Lacey July 17, 2017
Buffett Bets on the Fossil-Fuel Highway“The oracle of Omaha knows a policy bubble when he
sees it-and electric vehicles are a prime case.”BUSINESS WORLD by Holman W. Jenkins, Jr.
Wall Street Journal, 7-October 2017
Bloomberg New Energy Finance
On the other hand...

Slide 22
Steve’s Forecast - USA market
1-year intervals 3, 5-year intervals
These technologies
use electric traction
drive motors
New car and small truck sales
3.8%
2025
F’cst
Slide 23
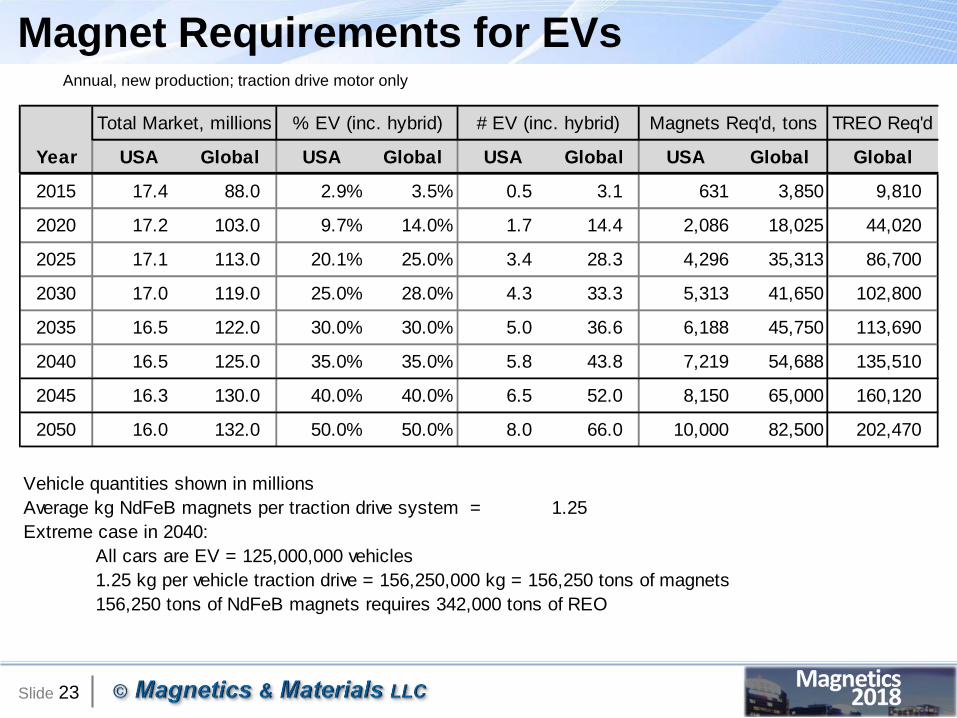
Magnet Requirements for EVsAnnual, new production; traction drive motor only
TREO Req'd
Year USA Global USA Global USA Global USA Global Global
2015 17.4 88.0 2.9% 3.5% 0.5 3.1 631 3,850 9,810
2020 17.2 103.0 9.7% 14.0% 1.7 14.4 2,086 18,025 44,020
2025 17.1 113.0 20.1% 25.0% 3.4 28.3 4,296 35,313 86,700
2030 17.0 119.0 25.0% 28.0% 4.3 33.3 5,313 41,650 102,800
2035 16.5 122.0 30.0% 30.0% 5.0 36.6 6,188 45,750 113,690
2040 16.5 125.0 35.0% 35.0% 5.8 43.8 7,219 54,688 135,510
2045 16.3 130.0 40.0% 40.0% 6.5 52.0 8,150 65,000 160,120
2050 16.0 132.0 50.0% 50.0% 8.0 66.0 10,000 82,500 202,470
Vehicle quantities shown in millions
Average kg NdFeB magnets per traction drive system = 1.25
Extreme case in 2040:
All cars are EV = 125,000,000 vehicles
1.25 kg per vehicle traction drive = 156,250,000 kg = 156,250 tons of magnets
156,250 tons of NdFeB magnets requires 342,000 tons of REO
Total Market, millions % EV (inc. hybrid) # EV (inc. hybrid) Magnets Req'd, tons

Slide 24
Agenda
Magnet Production & Material Supply
Applications
Hard Disk Drives
Transportation
Wind Power
Magnetic Refrigeration
Summary Comments

Slide 25
Wind Energy
Charles Francis Brush wind
mill from 1888
GE Gen-4 Permanent magnet
generator
Producing electricity from wind
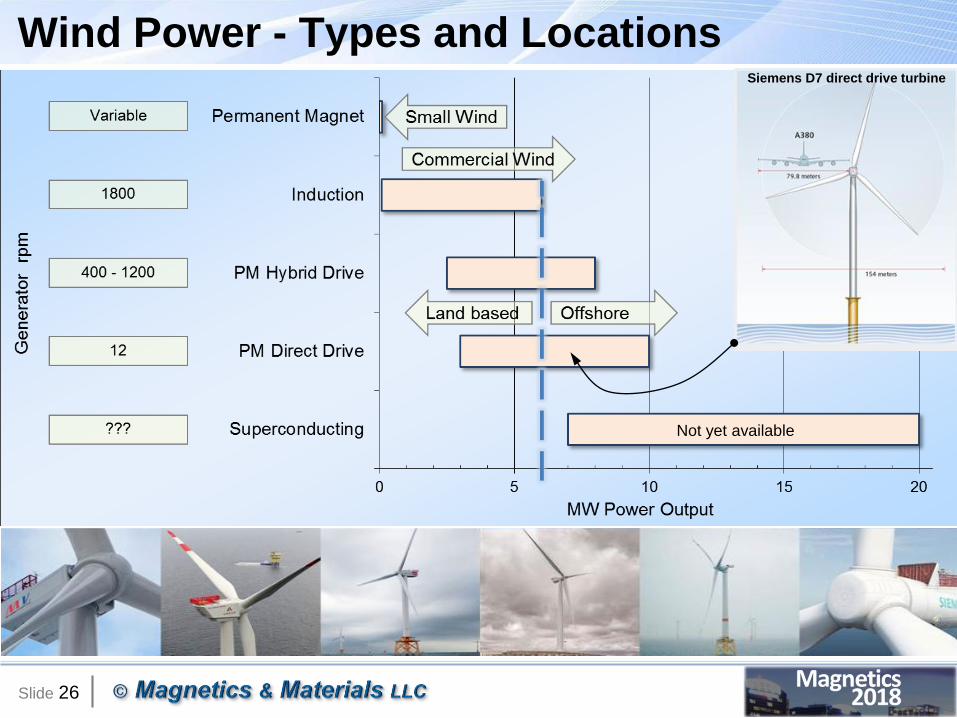
Slide 26
Wind Power - Types and LocationsSiemens D7 direct drive turbine
Not yet available

Slide 27
Offshore Wind Turbine Size
https://www.greentechmedia.com/articles/read/an-illustrated-guide-to-the-growing-size-of-wind-turbines#gs.MGcuL8E

Slide 28
Electricity Generation in the USA
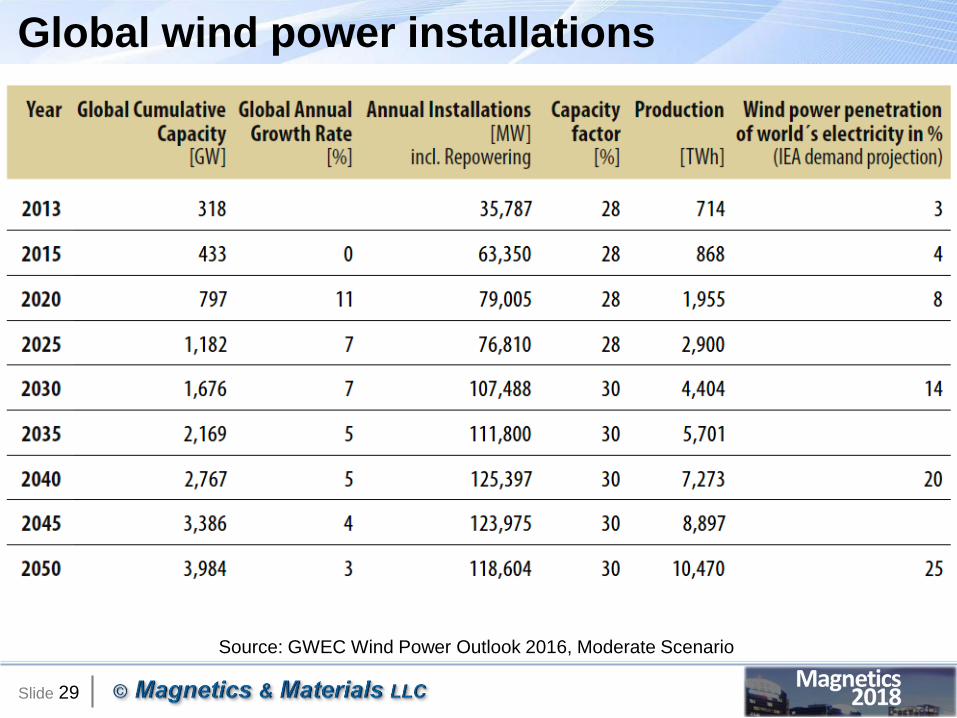
Slide 29
Global wind power installations
Source: GWEC Wind Power Outlook 2016, Moderate Scenario

Slide 30
Direct and Hybrid Drive Generator: Magnet Requirements
Forecast
Annual New Installed Capacity and Magnet Weight
Increasingly includes repowering

Slide 31
Agenda
Magnet Production & Material Supply
Applications
Hard Disk Drives
Transportation
Wind Power
Magnetic Refrigeration
Summary Comments

Slide 32
Agenda – from MCMA Fall TechCon Presentation
• Conventional Refrigeration
• Markets for Cooling Technology
• MCE & GMCE
• MCE System and Materials
• Status and Opportunity
Mark Bowman of Ames Laboratory
Inquiry Online Magazine. "The Big Chill“ about the discovery of the GMCE
http://www.external.ameslab.gov/News/Inquiry/fall97/bigchill.html. 1997 [Ref.8]
Karl Gschneidner
Ames Laboratory, 1997
The Big Chill –
the coming of age of magnetic refrigeration

Slide 33
Refrigerators & Consumption of Electricity
“Households all round the world are currently using 1.4 billion
refrigerators, fridge freezers and freezers.
The average annual consumption of all these cold appliances
amounts to about 453 kWh.
In total, this causes an annual electricity consumption of 649
TWh, which is more, for example, than the total electricity
consumption of Germany”.
Samsung Electronics has produced over 200
million compressors, which are the heart of
any refrigerator.
From: The overall worldwide saving potential from
domestic refrigerators and freezers with results
detailed for 11 world regions; Authors: Dr. Claus
Barthel Thomas Götz; December 2012

Slide 34
Global Markets for Cooling, 2016 data
• Refrigerators and Freezers– Residential 130 million units/year
– Commercial 12 million units/year
– Food processors
– Warehouses
– Grocery stores
– Convenience stores
– Restaurants
– Trucks, trains, ships 175,000 thousand units/year
– Aircraft
• Air Conditioning– Aircraft, cars and trucks 75 million units/year
– Residential 85+ million units/year
– Office
– Retail, commercial and factory
– Manufacturing atmosphere control
Globally, more than
1.4 billion are in use
500,000 ref trucks
are on the road in
the USA

Slide 35
Who is Pursuing MCE Cooling
• Astronautics, BASF, (GE>) Haier (consortium)
• CaloriCool (Ames Lab) (consortium)
• Camfridge (UK) www.camfridge.com
• Cooltech (France) (www.cooltech-applications.com)
And other major appliance manufacturers
• Electrolux
• LG Electronics
• Samsung Electronics
• Whirlpool

Slide 36
Magnetic Structure
Astronautics, BASF, Haier; https://www.youtube.com/watch?v=Py9IaztpKzs
Design and Performance of a Permanent Magnet Rotary Refrigerator; Zimm et al.; IIF-IIR
International Conference on Magnetic Refrigeration at Room Temperature, September 2005;
http://www.sciencedirect.com/science/article/pii/S0140700706001526
Room-Temperature Magnetic Refrigeration; MagFridg
Foundation, Ames Laboratory, September 2009

Slide 37
Current Magnet Tons of Magnets per year; Units are in millions
Ann'l kg/unit
millions Units Magnets Units Magnets Units Magnets Units Magnets Units Magnets Units Magnets Units Magnets
RefrigerationResidential* 130 0.75 0.05 37.5 2 1,500 20 15,000 50 37,500 100 75,000 120 90,000 203 152,400
Commercial* 12 1 0 - 0.05 50 1 1,000 5 5,000 10 10,000 10 10,000 19 18,757
Food Processors 1 1 0 - 0 - 0.5 500 1 1,000 1.5 1,500 2 2,000 2 1,563
Warehouses 1 1 0 - 0 - 0.5 500 1 1,000 1.5 1,500 2 2,000 2 1,563
Grocery Stores 2 1 0 - 0 - 0.5 500 1.5 1,500 2 2,000 3 3,000 3 3,126
Convenience Stores 2 1 0 - 0 - 0.5 500 1.5 1,500 2 2,000 3 3,000 3 3,126
Restaurants 1 1 0 - 0 - 0.5 500 1 1,000 1.5 1,500 2 2,000 2 1,563
Transportation** 2 1 0 - 0 - 0.5 500 1.5 1,500 3 3,000 4 4,000 3 3,126
Air ConditioningTransportation** 75 2 0 - 0 - 5 10,000 30 60,000 50 100,000 70 140,000 117 234,462
Residential 85 2 0 - 0 - 10 20,000 35 70,000 60 120,000 75 150,000 133 265,724
Office 50 2 0 - 0 - 5 10,000 25 50,000 40 80,000 60 120,000 78 156,308
Retail, commercial, factory 20 2 0 - 0 - 5 10,000 10 20,000 20 40,000 20 40,000 31 62,523
Total Magnet Demand, tons 37.5 1,550 69,000 250,000 436,500 566,000 904,242
TREO demand, tons 100 4,100 182,540 661,375 1,154,760 1,497,355 2,392,175
* Residential and Commercial: Refrigerators and Freezers
** Transportation=trucks, trains, ships, airplanes
20502020 2025 2030 2035 2040 2045
Magnetic Cooling: Refrigeration & Air Conditioning
Complete replacement of Freon and Ammonia refrigerants

Slide 38
Is Alnico an Alternative?
Alnico 5 Br: 1.3 tesla
Bd at Pc=18 is ~1.2 tesla
Commercial product from Arnold Magnetic Technologies, Marengo, Illinois
For example

Slide 39
Agenda
Magnet Production & Material Supply
Applications
Hard Disk Drives
Transportation
Wind Power
Magnetic Refrigeration
Summary Comments
Phew!

Slide 40
Putting it Together...Applications 2015 2020 2025 2030 2035 2040 2045 2050
Motors, industrial, general auto, etc 26,367 30,271 34,753 39,899 45,807 52,589 60,375 69,315
Wind Power Generators 16,600 29,020 34,850 47,375 45,000 40,000 38,000 35,000
Electric Bicycles & Scooters 9,580 13,000 14,000 11,000 7,500 5,000 4,000 3,000
Acoustic Transducers 7,471 9,000 11,000 12,500 13,500 13,000 12,500 12,000
HDD, CD, DVD 6,372 4,309 3,000 1,200 600 200 50 25
MRI 5,933 5,500 5,000 3,500 3,000 2,500 2,000 500
Air conditioning compressors and fans 5,054 7,000 12,000 25,000 35,000 30,000 25,000 20,000
Magnetic Separation 4,175 5,000 6,500 7,000 7,500 7,500 7,500 7,500
Hybrid & Electric Traction Drive 3,850 18,025 35,310 41,650 45,750 54,688 65,000 82,500
Unidentified 3,296 3,675 4,097 4,568 5,093 5,679 6,331 7,059
Torque-coupled drives 3,186 3,658 4,199 4,821 5,535 6,354 7,295 8,376
Sensors 2,966 3,523 4,184 4,970 5,902 7,010 8,326 9,889
Energy Storage Systems 2,747 2,788 2,830 2,873 2,916 2,960 3,005 3,050
Generators 2,637 2,954 3,310 3,709 4,155 4,655 5,216 5,844
Hysteresis Clutch 2,417 2,540 2,670 2,806 2,949 3,100 3,258 3,424
Magnetic Braking 1,758 1,847 1,942 2,041 2,145 2,254 2,369 2,490
Gauges 1,648 1,700 1,500 1,100 750 250 100 20
Relays and Switches 1,648 1,665 1,681 1,698 1,715 1,732 1,750 1,767
Magnetically Levitated transportation 560 572 583 595 607 619 632 644
Holding and Lifting 505 600 625 650 675 700 725 750
Reprographics 439 400 450 400 400 400 400 400
Wave guides: TWT, undulators/wigglers 412 422 433 444 455 467 478 491
Pipe Inspection Systems 99 99 100 100 101 101 102 102
Advertising 82 75 65 60 50 30 15 5
Magnetic Refrigeration 66 70 90 500 750 1,000 1,500 2,000
Totals 109,868 147,714 185,173 220,459 237,856 242,789 255,928 276,151
TREO Demand 257,840 346,660 434,570 517,370 558,200 569,780 600,610 648,070

Slide 41
Steve Constantinides
Magnetics & Materials LLC
4785 County Road 33, Honeoye, NY 14471
www.magmatllc.com