putting together the pieces-20aug2012
DESCRIPTION
nTRANSCRIPT

Putting Together the Pieces
A Guide to S&OP Technology Selection
to Build a Market-driven Value Network
8/15/2012
By Lora Cecere Founder and CEO
Supply Chain Insights LLC

Copyright © 2012 Supply Chain Insights LLC Page 1
Contents Research 3
Disclosure 3
Research Methodology and Overview 3
Executive Overview 5
The Evolution of S&OP Processes 7
Getting Started 8
Stage 1: Deliver a Feasible Plan 8
Stage 2: Match Demand with Supply 9
Stage 3: Drive the Most Profitable Response 9
Stage 4: Build Demand-Driven Supply Chain Capabilities 10
Stage 5: Orchestrate Through Market-Driven Value Networks 11
Putting Together the Pieces 12
Industry Requirements 14
Organizational Considerations 16
Recommendations 17
Conclusion 19
Appendix 20
Acorn Systems 20
Adexa 20
Aspen Technology 21
Boardwalktech 21
Demand Solutions 22
DCRA 22
Enterra Solutions 23
IBM 23
Infor 24
JDA 24
Copyright © 2012 Supply Chain Insights LLC Page 2
John Galt 25
Jonova 25
Kinaxis 26
Logility 26
Oliver Wight 27
OM Partners 27
Oracle 28
Portfolio Decisions 28
River Logic 29
SAP 29
SAS Institute 30
SignalDemand 30
SmartOps 31
Steelwedge 31
Tagetik 32
Teradata 32
Terra Technology 33
ToolsGroup 33
WAM Systems 34
Methodology: 35
About Supply Chain Insights LLC 36
About Lora Cecere 36

Copyright © 2012 Supply Chain Insights LLC Page 3
Research This independent research was 100% funded by Supply Chain Insights and is published using
the principle of Open Content research.
It is intended for you to read, share, and use to improve your decisions in buying sales and
operations planning (S&OP) technologies. When you use it, all we ask for in return is attribution.
We publish under the Attribution-Noncommercial-Share Alike 3.0 United States Creative
Commons License and Supply Chain Insights’ citation policy.
Disclosure Your trust is important to us. As such, we are open and transparent about our financial
relationships and our research processes.
Research Methodology and Overview This report is the third in a three-part series. First we define a market-driven value network, then
we apply these concepts to the Sales and Operations Planning process, and finally, we discuss
the purchase of technology to enable this vision. Here are links to the reports:
• Building Market-driven Value Networks
• Market-driven Sales and Operations Planning
• Putting Together the Pieces
This report is based on nine years of observations of the Sales and Operations Software
market’s evolution. It is built on the premise that the best research is based on year-over-year
studies and ongoing market triangulation. Input for the report includes:
• Supply Chain Insights Quantitative Research Findings (for more on this see the Appendix). Supply Chain Insights has completed multiple studies on
the use of Advanced Planning Systems within manufacturing and retailing
companies.
• Vendor Briefings. Structured interactions with suppliers of technology over the
past ten years.
• Discussions with Software Vendor Client References. On an ongoing basis,
vendors will supply references to analysts to substantiate their software claims.
These are one hour phone conversations.
Copyright © 2012 Supply Chain Insights LLC Page 4
• Dialogues with Supply Chain Consultants Implementing Software. During
conferences, and through ongoing dialogues, discussions about the
implementation of S&OP technologies have taken place over the years. In the
process of writing this report, several experienced software implementers were
consulted for input.
• Personal Observations of Clients Implementing Sales and Operations Planning Software. The author of this report has worked with over 150
companies implementing S&OP software. Those observations are reflected in
this report.
Before the final publication of this report, each of the vendors listed in the Appendix was asked
to comment on the factual accuracy of their solution overview/descriptions.

Copyright © 2012 Supply Chain Insights LLC Page 5
Executive Overview Supply chain practices are three decades old. Over the past thirty years, supply chains have
increased in complexity and become more core to driving business results. They have morphed
from chains to networks built on inter-enterprise connectivity that stretches around the globe. It
is no longer a discussion of internal and static processes. It is much more dynamic and fluid. For
manufacturers and distributors, supply chain is now business.
Sales and Operations Planning (S&OP)—the process of aligning demand and supply to drive a
business outcome—has become more important to power growth, improve resiliency and drive
efficiency improvements. Process maturity requires technology, and it cannot be sustained
without it. The question is what to buy, how to buy it, and when. That is the purpose of this
report.
The selection of a solution is not easy. Companies have defined S&OP very differently; and
there is no one standard definition, or a perfect technology solution. Instead, there are many
variants. It is not as easy as picking a solution from an analyst report using a simple two-
dimensional grid. Better results can be achieved by following a three-step methodology:
1. Identify S&OP Organizational Maturity
2. Characterize Industry-specific Requirements
3. Ascertain Organizational and Information Technology (IT) Requirements
Copyright © 2012 Supply Chain Insights LLC Page 6
In the process, remember that system selection cannot just be about supply. With the advances
in computing power, demand and supply modeling have improved; and new categories of
technologies have evolved for inventory and financial modeling. These new data models can
enrich traditional supply chain planning processes; however, it requires a redesign in S&OP
architectures to accommodate the input. It
cannot be effectively accomplished through
tight integration. Instead, the best modeling
is accomplished through iterative planning.
Over the past five years, the solutions have
also expanded in scope and capabilities to
power teams and improve human
interaction. With global expansion, and
mergers and acquisitions, the processes
have grown more complex and even knotty.
They are anything but simple. The
expansion of global supply chains requires
both global and regional input and modeling.
The management of governance structures
in these larger organizations, in the more
advanced software solutions, is improved
through S&OP workflows, enterprise social
networking and knowledge management. In
addition, these companies do not have just one supply chain; instead, the average company
has five to seven distinctly different rhythms and cycles and 63% of companies have more than
one S&OP process. Consequently, there is increased interest in a visualization layer and an
executive dashboard to finalize operational plans and actions.
Today, companies are faced with a dilemma. Today there are so many pieces, so much
opportunity, and so many requirements that the selection of a solution is confusing. Companies
question how to put the pieces together. They often get so caught up in assessing new
technologies that they forget that the foundation of a solution is the determination of a feasible
plan. In our research, over 85% of companies lack a road map of how to assemble these pieces
of S&OP technology to drive process maturity. Overcoming this challenge is the goal of this
report.
To improve success, sidestep conventional myths and use this report to help navigate the
market hype; and improve success by charting your path with a road map and a goal in mind.
Conventional Myths - The market is rife with
unsubstantiated claims and myths:
• You don’t need a technology to drive
an effective S&OP process.
• An 80% technology fit is good enough
for an enterprise solution.
• Standardize: One solution provider is
all you need.
• S&OP is dead. Integrated Business
Planning (IBP) is the new solution.
• Supply chains are moving so fast that
companies don’t have time to plan.
• Real-time S&OP is a desired outcome.
• Tight integration improves the S&OP
process.

Copyright © 2012 Supply Chain Insights LLC Page 7
The Evolution of S&OP Processes Over the last thirty-five years of Supply Chain Management (SCM), S&OP processes have
evolved. S&OP is a horizontal process that can connect and align the vertical silos of make,
source and deliver to drive a better supply chain outcome. Today, based on our interviews, we
see five stages of S&OP maturity. Each stage offers increasing opportunity to maximize
business results and Return on Investment (ROI). It also requires the assembly of different
“pieces” of technology.
The most mature stage in the S&OP model, as outlined in Figure 1, is achieving a Market-driven
Sales and Operations Planning Process. Currently, this stage is aspirational. For many it is a
goal or a future-looking process objective. It is a more mature end state than demand-driven.
Fig. 1 Sales and Operations Planning Maturity Model
For clarity, within this report, a market-driven value network is defined as an adaptive supply
chain that can quickly drive alignment within the organization market-to-market (buy- and sell-
side markets) to improve value-based outcomes. When market-driven, these supply chain
processes sense and translate market changes bidirectionally with near real-time data latency
to better optimize and align sell, deliver, make and sourcing operations to the goal. In the
Market-driven Value Network, the focus is on horizontal process orchestration. The redefinition
of S&OP processes to be market-driven is a radical shift from the supply-centric historic process
definitions in three different ways:

Copyright © 2012 Supply Chain Insights LLC Page 8
• Outside-in. As the S&OP Maturity Model progresses through its five stages, there is
a shift in focus from inside-out to outside-in. Stages 1 through 3 are mapped from
inside the organization to the external markets, while Stages 4 and 5 are mapped
from the outside in (from the markets into the enterprise) with a focus on sensing and
translating market drivers for both buy- and sell-side markets. This is a radical
departure from traditional supply chains that are inside-out and are based solely on
order and shipment data.
• Depth of Analytics Required to Orchestrate the Right Response. Each supply
chain has fundamentally different levers that can be adapted to orchestrate the
response market-to-market (e.g., Alternate Bills of Materials, Alternate Suppliers,
Changes in the Network, Substitution of Products, Changes in Demand Shaping,
etc.) The use of advanced analytics allows companies to make end-to-end trade-offs
between revenue management and supplier development to orchestrate the value
network.
• Improved Planning Capabilities and Requirements. To drive a Market-driven
Value Network, companies need to invest in “what-if” capabilities and Network
Modeling Expertise to maximize opportunity and mitigate risks. In research studies,
only 8% of companies feel that they have sufficient what-if Modeling Capabilities
today for Stages 2 and 3 of the model, much less Stages 4 and 5.
Getting Started Understanding where you are in the evolution of this S&OP maturity model is the first step in
selecting the right technology solution. While the S&OP technologies are well defined in Stages
1 and 2 of this model, this is not true for the later and more mature stages of the market-driven
value network. As companies move through the stages they will find they will need to have
greater depth in supply chain what-if analysis, inventory and financial optimization modeling and
supply chain visualization. It will not be as easy as buying everything from one vendor. Instead,
many mature companies will need to buy multiple pieces of technology and assemble them.
Stage 1: Deliver a Feasible Plan The S&OP process originated with a goal of developing a feasible plan. Early evolution of the
Advanced Planning Solution (APS) market enabled organizations to develop a forecast,
visualize operational requirements and align metrics. The introduction of constraint-based
theory in the 1990s and the evolution of manufacturing planning enhanced this capability. It
allowed organizations to identify constraints and build a feasible or a realistic plan based on

Copyright © 2012 Supply Chain Insights LLC Page 9
operations. Note: These models are very industry-specific. A conglomerate composed of
process, discrete and apparel manufacturing may find that it needs multiple modeling systems.
Similarly, the building of a one-size-fits-all model by the ERP expansionists has delivered
generic models that do not fit any company very well.
While many companies have become enamored with new solutions--the advanced capabilities
of Software as a Service (SaaS) technologies, and advanced workflows and analytics of some
of the more recent solutions—before organizations invest in these new technologies they must
first ensure that they are building off a firm foundation that ensures a feasible plan. To do this,
organizations have to ensure the supply chain planning models represent constraints, variability
and current capabilities of operations. This is an ongoing exercise. As operations change—
outsourcing, new machinery, new modes of shipments—the planning models need to be
corrected to reflect true operational capabilities. An S&OP plan that is not feasible is quickly
discounted and loses credibility within the greater organization.
Stage 2: Match Demand with Supply As organizations mature, teams need a solution to better model the trade-offs of volume and
product mix. These analyses are complex. They need to balance customer service, asset
strategies and inventory plans to best match demand with supply against the business strategy.
To meet this requirement, Advanced Planning System (APS) vendors introduced what-if
modeling environments in the late 1990s using deterministic optimization techniques. Over the
last ten years, these processes were augmented by inventory management specialist
capabilities to evaluate multi-tier inventory analysis.
Over the past two years, many of the multi-tier inventory analysis technologies were merged
with other S&OP technology providers (IBM purchased LogicTools, and Logility purchased
Optiant). In parallel, JDA, Oracle and SAS Institute introduced stand-alone inventory
management modules. SmartOps, Terra Technology and ToolsGroup remain as stand-alone
solutions to manage inventory trade-offs. While traditional technologies determine the right
inventory levels for the organization’s supply chain, these more advanced technologies focus on
multi-tier modeling to determine the best “form and function” of inventory within the network.
Stage 3: Drive the Most Profitable Response While Stage 1 is supply-driven and Stage 2 is sales-driven, Stage 3 is business-planning-driven.
This is commonly dubbed, in the market, as integrated business planning (IBP). At this stage, it
is critical to have a clear supply chain strategy and a well-defined definition of supply chain
excellence. For most, this clarity, or the lack thereof, is a gating factor for success.
Copyright © 2012 Supply Chain Insights LLC Page 10
To accomplish this modeling, the demand and supply hierarchies must be decoupled to enable
volume/mix what-if trade-offs iteratively between process steps. The output can then be
improved through the use of financial modeling technologies (Acorn Systems, Jonova, River Logic and Tagetik). These technologies allow companies to analyze financial trade-offs of tax
and compliance; working capital impacts from changes in contracts and network relationships;
fixed and variable cost impacts from changes in the network design; and margin contribution of
product mix and customer scenarios. This is a very different view than plugging fixed values into
an Advanced Planning System (APS) and seeing the financial impact from a change in supply.
Instead, this analysis evaluates the financial options and implications of changing a supply
network given manufacturing and procurement assumptions.
This S&OP Maturity Stage requires the addition of two new capabilities: demand translation and
supply orchestration. The process of modeling demand volume/mix trade-offs between demand
and supply is demand translation. In supply orchestration, these trade-offs are made in
commodity markets to determine the most effective formulation or platform design to schedule
for manufacturing. The best results happen when this analysis is iterative: starting with demand,
passing it to supply modeling, evaluating the right form and function of inventory, and then doing
financial analysis. This iterative approach can require multiple cycles. At the end of the analysis,
a “constrained demand plan” is passed to demand planners, the nodes of the network are
established and the inventory targets for each stage of the supply chain are set.
Stage 4: Build Demand-Driven Supply Chain Capabilities At this stage of S&OP process refinement, the technology flows are designed from the outside-
in. This analysis is focused on sell-through into the channel, whereas the earlier steps of the
S&OP maturity model are focused on selling into the channel.
The first step at this stage of maturity is to get really good at channel modeling using market
drivers. These market drivers are based on end-user consumption and are mapped as parallel
inputs or “indicators” into the demand plan. The demand plan is then used to sense market
conditions based on downstream demand signals, followed by active shaping of demand, using
technologies like price optimization; trade promotion planning; new-product launch plan
alignment; and social, digital and mobile convergence. While demand sensing reduces the
latency to see true channel demand, demand shaping combines the techniques of price,
promotion, sales and marketing incentives, and new-product launch to increase demand lift.
For most companies, the movement from Stage 3 to Stage 4 of the maturity model requires a
redesign and a reimplementation of the data model implemented in Stages 1 through 3.

Copyright © 2012 Supply Chain Insights LLC Page 11
Stage 5: Orchestrate Through Market-Driven Value Networks The development of horizontal processes in Stages 1 through 4 of the S&OP Market-driven
Maturity Model is foundational, and a prerequisite, to build Market-driven Value Networks.
Companies cannot skip steps, and they cannot effectively build strong horizontal processes
without operational excellence and process reliability.
When done right, this market-driven technology portfolio helps companies to sense and shape
demand and supply bidirectionally between sell- and buy-side markets. This process of
bidirectional trade-offs between demand and a commodity market is termed demand
orchestration. This capability allows companies to win in this new world of changing
opportunities and supply constraints. It is especially relevant with the tightening of commodity
markets and increasing price pressures on today’s supply chains.
To orchestrate demand horizontally, companies need to identify the leverage points in the
supply chain. These include price, promotions, sales incentives, changing bills of materials,
choosing alternate suppliers or modes of transportation or substituting products. Each industry
and each company has a unique profile of options. While it may be down binning in the semi-
conductor industry, or initiating a SWAP plan in the chemical industry, or changing the process
for alternate bills of materials in food and beverage, each industry has levers to pull.
The issue is how to best synchronize the coordination of buy- and sell-side market drivers.
Today, with a focus on volume, they are not synchronized. As a result, companies will promote
products with high price or scarce ingredients, customer commitments are made for
configurations that are not profitable, and promises are made to the market for plans that are
not feasible. With the growing scarcity of materials, and the intense price pressures on new
product launch margins, demand and supply orchestration will grow in importance. Today,
companies are cobbling together solutions in the absence of well-defined capabilities. Early
evolution of this capability can be seen in Kinaxis’ allocation logic based on material constraints
in high-tech and Signal Demand’s demand orchestration capabilities for reverse bills of
materials in food and beverage.
As these processes mature, a subtle but important shift in the maturation of the S&OP process
is the change of the data model in the optimization and foundational level of the Advanced
Planning Solutions (APS) solution. This will often result in the reimplementation of the Advanced
Planning Solution with a different focus and data model.

Copyright © 2012 Supply Chain Insights LLC Page 12
Table 1 Data Model Overview of the S&OP Maturity Model
Stage 1 Stage 2 Stage 3 Stage 4 Stage 5
Process Goal Feasible Plan Match Demand
with Supply
Integrate Business
Plans
Demand
Driven
Market Driven
Demand Model Focus
Ship from
modeling: What
should
manufacturing
make? What
should I ship?
Ship from
modeling: What
should
manufacturing
make? What
should I ship?
Ship to modeling:
What is being sold
into the channel?
Ship to
modeling:
What is being
sold into the
channel?
Ship to modeling: What
is being sold into the
channel?
Replenishment Model Focus
Sell into the
channel
Sell into the
channel
Sell into the
channel
Sell through
the channel
Sell through the channel
Process Model Focus
Inside-out
Inside-out Inside-out Outside-in Outside-in
Model Elements Demand
Supply
Demand
Supply
Mix
Volume
Form and
Function of
Inventory
Demand
Supply
Mix
Volume
Form and Function
of Inventory
Profitability
Demand
Supply
Mix
Volume
Form and
Function of
Inventory
Profitability
Market
Demand
Drivers
Demand
Supply
Mix
Volume
Form and Function of
Inventory
Profitability
Market Demand Drivers
Commodity Market
Drivers
Putting Together the Pieces After the purchase decision, companies also struggle with how to put the pieces together. The
evolution of the technology to support iterative planning between demand, supply, inventory and
financial planning systems requires increased functionality for demand translation, supply chain
visualization and “what-if” analysis. This platform shift is outlined in Figure 2. In the appendix, to
help the reader, we categorize solutions by the categories in Figure 2.
The demand translation elements shown in Stages Four and Five of the S&OP Maturity Model
map the “ship-to data model configuration” for demand to the “ship-from data model
configuration” of supply. This capability is found in the evolution of Software as a Service
providers like Kinaxis, SAP HANA, SAP-ICON and Steelwedge.
Copyright © 2012 Supply Chain Insights LLC Page 13
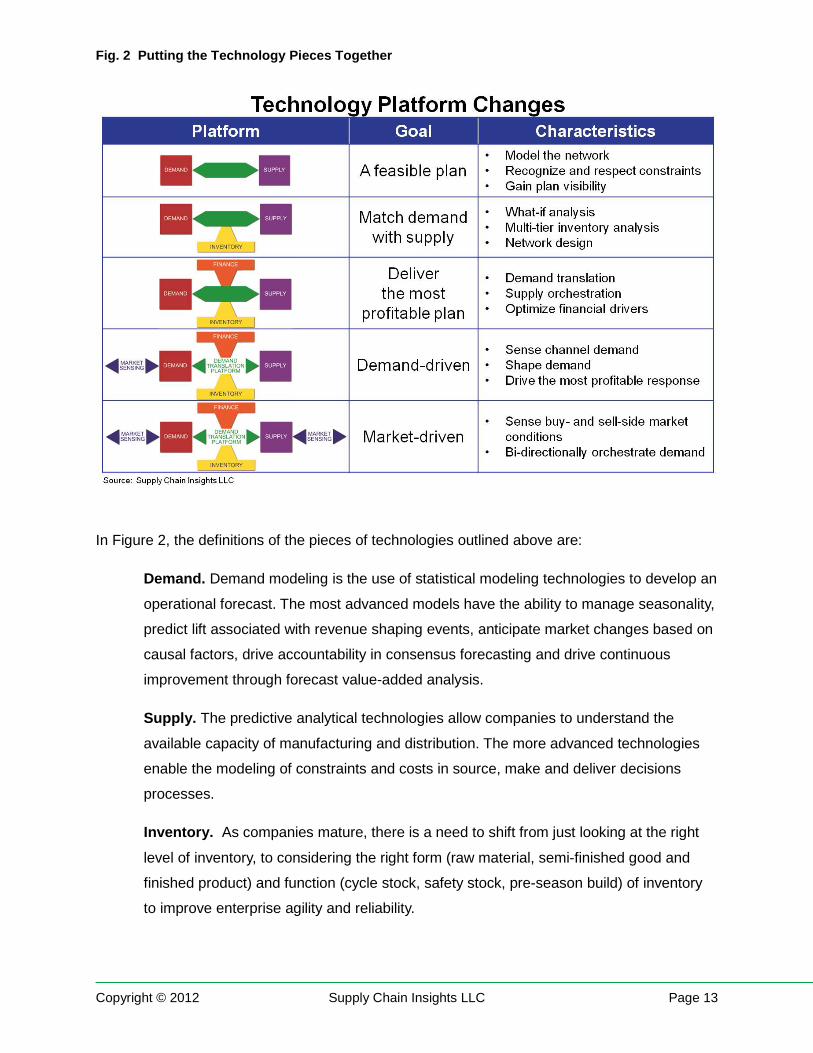
Fig. 2 Putting the Technology Pieces Together
In Figure 2, the definitions of the pieces of technologies outlined above are:
Demand. Demand modeling is the use of statistical modeling technologies to develop an
operational forecast. The most advanced models have the ability to manage seasonality,
predict lift associated with revenue shaping events, anticipate market changes based on
causal factors, drive accountability in consensus forecasting and drive continuous
improvement through forecast value-added analysis.
Supply. The predictive analytical technologies allow companies to understand the
available capacity of manufacturing and distribution. The more advanced technologies
enable the modeling of constraints and costs in source, make and deliver decisions
processes.
Inventory. As companies mature, there is a need to shift from just looking at the right
level of inventory, to considering the right form (raw material, semi-finished good and
finished product) and function (cycle stock, safety stock, pre-season build) of inventory
to improve enterprise agility and reliability.

Copyright © 2012 Supply Chain Insights LLC Page 14
Financial. These models allow companies to take the inputs from demand and supply
modeling and evaluate the financial impact of mix, demand or supply shifting, customer
and product policies or the financial impact of changes in network sourcing.
Demand Translation. This capability allows companies to model the market (what is
going to be sold in the channel) and translate the requirement to manufacturing (what
needs to be manufactured when).
Market Sensing. The use of channel data for either buy- or sell-side markets to reduce
the organization’s latency to recognize market shifts and evaluate the impact of these
shifts on the supply chain plans.
While Figure 2 shows the assembly of a single S&OP process, for companies with multiple
S&OP processes, the same logic holds. For most organizations, they will have to build a similar
figure to show multiple S&OP processes from different business units at various levels of
maturity knitted together. These multiple technology platforms are mapped to enable iterative
planning by the business unit resources with a visualization layer for executive review. This
functionality is the genesis of the Kinaxis Control Tower concept and the SAP S&OP HANA
release.
Industry Requirements The solutions are industry specific. The greatest differences are in the area of supply. This is
more so than the areas of demand, finance and inventory. The vendor classifications in the
appendix are designed to help the buyer of technology understand the industry fit for each
solution.
Conglomerates or companies with multiple processes will find that they will need to assemble
multiple systems to ensure that they are meeting the process requirements. While these
industry-specific definitions vary greatly, a general overview is listed below:
Retail. Retail modeling is characterized by seasonal planning cycles, store format
changes, markdown and price changes, and marketing calendars. In specialty retail for
apparel, unique functionality is required to manage style/color/size combinations. These
processes are also usually characterized by long lead times for offshoring and the
management of multi-tier distribution requirements. These solutions are designed for
mass merchants, grocery retail, drug and convenience retailing and specialty retailing.
Orchestration includes price, markdown, merchandising strategies, changing
Copyright © 2012 Supply Chain Insights LLC Page 15
assortment, allocation logic, shifts in channel strategies and alternate sourcing
scenarios.
Process. Flow. In general, these products flow out of tanks, through pipes, and into
bags, boxes, tank cars and totes. These processes are asset intensive and involve the
modeling of process-intensive scenarios like reverse bills of materials, tank yard
scheduling, yield and grade variations, industry swaps between manufacturers, and
floating bottlenecks on equipment with the changes in mix. These operations are usually
flow-based and heavily influenced by raw material availability and costs. Demand
orchestration is usually a trade-off between price, grade, service terms and formula
changes. These processes are found in the process chemical, pulp and paper, textiles,
oil and gas, and wine and spirits industries.
Process. Mix and Pack. These processes are characterized by stages of preparation,
mixing and batch transfer, packaging and palletizing. This is normally based on batch
size and go-to-market requirements. These operations are often make-to-stock with
push-based logistics. Demand orchestration touch points are price, promotion, sales
incentives, formula and recipe changes, alternate sourcing and transportation mode, and
network shifts. Industries characterized by these requirements are food and beverage,
consumer packaged goods, and industrial chemical.
Discrete. Make to Order. In these industries, there is a focus on make-to-order
processes where units are discrete and assembled based on Bills-of-Materials (BOM)
and manufacturing routings. Orchestration options include materials, finishing, sourcing
and shipping options. These processes are most frequently found in apparel,
automotive, high-tech and electronics, and parts and component manufacturing for
machinery.
Discrete. Configure or Assemble to Order. These industries work off of variants of
platforms. The platform is designed for a value-based outcome, but is configured for
specific customer requirements. Orchestration includes contract terms and conditions,
service and warranty plans, platform design options, and alternate assemblies. These
processes are found in aerospace and defense, heavy equipment, and transportation
(e.g., truck, rail, barge) industries.

Copyright © 2012 Supply Chain Insights LLC Page 16
Organizational Considerations As organizations grow larger, the technology requirements change. Specifically, the bigger and
more complex of an organization that the team is trying to automate, the requirements for
internal collaboration and workflow management, assumption archiving, and scenario
management increase. To purchase a solution, map how your organization makes decisions.
Note the requirements and compare them to the chart below.
Table 2 Criteria to Evaluate Organizational Requirements
Small Company, Easy Requirements
Mid-sized Company, Regional Requirements
Large Company, Global Planning and Regional Deployment
Assumption Management
Plan assumptions notated
as notes in third-party
systems.
Assumptions captured in
scenario management, but
no repository to store
scenarios based on like
conditions.
Scenario libraries to
catalogue and test
assumptions. Assumptions
categorized in the steps of
the process.
Collaboration Limited collaboration
abilities. Collaborative
demand planning
completed on
spreadsheets and work
among team members
notated in third-party
technologies.
Collaborative demand
planning with management
overrides but no
accountability
measurements. Notes
sections for collaboration.
Demand planning
collaboration with built-in
bias and error reporting.
Configurable, collaborative
workflow between regions
and corporate to enable
questions and inputs.
Scenario Management Planners have limited
ability to do what-if
analysis simultaneously.
Role-based scenarios and
what-if analysis to support
multiple users at the same
time.
Planning master data
management to support
multiple what-if analyses
simultaneously.
Performance Management: Dashboard and Scorecard Management
Non-extensible data for
reporting in organizational
BI technologies. Limited
data visualization.
Extensible data.
Dashboards and
scorecards are easy to
configure and represent
key scenarios.
Dashboard and scorecards
are configurable in near
real-time. Supports
questions in an executive
S&OP session in real-time.
Key: Small: Less than 10 planners. Mid-sized: 10-40 planners. Large: Greater than 40 planners.

Copyright © 2012 Supply Chain Insights LLC Page 17
Recommendations No two S&OP processes are alike and no two organizations have the same need. As a result,
build with the goal in mind. Sidestep the hype outlined in the executive overview and build a
solution to meet your needs based on the information in this report.
Get Ready. For each stage of the maturity model, answer the following questions before
contacting a technology solution vendor or a consulting partner:
Stage 1 - What is necessary to ensure a feasible plan? What are the constraints? What
is the right time duration for the planning process? Note: Ensure that you can build and
deliver a feasible plan before investing in the next steps of the road map.
Stage 2 - What is required in business analytics to support what-if modeling? What
depth is required in inventory modeling? (Level of inventory versus form and function of
inventory components).
Stage 3 - What are the right trade-offs to make between demand, supply, inventory and
financial modeling? How are these trade-offs supported by the supply chain strategy?
How many equivalent units need to be modeled? What is required in an S&OP platform
for volume and mix translation?
Stage 4 - What are the right market drivers to sense demand? Given these market
drivers to sense demand, how will the company shape demand? What defines
excellence for revenue management?
Stage 5 - What are the important commodity market drivers? How will market drivers be
traded off (bidirectionally and horizontally) between buy- and sell-side markets? What
combination of demand shaping and supply levers can be pulled to orchestrate a
market-driven response?
Since one of the greatest barriers to effective S&OP is the understanding of supply chain
excellence by the executive team, invest in training to ensure bottom-to-top alignment before
starting the project.

Copyright © 2012 Supply Chain Insights LLC Page 18
Fig 3 Obstacles to Building an Agile S&OP Process
Follow a Multi-Year Road Map and Build with the Goal in Mind. While many companies
would like to accelerate the time to build S&OP maturity, do not try to skip the steps. The steps
build on each other with the understanding in each step being a prerequisite for the next. Build
the solutions and the processes with the goal in mind, with clarity of governance and process
definition in each step. To accelerate maturation, invest in training, “what-if” modeling, and a
clear definition of the supply chain strategy.
Staffing. Reward the Important. While many companies implement technology, they do not
use the output of the technologies well. There are many reasons, but the most common is the
lack of dedicated planning resources. Planners need time to plan. They cannot multitask
between the important priorities of planning and the urgent activities of replenishment and
manufacturing support. To ensure the best output, build the right solutions, and ensure that the
project is staffed with adequate and trained resources. For many, this is an issue.
Recognize Differences, but Simplify where Possible. While there are often many industries
and supply chains with multiple S&OP processes within the organization, most of the time these
can be implemented using the same technologies and the same metrics, but adapting the data
models and metric targets to recognize process differences.
Copyright © 2012 Supply Chain Insights LLC Page 19
Conclusion The opportunity to automate S&OP is too great to pass up. A successful project requires
technology to maximize long-term benefits. There is no one-size-fits-all solution. The first step in
solving the puzzle is realizing that it will not be one technology, but multiple technologies
installed over multiple years using a road map. The greatest success happens when the
technology choices are based on a long-term view considering S&OP maturity, industry fit, and
organizational size/maturity.
Copyright © 2012 Supply Chain Insights LLC Page 20
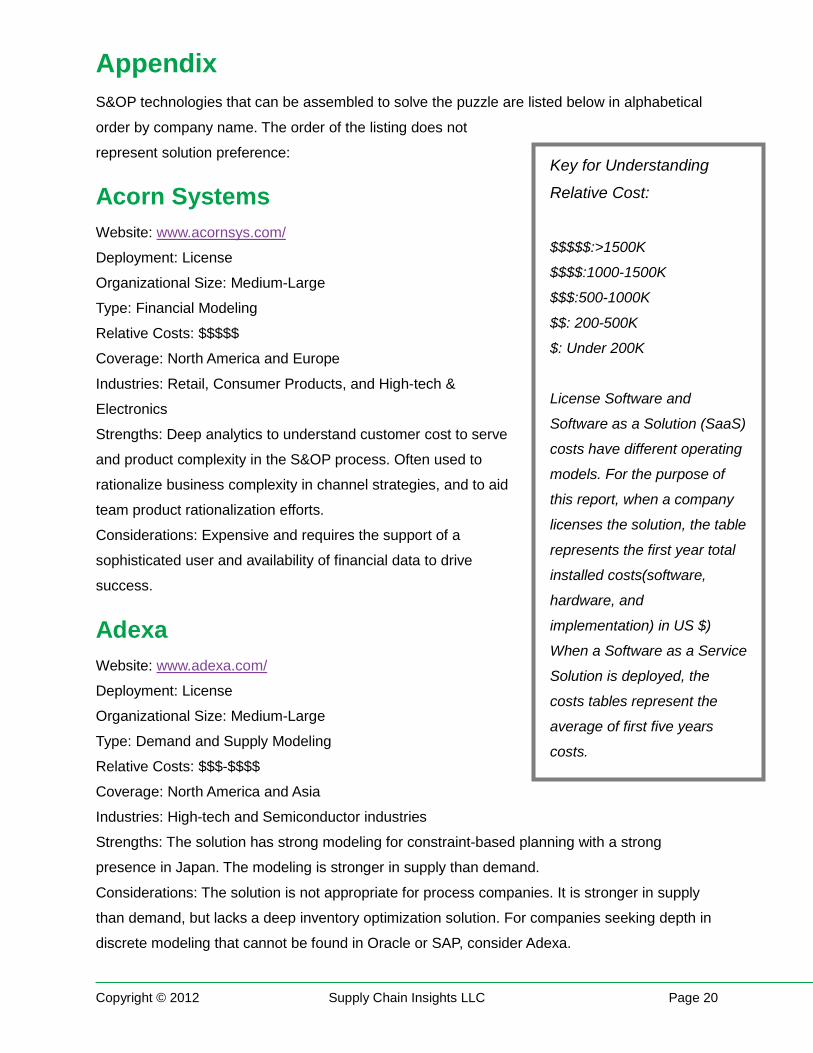
Appendix S&OP technologies that can be assembled to solve the puzzle are listed below in alphabetical
order by company name. The order of the listing does not
represent solution preference:
Acorn Systems Website: www.acornsys.com/
Deployment: License
Organizational Size: Medium-Large
Type: Financial Modeling
Relative Costs: $$$$$
Coverage: North America and Europe
Industries: Retail, Consumer Products, and High-tech &
Electronics
Strengths: Deep analytics to understand customer cost to serve
and product complexity in the S&OP process. Often used to
rationalize business complexity in channel strategies, and to aid
team product rationalization efforts.
Considerations: Expensive and requires the support of a
sophisticated user and availability of financial data to drive
success.
Adexa Website: www.adexa.com/
Deployment: License
Organizational Size: Medium-Large
Type: Demand and Supply Modeling
Relative Costs: $$$-$$$$
Coverage: North America and Asia
Industries: High-tech and Semiconductor industries
Strengths: The solution has strong modeling for constraint-based planning with a strong
presence in Japan. The modeling is stronger in supply than demand.
Considerations: The solution is not appropriate for process companies. It is stronger in supply
than demand, but lacks a deep inventory optimization solution. For companies seeking depth in
discrete modeling that cannot be found in Oracle or SAP, consider Adexa.
Key for Understanding
Relative Cost:
$$$$$:>1500K
$$$$:1000-1500K
$$$:500-1000K
$$: 200-500K
$: Under 200K
License Software and
Software as a Solution (SaaS)
costs have different operating
models. For the purpose of
this report, when a company
licenses the solution, the table
represents the first year total
installed costs(software,
hardware, and
implementation) in US $)
When a Software as a Service
Solution is deployed, the
costs tables represent the
average of first five years
costs.

Copyright © 2012 Supply Chain Insights LLC Page 21
Aspen Technology Website: www.aspentech.com/
Deployment: License
Organizational Size: Medium-Large
Type: Demand and Supply Modeling
Relative Costs: $$$$
Coverage: North America and Europe
Industries: Chemical and Consumer Products
Strengths: The solution is very configurable and allows great depth for process modeling
(reverse bill of materials, multiple levels of constraints and dependent demand for multiple forms
of shipment) for process and mix and pack industries. It has the deepest supply modeling
capabilities for the chemical industry.
Considerations: The solution is not appropriate for discrete companies. The modeling is
stronger in supply planning than demand planning. Due to the level of configuration capable in
the solution, the technology requires a strong understanding of what is needed and a strong
user skill set to maintain. Cheaper, and easier-to-use industry solutions for the chemical industry
include Arkemia (Previously Supply Chain Solutions (Zemeter)), OM Partners, and/or WAM
Systems.
Boardwalktech Website: www.boardwalktech.com/
Deployment: Software as a service
Organizational Size: Small to Large
Type: Demand, Finance and Supply Modeling
Relative Costs: $$-$$$$
Coverage: North America
Industries: Crosses many industries but lacks data model depth to model any industry well.
Strengths: The solution is easy to use after deployment. It is a good fit for companies that are
used to spreadsheet modeling, but lack a system of record to keep all the spreadsheets in sync.
Considerations: The cost of the solution is in configuration. The solution can improve visibility,
but lacks a constraint-based data model to determine the feasibility of supply or optimization
algorithms to ensure the best plan. It is not a consideration for a supply chain that is supply-
constrained or wants to improve demand forecast accuracy. Additionally, with the number of
deployments, the usage should be limited to early adopters.
Copyright © 2012 Supply Chain Insights LLC Page 22
Demand Solutions Website: www.DemandSolutions.com
Deployment: License
Organizational Size: Small-medium
Relative Costs: $$-$$$
Coverage: Sold by a Global Network of Distributors
Industries: Consumer products, apparel, food & beverage and general manufacturing
Strengths: Established provider since 1985. Easy to use software for small or globally distributed
teams
Considerations: Core functionality for simple demand and supply matching. Lacks depth in demand
planning for larger organizations or constraint-based supply for manufacturers.
DCRA Website: www.dcrasolutions.com
Deployment: Software as a service
Organizational Size: Small
Type: Demand and Supply Modeling
Relative Costs: $-$$
Coverage: North America
Industries: Discrete
Strengths: Simple and easy-to-use S&OP modeling. It is ideal for a small or mid-size discrete
manufacturing company seeking a Software as a Service model.
Considerations: A very simplistic approach to S&OP, the solution lacks the depth of modeling for
material-centric and complex discrete manufacturers. It is best used by a company just starting
on an S&OP journey that is looking for an easy to use solution for a few users without modeling
depth.
Copyright © 2012 Supply Chain Insights LLC Page 23
Enterra Solutions Website: www.enterrasolutions.com
Deployment: License
Organization: Medium to Large
Type: Demand and Supply Orchestration
Relative Costs: $$$$$
Coverage: North America
Industries: All
Strengths: The solution uses a new technique of rules-based ontologies to map “multiple ifs to
multiple thens” for a more dynamic response for multiple S&OP systems. While this type of
solution is a new approach today, look for the use of Enterra Solutions-like solutions in S&OP
execution in the next two to three years.
Considerations: Enterra is early to the market and is only suitable for early adopters looking for
a co-development partner to build supply chains that listen, think, learn and then respond. While
artificial intelligence has been discussed for many years, the Enterra Solution is one of the first
to apply the concept.
IBM Website: www.ibm.com
Deployment: License
Organization: Medium to Large
Type: Inventory Modeling
Relative Costs: $$-$$$$
Coverage: Global
Industries: All
Strengths: Strong visualization capabilities augmented by inventory analytics and reporting
capabilities. IBM has purchased a number of technologies that are assembled into industry
solutions. This includes the ILOG manufacturing scheduling product, the Cognos financial
modeling product, and the Logictools inventory modeling technologies.
Considerations: While IBM has many complimentary applications for an S&OP process, as a
company it cannot put together enough pieces to deliver a total solution. The company lacks
demand, supply and financial modeling capabilities and usually partners, and adds-on IBM
software components, to solutions with large ERP providers like SAP and Oracle to deliver
S&OP implementations.
Copyright © 2012 Supply Chain Insights LLC Page 24
Infor Website: www.infor.com
Deployment: License
Organizational Size: Medium to Large
Type: Demand and Supply Modeling
Relative Costs: $$$-$$$$
Coverage: Global
Industries: All
Strengths: Combines the Lawson and Infor assets to give a buyer many options for S&OP. The
solution is ideal for companies with existing Infor infrastructures. With the myriad of acquisitions,
the company has a rich stable of potential solutions to draw from. The former Intentia products
have strength in reverse bill of material modeling, and the Fygir application is the most
commonly used tank scheduling application for the wine and beer industries.
Considerations: While the company has just released a new platform and a new S&OP product,
the new solution lacks strong visualization; but is an improvement in delivering “what-if”
capabilities. This new INFOR solution was released to the market this year with less than
twenty-five deployments. The solution is stronger in supply than demand modeling.
JDA Website: www.jda.com
Deployment: License or managed service
Organizational Size: Medium to Large
Type: Demand, Supply and Inventory Modeling
Relative Costs: $$$-$$$$
Coverage: Global
Industries: Retail, consumer products and discrete manufacturers
Strengths: The company has a long legacy of acquired supply chain solutions — E3,
Manugistics, i2 Technologies — with depth of solution demand, inventory and supply modeling.
It is one of the strongest S&OP modeling tools for retail.
Considerations: The company is currently rationalizing footprints post-acquisition. The i2
Technologies software includes the deepest modeling technologies for the high-tech industry
and the new JDA S&OP solution meets many of the needs of the i2 SCP and Factory Planning
customers. Previous Manugistics customers are still struggling with the evolution of the solution
for the process industries with many companies defecting to SAP. In general, the solutions lack
the visualization technologies and ease of use that you will find from BI reformers like SAP’s use
of Business Objects/HANA and IBM’s use of Cognos.

Copyright © 2012 Supply Chain Insights LLC Page 25
John Galt Website: www.johngalt.com
Deployment: License or managed service
Organizational Size: Small-Medium
Type: Demand and Supply Modeling
Relative Costs: $-$$
Coverage: North and Central America
Industries: All
Strengths: The Company offers two solutions: the Wizard and Atlas products. The Wizard
product allows users to invest in a small solution and grow. The Atlas product has a fuller set of
features. John Galt’s legacy is in demand planning with recent development of deterministic
inventory modeling and manufacturing modeling. However, the solution is deeper in demand
than supply.
Considerations: John Galt focuses on the small to medium customer that is seeking a single
solution with an easy to use data model. It does not have the depth of planning of other larger
solutions and is not a good fit for companies seeking deep supply planning or trying to
harmonize and visualize data across multiple S&OP systems.
Jonova Website: www.jonova.com
Deployment: License, Software as a Service(SaaS) and Business Process Outsourcing (BPO)
Organizational Size: Medium to Large
Type: Financial Modeling
Relative Costs: $$$-$$$$
Coverage: North America
Industries: Aerospace, Automotive, Pharmaceutical, High-tech & Electronics
Strengths: Depth of modeling for profitability analysis on fixed versus variable costs and product
portfolio complexity. It is best used in new product launch scenario analysis to evaluate platform
scenarios. Jonova’s customers are using it for value-cream modeling, capacity planning and
supplier hedging analysis.
Considerations: The product requires a sophisticated user and access to deep financial data.
Due to the breadth and depth of the solution, and the newness of the solution approach,
companies should consider using Jonova Managed Services Offering. When implementing,
companies should realize that there are limited deployments and that the solution should only
be considered by an early adopter.

Copyright © 2012 Supply Chain Insights LLC Page 26
Kinaxis Website: www.kinaxis.com
Deployment: Software as a service
Organizational Size: Medium-Large
Type: Demand and Supply Modeling
Relative Costs: $$-$$$$
Coverage: North America and Europe
Industries: Material-intensive discrete industries
Strengths: Strongest discrete-material-intensive solution on the market. New visualization
capabilities make decisions easier, driving insights for the executive S&OP meeting.
Considerations: Stronger on supply modeling than demand. Not the solution for a company
needing a deep demand management solution. Also not a strong constraint manufacturing
modeler.
Logility Website: www.logility.com
Deployment: License
Organizational Size: Medium to Large
Type: Demand, Supply and Inventory Modeling
Relative Costs: $$-$$$$
Coverage: North America and Europe
Industries: Consumer products, apparel, and wholesale distribution industries.
Strengths: An easy-to-use, comprehensive solution with advanced capabilities in demand
management, inventory management/postponement, and new-product launch forecasting.
Depth of solution for inventory modeling and postponement. Strongest solution for S&OP for
apparel. Strong after-sale support by the organization.
Considerations: Decision support for executive S&OP lacks the visualization of other options,
and it is not appropriate as a S&OP platform connecting multiple S&OP processes. It is also not
a good fit for semiconductor or high-tech industry client.
Copyright © 2012 Supply Chain Insights LLC Page 27
Oliver Wight Website: www.oliverwight.com
Deployment: License
Organizational Size: Small
Type: Demand and Supply Modeling
Relative Costs: $-$$
Coverage: North America and Europe
Industries: All
Strengths: Complements the Oliver Wight training and enables pilot activities.
Considerations: The solution should only be considered for someone looking for a tool to get
started on S&OP following training. Serious scalability and depth of modeling issues for most
organizations as they move past the stage of a conference room pilot.
OM Partners Website: www.ompartners.be
Deployment: License
Organizational Size: Medium to Large
Type: Demand and Supply Modeling
Relative Costs: $$-$$$
Coverage: Europe and North America
Industries: Process chemical and consumer products
Strengths: Strong depth in manufacturing modeling and scenario modeling. The solution is
stronger in supply than demand. Strong client references and is often seen in European
implementations complimenting SAP APO.
Considerations: The solution requires configuration and deep understanding of the user.
However, when properly installed, the solution provides what if analysis. For S&OP, the solution
lacks visualization capabilities of other solutions like Oracle, Steelwedge or SAP HANA.

Copyright © 2012 Supply Chain Insights LLC Page 28
Oracle Website: www.oracle.com
Organizational Size: Medium to Large
Type: Demand, Supply, Financial and Inventory Modeling
Relative Costs: $$$$-$$$$$
Coverage: Global
Industries: Consumer Products, High-tech, and Discrete
Strengths: Strong demand planning capabilities and visualization of decisions for the executive
S&OP meeting. The strong user interface of the Oracle solution is appealing to customers. With
the wide-installed base of Hyperion, many companies prefer to use their Hyperion (Oracle
acquisition) modeling capabilities for Stage 3 of Financial Modeling. The company has global
presence and support capabilities for emerging economies.
Considerations: The solution lacks depth of modeling for supply. While the company has a
strong demand planning tool for all industries, the supply solution is not recommended at all for
distribution-intensive industries due to the lack of a distribution requirements modeling
capability. The product lacks a demand translation platform capability and visualization for
multiple S&OP processes. The inventory modeling technology is the weakest of any multi-tier
modeling technology on the market and the demand planning tool has a stronger requirement
for clean data than other solutions.
Portfolio Decisions Website: www.portfoliodecisions.com
Deployment: License
Organizational Size: Medium
Type: Financial Modeling
Relative Costs: $$$-$$$$
Coverage: North America
Industries: Process chemical
Strengths: Analyzes product portfolios and determines the most profitable portfolio to
manufacture.
Considerations: The company is a niche provider with a specialized solution with a few clients in
the chemical industry. The solution lacks depth in demand or supply planning modeling and will
need to be coupled to an S&OP platform to manage scenarios.
Copyright © 2012 Supply Chain Insights LLC Page 29
River Logic Website: www.riverlogic.com
Deployment: License
Type: Financial Modeling
Relative Costs: $$$-$$$$
Coverage: North America
Industries: All
Strengths: Financial modeling of fixed and variable costs.
Considerations: This technology is a complimentary modeling tool for an S&OP process for
financial modeling. It is not a demand or supply modeler and has limited dashboard capabilities
for the executive S&OP meeting. As such, it should be considered as an add-on to an S&OP
platform to compliment the process.
SAP Website: www.sap.com
Deployment: License (SAP HANA S&OP is also offered as SaaS (Software as Service)
Organizational Size: Large
Type: Demand, Supply and Financial Modeling
Relative Costs: $$$-$$$$$
Coverage: Global
Industries: All
Strengths: Global presence with an established ecosystem of implementers. The company has
financial stability and a strong range of solutions crossing all industries. The new SAP HANA
solution is an in-memory solution with social collaboration and imbedded “what-if” analysis. The
promise of the solution is provide faster in-memory visualization of S&OP decisions.
Considerations: Demand and supply solutions (APO) require a sophisticated user and care in
implementation. Users frequently complain that the solution is hard to use and lacks depth of
modeling for both demand and supply; however, it is the most widely deployed advanced
planning system in the market. The recent release of the SAP HANA platform offers promise as
an S&OP integration platform for demand translation, process visualization and the
harmonization of multiple S&OP systems. SAP has invested time and money to build an S&OP
data model in HANA that can be deployed multiple ways (license, private and public cloud);
however, the HANA solution is new and evolving and only to be considered by early adopters.

Copyright © 2012 Supply Chain Insights LLC Page 30
SAS Institute Website: www.sas.com
Organization: Medium to Large
Type: Demand, Financial and Inventory Modeling
Relative Costs: $$$-$$$$
Coverage: Global
Industries: All
Strengths: Strong demand-planning technology for market modeling with some inventory
optimization capabilities. The product is one of the deepest demand planning modeling
technologies with emerging functionality for inventory optimization.
Considerations: When looking at the SAS solution for S&OP, the buyer should look at it as
“piece parts” that will need to be assembled using someone else’s platform. The product lacks
supply modeling for manufacturing and distribution constraints and S&OP process visualization,
workflow and assumption management. It should be considered as an augmentation strategy to
another solution needing depth in demand planning.
SignalDemand Website: www.signaldemand.com
Deployment: License
Organizational Size: Medium to Large
Type: Market Sensing
Relative Costs: $$$-$$$$
Coverage: North America
Industries: Process-based industries and consumer products
Strengths: Deep optimization for demand orchestration. Should be considered by Stage 5
clients as an additional technology to make the trade-offs between revenue management and
supply alternatives.
Considerations: This technology is an enhancement tool for S&OP and should not be confused
as a technology to model demand or constraint-based supply.

Copyright © 2012 Supply Chain Insights LLC Page 31
SmartOps Website: www.smartops.com
Deployment: License and Software as a Service
Organizational Size: Medium to Large
Type: Inventory Optimization
Relative Costs: $$-$$$$
Coverage: Global
Industries: Consumer Packaged Goods, Life Sciences, High Tech, Chemical, Manufacturing,
Distribution/Retail
Strengths: Deep multi-echelon inventory optimization for manufacturers and distributors.
Considerations: Strong visualization within the technology to see form and function of inventory
with deep modeling to determine the best plan for the optimization of safety stock, cycle stock
and appropriate customer service levels. Companies is releasing a demand sensing technology
in the fall of 2012, but for now should only be considered as a complementary inventory
modeling technology for S&OP. It should be deployed into an S&OP process to deepen
inventory analysis.
Steelwedge Website: www.steelwedge.com
Deployment: Software as a service
Organizational Size: Medium to Large
Type: Demand, Supply and Demand
Relative Costs: $$$-$$$$
Coverage: North America with recent expansion into Europe and Asia
Industries: Discrete, chemical, and consumer products
Strengths: Product strength is in demand translation, attach rate forecasting and mix/volume
analysis. It is a strong visualization tool for executive scenario modeling. One of the first
Software as a Service (SaaS) offerings.
Considerations: Steelwedge was one of the first systems built for S&OP and has a common
data model that facilitates the translation of demand to understand mix changes and translate
across multiple equivalent units. The platform is stronger in supply than demand and lacks the
depth of modeling for demand or supply planning that most organizations require. As a result, it
is best deployed as a complimentary technology to existing APS implementations in large
organizations.
Copyright © 2012 Supply Chain Insights LLC Page 32
Tagetik Website: www.tagetik.com/
Deployment: License
Organizational Size: Medium
Type: Financial Modeling
Relative Costs: $$-$$$
Coverage: North America and Europe
Industries: All. (Current focus in consumer products)
Strengths: Easy to use financial modeling to compliment the S&OP Process.
Considerations: Tagetik is a financial modeling tool to visualize trade-offs, but does not offer
predictive analytics. It is a more general financial modeling tool than Acorn Systems, Jonova, or
River Logic.
Teradata Website: www.teradata.com
Deployment: License
Type: Demand and Supply Modeling
Organizational Size: Large
Relative Costs: $$$-$$$$
Coverage: Global
Industries: Retail
Strengths: Very scalable product for retail distribution. Good modeling capabilities for
distribution-based replenishment.
Considerations: While Teradata is usually thought of as a business intelligence solution, their
purchase of Stirling Douglas software makes them fit for consideration for S&OP in a retail
environment. While the solution can model demand and supply, companies will need to tailor
the analytics to model the S&OP executive workbench. The solution is not a good fit for a
manufacturer or for a company that needs to model multiple-S&OP processes at multiple
stages, or complex distribution environments.
Copyright © 2012 Supply Chain Insights LLC Page 33
Terra Technology Website: www.terratechnology.com
Type: Demand Sensing
Organizational Size: Mid-Large Companies
Deployment: License Sales
Relative Costs: $$$$-$$$$$
Coverage: North America and Europe
Industries: Consumer Products and Distribution-Centric Industries
Strengths: Depth of optimization and co-development activities on demand sensing (reducing
the latency from channel data to understand demand patterns) and inventory optimization.
Considerations: Best fit for a company that is comfortable with deep analytics in a black box.
Terra Technology has the deepest experience with the use of math to sense demand from either
order and shipment streams or channel data. Five years ago, the company also launched an
inventory optimization solution to help companies better translate demand.
ToolsGroup Website: www.toolsgroup.com
Deployment: License
Organization: Medium to Large Companies
Type: Inventory Modeling
Relative Costs: $$-$$$
Coverage: North America and Europe
Industries: Distribution Intensive
Strengths: Deep inventory optimization capabilities for organizations in distribution intensive
environments like food and beverage, consumer products and wholesale distribution.
Considerations: The solution is not a good fit for a manufacturing intensive inventory data model
involving work-in-process or late-stage postponement in the extended manufacturing network.
ToolsGroup is piloting a demand sensing application with several customers and should be
considered by early adopters.

Copyright © 2012 Supply Chain Insights LLC Page 34
WAM Systems Website: www.wamsystems.com
Deployment: License
Organizational Size: Small-Medium
Type: Demand and Supply Modeling
Relative Costs: $$-$$$
Coverage: North America and Europe
Industries: Chemical and Other Process Manufacturing Industries
Strengths: Self-contained modeling workbench to model demand and constraints. System is
designed for the chemical industry.
Considerations: Supply modeling is stronger than demand. User interface is not consistent
across the application and the business intelligence for the executive S&OP meeting is a
concern for many clients. Application has deep manufacturing scheduling logic for the small-
medium chemical company looking for an easy-to-use solution.
Copyright © 2012 Supply Chain Insights LLC Page 35
Methodology: Figures 1 and 2 in this report are based on analyst pattern recognition from interviews and client
experiences. Figure 3 is based on a web-based survey from a webinar of twenty-eight supply
chain executives. Data sourced in the infographic on page one is based on other Supply Chain
Insights S&OP reports.

Copyright © 2012 Supply Chain Insights LLC Page 36
About Supply Chain Insights LLC Supply Chain Insights LLC (SCI) is a research and advisory firm focused on reinventing the
analyst model. The services of the company are designed to help supply chain teams improve
value-based outcomes through research-based Advisory Services, a Dedicated Supply Chain
Community and Web-based Training. Formed in February 2012, the company is focused on
helping technology providers and users of technologies improve value in their supply chain
practices.
About Lora Cecere Lora Cecere (twitter ID @lcecere) is the Founder of Supply Chain Insights
LLC and the author of popular enterprise software blog Supply Chain
Shaman currently read by 4500 supply chain professionals. Her book,
Bricks Matter, publishes in the fall of 2012.
With over eight years as a research analyst with AMR Research, Altimeter Group, Gartner Group and now as a Founder of Supply Chain
Insights, Lora understands supply chain. She has worked with over 600
companies on their supply chain strategy and speaks at over 50
conferences a year on the evolution of supply chain processes and technologies. Her research
is designed for the early adopter seeking first mover advantage.