putwrite versus buywrite - aqr capital management · putwrite versus buywrite: yes, put-call parity...
TRANSCRIPT

PutWrite versus BuyWrite: Yes, Put-Call Parity Holds Here Too
AQR Capital Management, LLC Two Greenwich PlazaGreenwich, CT 06830
p: 203.742.3600
f : 203.742.3100
www.aqr.com
Roni IsraelovManaging Director
I thank Ronen Israel, Bradley Jones, Michael Katz, Matthew Klein, Nathan Sosner, Rodney Sullivan, Harsha Tummala, and Dan Villalon for helpful comments and suggestions.
March 2017
The CBOE PutWrite Index has outperformed the BuyWrite Index by approximately 1.1 percent per year between 1986 and 2015. That is pretty impressive. But troubling. Yes – troubling – because the theory of put-call parity tells us that such outperformance should be almost impossible via a compelling no-arbitrage restriction. This paper explains the mystery of this outperformance, which has implications for portfolio construction.

PutWrite versus BuyWrite: Yes, Put-Call Parity Holds Here Too 1
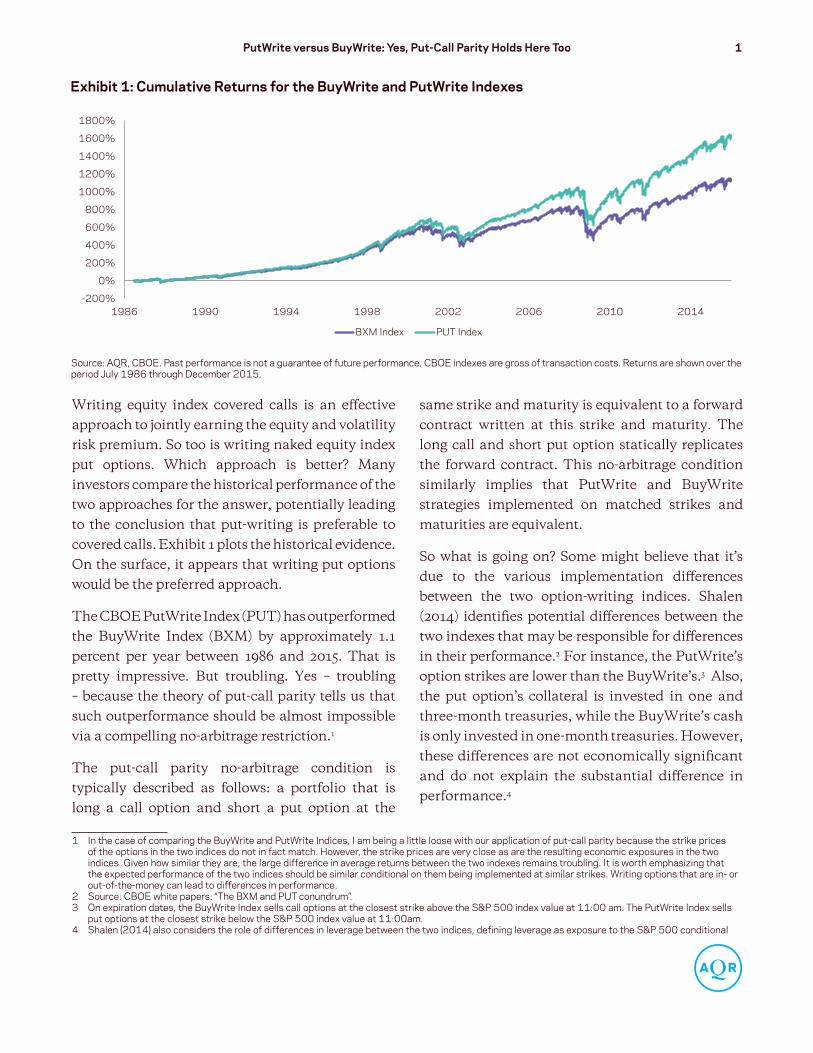
Writing equity index covered calls is an effective approach to jointly earning the equity and volatility risk premium. So too is writing naked equity index put options. Which approach is better? Many investors compare the historical performance of the two approaches for the answer, potentially leading to the conclusion that put-writing is preferable to covered calls. Exhibit 1 plots the historical evidence. On the surface, it appears that writing put options would be the preferred approach.
The CBOE PutWrite Index (PUT) has outperformed the BuyWrite Index (BXM) by approximately 1.1 percent per year between 1986 and 2015. That is pretty impressive. But troubling. Yes – troubling – because the theory of put-call parity tells us that such outperformance should be almost impossible via a compelling no-arbitrage restriction.1
The put-call parity no-arbitrage condition is typically described as follows: a portfolio that is long a call option and short a put option at the
1 In the case of comparing the BuyWrite and PutWrite Indices, I am being a little loose with our application of put-call parity because the strike prices of the options in the two indices do not in fact match. However, the strike prices are very close as are the resulting economic exposures in the two indices. Given how similar they are, the large difference in average returns between the two indexes remains troubling. It is worth emphasizing that the expected performance of the two indices should be similar conditional on them being implemented at similar strikes. Writing options that are in- or out-of-the-money can lead to differences in performance.
2 Source: CBOE white papers: “The BXM and PUT conundrum”.3 On expiration dates, the BuyWrite Index sells call options at the closest strike above the S&P 500 index value at 11:00 am. The PutWrite Index sells
put options at the closest strike below the S&P 500 index value at 11:00am.4 Shalen(2014)alsoconsiderstheroleofdifferencesinleveragebetweenthetwoindices,definingleverageasexposuretotheS&P500conditional
same strike and maturity is equivalent to a forward contract written at this strike and maturity. The long call and short put option statically replicates the forward contract. This no-arbitrage condition similarly implies that PutWrite and BuyWrite strategies implemented on matched strikes and maturities are equivalent.
So what is going on? Some might believe that it’s due to the various implementation differences between the two option-writing indices. Shalen (2014) identifies potential differences between the two indexes that may be responsible for differences in their performance.2 For instance, the PutWrite’s option strikes are lower than the BuyWrite’s.3 Also, the put option’s collateral is invested in one and three-month treasuries, while the BuyWrite’s cash is only invested in one-month treasuries. However, these differences are not economically significant and do not explain the substantial difference in performance.4
Exhibit 1: Cumulative Returns for the BuyWrite and PutWrite Indexes
Source: AQR, CBOE. Past performance is not a guarantee of future performance. CBOE indexes are gross of transaction costs. Returns are shown over the period July 1986 through December 2015.
-200%
0%
200%
400%
600%
800%
1000%
1200%
1400%
1600%
1800%
1986 1990 1994 1998 2002 2006 2010 2014
BXM Index PUT Index

2 PutWrite versus BuyWrite: Yes, Put-Call Parity Holds Here Too
Consistent with Shalen (2014), I find that the primary reason why the PutWrite Index has outperformed the BuyWrite Index is a construction difference during just four hours per month. A quirky difference in their portfolio construction results in the PutWrite Index missing out on approximately four hours per month of S&P 500 Index return relative to the BuyWrite Index.5
Each month on the morning of option expiration, both the BuyWrite’s call option and the PutWrite’s put option expire and settle at the same time at the Special Open Quotation (SOQ). At this time, option expiration fully divests the PutWrite Index of its equity exposure. Until it re-establishes a short put option position, it is a zero beta portfolio. In contrast, at the same time, the BuyWrite portfolio becomes a beta one portfolio with the expiration of its call option, because it is fully invested in the S&P 500 Index with no corresponding short call option position. It remains a beta one portfolio
ontheputsettlingin-the-moneyandconditionalonthecallsettlingout-of-the-money.Accordingtothisdefinition,thePutWriteIndexhashigherequityexposurethantheBuyWriteIndex.Analternatedefinitionisthedifferenceinthedeltaofthetwooptions.Inthiscase,thedeltadifferencebetween two nearest ATM strikes is approximately 0.03, leading to the PutWrite Index having 0.03 lower exposure to S&P 500 than the BuyWrite Index. With an equity risk premium of 5-6%, this should hurt the PutWrite Index by about 15-20 basis points per year relative to the BuyWrite Index. Shalen(2014)reportsa-0.03regressioncoefficientofPutWriteminusBuyWritereturnsontheS&P500Index,whichisconsistentwithmyalternatedeltadefinitionofleverage.
5 Source: CBOE white papers: “Methodology of the CBOE S&P 500® PutWrite Index” and “Description of the CBOE S&P 500 BuyWrite Index”.6 The original BXM methodology priced the call option according to its 11:00 am bid price. In May 21, 2004, CBOE updated the methodology to use
the call option’s VWAP from 11:30 am to noon. Beginning November 19, 2010, the VWAP period was updated to begin at 11:30 am and end at 1:30 pm.
until it re-establishes its short call option position.
On the day of expiry, the BuyWrite Index re-establishes its short call position at a Volume Weighted Average Price (VWAP) computed between 11:30 am and 1:30 pm6, while the PutWrite Index re-establishes its short put position at a VWAP computed between 11:30 am and noon. Thus, at 1:30 pm the put-call parity relationship between the two indices is back in force. However, for the four hours leading up to that time, between 9:30 am and 1:30 pm, the two indices have very different equity exposure, as the BuyWrite Index is beta one and the PutWrite Index is beta zero. This is economically significant and helps to explain most of the difference between these two index’s historical returns.
Exhibit 2 compares the BuyWrite and PutWrite Index’s returns on non-expiration dates. A scatter plot is shown on the left and cumulative returns are
Exhibit 2: Non-Expiration Date Returns for the BuyWrite and PutWrite Indexes
Source: AQR, CBOE. Past performance is not a guarantee of future performance. CBOE indexes are gross of transaction costs. Returns are shown over the period July 1986 through December 2015. In the left scatter plot, observations from the 3-week period beginning with Black Monday (10/19/1987 – 11/6/1987) are colored in light blue, while all other observations are colored in dark blue.
-30%
-20%
-10%
0%
10%
20%
-20% -10% 0% 10% 20%
PUT
Inde
x R
etur
ns
BXM Index Returns
-200%0%
200%400%600%800%
1000%1200%1400%1600%1800%2000%
1986 1990 1994 1998 2002 2006 2010 2014
BXM Index PUT Index
PutWrite versus BuyWrite: Yes, Put-Call Parity Holds Here Too 3
shown on the right. The two return series are very similar with a 0.97 correlation. This correlation is even higher (0.98) if one excludes the three week period beginning with the Black Monday crash of 1987, when asynchronicity between option and equity closing prices likely led to unusually large discrepancies between the two indexes.
Interestingly, the BuyWrite Index slightly outperformed the PutWrite Index by 0.1% annualized – although, this difference is not statistically significant. The results for all dates that are non-expiration are comforting because they are consistent with put-call parity.
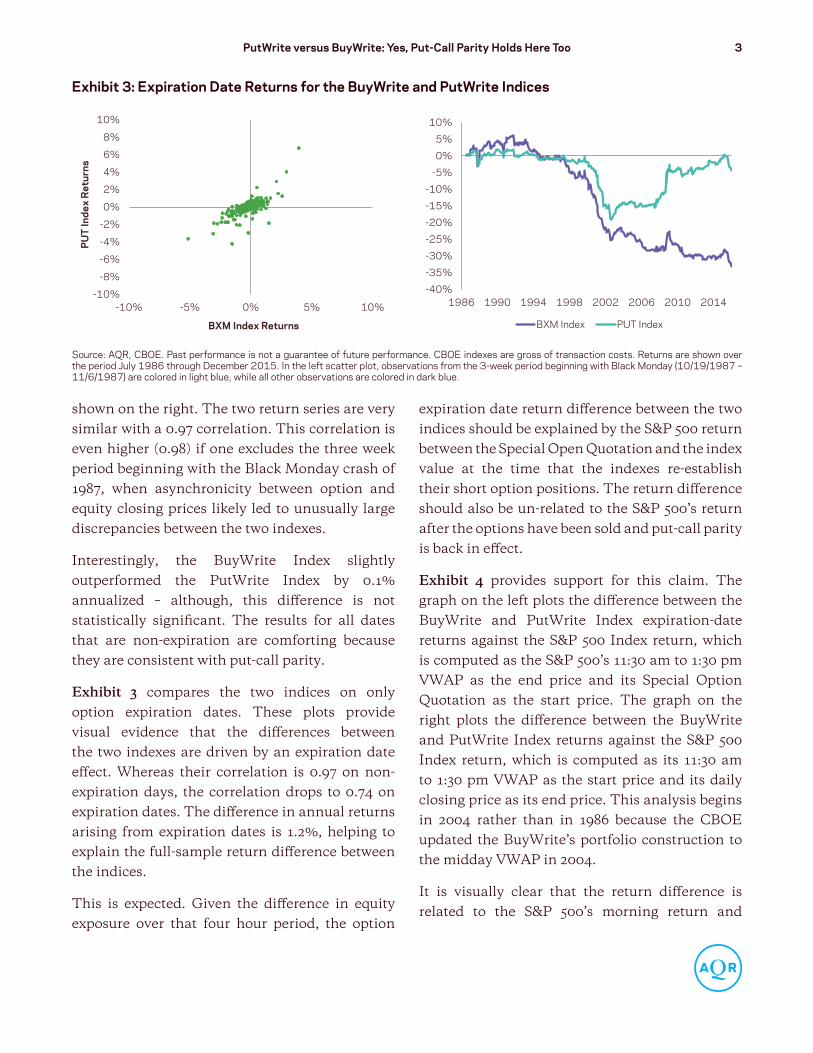
Exhibit 3 compares the two indices on only option expiration dates. These plots provide visual evidence that the differences between the two indexes are driven by an expiration date effect. Whereas their correlation is 0.97 on non-expiration days, the correlation drops to 0.74 on expiration dates. The difference in annual returns arising from expiration dates is 1.2%, helping to explain the full-sample return difference between the indices.
This is expected. Given the difference in equity exposure over that four hour period, the option
expiration date return difference between the two indices should be explained by the S&P 500 return between the Special Open Quotation and the index value at the time that the indexes re-establish their short option positions. The return difference should also be un-related to the S&P 500’s return after the options have been sold and put-call parity is back in effect.
Exhibit 4 provides support for this claim. The graph on the left plots the difference between the BuyWrite and PutWrite Index expiration-date returns against the S&P 500 Index return, which is computed as the S&P 500’s 11:30 am to 1:30 pm VWAP as the end price and its Special Option Quotation as the start price. The graph on the right plots the difference between the BuyWrite and PutWrite Index returns against the S&P 500 Index return, which is computed as its 11:30 am to 1:30 pm VWAP as the start price and its daily closing price as its end price. This analysis begins in 2004 rather than in 1986 because the CBOE updated the BuyWrite’s portfolio construction to the midday VWAP in 2004.
It is visually clear that the return difference is related to the S&P 500’s morning return and
Exhibit 3: Expiration Date Returns for the BuyWrite and PutWrite Indices
Source: AQR, CBOE. Past performance is not a guarantee of future performance. CBOE indexes are gross of transaction costs. Returns are shown over the period July 1986 through December 2015. In the left scatter plot, observations from the 3-week period beginning with Black Monday (10/19/1987 – 11/6/1987) are colored in light blue, while all other observations are colored in dark blue.
-10%
-8%
-6%
-4%
-2%
0%
2%
4%
6%
8%
10%
-10% -5% 0% 5% 10%
PUT
Inde
x R
etur
ns
BXM Index Returns
-40%
-35%
-30%
-25%
-20%
-15%
-10%
-5%
0%
5%
10%
1986 1990 1994 1998 2002 2006 2010 2014
BXM Index PUT Index

4 PutWrite versus BuyWrite: Yes, Put-Call Parity Holds Here Too
unrelated to the S&P 500’s afternoon return. I report the multi-variate regression results below.
The regression shows that the return difference’s beta to the S&P 500’s morning return is very near 1.0, in line with expectations.7 The beta to the afternoon return is near zero, also in line with expectations. Importantly, the simple economically motivated model explains 94 percent of the variance of the return difference between the two indices.
On average, between 2004 and 2015, the S&P 500 Index was down 23 basis points on option expiration mornings.8 The equity returns over this four hour period 12 times per year suggests 2.7% of annual underperformance for the BuyWrite
7 Shalen(2014)alsoreportsacoefficientnear1.0.8 The magnitude of this average return is noteworthy. The standard deviation of the returns is 63 basis points, giving the 23 basis point average a
t-Statistic of -4.2. Of the 139 observations, 96 are negative.9 I remain open to the possibility that there could in fact be an average negative return over this period. If for some reason the SOQ is biased high, then
expected returns could in fact be negative even over a much smaller window. The SOQ is computed using opening auction values of S&P 500 Index constituents.ForadditionalinformationontheSOQ,pleaseseehttps://www.cmegroup.com/education/files/understanding-the-soq.pdf.Thepaperdocuments surprising artifacts relating to the SOQ. For instance, on a number of occasions, the SOQ was recorded either above or below the S&P 500 Index’s daily high or low value. The effect of the SOQ in particular on BuyWrite and PutWrite performance is worthy of additional research, but out of the scope of this paper.
10 Investors who wish to be under-exposed during this four-hour period do not need to turn to a PutWrite strategy to do so. They may short the S&P 500 Index at the open on option expiration dates and exit their position via VWAP between 11:30 am and 1:30 pm. Furthermore, a PutWrite strategy only providesthespecificunder-exposuredescribedinthispaperwhenimplementedidenticallytotheCBOEPutWriteIndex’smethodology.Iftheshortputoptions are rolled early (prior to option expiration) or replaced later than in the CBOE’s methodology, the equity exposure and its resulting return will differ.
Index relative to the PutWrite Index. Adding back in the intercept (annualized) provides a combined effect of 2.0% of annualized expiration-date underperformance. This is very close to the 2.1% the BuyWrite Index underperformed the PutWrite Index over the same 2004 to 2015 period.
Over this four-hour window, the BuyWrite Index is over-exposed to the S&P 500 relative to its long-term average exposure. Similarly, the PutWrite Index is under-exposed to the S&P 500 relative to its long-term average exposure. Under- or over-exposure is a form of an active timing strategy. Unless an investor has a compelling reason why the S&P 500 Index’s return should be any different during this four-hour window than any other four-hour window9, it is our opinion that he should not want to be over- or under-exposed to equities during this period.10
Exhibit 4: BuyWrite-PutWrite Expiration-Date Return vs. S&P 500 Morning and Afternoon Return
Source: AQR, CBOE. Past performance is not a guarantee of future performance. CBOE indexes are gross of transaction costs. Returns are shown over the period June 2004 through December 2015.
-4%
-2%
0%
2%
4%
-4% -2% 0% 2% 4%
BX
M -
PUT
Morning Return
-4%
-2%
0%
2%
4%
-4% -2% 0% 2% 4% 6%
BX
M -
PUT
Afternoon Return
BXM – PUT return on expiration dates
= 6.4 bps(4.2)
+ 1.03* rspx,am(45.1)
- 0.06*rspx,pm(-2.6)
R2: 0.94

PutWrite versus BuyWrite: Yes, Put-Call Parity Holds Here Too 5
Both implementations are individually sub-optimal because they are each exposed to an expiration-morning timing risk (even though it happens that these timing exposures nearly offset one another). One potential solution equally-weights the two indices, yielding the same expected return without timing the market on the morning of option expiration. This solution provides 0.5 beta, in line with its long-term equity exposure, while awaiting the sale of the next options.
Reducing this source of market timing should lead to a less volatile portfolio. In fact, we have seen this to be the case. The annualized expiration-date return volatility for the BuyWrite and PutWrite Indices has been 13.5% and 12.6%, respectively, over the period 1986 through 2015. An equal-weight portfolio of the two indexes has 12.1% annualized expiration-date return volatility.
This paper helps explain the mystery of the difference in returns between the CBOE PutWrite and BuyWrite Indexes, but given the magnitude of the S&P 500 Index’s return on option expiration mornings (rom the Special Open Quotation until noon), opens the door to another. This is a topic for further research.

6 PutWrite versus BuyWrite: Yes, Put-Call Parity Holds Here Too
Notes
PutWrite versus BuyWrite: Yes, Put-Call Parity Holds Here Too 7
Notes
8 PutWrite versus BuyWrite: Yes, Put-Call Parity Holds Here Too
Notes

PutWrite versus BuyWrite: Yes, Put-Call Parity Holds Here Too 9
Disclosures
This document has been provided to you solely for information purposes and does not constitute an offer or solicitation of an offer or any adviceorrecommendationtopurchaseanysecuritiesorotherfinancialinstrumentsandmaynotbeconstruedassuch.Thefactualinfor-mation set forth herein has been obtained or derived from sources believed by the author and AQR Capital Management, LLC (“AQR”) to be reliable but it is not necessarily all-inclusive and is not guaranteed as to its accuracy and is not to be regarded as a representation or warranty, express or implied, as to the information’s accuracy or completeness, nor should the attached information serve as the basis of any investment decision. This document is intended exclusively for the use of the person to whom it has been delivered by AQR, and it is not to be reproduced or redistributed to any other person. The information set forth herein has been provided to you as secondary information and should not be the primary source for any investment or allocation decision.
Past performance is not a guarantee of future performance.
Thispaperisnotresearchandshouldnotbetreatedasresearch.Thispaperdoesnotrepresentvaluationjudgmentswithrespecttoanyfinan-cialinstrument,issuer,securityorsectorthatmaybedescribedorreferencedhereinanddoesnotrepresentaformalorofficialviewofAQR.
TheviewsexpressedreflectthecurrentviewsasofthedatehereofandneithertheauthornorAQRundertakestoadviseyouofanychangesin the views expressed herein. It should not be assumed that the author or AQR will make investment recommendations in the future that are consistent with the views expressed herein, or use any or all of the techniques or methods of analysis described herein in managing client ac-counts.AQRanditsaffiliatesmayhavepositions(longorshort)orengageinsecuritiestransactionsthatarenotconsistentwiththeinforma-tion and views expressed in this paper.
The information contained herein is only as current as of the date indicated, and may be superseded by subsequent market events or for other reasons. Charts and graphs provided herein are for illustrative purposes only. The information in this paper has been developed internally and/or obtained from sources believed to be reliable; however, neither AQR nor the author guarantees the accuracy, adequacy or completeness of such information. Nothing contained herein constitutes investment, legal, tax or other advice nor is it to be relied on in making an investment or other decision.
There can be no assurance that an investment strategy will be successful. Historic market trends are not reliable indicators of actual future market behavior or future performance of any particular investment which may differ materially, and should not be relied upon as such.
The information in this paper may contain projections or other forward-looking statements regarding future events, targets, forecasts or expectations regarding the strategies described herein, and is only current as of the date indicated. There is no assurance that such events or targetswillbeachieved,andmaybesignificantlydifferentfromthatshownhere.Theinformationinthispaper,includingstatementsconcern-ingfinancialmarkettrends,isbasedoncurrentmarketconditions,whichwillfluctuateandmaybesupersededbysubsequentmarketeventsor for other reasons. Performance of all cited indices is calculated on a total return basis with dividends reinvested.
Broad-based securities indices are unmanaged and are not subject to fees and expenses typically associated with managed accounts or investment funds. Investments cannot be made directly in an index.
Theinvestmentstrategyandthemesdiscussedhereinmaybeunsuitableforinvestorsdependingontheirspecificinvestmentobjectivesandfinancialsituation.Pleasenotethatchangesintherateofexchangeofacurrencymayaffectthevalue,priceorincomeofaninvestmentadversely.
Neither AQR nor the author assumes any duty to, nor undertakes to update forward looking statements. No representation or warranty, express or implied, is made or given by or on behalf of AQR, the author or any other person as to the accuracy and completeness or fairness of the information contained in this paper, and no responsibility or liability is accepted for any such information. By accepting this paper in its entirety, the recipient acknowledges its understanding and acceptance of the foregoing statement.

AQR Capital Management, LLCTwo Greenwich Plaza, Greenwich, CT 06830
p: +1.203.742.3600 I f: +1.203.742.3100 I w: aqr.com