pvg a sset managementpvgassetmanagement.com/pdf/pvg_conference_call... · loss averse equity income...
TRANSCRIPT

LOSS AVERSE EQUITY INCOMER I S K M A N A G E D Q U A L I T Y VA L U E A N D I N C O M E
D I V I D E N D PAY I N G S T O C K S
P V G A S S E T M A N A G E M E N T
L O S S AV E R S E I N V E S T I N G

2
PVG PORTFOLIO MANAGEMENT TEAM
Mr. Patrick Adams, CFA, has over 30 years of investment experience with an intense, bottom-up research process to invest both long and short in the U.S. equity markets. Mr.Adams is also the Chief Executive Officer and Lead Portfolio Manager of PVG Asset Management. He is the chair of the investment committee. He has been managing hedge fundssince 1999 and private equity funds since 2005. Prior funds managed at Berger Funds, Kemper, Founders, and Parkstone were all sizable funds and some over $3 billion in size. Mr.Adams has an outstanding long term track record significantly outperforming the S&P 500. Barron’s recognized Mr. Adams as having “All the Right Moves” and “Perfect Timing-because he knows when to get into a stock and when to exit.” Mr. Adams received his MBA from Xavier University and graduated B.S. from the Ohio State University. He has passedrigorous requirements to earn his international professional certification as a Chartered Financial Analyst issued by the CFA Institute.
Patrick Adams – CEO/CIO
Joseph Pecoraro – CCO/Portfolio ManagerMr. Joe Pecoraro, CFA, has been managing money since 1969. Mr. Pecoraro’s career includes experience as a securities analyst with Security Pacific National Bank and the Britishbrokerage firm, Joseph Sebags, in Los Angeles and London. Mr. Pecoraro was a top performing fund manager with the Oppenheimer Funds Group from 1974 through 1981, afterwhich he helped form an investment advisory firm, Alpine Capital Management, which he sold in 1988 to form PVG Asset Management. Mr. Pecoraro developed the Loss AverseInvesting approach during 1998/1999 when he became concerned about the possibility of unfavorable future market conditions and the impact of such conditions on clients. Heearned MS and BA Economics degrees from California State University, Fullerton. He has passed rigorous requirement to earn his international professional certification as a Char-tered Financial Analyst issued by the CFA Institute.
Mr. Rick Garcia is President and a portfolio manager for PVG. His leadership role includes management of the sales and marketing division at PVG Asset Management. Mr. Garcia has been in the financial industry for over 10 years. Prior to joining PVG, he was a Stock Broker for Charles Schwab & Company and a Business Development Consultant with Jackson National Life. Preceding the financial industry, Mr. Garcia served in the United States Marine Corps for 5 years, with overseas deployment during Operation Enduring Freedom (2001) and Operation Iraqi Freedom (2003). He was honorably discharged as a Sergeant in 2003. Mr. Garcia has his Bachelor of Science Finance degree from Metropolitan State University of Denver.
Rick Garcia – President/Portfolio Manager
Mr. Timothy J. McIntosh serves as an Investment Officer for PVG. He oversees all aspects of major client accounts and serves as the lead portfolio manager for the firm's ValueLeaders Long/Short and US Corporate Flexible Bond portfolios. Tim serves on the firm’s investment committee. He also serves as Compliance Officer. He served as a Professor ofFinance at Eckerd College from 1998 to 2008. Mr. McIntosh’s is the author of The Snowball Effect, The Bear Market Survival Guide, The Sector Strategist, and a contributor tothe Comprehensive Financial Planning Strategies for Doctors and Advisors. Tim has a Bachelor of Science Degree in Economics from Florida State University and Masters of BusinessAdministration (M.B.A) degree from the University of Sarasota-Argosy and a Master of Public Health Degree (M.P.H) from the University of South Florida. Tim is a CERTIFIEDFINANCIAL PLANNER™. Tim is an Army veteran, having served active duty in the Army Military Intelligence Unit.
Timothy McIntosh – Portfolio Manager
Mr. Paul MacNamara is a senior market strategist and also provides equity/bond analysis for the firm. He is a member of the firm's investment committee. Paul is the portfoliomanager for the Global Macro Strategy. Paul is a CERTIFIED FINANCIAL PLANNER™. Prior to joining PVG, Paul was CEO for SIPCO Investment Management Company. He also ownedand operated an independent investment advisory firm. He retired from the U.S. Army as a disabled-veteran Lt. Colonel in the Special Forces. He and his wife currently reside inMechanicsburg, PA.
Paul MacNamara – Portfolio Manager

3
PVG LOSS AVERSE EQUITY INCOME STRATEGY
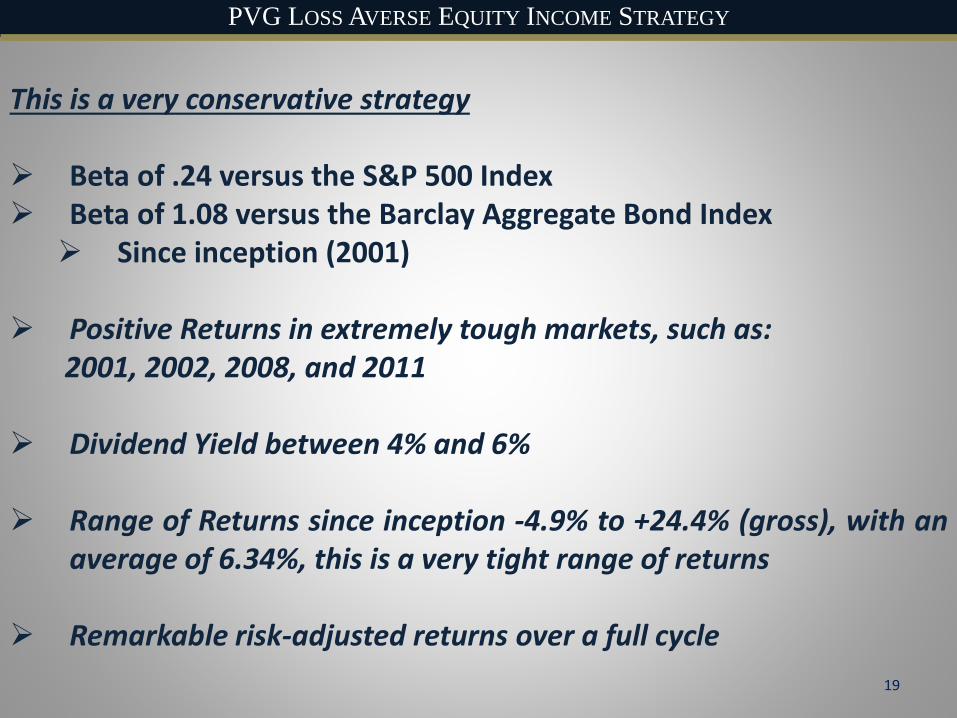
This is a very conservative strategy
➢ Beta of .24 versus the S&P 500 Index➢ Beta of 1.08 versus the Barclay Aggregate Bond Index
➢ Since inception (2001)
➢ Positive Returns in extremely tough markets, such as:2001, 2002, 2008, and 2011
➢ Dividend Yield between 4% and 6%
➢ Range of Returns since inception -4.9% to +24.4% (gross), with anaverage of 6.34%, this is a very tight range of returns
➢ Remarkable risk-adjusted returns over a full cycle

4
PVG LOSS AVERSE EQUITY INCOME STRATEGY
MODERN PORTFOLIO THEORY
This theory suggests that it’s possible to create an optimal portfolio along the efficient frontier
which will offer the maximum expected return for a given level of risk. Traditional strategies
have implemented a partial stock and bond strategy in applying this theory.
PVG offers a true diversified alternative to a traditional portfolio.
Growth & Value Stocks
Fixed Income
PVG –Value/Fixed Income Alt
ALTERNATIVE PVG PORTFOLIO50%/20%/30%(+/-10%)
30% (+/- 10%)
20%
50%Growth Stocks
Fixed Income
High Yield
Value Stocks
STANDARD BALANCED PORTFOLIO60%/40%
30%
10%
30%30%
WHERE DOES THIS STRATEGY FIT?

5
PVG LOSS AVERSE EQUITY INCOME STRATEGY
Correlation is very low against S&P 500 and Barclay Aggregate Bond➢ .17 versus the S&P 500 Index➢ .18 versus the Barclay Aggregate Bond Index
S&P 500 Correlation
SPDR Select Sector Fund – Industrial (XLI) 0.931
SPDR Select Sector Fund – Cons. Discretionary (XLY) 0.905
SPDR Select Sector Fund – Technology (XLK) 0.890
SPDR Materials Select Sector SPDR (XLB) 0.876
SPDR Select Sector Fund – Financial (XLF) 0.838
SPDR Select Sector Fund – Health Care (XLV) 0.758
SPDR Select Sector Fund – Cons. Staples (XLP) 0.747
SPDR Select Sector Fund - Energy Select Sector (XLE) 0.655
SPDR Select Sector Fund – Utilities (XLU) 0.464
PVG Loss Averse Equity Income 0.17
Correlation vs. S&P 500 (9/30/2001 – 3/31/2018)
6
PVG LOSS AVERSE EQUITY INCOME STRATEGY
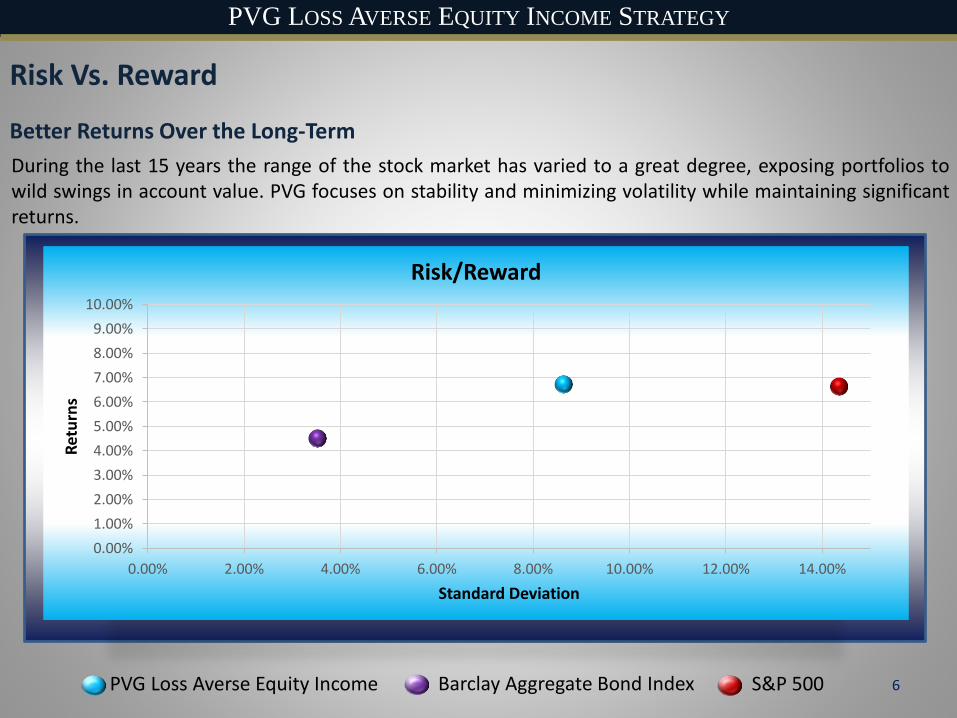
Risk Vs. Reward
During the last 15 years the range of the stock market has varied to a great degree, exposing portfolios towild swings in account value. PVG focuses on stability and minimizing volatility while maintaining significantreturns.
Better Returns Over the Long-Term
0.00%
1.00%
2.00%
3.00%
4.00%
5.00%
6.00%
7.00%
8.00%
9.00%
10.00%
0.00% 2.00% 4.00% 6.00% 8.00% 10.00% 12.00% 14.00%
Ret
urn
s
Standard Deviation
Risk/Reward
PVG Loss Averse Equity Income Barclay Aggregate Bond Index S&P 500

7
PVG LOSS AVERSE EQUITY INCOME STRATEGY
The Power of High Dividends
If you compound this dividend over a 10 year period, you achieve a return of 66%. If you are able toincorporate an additional 2.9% of annual performance you will effectively double your money over thattimeframe.
Our average yield over the last 6 years is 5.2%
0.00%
1.00%
2.00%
3.00%
4.00%
5.00%
6.00%
7.00%
2011 2012 2013 2014 2015 2016 2017
6.27%
5.53%
4.82% 4.77%
5.54%
4.90%5.40%
1.97% 1.91%2.86%
1.88% 2.09% 2.43% 2.65%
2.13% 2.20% 1.94% 1.92% 2.11% 2.03%1.90%
Historical Yield Trends
PVG Yield 10 Year Treasury Rate S&P 500 Yield

8
PVG LOSS AVERSE EQUITY INCOME STRATEGY
Market Cycle Chart
Market Neutral Market Neutral
Mar
ket
Val
ue
vs. P
VG
Val
ue
Time
Long/Short
CURRENT PORTFOLIO RISK SPECTRUM
Risk Averse
Risk Seeking
As of 3/31/2018
Current Risk

PVG LOSS AVERSE EQUITY INCOME STRATEGY
Strategy Performance By YearQTR 1 QTR 2 QTR 3 QTR 4 PVG ANNUAL BARCLAY
BOND INDEXS&P 500
GROSS NET GROSS NET GROSS NET GROSS NET GROSS NET
2018 -1.96 -2.31 -1.96 -2.31 -1.54 -0.76
2017 -1.47 -1.80 -0.66 -1.00 -1.61 -1.96 -0.13 -0.49 -3.82 -5.14 3.73 21.83
2016 1.93 1.59 3.91 3.55 4.12 3.78 -1.92 -2.25 8.17 6.71 2.79 11.96
2015 -0.34 -0.65 -1.84 -2.16 -5.26 -5.55 2.62 2.29 -4.90 -6.09 0.58 1.38
2014 1.47 1.22 0.65 0.35 -2.22 -2.52 -2.77 -3.08 -2.91 -4.03 5.88 13.70
2013 3.33 3.06 -2.27 -2.51 0.16 -0.07 0.91 0.68 2.05 1.08 -2.02 32.44
2012 3.73 3.37 2.28 1.92 3.80 3.43 1.05 0.74 11.30 9.76 4.22 16.00
2011 -0.22 -0.51 2.24 1.89 -4.09 -4.44 7.35 6.98 5.04 3.97 7.84 2.11
2010 0.45 0.29 11.61 11.41 9.41 9.29 1.74 1.54 24.41 23.99 6.54 15.06
2009 -4.65 -4.86 13.67 13.44 6.91 6.66 -4.07 -4.30 11.16 10.17 5.93 26.46
2008 4.51 4.26 3.36 3.12 -10.91 -11.11 5.77 5.52 1.79 0.85 5.24 -37.00
2007 1.44 1.19 -3.01 -3.26 2.76 2.52 -2.58 -2.81 -1.50 -2.47 6.97 5.49
2006 0.39 -0.63 0.25 -0.01 3.56 3.28 0.85 0.60 4.29 3.24 4.33 15.79
2005 -0.32 -0.54 3.04 2.80 3.24 3.00 0.33 0.10 6.39 5.36 2.43 4.91
2004 4.56 4.28 -5.41 -5.67 3.30 3.09 0.88 0.65 3.07 2.35 4.34 10.88
2003 9.98 9.71 5.30 5.03 2.05 1.82 5.39 5.18 24.55 21.74 4.10 28.68
2002 4.25 3.98 -0.55 -0.80 -0.09 -0.35 6.79 6.55 10.62 9.38 10.26 -22.10
2001 3.33 3.04 3.33 3.04 8.43 -11.89
9
10
PVG LOSS AVERSE EQUITY INCOME STRATEGY
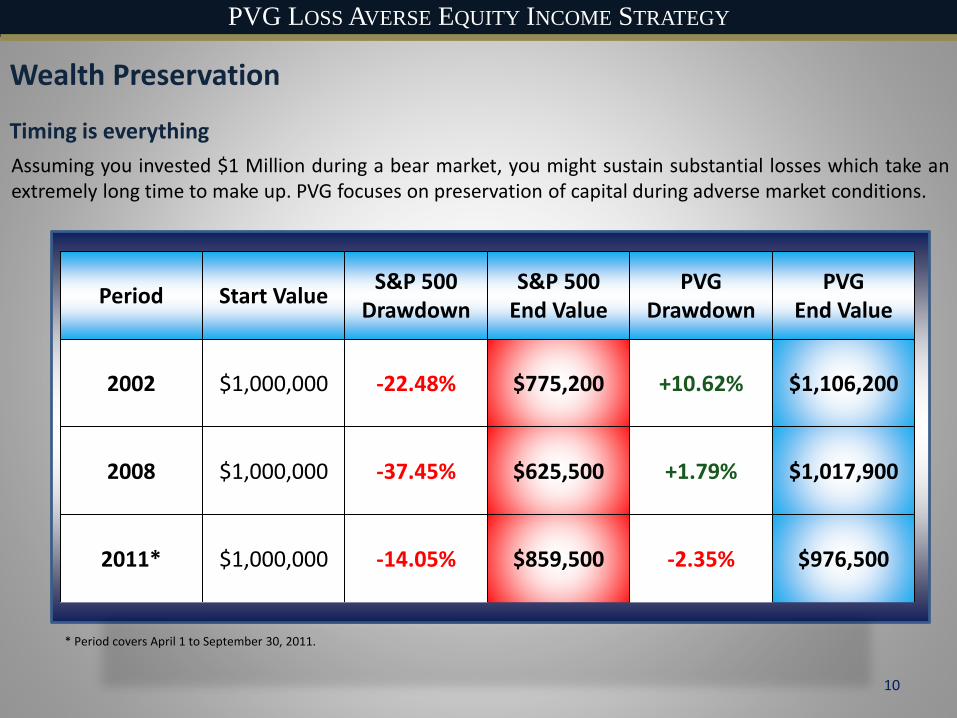
Wealth Preservation
Assuming you invested $1 Million during a bear market, you might sustain substantial losses which take anextremely long time to make up. PVG focuses on preservation of capital during adverse market conditions.
Timing is everything
Period Start ValueS&P 500
DrawdownS&P 500
End ValuePVG
DrawdownPVG
End Value
2002 $1,000,000 -22.48% $775,200 +10.62% $1,106,200
2008 $1,000,000 -37.45% $625,500 +1.79% $1,017,900
2011* $1,000,000 -14.05% $859,500 -2.35% $976,500
* Period covers April 1 to September 30, 2011.

11
PVG LOSS AVERSE EQUITY INCOME STRATEGY
Income Generation
If you invested $1,000,000 into PVG’s strategy during 2001 and you were taking income withdrawals of 5%with a net fee of 1.5%, then you would have withdrawn $876,908.72 and you would still have an accountvalue of $999,567.19. Meanwhile, your portfolio experienced 75% less volatility than the S&P 500 Index.
Hypothetical Scenario:
$0.00
$200,000.00
$400,000.00
$600,000.00
$800,000.00
$1,000,000.00
$1,200,000.00
Sep
-01
Mar
-02
Sep
-02
Mar
-03
Sep
-03
Mar
-04
Sep
-04
Mar
-05
Sep
-05
Mar
-06
Sep
-06
Mar
-07
Sep
-07
Mar
-08
Sep
-08
Mar
-09
Sep
-09
Mar
-10
Sep
-10
Mar
-11
Sep
-11
Mar
-12
Sep
-12
Mar
-13
Sep
-13
Mar
-14
Sep
-14
Mar
-15
Sep
-15
Mar
-16
Sep
-16
PVG Account Value Total Distributions

PVG LOSS AVERSE EQUITY INCOME
10%
20%
20%30%
20%
Growth Stocks
Value Stocks
Income Stocks
Inverse ETFs
Cash
Long Portfolio Neutral Portfolio
PRE-BEAR MARKETPOST-BEAR MARKET
50%
20%
20%
10%
Growth Stocks
Value Stocks
Income Stocks
Cash
➢ The Strategy invests in both Common Stocks and Income Stocks to generate a 4%-6% Annual Yield through a
full market cycle (Bull and Bear)
➢ When the market is overvalued the strategy migrates to a more “market neutral” position using inverse ETFs to
protect against systemic risk
➢ The strategy will be more tilted to Value and Income Stocks or defensive positions such as cash and inverse ETFs
at market tops
➢ The strategy will be more tilted to Growth Stocks with little to no hedge after significant bear markets
HOW IS LOSS AVERSE EQUITY INCOME INVESTED?
12
13
PVG LOSS AVERSE EQUITY INCOME STRATEGY
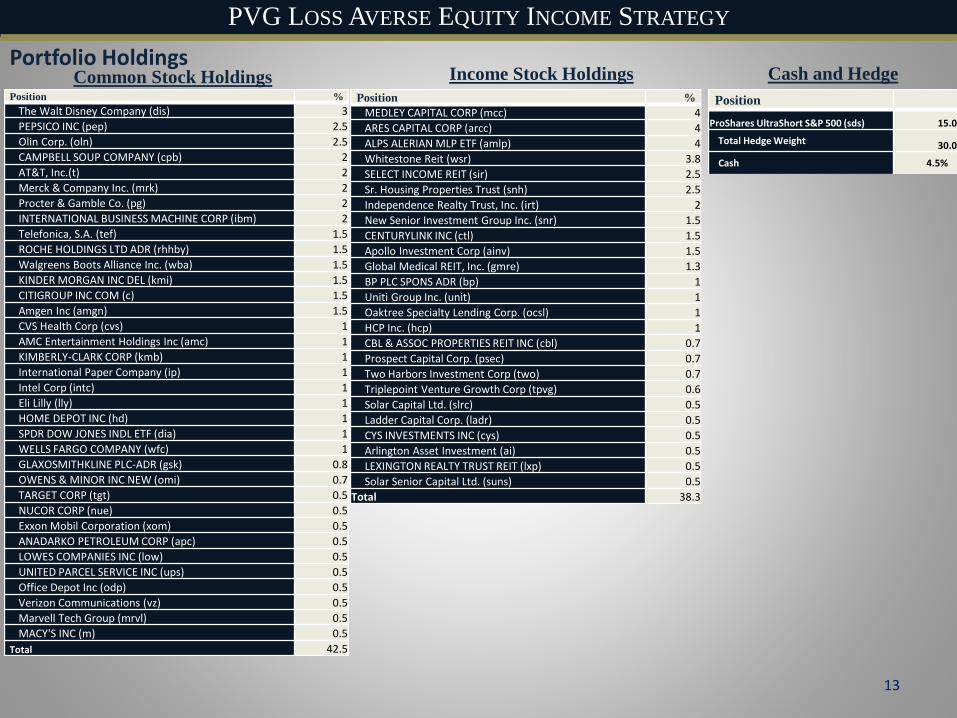
Portfolio Holdings
Position %
The Walt Disney Company (dis) 3
PEPSICO INC (pep) 2.5
Olin Corp. (oln) 2.5
CAMPBELL SOUP COMPANY (cpb) 2
AT&T, Inc.(t) 2
Merck & Company Inc. (mrk) 2
Procter & Gamble Co. (pg) 2
INTERNATIONAL BUSINESS MACHINE CORP (ibm) 2
Telefonica, S.A. (tef) 1.5
ROCHE HOLDINGS LTD ADR (rhhby) 1.5
Walgreens Boots Alliance Inc. (wba) 1.5
KINDER MORGAN INC DEL (kmi) 1.5
CITIGROUP INC COM (c) 1.5
Amgen Inc (amgn) 1.5
CVS Health Corp (cvs) 1
AMC Entertainment Holdings Inc (amc) 1
KIMBERLY-CLARK CORP (kmb) 1
International Paper Company (ip) 1
Intel Corp (intc) 1
Eli Lilly (lly) 1
HOME DEPOT INC (hd) 1
SPDR DOW JONES INDL ETF (dia) 1
WELLS FARGO COMPANY (wfc) 1
GLAXOSMITHKLINE PLC-ADR (gsk) 0.8
OWENS & MINOR INC NEW (omi) 0.7
TARGET CORP (tgt) 0.5
NUCOR CORP (nue) 0.5
Exxon Mobil Corporation (xom) 0.5
ANADARKO PETROLEUM CORP (apc) 0.5
LOWES COMPANIES INC (low) 0.5
UNITED PARCEL SERVICE INC (ups) 0.5
Office Depot Inc (odp) 0.5
Verizon Communications (vz) 0.5
Marvell Tech Group (mrvl) 0.5
MACY'S INC (m) 0.5
Total 42.5
Common Stock HoldingsPosition %
MEDLEY CAPITAL CORP (mcc) 4
ARES CAPITAL CORP (arcc) 4
ALPS ALERIAN MLP ETF (amlp) 4
Whitestone Reit (wsr) 3.8
SELECT INCOME REIT (sir) 2.5
Sr. Housing Properties Trust (snh) 2.5
Independence Realty Trust, Inc. (irt) 2
New Senior Investment Group Inc. (snr) 1.5
CENTURYLINK INC (ctl) 1.5
Apollo Investment Corp (ainv) 1.5
Global Medical REIT, Inc. (gmre) 1.3
BP PLC SPONS ADR (bp) 1
Uniti Group Inc. (unit) 1
Oaktree Specialty Lending Corp. (ocsl) 1
HCP Inc. (hcp) 1
CBL & ASSOC PROPERTIES REIT INC (cbl) 0.7
Prospect Capital Corp. (psec) 0.7
Two Harbors Investment Corp (two) 0.7
Triplepoint Venture Growth Corp (tpvg) 0.6
Solar Capital Ltd. (slrc) 0.5
Ladder Capital Corp. (ladr) 0.5
CYS INVESTMENTS INC (cys) 0.5
Arlington Asset Investment (ai) 0.5
LEXINGTON REALTY TRUST REIT (lxp) 0.5
Solar Senior Capital Ltd. (suns) 0.5
Total 38.3
Income Stock Holdings
Position
ProShares UltraShort S&P 500 (sds) 15.0
Total Hedge Weight 30.0
Cash 4.5%
Cash and Hedge

14
PVG LOSS AVERSE INVESTING
Bulls and Bears…
Given the duration of this currentbullish move for the stock market,the probability that a cyclical bearmarket will occur is rising. Thecurrent Bull Market is now the 2nd
longest in modern history.

PVG LOSS AVERSE INVESTING
Stock and Bond Market ValuationBoth stocks and bonds are overvalued
The yield of the 10 year treasury iscurrently 2.96%. Generally, the 10 yearnote trends around the nominal GDPgrowth rate. For instance, real GDPgrowth of 3% plus inflation rate of 3%,plus a risk premium, gets an expectedyield on the 10 year treasury of 6-7%.When the bond yields more than 6% itgenerally represents good value, andbelow 4% has a high degree of risk.
The current S&P 500 Shiller P/E ratio shows31.88x. Generally, 15 times earnings orlower, represents attractive periods forowning stocks, and above 15 times, higherrisk periods. It should be noted that thereare periods during recessions whenearnings fall to very low levels and shouldnot be used to assess the value of theequity markets for these purposes like in2008 and 2009.
15

16
PVG LOSS AVERSE INVESTING
Technicals
➢ During the last year, value stocks have dramatically underperformed growth stocks.
➢ Value stocks are generally much more dependent on the economy, and this underperformance disparity tends to happen at the end of a bull market.
➢ Many value stocks also tend to be nice income producers as well.

17
PVG LOSS AVERSE INVESTING
Technicals
• Fed Policy and central banks around the world have driven valuations to excessive levels.
• Collectively, Central Banks have purchased over $20 Trillion in Debt since 2009.
• The US Federal Reserve will now begin rolling off their balance sheet which should lead to higher rates.
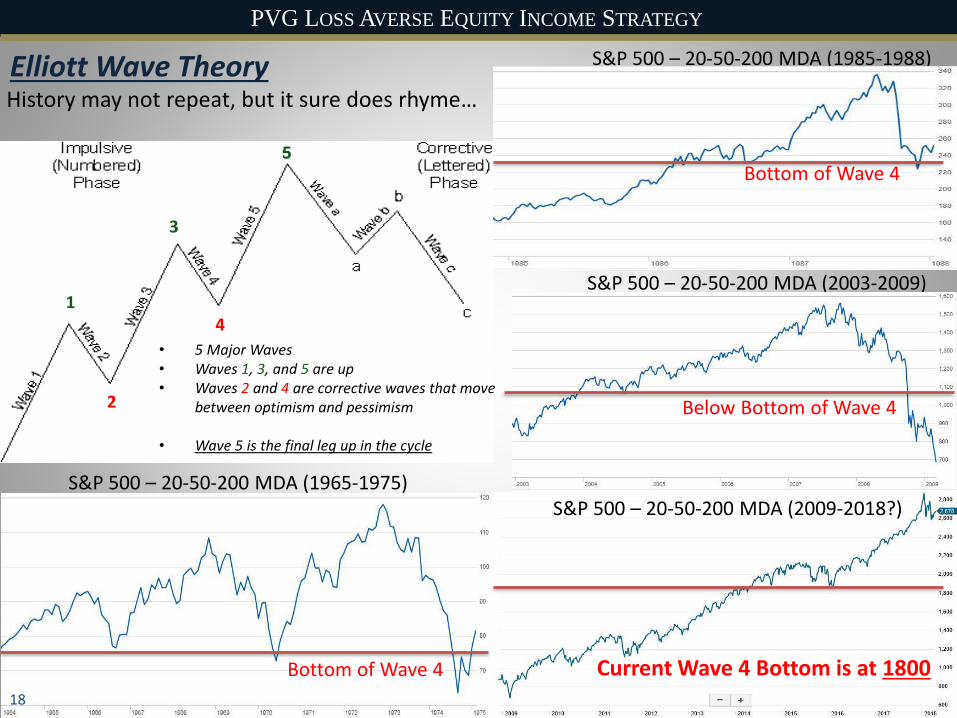
Bottom of Wave 4
2
4
3
1
5
• 5 Major Waves• Waves 1, 3, and 5 are up• Waves 2 and 4 are corrective waves that move
between optimism and pessimism
• Wave 5 is the final leg up in the cycle
18
History may not repeat, but it sure does rhyme…
S&P 500 – 20-50-200 MDA (1965-1975)
S&P 500 – 20-50-200 MDA (1985-1988)
S&P 500 – 20-50-200 MDA (2003-2009)
S&P 500 – 20-50-200 MDA (2009-2018?)
Bottom of Wave 4
Below Bottom of Wave 4
Current Wave 4 Bottom is at 1800
PVG LOSS AVERSE EQUITY INCOME STRATEGY
Elliott Wave Theory
19
PVG LOSS AVERSE EQUITY INCOME STRATEGY
This is a very conservative strategy
➢ Beta of .24 versus the S&P 500 Index➢ Beta of 1.08 versus the Barclay Aggregate Bond Index
➢ Since inception (2001)
➢ Positive Returns in extremely tough markets, such as:2001, 2002, 2008, and 2011
➢ Dividend Yield between 4% and 6%
➢ Range of Returns since inception -4.9% to +24.4% (gross), with anaverage of 6.34%, this is a very tight range of returns
➢ Remarkable risk-adjusted returns over a full cycle

P V G A S S E T M A N A G E M E N T
L O S S AV E R S E I N V E S T I N G
WWW.PVGASSETMANAGEMENT.COM
6898 S. University Blvd. | Centennial, CO 80122 | 800-777-0818
www.pvgassetmanagement.com
Performance results are presented in U.S. dollars and are net-of-actual-management fees and trading expenses of the composite and reflect the reinvestment of dividends and
capital gains. Actual fees may vary based on, among other factors, account size and custodial relationship. Annual returns are compounded over the specified period. The
current dividend yield is calculated gross of fees as of quarter end date and is the expected forward yield. *Denotes implementation of new strategies as of 12/31/2015. No
current or prospective client should assume future performance of any specific investment strategy will be profitable or equal to past performance levels. All investment
strategies have the potential for profit or loss. Changes in investment strategies, contributions or withdrawals may cause the performance results of your portfolio to differ
materially from the reported composite performance. Different types of investments involve varying degrees of risk, and there can be no assurance that any specific investment
will either be suitable or profitable for a client's investment portfolio. PVG’s Portfolio Risk Spectrum is based off a number of factors including portfolio structure, holdings,
weighting and risk measures. It is not meant to define the client’s risk profile or appetite when investing with PVG. The Portfolio Risk Spectrum may change from the current
position at any time depending on the factors stated for measurement. Historical performance results for market indices generally do not reflect the deduction of transaction
and/or custodial charges or the deduction of an investment-management fee, the incurrence of which would have the effect of decreasing historical performance results.
Economic factors, market conditions, and investment strategies will affect the performance of any portfolio and there are no assurances that it will match or outperform any
particular benchmark. Portfolios in the composite utilize levered index products. Leveraged ETFs are considered risky. The use of leverage strategies by a fund increases the
risk to the fund and magnifies gains or losses on the investment. You could incur significant losses even if the long-term performance of the underlying index showed a gain.
Most leveraged ETFs “reset” daily. Due to the effect of compounding, their performance over longer periods of time can differ significantly from the performance of their
underlying index or benchmark during the same period of time. Exchange traded funds (ETFs) are offered by prospectus only. Investors should consider a fund’s investment
objective, risks, charges, and expenses carefully before investing. The prospectus, which contains this and other important information, is available from your Financial
Advisor and should be read carefully before investing. The investment return and principal value of an investment will fluctuate, so that an investor’s shares, when redeemed,
may be worth more or less than their original cost. ETFs trade like stocks and may trade for less than their net asset value. The S&P500 Total Return Index is the total return
version of the S&P 500 Index which includes the effects of reinvested dividends. The S&P 500 Index is a capitalization-weighted index of 500 stocks designed to measure
performance of the broad domestic economy through changes in the aggregate market value of 500 stocks representing all major industries. The U.S. Aggregate Bond Index is
a broad-based benchmark that measures the investment grade, U.S. dollar-denominated, fixed-rate taxable bond market, including Treasuries, government-related and
corporate securities, MBS (agency fixed-rate and hybrid ARM passthroughs), ABS, and CMBS. The U.S. Aggregate rolls up into other Barclay’s flagship indices, such as the
multi-currency Global Aggregate Index and the U.S. Universal Index, which includes high yield and emerging markets debt. The U.S. Aggregate Index was created in 1986,
with index history backfilled to January 1, 1976.The investment strategy and types of securities held by the comparison indices may be substantially different from the
investment strategy and the types of securities held by the PVG Equity Income strategy. PVG Asset Management (“PVG”) is a registered investment advisor with the United
States Securities Exchange Commission (the “SEC”). SEC registration does not constitute an endorsement of the firm by the Commission nor does it indicate that the advisor
has attained a particular level of skill or ability. Composite performance represents the results of the PVG management team, which has changed over time due to retirements
and new staff. Additional information is available upon request.
Are Not FDIC Insured Are Not Bank Guaranteed May Lose Value
Investment Products:
20

P V G A S S E T M A N A G E M E N T
L O S S AV E R S E I N V E S T I N G
6898 S. University Blvd. Suite 100
Centennial, CO 80122
Toll Free (800) 777-0818
Fax (303) 488-9555
www.pvgassetmanagement.com