pvp2014-28139-bulging assessment of coke drums … · 1 copyright © 2014 by asme proceedings of...
TRANSCRIPT
1 Copyright © 2014 by ASME
Proceedings of the ASME 2014 Pressure Vessels & Pip ing Conference PVP2014
July 20-24, 2014, Anaheim, California, USA
PVP2014-28139
COMPARISON OF STRESS AND STRAIN ANALYSIS TECHNIQUES FOR ASSESSMENT OF BULGES IN COKE DRUMS
Mahmod Samman
Houston Engineering Solutions 15915 Katy Freeway, Suite 150
Houston, TX 77094, USA +1(832)512-0109
Ediberto B. Tinoco PETROBRAS
Research and Development Center Rio de Janeiro, Brazil
Fábio C. Marangone PETROBRAS
Research and Development Center Rio de Janeiro, Brazil
ABSTRACT A set of four operating coke drums experienced variable degrees of bulging and bulging-induced cracks. Internal laser scans were obtained for these drums to accurately define their geometry. Then, the severity of bulging was analyzed using stress and strain analysis techniques. In this paper, results of the two methods are presented and compared to failure history. INTRODUCTION Coke drums are large refinery vessels that are used to convert heavy oils or oil residues to petroleum coke and lighter hydrocarbons. The conversion process exposes these vessels to substantial cyclic thermal and mechanical loads that result in various types of in-service defects. In-service defects in coke drums are typically more severe and develop at a higher frequency than other process vessels. One of the most significant defects that frequently develop in coke drums is bulging of the cylindrical shell part of the vessel. Bulging in coke drums is radial growth that slowly develops over years of operation. Left unchecked, bulging can lead to cracks that may result in leaks and fires. Drum bulging and cracking
often cause unplanned outages, costly repairs, and pre-mature replacement. Weil and Rapasky’s classic paper (1) in 1958 reviewed various failure modes in coke drums including shell bulging. The paper described the progression of bulging in stages until reaching a “constrained balloon” shape. Since then, Carbon steel vessels that were used at that time have been mostly abandoned in favor of carbon-1/2 Molly and low Chrome alloys. While this change of material has resulted in a reduction in average bulging magnitude, the general characteristics of bulging described in 1958 remain mostly valid today. In the late 1980s and early 1990s, some operating companies instrumented coke drums with strain gages and thermocouples to better understand the cause of bulging. Results revealed that during water quenching, coke drum shells experience high plastic-regime strains for relatively short periods of time. (10) These strains appear to be caused by a combination of mechanical and thermal loads that significantly vary from cycle to cycle and from one location on the drum to another according to the random patterns of water channeling that form inside coke drums.

2 Copyright © 2014 by ASME
According to the 1996 API Survey that was published in 2003 (2), 57% reported shell bulging. Of the drums that bulged, 87% cracked. Most cracks and bulges were reportedly located in courses 3, 4, and 5 from bottom. The maximum-size bulge had an average radial size of 2.1 inches, a vertical length of 65 inches, and a circumferential length of 547 inches. The advent of internal laser scanning has made it possible to accurately measure the magnitude and monitor the growth of bulging in coke drums without interruption to service. Initially, the magnitude of radial growth was used as an indication of bulging severity. However, practitioners quickly found out that this measure did not correlate well with observed bulging-induced cracks. So, there was a need to translate laser maps into assessment of severity in order to utilize these scans in integrity management processes. The industry’s recommended practice API RP-579 of 2000 (3) and the next edition of 2007 that became an ASME standard (4) provided three-level guidance for assessment of various defects including bulges. However, shell bulges and cracks could not be readily assessed using this industry standard because of the randomness and complexity of defining the cyclic thermo-mechanical loads that the shell experiences during operations. The stress-based technique that was used in API RP-579 (3) for Level 2 assessment of bulges was found to be inaccurate and was subsequently removed from the next edition of the document (4). The reasons for these inaccuracies are discussed in a concurrent detailed study of stress fields in and around bulges (5). While the nature and cause of bulging in coke drums have been examined by many workers in the field, few studies were published on the fitness-for-service assessment of these bulges. Livingston and Saunders (6) developed probabilistic models for failure prediction in a set of drums based on their cracking frequency in 1998. Carter et al. (7) compared methods for fitness-for-service assessment of bulging and pointed out deficiencies in the Level 2 assessment method of (3) in 2004. Samman and Du Plessis (8) utilized geometric methods to identify and rank the severity of bulging patterns in coke drums in 2007. Samman et al. (9) used stress and strain analysis methods to assess bulging severity and compared findings to observed failures in a set of coke drums in 2013. With the lack of established assessment methods, in late 1990s, the use of stress concentration factors (SCFs) obtained from linear elastic finite element models under uniform nominal pressure became widely used as a
measure of bulging severity. The basis of this technique is that bulging-induced stress concentrations cause a proportional reduction in fatigue life. Typically, users of this method evaluate SCF results using thresholds of 5 or 6. Experience with this simplified stress analysis approach indicated that while some general failure locations corresponded with high SCFs, both false positives and false negatives were common. No rigorous evaluation was ever published to examine the limitations of this method. In this paper, a set of four drums with known crack history are analyzed using stress and strain analysis techniques. Results are compared and evaluated in light of known bulging-related cracks. PROBLEM DESCRIPTION The subject of this study is a set of four coke drums identical in their design, fabrication, and operation. The drums have the following characteristics:
• Inside diameter: 6.400 meters (21 ft). • Tangent-to-tangent length: 22.6 meters (74 ft) • Material: 1Cr - 1/2Mo with stainless steel clad
(SA-240 TP405). • Variable wall thickness: 12.5 to 25 mm (0.492 to
0.984 inch) with 3 mm (0.12 inch) clad.
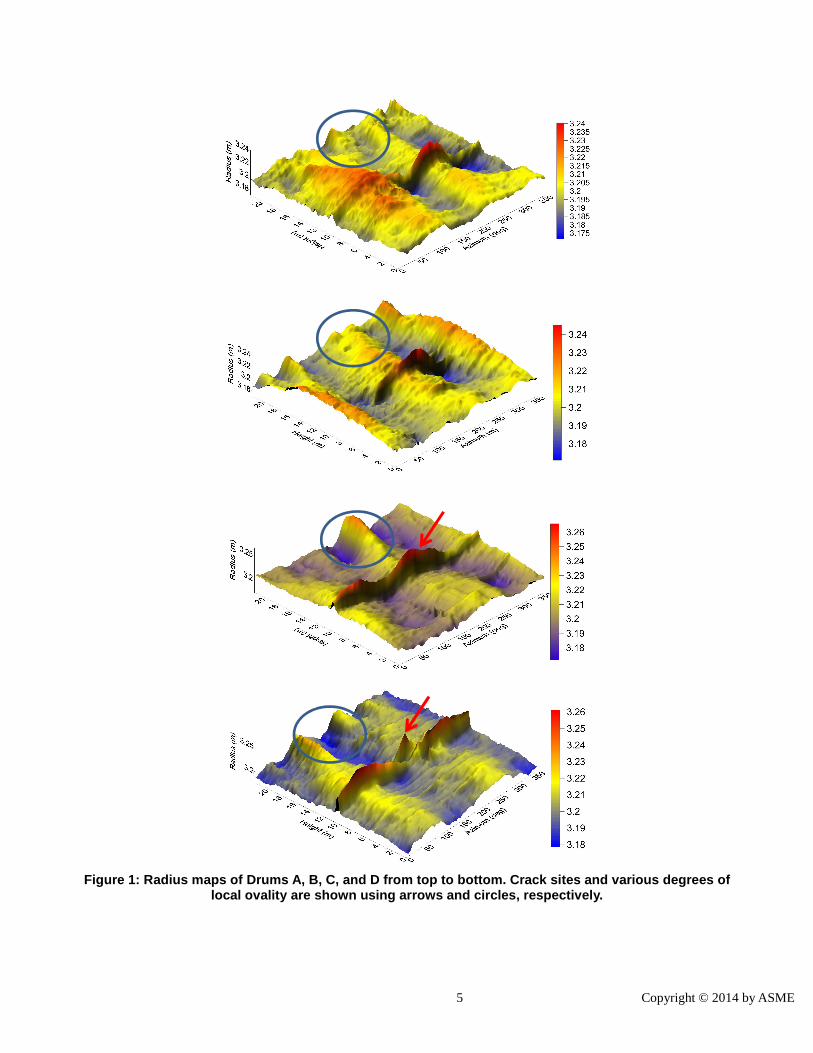
Commissioned in 1994, all four drums (A, B, C, and D) developed significant bulging mainly in the middle of the shell but only two had bulging-related cracks. The drums were laser scanned in 2011. Resulting laser scans were converted to three-dimensional surface maps that magnified the patterns of bulging. As shown in Figure 1, Drum C suffered extensive internal cracking along its circumferential bulge. Drum D had an internal crack at a relatively small localized bulge but no cracking at its main circumferential bulge. Drum A and B had no reported cracks. In addition, drums had significant global and local ovalization (out-of-roundness) that varied from one drum to another. RESULTS Bulging severity in the four drums were analyzed using two methods: Stress Analysis Stress analysis was performed using the finite element method utilizing a linear elastic material model, linear geometry, and three-dimensional shell elements. The model was loaded using a uniform unit internal pressure. Axial and circumferential (hoop) stress components on the inside and outside surfaces were normalized relative to their nominal closed-form stresses. The resulting stress concentration factors (SCF) are shown in Table 1. Positive and negative SCF values indicate tensile and
3 Copyright © 2014 by ASME
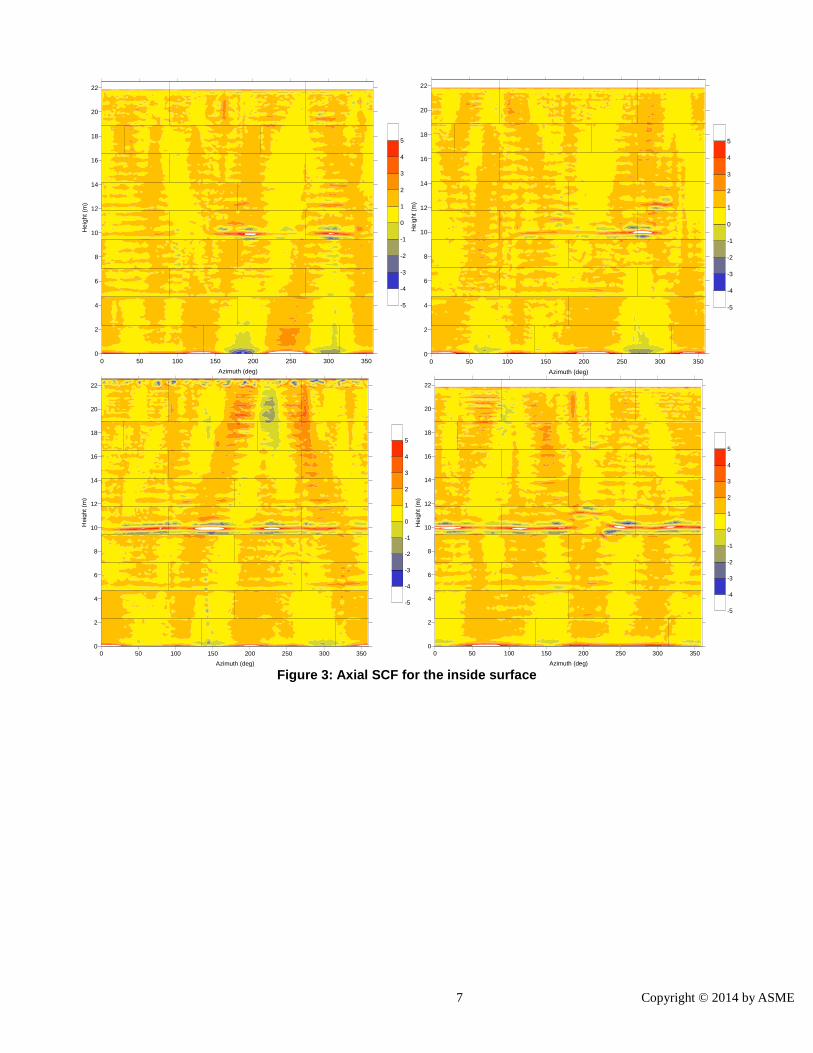
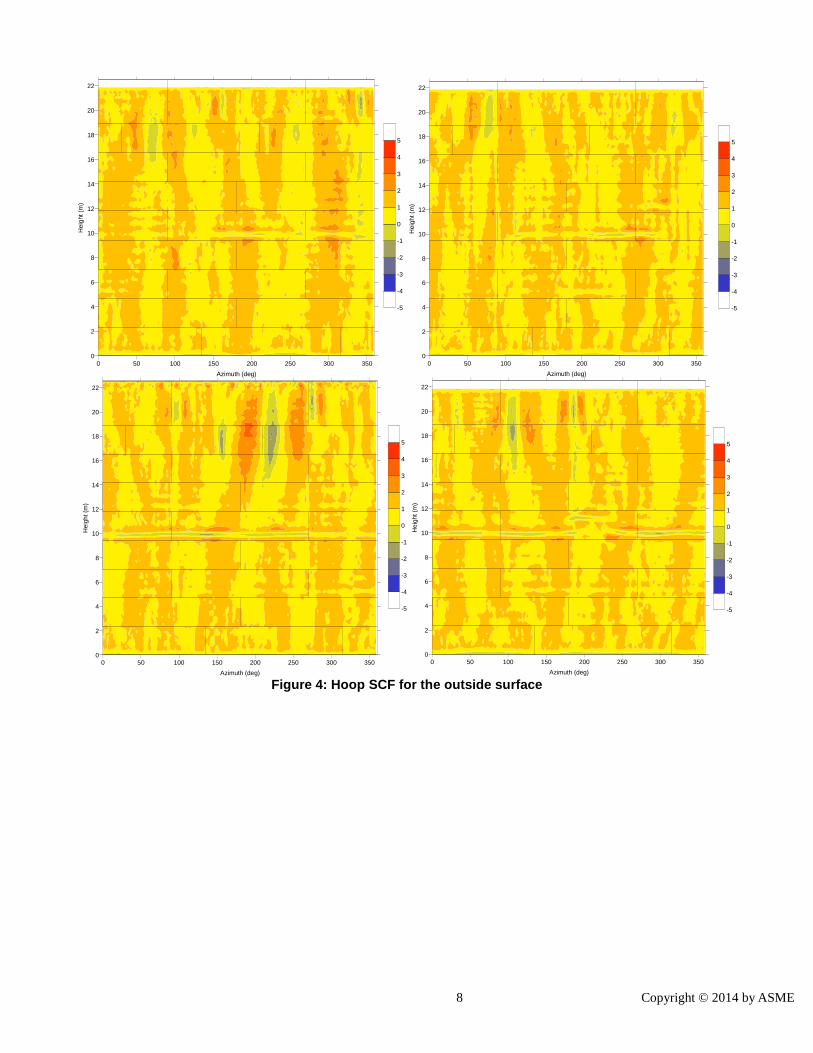
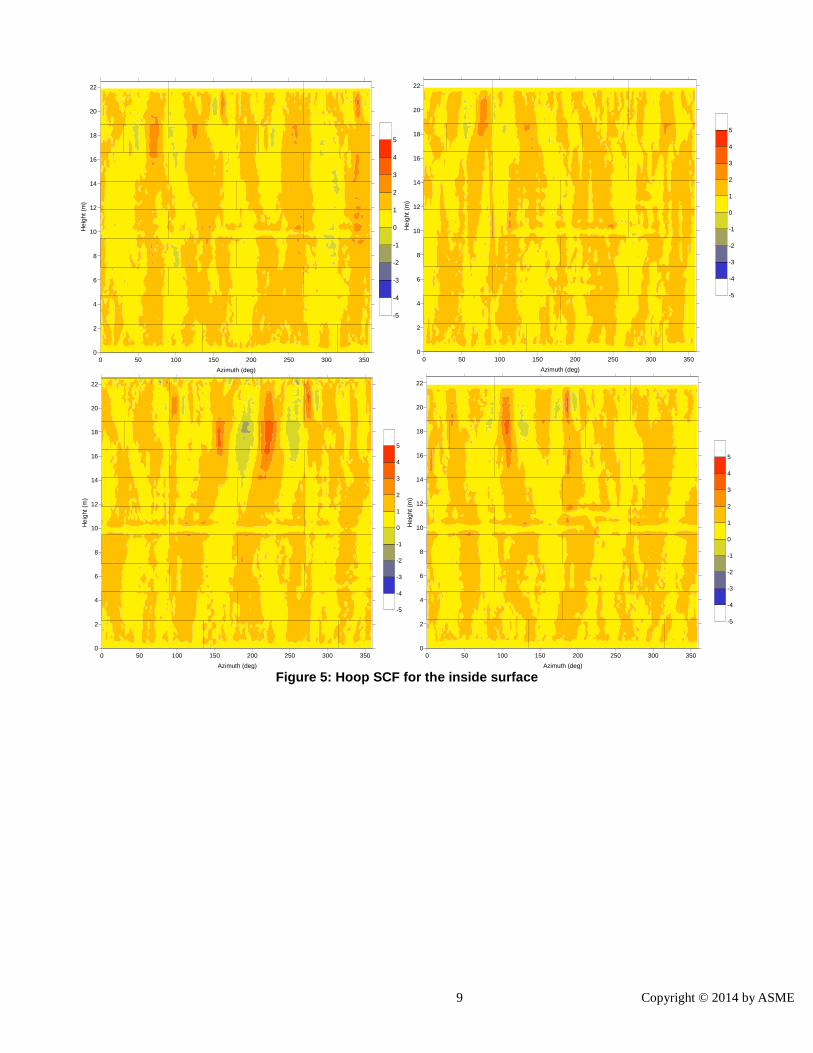
compressive stresses, respectively. The table shows that the highest SCF for all drums are axial tensile components on the inside or outside surfaces of the wall. The four SCF values are shown using two-dimensional contour maps in Figures 2 - 5. As summary tables and figures indicate:
• All drums exceeded the threshold of 5; and all exceeded the threshold of 6 except for A which was marginally below it.
• Some of the highest stress concentrations were located away from bulging and cracking at areas of local ovality (out-of-roundness).
• Some of the highest stress concentrations were located at bulge-to-shell transitions in stark contrast to all observed failures that were located at bulge peaks.
• The local bulge of Drum D that experienced the crack was missed by all four SCFs.
Strain Analysis Paragraph 8.4.4.3(d) of Part 8 of the ASME/API standard in Ref. (4) states that “For shell structures with significant localized distortion resulting from contact with another component or mechanical device, a nonlinear stress analysis to simulate the deformation process should be used to determine the magnitude of permanent plastic strain developed…. The calculated inelastic strains should be compared to the allowable strain limits in Annex B1, paragraph B1.3.” Given the randomness and complexity of thermo-mechanical loads described above and the number and interconnectedness of bulges, it is virtually impossible to simulate the deformation process for entire drums as recommended by the standard. Instead, plastic strains were calculated directly from the change in length between the original and the deformed geometry as measured by laser scans. Plastic strain, ε, at any given location was calculated from:
� =∆�
�
Where, ∆l is change of length, and l is the original un-deformed length
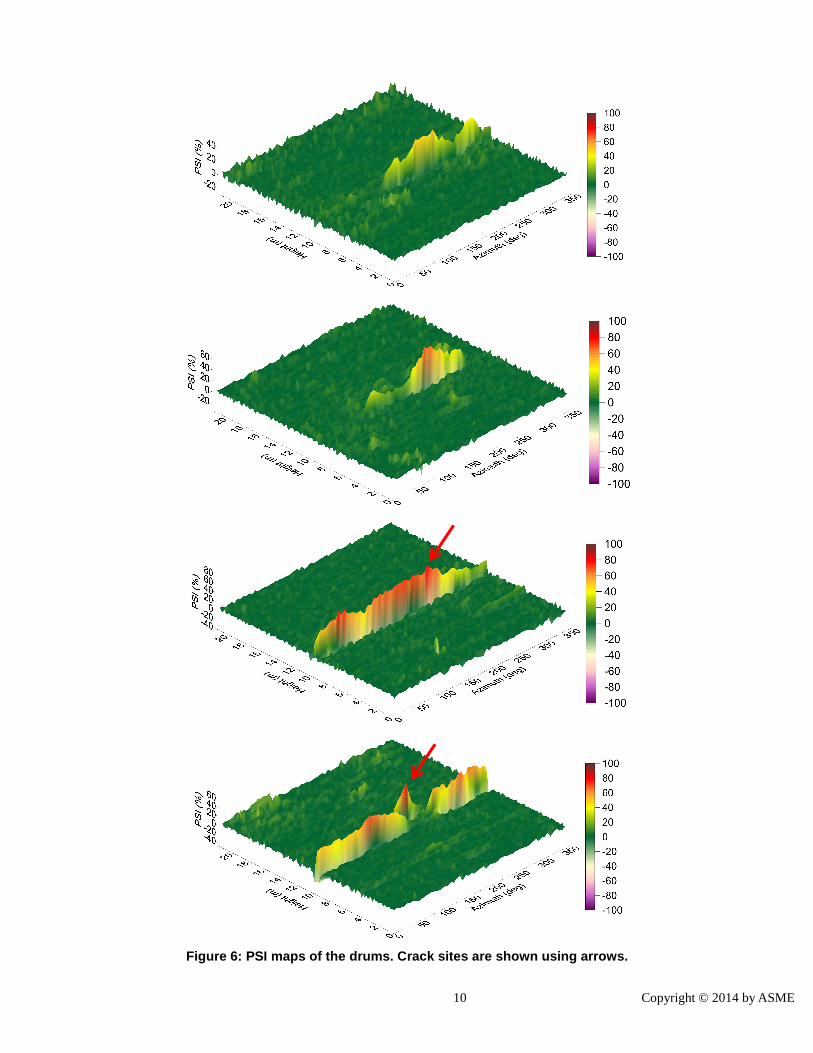
The Plastic Strain Index (PSI), a trademark of Houston Engineering Solutions, is the ratio of the plastic strain to the lower of the local failure strain limits in Refs. (3) and (4). The values of 0% and 100% refer to no strain and limit strain, respectively. For convenience, a design threshold is assumed using a margin of 2.5 at 40% of the limit. The range from 40% to 100% is further divided in three ranges at 60% and 80%. Therefore, four severity levels are defined and referred to as “Design”, “Concern”, “Danger”, and “Failure”. The likelihood of cracking was
qualitatively correlated to these levels, as shown in Table 2. Per the sign convention used in the calculations, high positive and negative PSI values indicate likely crack initiation on the inside and outside surfaces of the drum, respectively. The results of the strain analysis are shown in Figure 6 and summarized in Table 3. Drum C had the most severe bulging at 80.8% with indications matching observed failure location on the inside surface of the wall. Drum D was next at 76.1% with the maximum strain located at the localized bulge at which the crack took place. Drums B then A came next at 67% and 51.5%, respectively. Outside indications (negative values) were lower in severity for all drums than inside indications. CONCLUSION The assessment of this set of drums showed that stress and strain analysis results are different as follows: a. The localized bulge that caused cracking in Drum D
generated negligible stress concentrations but was found to have excessive strains.
b. Stress concentrations were highly sensitive to local ovality which did not correlate to any crack initiation in the drums. In contrast, strain results were little influenced by ovality.
c. Some of the highest stress concentrations in bulges were located at bulge-to-shell transitions. In contrast, all bulging-induced cracks were located at peaks.
Therefore, if stress analysis (SCF) results were used for bulging assessment of this set of drums, several false alarms would have resulted, particularly at locations of high ovality and at bulge-to-shell transitions. More importantly, a severe local bulge that developed a crack would have been missed. Strain analysis results (PSI) correlated well with observed cracking.
REFERENCES (1) N. A. Weil and F. S. Rapasky, "Experience with
Vessels of Delayed-Coking Units", Proceedings American Petroleum Institute, 1958, pp. 214-232, vol. 38 [III], American Petroleum Institute.
(2) 1996 API Coke Drum Survey (2003) American Petroleum Institute, Washington, DC.
(3) Recommended Practice 579 for Fitness-For-Service (2000) American Petroleum Institute, Washington, DC.
(4) API 579-1/ ASME FFS-1 Standard for Fitness-For-Service (2007) American Society of Mechanical Engineers, New York.
(5) Samman, M. and Samman, M. (2014) “Stress Analysis of Bulges in Cylindrical and Oval Pressure

4 Copyright © 2014 by ASME
Vessels”, Proc. of ASME 2014 Pressure Vessels & Piping Conf., PVP2014-28138, ASME.
(6) Livingston, B. and Saunders, K. L. (1998) “Coke Drum Failure Prediction Evaluation Using Probabilistic Techniques”, PVP-Vol. 376, ASME.
(7) Carter, P., Marriott, D. L., and Swindeman, M. J. (2004) “Fitness for Service Assessments of Bulging and Out-of-Round Structures”, PVP-Vol.471 PVP2004-2244, ASME.
(8) Samman, M. and Du Plessis, P. (2007) “The Bulging Intensity Factor (BIF) - A technique for assessing the bulging severity of coke drums.” Proc. 2007 NPRA
Reliability & Maintenance Conf., RMC-07-100, National Petrochemical & Refiners Association, Houston, TX.
(9) Samman, M., Tinoco, E. B., Marangone, F. C., and Silva, H. (2013) “Bulging Assessment of coke Drums”, Coking.com Meeting, Galveston.
(10) Farraro, T. and Boswell, R. S. (1996) “Determination of Coke Drum Fitness-For-Service and Remaining Life”, API Spring Meeting, Operating Practices Symposium, American Petroleum Institute, Washington, DC.
Table 1: List of Maximum Stress Concentration Facto rs (SCF)
Table 2: PSI Severity Grades
Table 3: Summary of PSI Results
Axial Stress - Inside Surface Hoop Stress - Inside SurfaceDrum Max Positive Max Negative Drum Max Positive Max Negative
A 5.7 -2.4 A 4.2 -1.0
B 6.7 -3.6 B 3.1 -0.6
C 7.8 -3.5 C 4.0 -2.1
D 6.4 -3.8 D 3.9 -0.7
Axial Stress - Outside Surface Hoop Stress - Outside SurfaceDrum Max Positive Max Negative Drum Max Positive Max Negative
A 5.0 -3.2 A 3.0 -2.2
B 5.6 -3.8 B 3.0 -1.0
C 8.8 -5.2 C 4.1 -2.1
D 5.4 -3.9 D 2.7 -1.8
PSI magnitude
Severity Grade
Likelihood of Bulging-Induced
Cracks
Recommended Frequency of Laser
Scanning 80% to 100% Failure Likely 6 months to 1 year 60% to 80% Danger Probable 1 year 40% to 60% Concern Possible 1 to 2 years
0 to 40% Design Unlikely 2 to 3 years
Drum A B C D Maximum PSI (inside surface) +51.5% +67.0% +80.8% +76.1% Minimum PSI (outside surface) -28.0% -33.2% -41.0% -47.3%
Surface of highest severity inside inside inside inside Severity level Concern Danger Failure Danger
5 Copyright © 2014 by ASME
Figure 1: Radius maps of Drums A, B, C, and D from top to bottom. Crack sites and various degrees of
local ovality are shown using arrows and circles, r espectively.

6 Copyright © 2014 by ASME
Figure 2: Axial SCF for the outside surface for Dru ms A, B, C, and D shown in the order from left to r ight and from top to bottom
7 Copyright © 2014 by ASME
Figure 3: Axial SCF for the inside surface
0 50 100 150 200 250 300 350
Azimuth (deg)
0
2
4
6
8
10
12
14
16
18
20
22H
eigh
t (m
)
-5
-4
-3
-2
-1
0
1
2
3
4
5
0 50 100 150 200 250 300 350
Azimuth (deg)
0
2
4
6
8
10
12
14
16
18
20
22
Hei
ght (
m)
-5
-4
-3
-2
-1
0
1
2
3
4
5
0 50 100 150 200 250 300 350
Azimuth (deg)
0
2
4
6
8
10
12
14
16
18
20
22
Hei
ght (
m)
-5
-4
-3
-2
-1
0
1
2
3
4
5
0 50 100 150 200 250 300 350
Azimuth (deg)
0
2
4
6
8
10
12
14
16
18
20
22
Hei
ght (
m)
-5
-4
-3
-2
-1
0
1
2
3
4
5
8 Copyright © 2014 by ASME
Figure 4: Hoop SCF for the outside surface
0 50 100 150 200 250 300 350
Azimuth (deg)
0
2
4
6
8
10
12
14
16
18
20
22H
eigh
t (m
)
-5
-4
-3
-2
-1
0
1
2
3
4
5
0 50 100 150 200 250 300 350
Azimuth (deg)
0
2
4
6
8
10
12
14
16
18
20
22
Hei
ght (
m)
-5
-4
-3
-2
-1
0
1
2
3
4
5
0 50 100 150 200 250 300 350
Azimuth (deg)
0
2
4
6
8
10
12
14
16
18
20
22
Hei
ght (
m)
-5
-4
-3
-2
-1
0
1
2
3
4
5
0 50 100 150 200 250 300 350
Azimuth (deg)
0
2
4
6
8
10
12
14
16
18
20
22
Hei
ght (
m)
-5
-4
-3
-2
-1
0
1
2
3
4
5
9 Copyright © 2014 by ASME
Figure 5: Hoop SCF for the inside surface
0 50 100 150 200 250 300 350
Azimuth (deg)
0
2
4
6
8
10
12
14
16
18
20
22H
eigh
t (m
)
-5
-4
-3
-2
-1
0
1
2
3
4
5
0 50 100 150 200 250 300 350
Azimuth (deg)
0
2
4
6
8
10
12
14
16
18
20
22
Hei
ght (
m)
-5
-4
-3
-2
-1
0
1
2
3
4
5
0 50 100 150 200 250 300 350
Azimuth (deg)
0
2
4
6
8
10
12
14
16
18
20
22
Hei
ght (
m)
-5
-4
-3
-2
-1
0
1
2
3
4
5
0 50 100 150 200 250 300 350
Azimuth (deg)
0
2
4
6
8
10
12
14
16
18
20
22
Hei
ght (
m)
-5
-4
-3
-2
-1
0
1
2
3
4
5
10 Copyright © 2014 by ASME
Figure 6: PSI maps of the drums. Crack sites are sh own using arrows.