pwc capital markets group · pdf filepwc capital markets group ... 14-jun-12 felda global...
TRANSCRIPT
PwC Capital Markets Group Bi-Monthly Equity Capital Markets Briefing The PwC Capital Markets Group gives independent guidance to companies in the process of going public and to already listed companies in assessing their position in the equity capital markets. Edition: December 2012, the year in review
Lisette Spaanbroek [email protected]
Jan-Willem de Groot
2
Summary & Dashboard
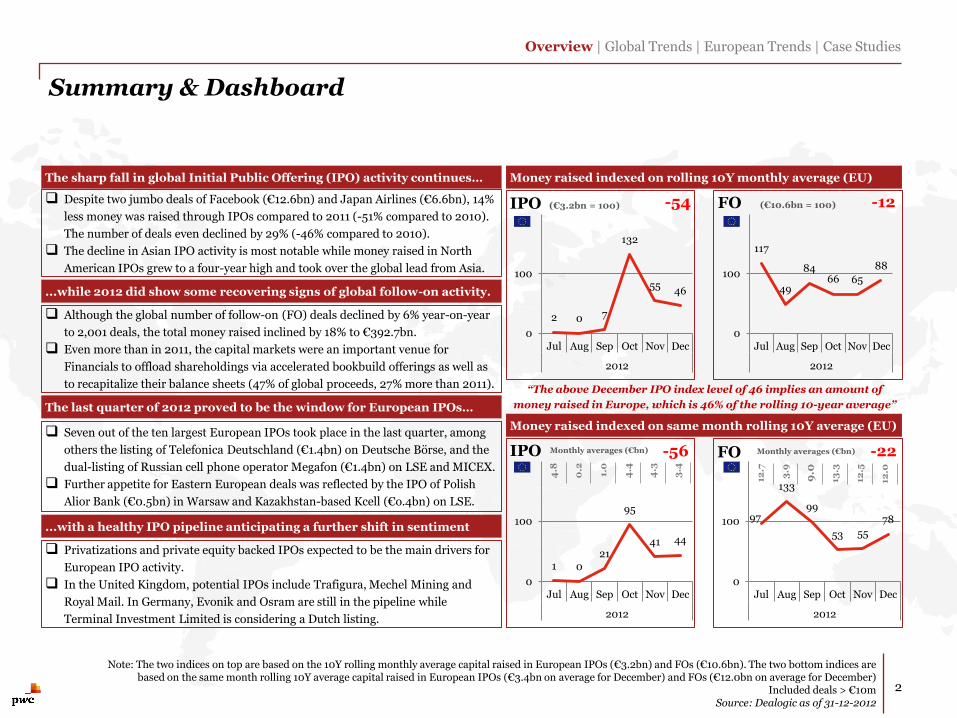
Despite two jumbo deals of Facebook (€12.6bn) and Japan Airlines (€6.6bn), 14%
less money was raised through IPOs compared to 2011 (-51% compared to 2010).
The number of deals even declined by 29% (-46% compared to 2010).
The decline in Asian IPO activity is most notable while money raised in North
American IPOs grew to a four-year high and took over the global lead from Asia.
Overview | Global Trends | European Trends | Case Studies
Note: The two indices on top are based on the 10Y rolling monthly average capital raised in European IPOs (€3.2bn) and FOs (€10.6bn). The two bottom indices are based on the same month rolling 10Y average capital raised in European IPOs (€3.4bn on average for December) and FOs (€12.0bn on average for December)
Included deals > €10m Source: Dealogic as of 31-12-2012
The sharp fall in global Initial Public Offering (IPO) activity continues…
...while 2012 did show some recovering signs of global follow-on activity.
Privatizations and private equity backed IPOs expected to be the main drivers for
European IPO activity.
In the United Kingdom, potential IPOs include Trafigura, Mechel Mining and
Royal Mail. In Germany, Evonik and Osram are still in the pipeline while
Terminal Investment Limited is considering a Dutch listing.
The last quarter of 2012 proved to be the window for European IPOs…
Although the global number of follow-on (FO) deals declined by 6% year-on-year
to 2,001 deals, the total money raised inclined by 18% to €392.7bn.
Even more than in 2011, the capital markets were an important venue for
Financials to offload shareholdings via accelerated bookbuild offerings as well as
to recapitalize their balance sheets (47% of global proceeds, 27% more than 2011).
...with a healthy IPO pipeline anticipating a further shift in sentiment
Seven out of the ten largest European IPOs took place in the last quarter, among
others the listing of Telefonica Deutschland (€1.4bn) on Deutsche Börse, and the
dual-listing of Russian cell phone operator Megafon (€1.4bn) on LSE and MICEX.
Further appetite for Eastern European deals was reflected by the IPO of Polish
Alior Bank (€0.5bn) in Warsaw and Kazakhstan-based Kcell (€o.4bn) on LSE.
1 0 21
95
41 44
0
100
Jul Aug Sep Oct Nov Dec
2012
97
133
99
53 55
78
0
100
Jul Aug Sep Oct Nov Dec
2012
2 0 7
132
55 46
0
100
Jul Aug Sep Oct Nov Dec
2012
117
49
84 66 65
88
0
100
Jul Aug Sep Oct Nov Dec
2012
Money raised indexed on rolling 10Y monthly average (EU)
Money raised indexed on same month rolling 10Y average (EU)
-56 IPO
IPO (€3.2bn = 100) FO (€10.6bn = 100)
FO
-12 -54
“The above December IPO index level of 46 implies an amount of
money raised in Europe, which is 46% of the rolling 10-year average”
Monthly averages (€bn)
12.7
3.9
9.0
13.3
12.5
12.0
-22 Monthly averages (€bn)
4.8
0.2
1.0
4.4
4.3
3.4

3
Global Capital Market Trends and Developments
In 2012, the capital markets were characterised by fewer but on average larger deals than in 2011
Top 5 Largest IPOs in 2012
Summary Statistics 2010 2011 2012 Dec-11 Dec-12
Number of IPOs 1,084 828 584 67 41
Money Raised in IPOs €221.5bn €126.0bn €107.9bn €10.9bn €7.7bn
Average Deal Size of IPOs €204.3m €152.2m €184.8m €162.6m €189m
Number of PE-backed IPOs 150 101 93 8 6
Value PE-Backed IPOs €27.3bn €27.3bn €15.2bn €1.4bn €1.4bn
Number of FOs 2,708 2,134 2,001 154 190
Money Raised in FOs €475.7bn €331.5bn €392.7bn €18.8bn €44.4bn
Average Deal Size of FOs €175.7m €155.4m €196.3m €121.9m €233.9m
Overview | Global Trends | European Trends | Case Studies
Global Summary Data Initial Public Offerings (IPOs) and Follow-ons (FOs) Highlights
The global IPO activity lost the momentum of October despite two jumbo deals of People’s Insurance Co of China (€2.7bn) and Megafon (€1.4bn).
Last month, the three largest FOs were executed by Financials. AIG, AIA, and Banco Popular spurred the global activity with deals for a combined total of €13.3bn, almost reaching the two-year peaks of September 2012 and March 2012.
Global equity indices showed a promising recovery.
1) IPOs are classified as ‘In Range’ if the IPO is priced in the middle 50% of the price range. The top and bottom 25% are classified as ‘Top of Range’ and ‘Bottom of Range’ respectively
Note: included deals > €10m Source: Dealogic, Bloomberg as of 31-12-2012
Pricing Date
Issuer Name Issuer
Country Exchange Pricing1 Money Raised
(€bn)
17-May-12 Facebook Nasdaq Top of range 12.6
10-Sep-12 Japan Airlines Tokyo Exchange Top of range 6.6
25-Sep-12 Banco Santander Mexico Mexican Exchange / NYSE In range 3.2
07-Dec-12 People's Insurance Co China HKEx Bottom of range 2.7
14-Jun-12 Felda Global Ventures Bursa Malaysia Top of range 2.6
Pricing Date
Issuer Name Issuer
Country Exchange Deal Type
Money Raised (€bn)
10-Sep-12 AIG NYSE Accelerated Bookb. 16.2
30-Jan-12 UniCredit Borsa Italiana Rights Issue 7.5
11-Dec-12 AIG NYSE Accelerated Bookb. 5.9
17-Dec-12 AIA Group HKEx Accelerated Bookb. 4.9
03-Aug-12 AIG NYSE Accelerated Bookb. 4.7
Top 5 Largest FOs in 2012
60
80
100
120
Jan-11 Jul-11 Jan-12 Jul-12
FTSE100 Hang Seng Index S&P500
Global Indices 2011-2012

IPOs and FOs in Leading Capital Market Regions
General
trends
Highlights
In North America, the U.S. Treasury Department surprised many by completely reducing its stake in AIG. In 2012, AIG executed a total of five FO transactions and raised €35.7bn. The proceeds from 2012 IPO activity increased to €49.6bn, which is the largest amount since 2009.
Although the end of 2012 showed some strong European IPO activity, the full year substantially lagged the levels of the two preceding years with 48% and 58% less money raised compared to 2011 and 2010, respectively. The high global FO activity was not very notable in Europe.
In Asia, concerns about China’s economy contributed to the significant decrease in IPO activity (-39% in money raised, -37% in deals). The FO activity compensated overall performance levels where Insurance company AIA Group executed four FO deals, worth €11.3bn in total.
In Latin America, the €3.2bn dual-listing of Banco Santander Mexico on the Mexican Exchange and NYSE was well received.
Overview | Global Trends | European Trends | Case Studies
Legend: the bars show the money raised (€bn) in IPOs and FOs ( ). The number of IPOs and FOs are shown as follows: number of IPOs / number of FOs FO IPO
North America
€23.7bn €46.4bn €38.5bn €49.6bn
€205.8bn €191.4bn
€130.6bn
€173.7bn
2009 2010 2011 2012
Europe
€5.3bn €28.4bn €23.3bn €12.0bn
€229.0bn
€99.3bn €87.7bn
€87.7bn
2009 2010 2011 2012
Asia
€46.5bn
€131.3bn
€64.6bn €39.3bn
€129.2bn
€154.1bn
€80.2bn €104.2bn
2009 2010 2011 2012
Capital raising at IPOs and FOs
4
Note: The location of the listing venue(s) denotes the region(s) of the IPO or FO Note: Several regions, such as Australasia, Middle East, Africa and Latin America are excluded from the analysis in the graphs
Note: included deals > €10m Source: Dealogic as of 31-12-2012
100/ 1,104 245/ 1,141
223/ 929
199/ 862
23/ 610
135/ 532 88/ 430 56/ 376
251/ 612
619/ 736
460/ 513 288/ 507

IPOs Worldwide: Exchange and Sector Split
Overview | Global Trends | European Trends | Case Studies
Exchange Split 2011 versus 2012 (no. of deals) Exchange Split 2011 versus 2012 (money raised)
5
Note: included deals > €10m Note: Sector classification is based on the ICB Industry Classification Benchmark
Note: LSE Group includes Borsa Italiana If IPOs or FOs take place on two or more exchanges, the full amount of money raised is attributed to all exchanges
Source: Dealogic, Bloomberg as of 31-12-2012
0% 0% 0% 0% 0% 0% 0% 0% 0%
Bursa Malaysia HKEx LSE Group Nasdaq OMX Group NYSE Euronext Shanghai Stock Exchange Shenzhen Tokyo Exchange Other
120
114
72 41
253
20%
16%
14% 10%
8%
6%
25% 27%
16%
8% 8%
7%
34%
235
92
79 63
385
2011 2011 2012 2012
Sector Split 2011 versus 2012 (no. of deals) Sector Split 2011 versus 2012 (money raised)
0% 0% 0% 0% 0% 0% 0% 0% 0% 0%
Financials Industrials Consumer Services Basic Materials Consumer Goods Oil & Gas Health Care Technology Telecommunications Utilities
2011 2011 2012 2012
22%
15%
14% 14%
12%
11%
6% 5%
1%
34%
9%
12% 4%
7%
8%
4%
15%
6% 1% 160
179
92 93
113
60
55
69 3 4
150
100
63 47
67
42
43
51 10
11
In 2012, NYSE Euronext and Nasdaq OMX were the leading exchanges in terms of IPO proceeds
Facebook drove proceeds Technology sector but Financials retained their leading position
€136.6bn €117.1bn
€126.0bn €107.9bn 828 584
600 854
0% 0% 0% 0% 0% 0% 0% 0% 0%
ASX Deutsche Börse HKEx LSE Group Nasdaq OMX Group NYSE Euronext Shanghai Stock Exchange TMX Group Other
Financials Basic Materials Oil & Gas Industrials Consumer Services Consumer Goods Utilities Health Care Technology Telecommunications
FOs Worldwide: Exchange and Sector Split
Overview | Global Trends | European Trends | Case Studies
6
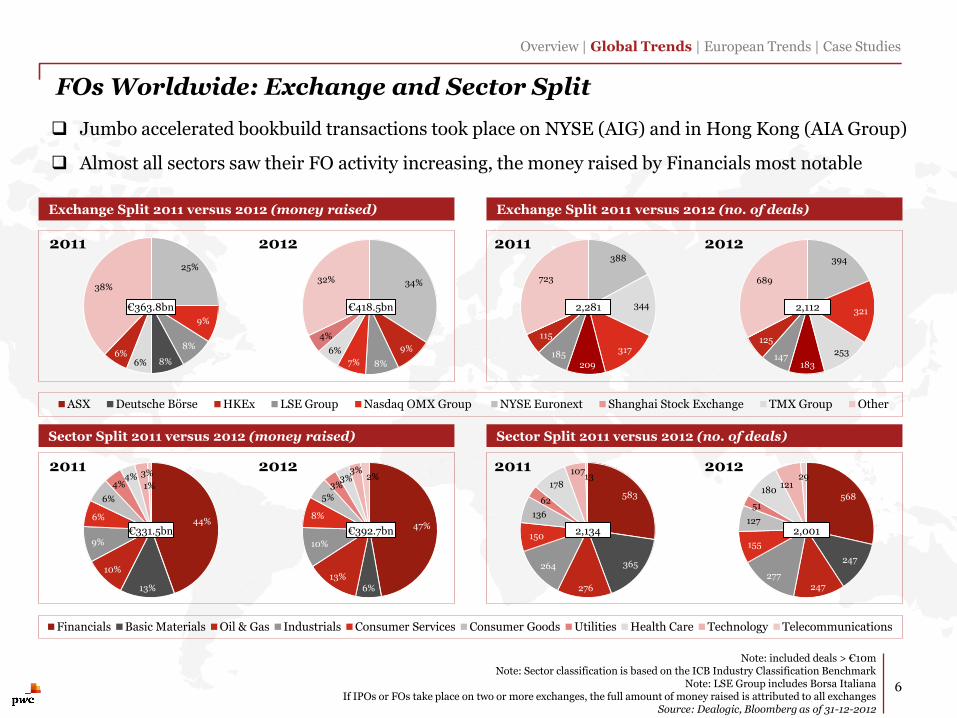
Note: included deals > €10m Note: Sector classification is based on the ICB Industry Classification Benchmark
Note: LSE Group includes Borsa Italiana If IPOs or FOs take place on two or more exchanges, the full amount of money raised is attributed to all exchanges
Source: Dealogic, Bloomberg as of 31-12-2012
Exchange Split 2011 versus 2012 (no. of deals) Exchange Split 2011 versus 2012 (money raised)
Jumbo accelerated bookbuild transactions took place on NYSE (AIG) and in Hong Kong (AIA Group)
Almost all sectors saw their FO activity increasing, the money raised by Financials most notable
2011 2011 2012 2012
34%
9%
8% 7%
6%
4%
32%
388
344
317
209 185
115
723
25%
9%
8%
8% 6% 6%
38%
394
321
253
183 147
125
689
Sector Split 2011 versus 2012 (no. of deals) Sector Split 2011 versus 2012 (money raised)
2011 2011 2012 2012
44%
13%
10%
9%
6%
6%
4% 4% 3%
1%
47%
6%
13%
10%
8%
5%
3% 3%
3% 2%
583
365
276
264
150
136
62
178
107 13
568
247
247 277
155
127
51
180 121
29
€363.8bn €418.5bn
€331.5bn €392.7bn 2,134 2,001
2,112 2,281

Pricing Date
Issuer Name Exchange Pricing1 Money Raised (€bn)
12-Jul-12 IHH Healthcare Bursa Malaysia / SGX In Range 1.7
10-Oct-12 Realogy Holding New York Top of Range 1.0
20-Mar-12 Ziggo Amsterdam Top of Range 0.9
17-Dec-12 Bharti Infratel Bombay / NSE In Range 0.6
14-Mar-12 Allison Transmission New York In Range 0.5
PE-backed IPOs
0%
5%
10%
15%
20%
25%
0
1
2
3
4
5
Jan Feb Mar Apr May Jun Jul Aug Sep Oct Nov Dec Jan Feb Mar Apr May Jun Jul Aug Sep Oct Nov Dec
2011 2012
PE
-ba
ck
ed
/ tota
l IPO
s
Mo
ne
y r
ais
ed
in
PE
-ba
ck
ed
IP
Os
(€
bn
)
Other regions Asia Europe North America Number of PE-backed IPOs of total (%)
7
Global PE-backed IPOs
Highlights
Overview | Global Trends | European Trends | Case Studies
The largest PE-backed IPO was IHH Healthcare on Bursa Malaysia and Singapore Stock Exchange (€1.7bn).
North America remains the most important listing destination for exits of private equity firms.
The Bharti Infratel IPO ended the Indian drought and became the largest Indian IPO since 2010.
The largest European PE-backed IPO was Ziggo, raising about €0.9bn.
Top PE-backed IPOs 2012
1) IPOs are classified as ‘In Range’ if the IPO is priced in the middle 50% of the price range. The top and bottom 25% are classified as ‘Top of Range’ and ‘Bottom of Range’ respectively
PE-backed IPOs include all IPOs backed by a financial sponsor Included deals > €10m
Source: Dealogic as of 31-12-2012
Feb: Kinder Morgan €2.4bn Mar: HCA Holdings €3.1bn Apr: Arcos Dorados €1.0bn
Nov: Groupon €o.6bn
Mar: Ziggo €0.9bn
Jul: IHH Healthcare €1.7
Oct: Realogy Holding €1.0

European Capital Market Developments
Overview | Global Trends | European Trends | Case Studies
The two predicted key battlegrounds of Europe; Germany and the United Kingdom, started to deliver on their expectations late in 2012 with the IPOs of Telefonica Deutschland and Talanx on Deutsche Börse, and Megafon, Direct Line Insurance, Kcell and Starwood Real Estate on LSE
At the start of 2012, UniCredit managed to raise €7.5bn in a rollercoaster rights issue in which the offering price was heavily discounted (43% from the prior day closing price)
8
1) IPOs are classified as ‘In Range’ if the IPO is priced in the middle 50% of the price range. The top and bottom 25% are classified as ‘Top of Range’ and ‘Bottom of Range’ respectively
Note: included deals > €10m Source: Dealogic, Bloomberg as of 31-12-2012
Pricing Date
Issuer Name Issuer
Country Exchange
Price Range (local currency)
Offer Price (Local currency)
Deal Type Money Raised
(€m)
30-Jan-12 UniCredit SpA Borsa Italiana 1.94 - 1.94 1.94 Rights Issue / Accelerated Bookb. 7,499
18-Sep-12 Sberbank LSE / MICEX 91.00 - 91.00 93.00 Accelerated Bookb. 3,969
30-Jul-12 Credit Suisse Group SIX Swiss Exchange 16.29 - 16.29 16.29 Cash Placing / Rights Issue 3,166
05-Dec-12 Banco Popular Espanol BME Madrid 0.40 - 0.40 0.40 Rights Issue 2,500
19-Nov-12 Turkiye Halk Bankasi Istanbul stock exchange 13.80 - 15.90 15.10 Fully Marketed 1,968
02-Jul-12 Cyprus Popular Bank Public Cyprus Stock Exchange 0.12 - 0.12 0.10 Accelerated Bookb. 1,800
06-Dec-12 EADS Euronext Paris 27.23 - 27.23 27.23 Accelerated Bookb. 1,664
25-Sep-12 Continental Deutsche Börse 81.49 - 81.49 77.50 Accelerated Bookb. 1,610
01-Aug-12 Melrose LSE 1.42 - 1.42 1.42 Rights Issue / Accelerated Bookb. 1,545
10-May-12 Reckitt Benckiser LSE 35.66 - 35.66 33.50 Accelerated Bookb. 1,500
Largest 10 European FOs 2012
Pricing Date
Issuer Name Issuer
Country Exchange
Price Range (Local currency)
Offer Price (Local currency)
Pricing1 Money Raised (€m)
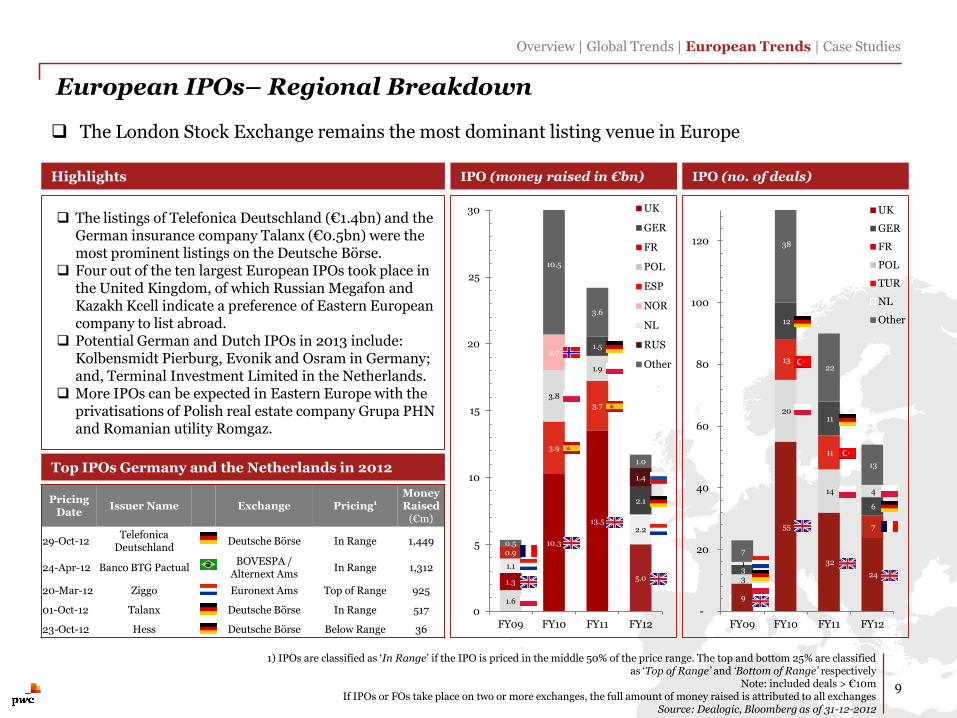
29-Oct-12 Telefonica Deutschland Holding Deutsche Börse 5.25 - 6.50 5.60 In Range 1,449
28-Nov-12 MegaFon LSE / MICEX 20.00 - 25.00 20.00 Bottom of Range 1,411
24-Apr-12 Banco BTG Pactual BOVESPA / Alternext Ams 28.75 - 33.75 31.25 In Range 1,312
11-Oct-12 Direct Line Insurance Group LSE 1.60 - 1.95 1.75 In Range 1,126
20-Mar-12 Ziggo Euronext Amsterdam 16.50 - 18.50 18.50 Top of Range 925
20-Mar-12 DKSH Holding SIX Swiss Exchange 42.00 - 48.00 48.00 Top of Range 749
01-Oct-12 Talanx Deutsche Börse 17.30 - 20.30 18.30 In Range 517
05-Dec-12 Alior Bank Warsaw Stock Exchange 71.00 - 71.00 57.00 Below Range 507
12-Dec-12 Kcell AK LSE 10.50 - 13.00 10.50 Bottom of Range 445
12-Dec-12 Starwood European Real Estate Fin. LSE 1.00 - 1.00 1.00 In Range 284
Largest 10 European IPOs 2012
Pricing Date
Issuer Name Exchange Pricing1 Money Raised
(€m)
29-Oct-12 Telefonica
Deutschland Deutsche Börse In Range 1,449
24-Apr-12 Banco BTG Pactual BOVESPA /
Alternext Ams In Range 1,312
20-Mar-12 Ziggo Euronext Ams Top of Range 925
01-Oct-12 Talanx Deutsche Börse In Range 517
23-Oct-12 Hess Deutsche Börse Below Range 36
9
55
32
24 3
20
14
7
3
13
11
6
1
12
11
4
7
38
22
13
-
20
40
60
80
100
120
FY09 FY10 FY11 FY12
1.6
10.3
13.5
5.0 1.3
3.9
3.7
2.2
1.1
3.8
1.9
2.1
0.9
2.7 1.5
1.4
0.5
10.5
3.6
1.0
0
5
10
15
20
25
30
FY09 FY10 FY11 FY12
UK
GER
FR
POL
ESP
NOR
NL
RUS
Other
European IPOs– Regional Breakdown
IPO (money raised in €bn) IPO (no. of deals)
Overview | Global Trends | European Trends | Case Studies
9
1) IPOs are classified as ‘In Range’ if the IPO is priced in the middle 50% of the price range. The top and bottom 25% are classified as ‘Top of Range’ and ‘Bottom of Range’ respectively
Note: included deals > €10m If IPOs or FOs take place on two or more exchanges, the full amount of money raised is attributed to all exchanges
Source: Dealogic, Bloomberg as of 31-12-2012
Highlights
Top IPOs Germany and the Netherlands in 2012
The listings of Telefonica Deutschland (€1.4bn) and the German insurance company Talanx (€0.5bn) were the most prominent listings on the Deutsche Börse.
Four out of the ten largest European IPOs took place in the United Kingdom, of which Russian Megafon and Kazakh Kcell indicate a preference of Eastern European company to list abroad.
Potential German and Dutch IPOs in 2013 include: Kolbensmidt Pierburg, Evonik and Osram in Germany; and, Terminal Investment Limited in the Netherlands.
More IPOs can be expected in Eastern Europe with the privatisations of Polish real estate company Grupa PHN and Romanian utility Romgaz.
UK
GER
FR
POL
TUR
NL
Other
The London Stock Exchange remains the most dominant listing venue in Europe

The largest follow-on transaction in 2012 was UniCredit (€7.5bn) in Italy followed by the accelerated bookbuild transaction of Russian Sberbank (€4.0bn) in Russia and the UK. As Sberbank already had technical listings in Frankfurt and London, the transaction is marked as an accelerated bookbuild rather than an IPO.
In addition to two large IPOs, the Deutsche Börse had three large FO deals, of which the Continental transaction (€1.6bn) was the most substantial in size.
Following the strong listing debut of Ziggo on Euronext Amsterdam in March, the private equity owners sold off two additional trances in July (€0.7bn) and October (€1.0bn).
European FOs – Regional Breakdown
Top FOs Germany and the Netherlands 2012
Overview | Global Trends | European Trends | Case Studies
10
Note: included deals > €10m If IPOs or FOs take place on two or more exchanges, the full amount of money raised is attributed to all exchanges
Source: Dealogic, Bloomberg as of 31-12-2012
Pricing Date
Issuer Name Exchange Deal Type Money Raised
(€m)
25-Sep-12 Continental Deutsche Börse Accelerated Bookb. 1,610
10-Jul-12 The Linde Group Deutsche Börse Accelerated Bookb. 1,400
11-May-12 Fresenius SE Deutsche Börse Accelerated Bookb. 1,014
25-Oct-12 Ziggo Euronext Ams Accelerated Bookb. 990
07-Sep-12 Deutsche Post Deutsche Börse Accelerated Bookb. 924
114.0
27.6 30.7
18.9
40.0
26.0 13.4
11.6
19.3
8.8
13.1
10.6
18.1
7.5
4.0
7.7
80.5
44.7
32.0
43.8
0
50
100
150
200
FY09 FY10 FY11 FY12
267
181 164
131
55
58 64
45
53
49
29
41
48
35
25
16
219
227
166
143
-
100
200
300
400
500
600
FY09 FY10 FY11 FY12
UK
GER
FR
POL
ESP
ITA
SWI
Other
UK
GER
FR
NOR
Other
European levels of FO activity stabilized compared to 2011 but lags levels of Asia and North America
FO (money raised in €bn) FO (no. of deals) Highlights

Basic Materials Financials Oil & Gas Consumer Goods Industrials Consumer Services Health Care Technology Utilities Telecommunications
IPOs in Europe: Exchange and Sector Split
Overview | Global Trends | European Trends | Case Studies
11
Note: included deals > €10m Note: Sector classification is based on the ICB Industry Classification Benchmark
If IPOs or FOs take place on two or more exchanges, the full amount of money raised is attributed to all exchanges Source: Dealogic, Bloomberg as of 31-12-2012
Exchange Split 2011 versus 2012 (no. of deals) Exchange Split 2011 versus 2012 (money raised)
LSE and the European listing venues of NYSE Euronext executed the majority of the European IPOs Five out of the ten largest European IPOs are Financials
0% 0% 0% 0% 0% 0% 0% 0% 0% 0%
BME Deutsche Börse Istanbul LSE NYSE Euronext (EU) Oslo Børs SIX Swiss Exchange Warsaw MICEX Other
24
9
6
4
4
2 7
56%
15%
8%
6%
15%
38%
19%
16%
11%
7%
9%
32
14 11
11
23
2011 2011 2012 2012
Sector Split 2011 versus 2012 (no. of deals) Sector Split 2011 versus 2012 (money raised)
2011 2011 2012 2012
40%
33%
12%
6%
5% 3% 2%
39%
9%
2%
2% 3% 4%
1%
2%
36%
8
20
11
16
14
11
5 3 3
13
3
6
4 7
7
4
4
5
€24.2bn €13.4bn
€23.3bn €12.0bn 88 56
57 91
0% 0% 0% 0% 0% 0% 0% 0% 0% 0%
Financials Industrials Consumer Goods Basic Materials Oil & Gas Consumer Services Utilities Technology Health Care Telecommunications
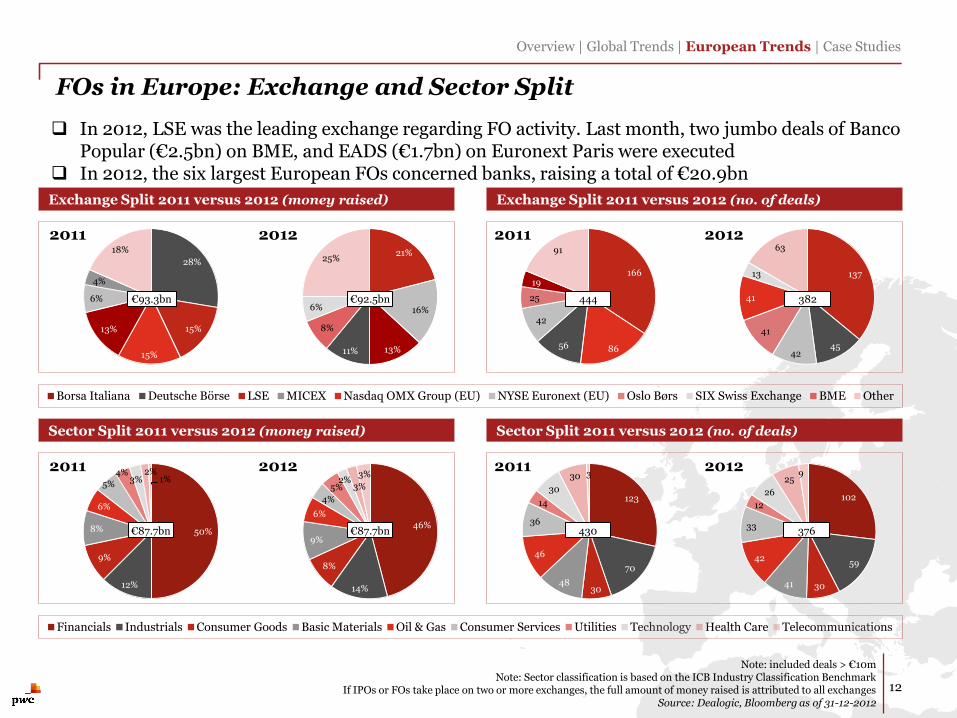
FOs in Europe: Exchange and Sector Split
Overview | Global Trends | European Trends | Case Studies
12
Note: included deals > €10m Note: Sector classification is based on the ICB Industry Classification Benchmark
If IPOs or FOs take place on two or more exchanges, the full amount of money raised is attributed to all exchanges Source: Dealogic, Bloomberg as of 31-12-2012
Exchange Split 2011 versus 2012 (no. of deals) Exchange Split 2011 versus 2012 (money raised)
In 2012, LSE was the leading exchange regarding FO activity. Last month, two jumbo deals of Banco Popular (€2.5bn) on BME, and EADS (€1.7bn) on Euronext Paris were executed
In 2012, the six largest European FOs concerned banks, raising a total of €20.9bn
0% 0% 0% 0% 0% 0% 0% 0% 0% 0%
Borsa Italiana Deutsche Börse LSE MICEX Nasdaq OMX Group (EU) NYSE Euronext (EU) Oslo Børs SIX Swiss Exchange BME Other
21%
16%
13% 11%
8%
6%
25%
2011 2011 2012 2012
28%
15%
15%
13%
6%
4%
18%
137
45 42
41
41
13
63
166
86 56
42
25
19
91
Sector Split 2011 versus 2012 (no. of deals) Sector Split 2011 versus 2012 (money raised)
2011 2011 2012 2012
50%
12%
9%
8%
6%
5%
4% 3%
2% 1%
46%
14%
8%
9%
6%
4%
5% 2%
3%
3%
123
70
30 48
46
36
14
30
30 3
102
59
30 41
42
33
12
26
25 9
€93.3bn €92.5bn
€87.7bn €87.7bn 430 376
382 444

Sep: Continental (€1.6bn) Sep: Deutsche Post (€0.9bn)
IPO proceeds
FO proceeds
250
260
270
280
290
300
310
320
330
340
350
5,000
5,500
6,000
6,500
7,000
7,500
8,000
Jan-12 Feb-12 Mar-12 Apr-12 May-12 Jun-12 Jul-12 Aug-12 Sep-12 Oct-12 Nov-12 Dec-12 Jan-13
DAX (Left axis)
AEX (Right axis)
Issuer Name €m
IPO Ziggo 925
FO Brenntag 893
FO GSW Immobilien 175
FO Sky Deutschland 156
FO Wirecard 139
FO TAG Immobilien 127
FO TUI 78
German and Dutch Capital Market Transactions in 2012
13
DAX and AEX indices compared to total money raised through IPOs and FOs in Germany and the Netherlands
12Q1
Overview | Global Trends | European Trends | Case Studies
Note: included deals > €10m. The overview contains a selection of the largest deals (IPOs and FOs) executed on German or Dutch stock exchanges
Source: Dealogic, Thomson One as of 31-12-2012
12Q2 12Q3 12Q4
Issuer Name €m
IPO BTG Pactual 1,312
FO Fresenius 1,014
FO Deutsche Wohnen 461
FO GSW Immobilien 202
FO Dockwise 197
FO Commerzbank 163
FO Grontmij 81
Issuer Name €m
FO Continental 1,610
FO The Linde Group 1,400
FO Deutsche Post 924
FO EnBW 822
FO Ziggo 743
FO Brenntag 611
FO Delta Lloyd 398
Issuer Name €m
IPO Telefonica
Deutschland 1,449
FO Ziggo 990
IPO Talanx 517
FO Suedzucker 451
FO TAG Immobilien 270
FO United Internet 190
FO Celesio 99
March: Ziggo (€0.9bn) Apr: BTG Pactual (€1.3bn)
Oct: Telefonica (€1.4bn) Oct: Talanx (€0.5bn) Oct: Hess (€35.7m)
March, April and October proven to be IPO windows in the Netherlands and Germany
Brenntag (€0.6bn) Fresenius (€1.0bn)
EnBW (€0.8bn) Brenntag (€0.6bn) Delta Lloyd (€0.4bn) The Linde (€1.4bn) Ziggo (€0.7bn)
June: Lotto24 (€15.0m) June: KTG (€20.7m)
Nov: Firstextile (€18.0m)
€4
.1b
n
€ 1
.6b
n
€ 2
.6b
n
€ 1
.4b
n
€ 0
.9b
n
€ 3
.0b
n
Oct: Ziggo (€0.7bn)
FY2012: AEX (+10%) DAX (+29%)

Fewer IPOs as Volatility Indices Increase After two volatile summers, equity capital markets regained some stability Overall, higher volatility indices could be the ‘new normal’
Overview | Global Trends | European Trends | Case Studies
14
The VStoxx Index and the VIX Index are both volatility indices The VStoxx is based on the Euro Stoxx 50 Index and the VIX Index is the Chicago Board Options Exchange Volatility Index
Note: included deals > €10m Source: Dealogic, Bloomberg as of 31-12-2012
Window closed
0
10
20
30
40
50
0
1,000
2,000
3,000
4,000
5,000
6,000
7,000
8,000
Oct-09 Dec-09 Feb-10 Apr-10 Jun-10 Aug-10 Oct-10 Dec-10 Feb-11 Apr-11 Jun-11 Aug-11 Oct-11 Dec-11 Feb-12 Apr-12 Jun-12 Aug-12 Oct-12 Dec-12
Vo
latility
Ind
ice
s
Mo
nth
ly M
on
ey
Ra
ise
d i
n
Eu
ro
pe
an
IP
Os
(€
m)
Monthly Money Raised in European IPOs (€m)
VStoxx Index
VIX Index
A correlation is observed between increased volatility indices and weak European IPO activity…
… which is also shown if we focus on the actual number of European IPOs
0
10
20
30
40
50
0
5
10
15
20
25
Oct-09 Dec-09 Feb-10 Apr-10 Jun-10 Aug-10 Oct-10 Dec-10 Feb-11 Apr-11 Jun-11 Aug-11 Oct-11 Dec-11 Feb-12 Apr-12 Jun-12 Aug-12 Oct-12 Dec-12
Vo
latility
Ind
ice
s
Mo
nth
ly n
um
be
r o
f E
ur
op
ea
n I
PO
s
Monthly Number of European IPOs
VStoxx Index
VIX Index

Case Studies
15

Case Study: MegaFon on LSE and MICEX
On 28 November the dual Initial Public Offering (IPO) of MegaFon, Russia’s second-largest cellphone operator, was priced and traded on the London Stock Exchange (LSE) and the Moscow Interbank Currency Exchange (MICEX). The IPO of MegaFon is the second largest IPO in Europe in 2012 after Telefonica Deutschland, raising over €1.4 billion. The offer price was set at $20.00, at the bottom of the $20.00 - $25.00 price range.
MegaFon issued both Global Depositary Receipts (GDRs) and ordinary shares. The GDRs are listed on LSE Main Market and the ordinary shares are listed on MICEX. A GDR represents one ordinary share of MegaFon. The total free float of MegaFon, prior exercise of the greenshoe (over-allotment option), amounted to 15.2% and AF telecom and TeliaSonera held approximately 55.8% and 29.0%. The over-allotment option of 8.5 million additional ordinary shares and GDRs has not been fully exercised, 6.9 million additional ordinary shares and GDRs have been purchased which resulted in a total free float of approximately 17%.
The offering included newly offered shares as well as selling shareholders TeliaSonera and MegaFon Investments Limited, a wholly owned subsidiary of MegaFon. MegaFon offered (including the exercised green shoe) 26.8 million newly offered shares in the IPO. Furthermore MegaFon has approved a dividend payout policy of the higher of 50% of net profit or 70% of free cash flow.
MegaFon was forced to postpone its investor road show in October due to a delay in the listing approval by the British authorities. Moreover, investment bank Goldman Sachs withdrew from the offering during the IPO process.
Transaction Highlights
Summary statistics
m
5m
10m
15m
20m
25m
30m
35m
40m
45m
50m
0
5
10
15
20
25
30
Pricing date 11-Dec-12 27-Dec-12
Tra
din
g v
olu
me
s
Sto
ck
Pri
ce
($
)
Trading volume Stock price
16
1) The total money raised and total shares offered include the exercised green shoe 2) Selling shareholder is Sonera Holding, a subsidiary of TeliaSonera
Source: Dealogic, Bloomberg as of 3 January, 2013
Trading on LSE
0.00m
0.02m
0.04m
0.06m
0.08m
0.10m
0.12m
0
100
200
300
400
500
600
700
800
Pricing date 11-Dec-12 25-Dec-12
Tra
din
g v
olu
me
s S
toc
k P
ric
e (
RU
B)
Trading volume Stock price
Listing place LSE Main Market
MICEX Moscow
Pricing date 28 November 2012
Country (of incorp.) Russia
Total shares offered¹ 91.5m
Total money raised¹ €1.4bn
Market cap at IPO $1.1bn
Price Range $20.00 – 25.00 (LSE)
IPO price $20.00 (LSE)
RUB 620 (MICEX)
Opening price $20.00 (+0.0%)
RUB 650 (+4.8%)
On the first trading day, 6,290 stocks were traded, thereafter trading volume reached a peak of 114,060. However, most trading is on LSE.
Stock prices decreased to $19.60 (-2.0%) on the first day. After an increase in the following weeks, the performance as of 31 December 2012 is at 19%.
Trading on MICEX
Disclaimer
© 2012 PricewaterhouseCoopers Accountants N.V. (34180285) (hereinafter referred to as 'PwC'). All rights reserved. Not for further distribution without the permission of PwC. “PwC” refers to the network of member firms of PricewaterhouseCoopers International Limited (PwCIL), or, as the context requires, individual member firms of the PwC network. Each member firm is a separate legal entity and does not act as agent of PwCIL or any other member firm. PwCIL does not provide any services to clients. PwCIL is not responsible or liable for the acts or omissions of any of its member firms nor can it control the exercise of their professional judgment or bind them in any way. No member firm is responsible or liable for the acts or omissions of any other member firm nor can it control the exercise of another member firm’s professional judgment or bind another member firm or PwCIL in any way.
PricewaterhouseCoopers Accountants N.V. is the author of this publication and has got the copyrights. Without written permission of PwC this publication may not be duplicated, copied, distributed or published. This publication has been prepared for information purposes and general guidance on matters of interest only, and does not constitute, or may not be interpreted as, professional advice or as a sale, buying or trading advice. You should not act upon the information contained in this publication without obtaining specific professional advice. No representation or warranty (express or implied) is given as to the accuracy or completeness of the information contained in this publication, and, to the extent permitted by law, PwC does not accept or assume any liability, responsibility or duty of care for any consequences of you or anyone else acting, or refraining to act, in reliance on the information contained in this publication or for any decision based on it.