pxgz6102 basic statistics for research in education chap 3 - measures of variability – standard...
TRANSCRIPT

PXGZ6102 BASIC STATISTICS FOR RESEARCH IN EDUCATION
Chap 3 - Measures of Variability –
Standard Deviation, Variance
Measures of Variability
Range Mean Deviation Variance Standard Deviation
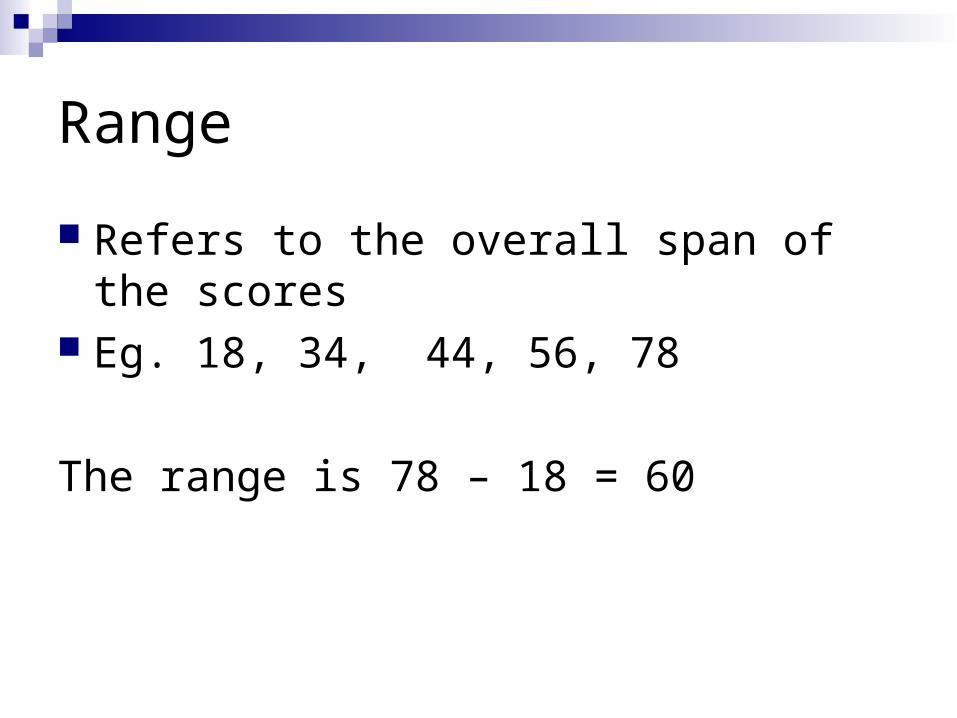
Range
Refers to the overall span of the scores Eg. 18, 34, 44, 56, 78
The range is 78 – 18 = 60
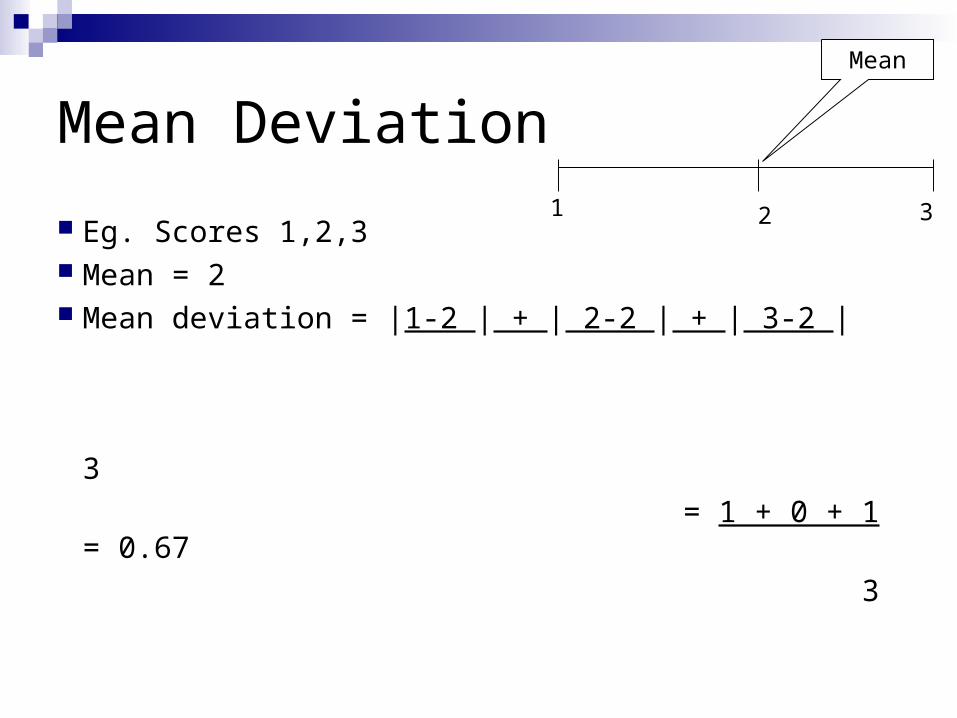
Mean Deviation
Eg. Scores 1,2,3 Mean = 2 Mean deviation = |1-2 | + | 2-2 | + | 3-2 |
3
= 1 + 0 + 1 = 0.67
3
1 2 3
Mean

Mean Deviation
Eg. Shoes sizes in Ali’s home: 11,12,13,14,15,16,17 the mean is 14
In Ahmad’s home: 5,8,11,14,17,20, 23 the mean is also 14
But the distribution in Ahmad’s home is greater

Calculation of Mean Deviation
Ali’sScores Mean (x - mean) |x – mean|11 14 -3 312 14 -2 213 14 -1 114 14 0 015 14 1 116 14 2 217 14 3 3
N = 7 |x – Mean| =12
Σ |x – Mean| 12Mean Deviation = ---------------------- = ------- = 1.71 n 7
Calculate the Mean Deviation of Ahmad’s data 5,8,11,14,17,20, 23
Variance
Variance of a distribution is the average of the squared deviations
The formula for the variance of a population is slightly different than the formula for a sample variance
Population & Sample Variance
1
)( 22
n
xxs
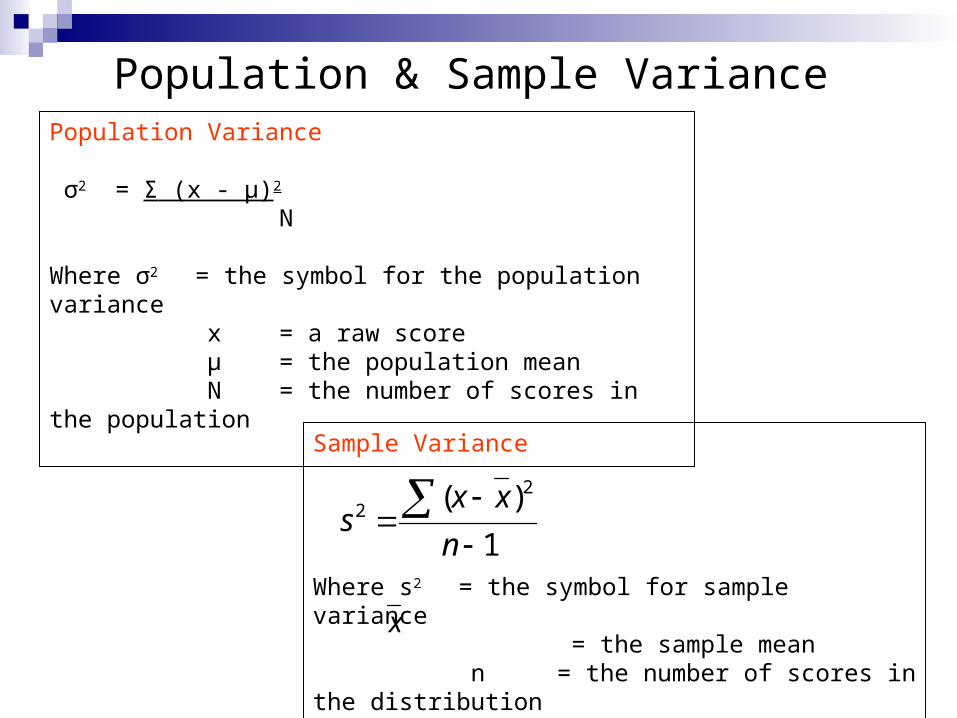
Population Variance
σ2 = Σ (x - µ)2
N
Where σ2 = the symbol for the population variance x = a raw score µ = the population mean N = the number of scores in the population
Sample Variance
Where s2 = the symbol for sample variance = the sample mean n = the number of scores in the distribution
x

Why divide by (n-1) for the sample variance to estimate the population variance?
Variances of samples taken from population tend to be smaller than the population variance. Dividing the sample formula with n-1 gives the correction and the actual population variance

Population Variability
Population Distribution
Sample Scores
x xSample A
Sample BSample C
Sample scores are not as spread out as the population distribution. Thus the variance of sample tend to underestimate the variance of population. Placing n -1 in the denominator increases the value of the sample variance and provides a better estimate of the population variance
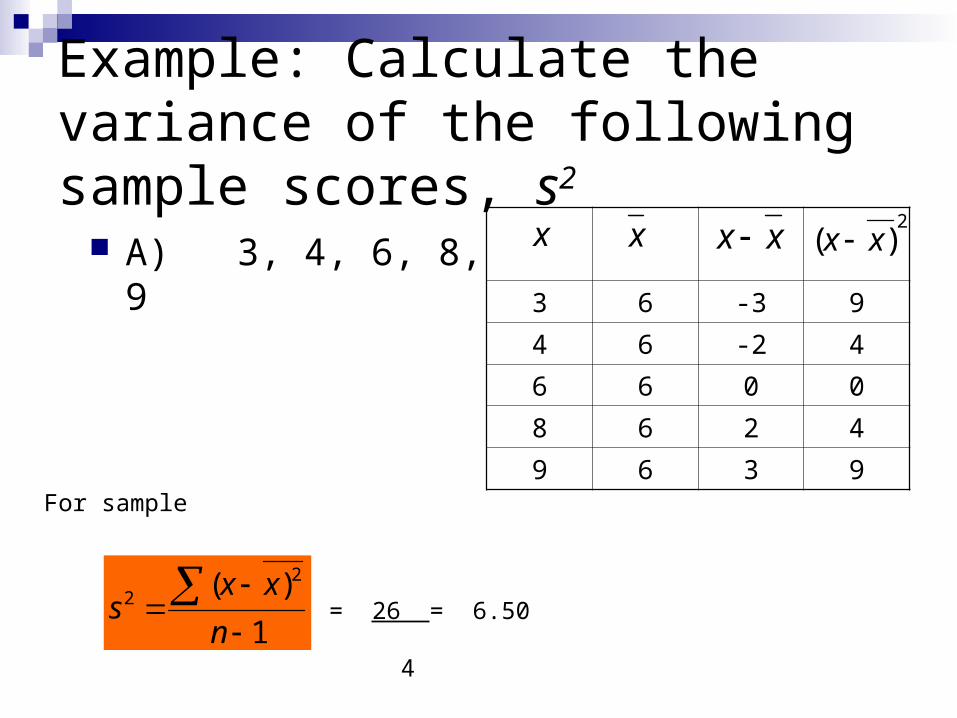
Example: Calculate the variance of the following sample scores, s2
A) 3, 4, 6, 8, 9
3 6 -3 9
4 6 -2 4
6 6 0 0
8 6 2 4
9 6 3 9
= 26 = 6.50
41
)( 22
n
xxs
x xx 2)( xx x
For sample

Example: Calculate the variance of the following population scores, A) 3, 4, 6, 8, 9 X Xm X - Xm (X – Xm)2
3 6 -3 9
4 6 -2 4
6 6 0 0
8 6 2 4
9 6 3 9
= 26 = 5. 2
5
N
x
22 )(
2
For Population
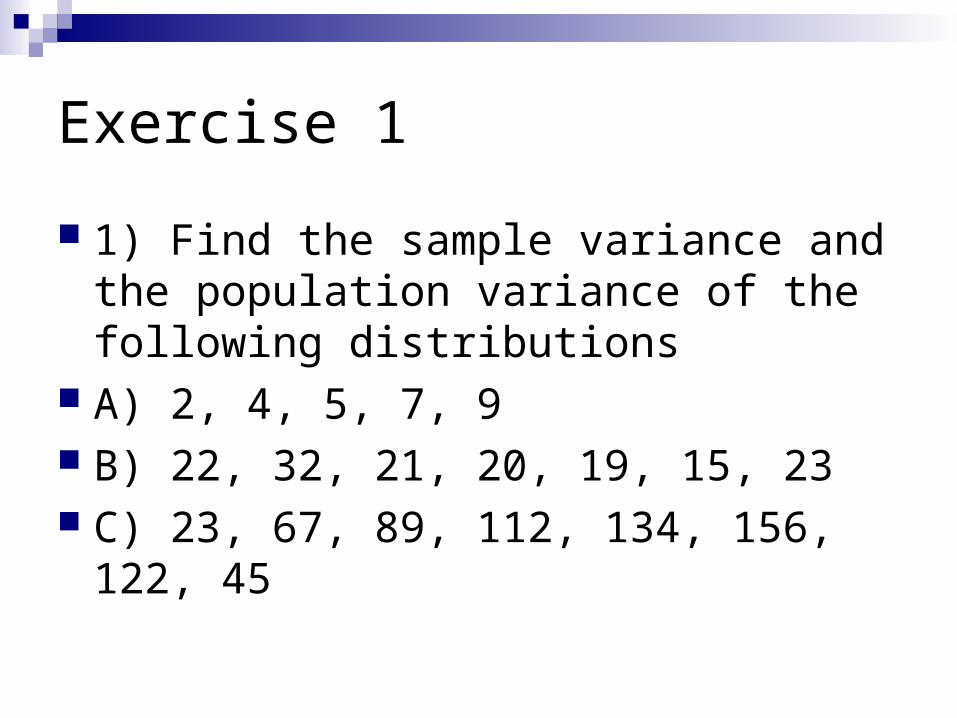
Exercise 1
1) Find the sample variance and the population variance of the following distributions
A) 2, 4, 5, 7, 9 B) 22, 32, 21, 20, 19, 15, 23 C) 23, 67, 89, 112, 134, 156, 122, 45
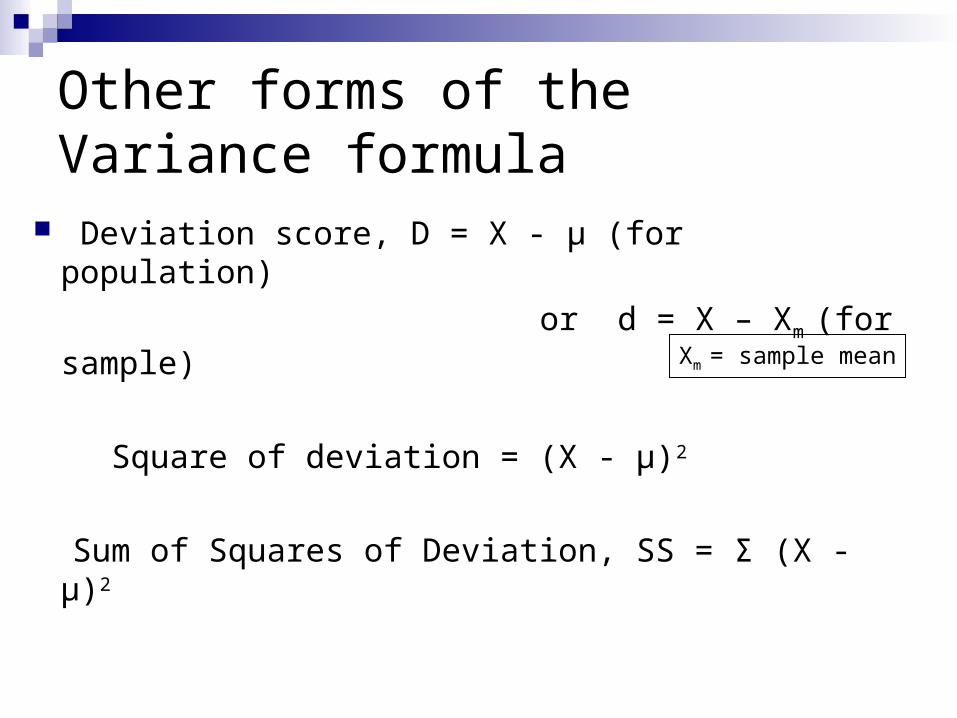
Other forms of the Variance formula
Deviation score, D = X - µ (for population)
or d = X – Xm (for sample)
Square of deviation = (X - µ)2
Sum of Squares of Deviation, SS = Σ (X - µ)2
Xm = sample mean
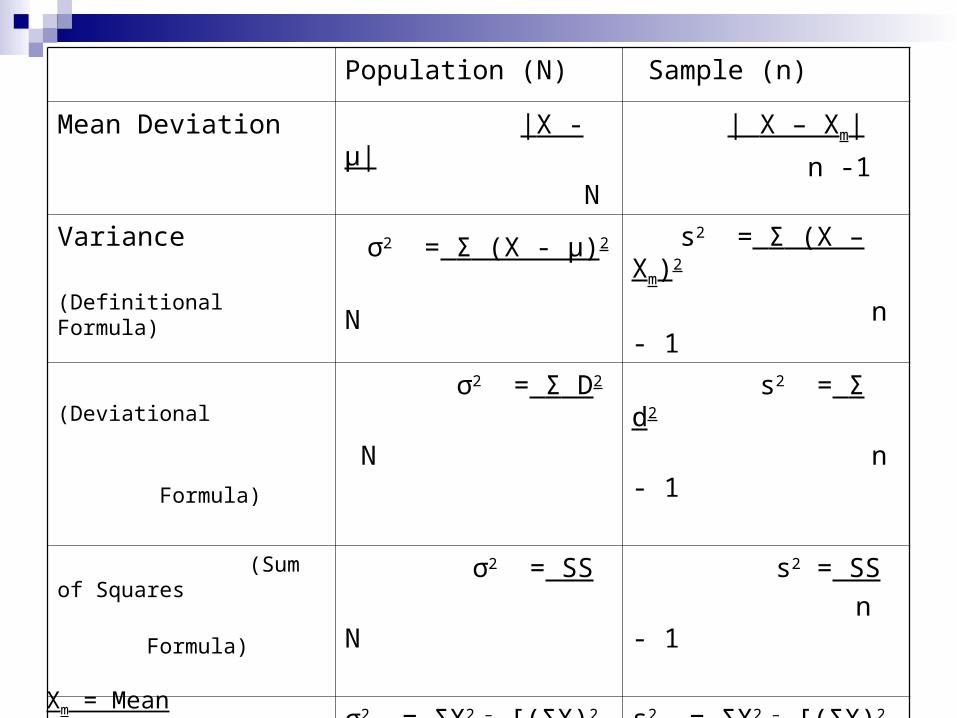
Population (N) Sample (n)
Mean Deviation |X - µ|
N
| X – Xm|
n -1
Variance
(Definitional Formula) σ2 = Σ (X - µ)2
N
s2 = Σ (X – Xm)2
n - 1
(Deviational
Formula)
σ2 = Σ D2
N
s2 = Σ d2
n - 1
(Sum of Squares
Formula) σ2 = SS
N
s2 = SS
n - 1
(Computational
Formula)σ2 = ΣX2 – [(ΣX)2 /N]
N
s2 = ΣX2 – [(ΣX)2 /n]
n -1
Xm = Mean
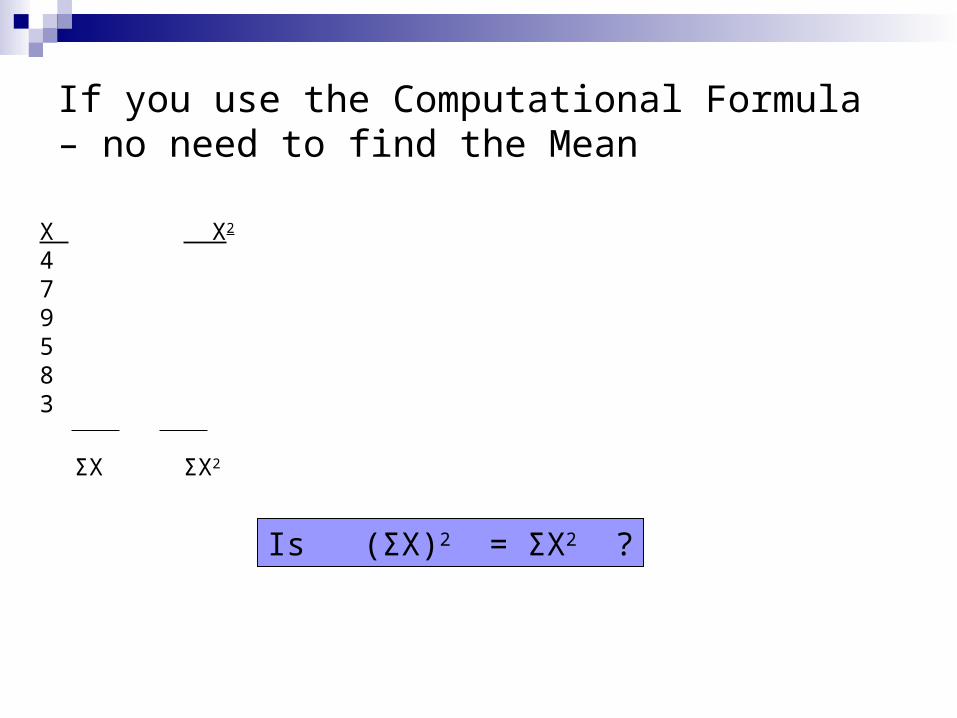
If you use the Computational Formula – no need to find the Mean
X X2 479583
ΣX2ΣX
Is (ΣX)2 = ΣX2 ?
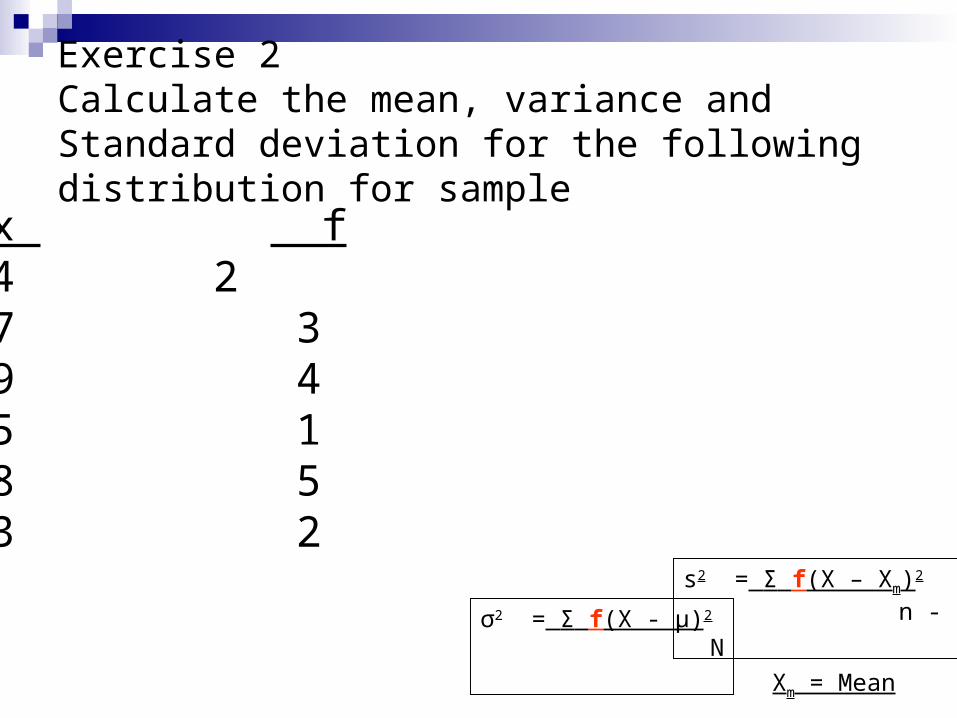
Exercise 2Calculate the mean, variance and Standard deviation for the following distribution for sample
x f 4 27 39 45 18 53 2
σ2 = Σ f(X - µ)2
N
s2 = Σ f(X – Xm)2
n - 1
Xm = Mean
Standard Deviation
Is the square root of the variance Is the square root of the deviational
formula, sum of squares formula and computational formula of variance
Example: What is the Standard Deviation of the distributions in Exercise 1?


Exercise 3
Find the Standard Deviation of the following sample distributions
A) 3, 4, 5, 7, 8, 9 B) 12, 23, 34, 56, 13, 24

Exercise 4
What are the Standard Deviations of the distributions in Exercise 2 were those of the population?
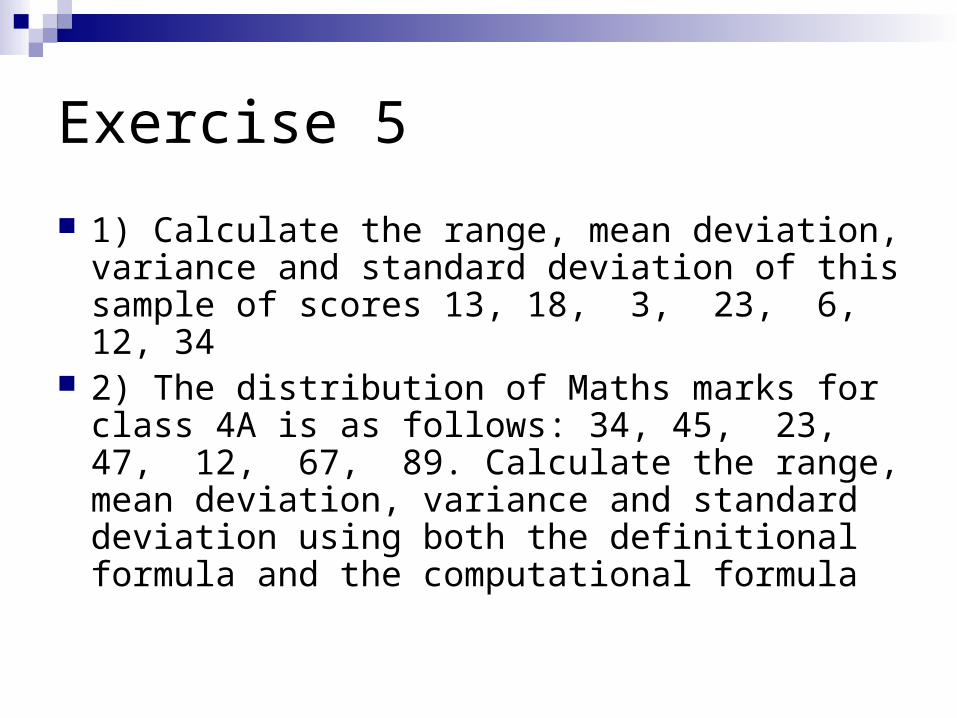
Exercise 5
1) Calculate the range, mean deviation, variance and standard deviation of this sample of scores 13, 18, 3, 23, 6, 12, 34
2) The distribution of Maths marks for class 4A is as follows: 34, 45, 23, 47, 12, 67, 89. Calculate the range, mean deviation, variance and standard deviation using both the definitional formula and the computational formula

Standard Deviation for Grouped Data – Example for Population
Class Interval f Midpoint fmd Deviation fD D2 fD2
(md) D = md - Xm
60 – 64 1 62 62 - 9 - 9 81 81 65 – 69 2 67 134 - 4 - 8 16 32
70 – 74 5 72 360 1 5 1 5
75 - 79 2 77 154 6 12 36 72
σ = ΣfD2 – ΣfD 2
N N
N = 10 Xm = 710 = 71
10
Σ fD = 0 Σ fD2 = 190
σ = 190 - 0 2 10 10
= √19 = 4.36
Xm = Grouped mean
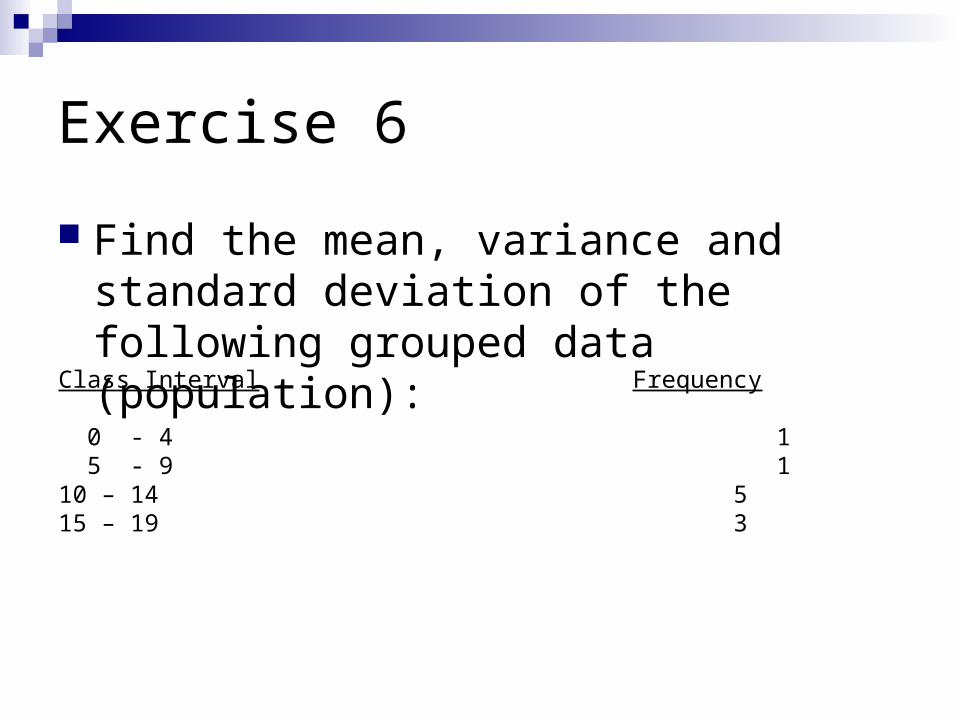
Exercise 6
Find the mean, variance and standard deviation of the following grouped data (population):
Class Interval Frequency
0 - 4 1 5 - 9 110 – 14 515 – 19 3
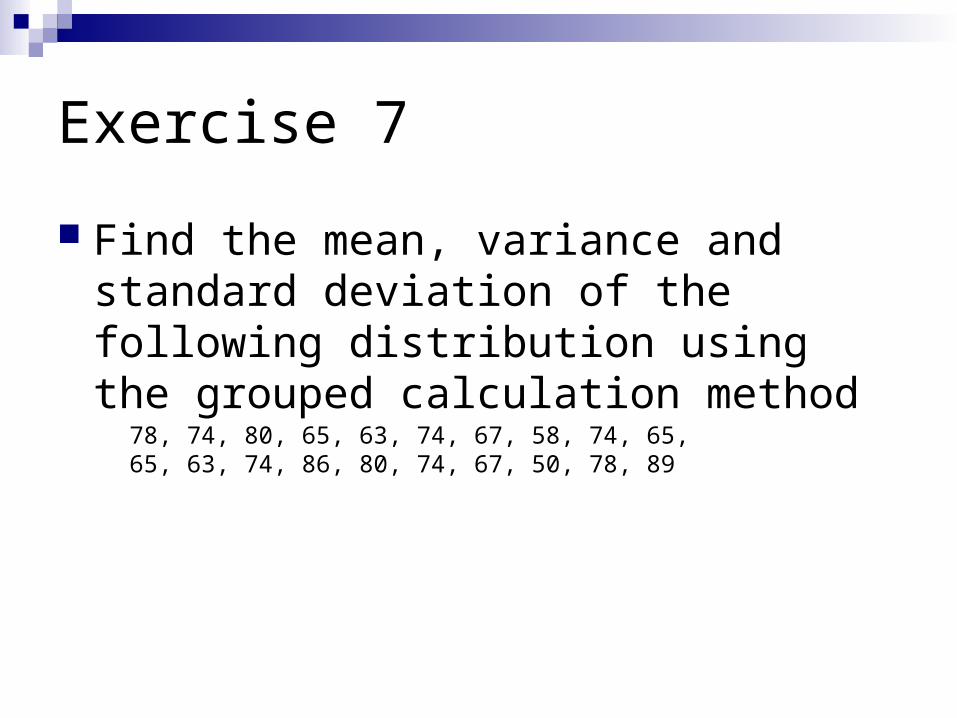
Exercise 7
Find the mean, variance and standard deviation of the following distribution using the grouped calculation method
78, 74, 80, 65, 63, 74, 67, 58, 74, 65, 65, 63, 74, 86, 80, 74, 67, 50, 78, 89
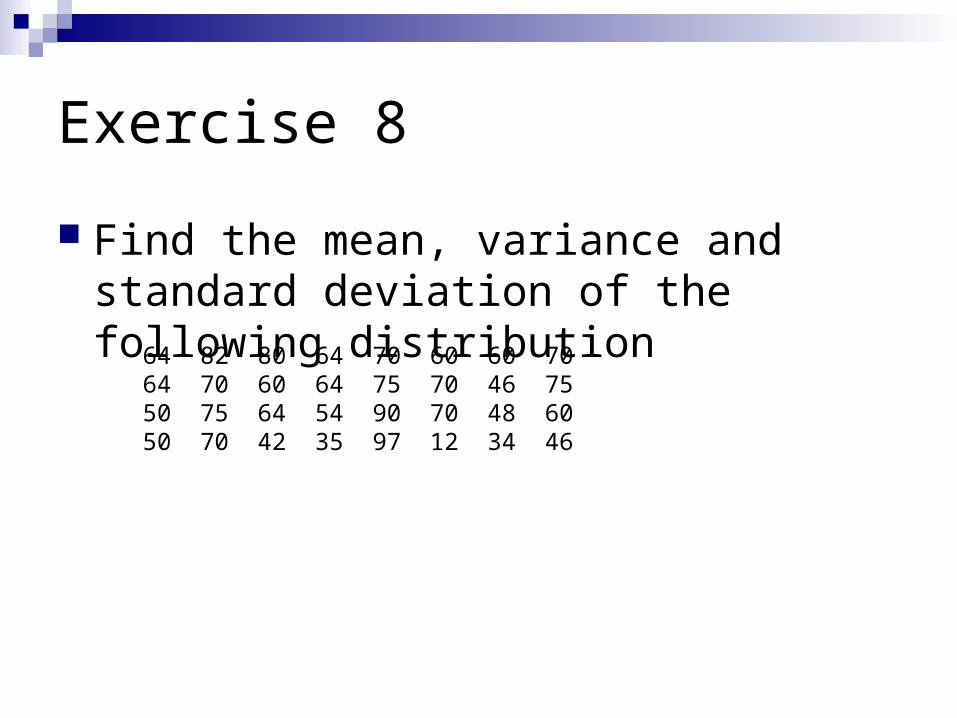
Exercise 8
Find the mean, variance and standard deviation of the following distribution
64 82 80 64 70 60 60 7064 70 60 64 75 70 46 7550 75 64 54 90 70 48 6050 70 42 35 97 12 34 46
To display variability – Box-and-whisker plot (refer to Chapter 1)
End of Chapter 3 – Measures of Variability