pyrolysis and toc identification of tight oil sweet … 1 pyrolysis and toc identification of tight...
TRANSCRIPT

11/6/2013
1
Pyrolysis and TOC Identification of Tight Oil SweetSpots
Albert Maende* and W. David Weldon, Wildcat Technologies,LLC, Humble, TX, United States.
TALK OUTLINE
• Bakken Formation area of study
• Type of data, analytical method and interpretation framework
• Previous work
• Results
• Identification of Sweet Spots
• Conclusions

11/6/2013
2
Bakken Formation Area of Study
Bakken Formation Members• Lower Bakken Shale; deep marine organic rich
• Middle Bakken Member; epicontinental calcareous, dolomitic – siliciclasticthat is variously mottled, bioturbated and laminated
• Upper Bakken Shale; deep marine organic rich
Drilled Wells & Area of Study• 8 wells that were drilled through the Mississippian – Devonian (Paleozoic)
Bakken Formation within Williston Basin in North Dakota; originated ascontinental shelf but became intracratonic and has structures that reflecttrends of the Rocky Mountain province (Gerhard et. al., 1982)
Area of Study
Location of 8 wells analyzed from North Dakota, Williston Basin
WellNGS #
8474 2618 607 1405
WellName
GrahamUSA #1-15
JacobHuber#1
AngusKennedy#F32-24D
CarolineE. Peck#2
WellNGS #
11617 8177 5088 16637
WellName
Hagen#1-13
Dobrinski#18-44
Texel #1-15
Long #1-01H
11/6/2013
3
Type, Source of Data and Analytical Method
Type of Data• Pyrolysis, TOC and Carbonate Carbon
Source of Data• Pyrolysis and TOC data published by North Dakota Geological Survey
• HAWKTM Pyrolysis, TOC and Carbonate Carbon (CC) measurementsAnalytical Method• Dried drill cuttings ground using a mortar and pestle• Weighed to about 100 mg on a 4 decimal place balance• Analyzed for their S1, S2, S3, Tmax, TOC and CC measurements on the
HAWKTM Pyrolysis and TOC instrument
Analyzed Parameters
Pyrolysis, TOC and Carbonate Carbon Parameters
• S1 – free oil (mg hydrocarbons/g rock)
• S2 – kerogen yield (mg hydrocarbons/g rock)
• S3 – pyrolyzed CO2 (mg CO2/g rock)
• Tmax - Temperature (°C) at maximum generation of hydrocarbons frompyrolysis
• Carbonate Carbon (inorganic carbon) – wt. %
• Total Organic Carbon (TOC) – wt. %

11/6/2013
4
Pyrolysis Indices
Interpreted Pyrolysis Indices
• Hydrogen Index; S2/TOC x 100 (mg HC/g TOC)
• Oxygen Index; S3/TOC x 100 (mg CO2/g TOC)
• Oil Saturation Index (OSI); S1/TOC x 100
• Vitrinite Reflectance equivalent (Roe); Roe = 0.018 x Tmax – 7.16 (Jarvie, 2012)
Interpretation Framework
• Compilation of pyrolysis, TOC and CC data plus indices in graphical plots
• Evaluation in a lithofacies framework
Previous Work
Lithofacies of the Middle Bakken Member
(LeFever, 2009)
(Hess, 2011)
Wireline logs from 2 Bakken Formation Fields
Mid
dle
Bak
ken
Me
mb
er
Upper Bakken Shale
Lithofacies 5 - Siltstone
Lithofacies 4 - ParallelInterbeds of Dark Grey Shaleand Buff Silty Sandstone
Lithofacies 3 - Sandstone
Lithofacies 2 - ParallelInterbeds of Dark Grey Shaleand Buff Silty Sandstone
Lower Bakken Shale
Lithofacies 1 - Siltstone

11/6/2013
5
Previous Work
Isopach Map of the Middle Bakken Member Isopach Map of the Lower Bakken Shale
Mountrail maxthickness ~ 60 ft.
Mountrail maxthickness > 50 ft.
(LeFever, 2009)
CountyM – MountrailW – WilliamsMc - Mckenzie
MW
Mc
M
Mc
W
Previous Work
Hydrogen Index Map of the Bakken Formation
API Gravity of Bakken Formation Oils
(Kuhn et. al., 2009)Thickest Middle Bakken

11/6/2013
6
Results
Bakken Formation Tops in the Analyzed Wells
Texel #21-35
Dobrinski#18-44
Hagen #1-13
CatherineE. Peck #2
AngusKennedy#F32-24D
JacobHuber #1
GrahamUSA #1-15
Long #1-01H
UpperBakken(ft.)
10160.00–10172.00
8629.00 –8638.50
10508.67–10521.67
10369 –10372
MiddleBakken(ft.)
10169.00 –
10247.00
8638.58–
8661.50
10363.60 –
10375.00
10770.75 –
10793.92
10522.0 –
10573.83
9801 –
9825.58
10374 –
10378
9138 –
9171.5
LowerBakken(ft.)
10248.00 –
10263.00
8661.90 –
8668.00 ft.
10376.00 –
10406.00.
10794.58 -
10815.83
10574.00 –
10599.83
9826.08 –
9836.75
10379
Results
Graham USA #1-15 Well
MiddleBakkenMember
UpperBakkenShale
0.00 1.00 2.00 0 200 400 600

11/6/2013
7
Results
Jacob Huber #1 Well
0 20 40 60 80 100 0 200 400 600 800
MiddleBakken
LowerBakken
Results
Angus Kennedy #F32-24-P Well
0 200 400 600 8000 20 40 60 80
Upper Bakken
Middle Bakken
Lower Bakken

11/6/2013
8
Results
Catherine E. Peck #2 Well
0 10 20 30 0 100 200 300 400 500
Middle Bakken
Lower Bakken
Results
Hagen #1-13 Well
0 5 10 15 20 0 200 400 600
Middle Bakken
Lower Bakken

11/6/2013
9
Results
Dobrinski #18-44 Well
0 50 100 150 0 500 1000 1500
Upper Bakken
Middle Bakken
Lower Bakken
Results
Texel #21-35 Well
0 20 40 60 80
De
pth
(ft)
0 200 400 600 800
Upper Bakken
Middle Bakken
Lower Bakken
11/6/2013
10
Results
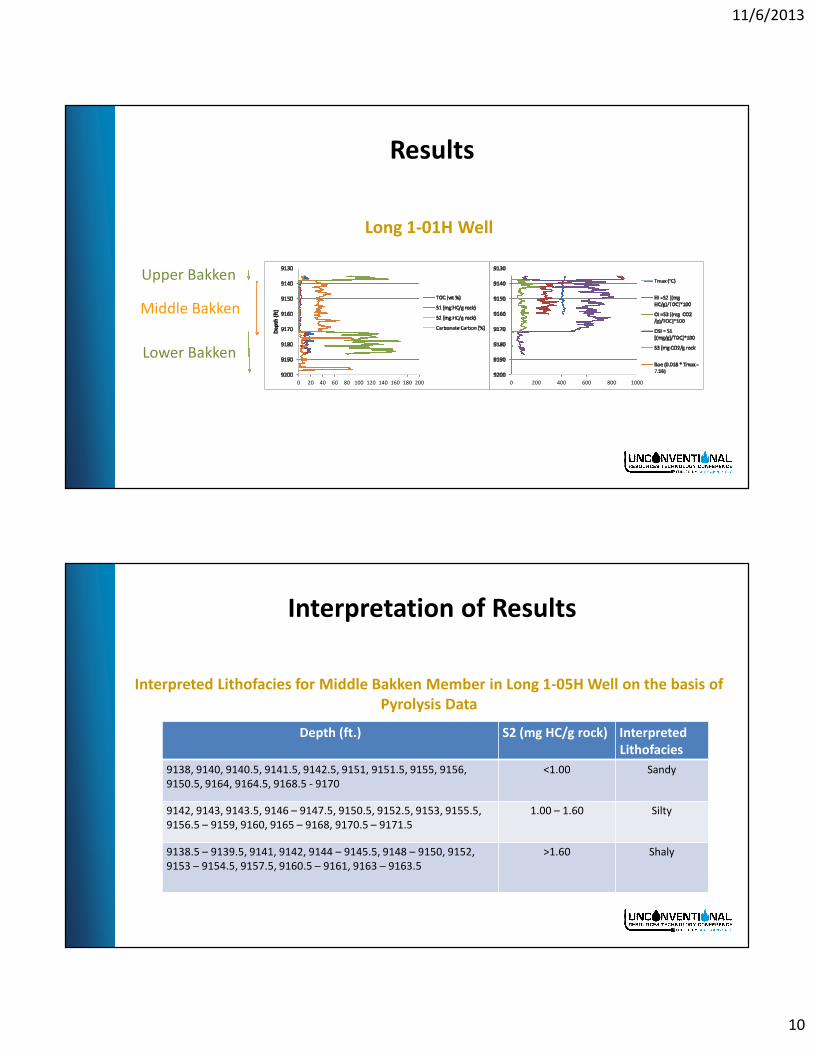
Long 1-01H Well
Upper Bakken
Middle Bakken
Lower Bakken
0 20 40 60 80 100 120 140 160 180 200 0 200 400 600 800 1000
Interpretation of Results
Interpreted Lithofacies for Middle Bakken Member in Long 1-05H Well on the basis ofPyrolysis Data
Depth (ft.) S2 (mg HC/g rock) InterpretedLithofacies
9138, 9140, 9140.5, 9141.5, 9142.5, 9151, 9151.5, 9155, 9156,9150.5, 9164, 9164.5, 9168.5 - 9170
<1.00 Sandy
9142, 9143, 9143.5, 9146 – 9147.5, 9150.5, 9152.5, 9153, 9155.5,9156.5 – 9159, 9160, 9165 – 9168, 9170.5 – 9171.5
1.00 – 1.60 Silty
9138.5 – 9139.5, 9141, 9142, 9144 – 9145.5, 9148 – 9150, 9152,9153 – 9154.5, 9157.5, 9160.5 – 9161, 9163 – 9163.5
>1.60 Shaly
11/6/2013
11
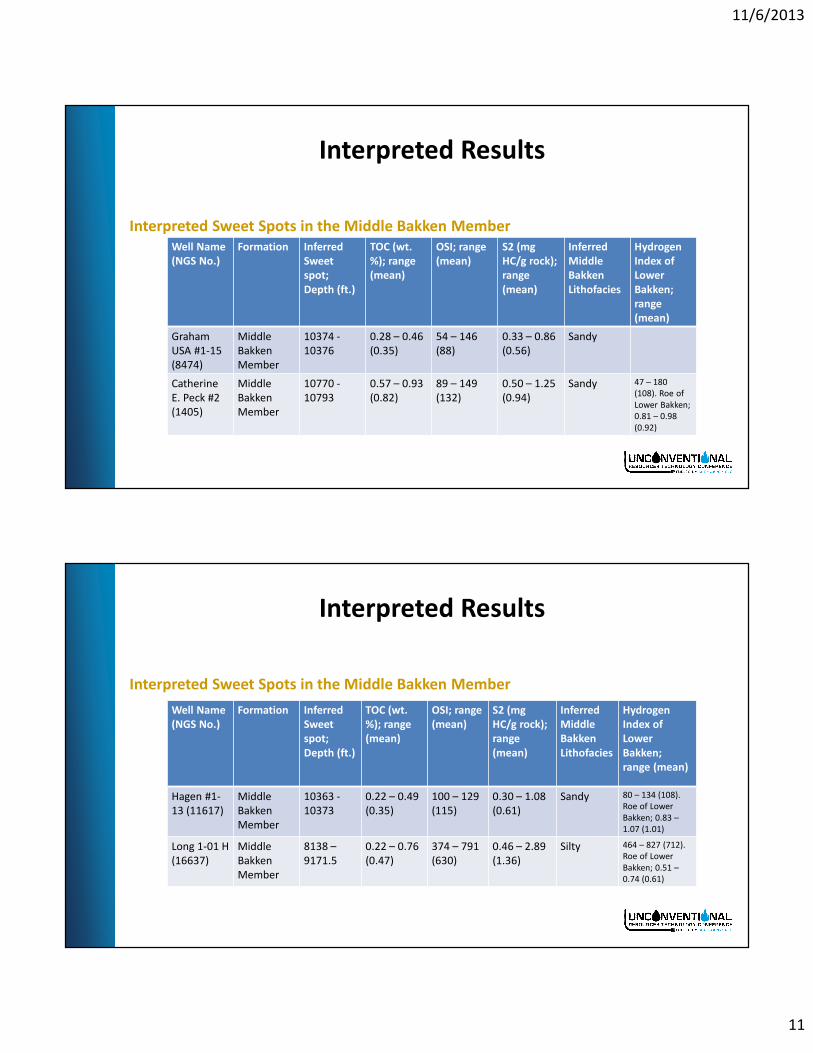
Interpreted Results
Interpreted Sweet Spots in the Middle Bakken MemberWell Name(NGS No.)
Formation InferredSweetspot;Depth (ft.)
TOC (wt.%); range(mean)
OSI; range(mean)
S2 (mgHC/g rock);range(mean)
InferredMiddleBakkenLithofacies
HydrogenIndex ofLowerBakken;range(mean)
GrahamUSA #1-15(8474)
MiddleBakkenMember
10374 -10376
0.28 – 0.46(0.35)
54 – 146(88)
0.33 – 0.86(0.56)
Sandy
CatherineE. Peck #2(1405)
MiddleBakkenMember
10770 -10793
0.57 – 0.93(0.82)
89 – 149(132)
0.50 – 1.25(0.94)
Sandy 47 – 180(108). Roe ofLower Bakken;0.81 – 0.98(0.92)
Interpreted Results
Interpreted Sweet Spots in the Middle Bakken Member
Well Name(NGS No.)
Formation InferredSweetspot;Depth (ft.)
TOC (wt.%); range(mean)
OSI; range(mean)
S2 (mgHC/g rock);range(mean)
InferredMiddleBakkenLithofacies
HydrogenIndex ofLowerBakken;range (mean)
Hagen #1-13 (11617)
MiddleBakkenMember
10363 -10373
0.22 – 0.49(0.35)
100 – 129(115)
0.30 – 1.08(0.61)
Sandy 80 – 134 (108).Roe of LowerBakken; 0.83 –1.07 (1.01)
Long 1-01 H(16637)
MiddleBakkenMember
8138 –9171.5
0.22 – 0.76(0.47)
374 – 791(630)
0.46 – 2.89(1.36)
Silty 464 – 827 (712).Roe of LowerBakken; 0.51 –0.74 (0.61)
11/6/2013
12
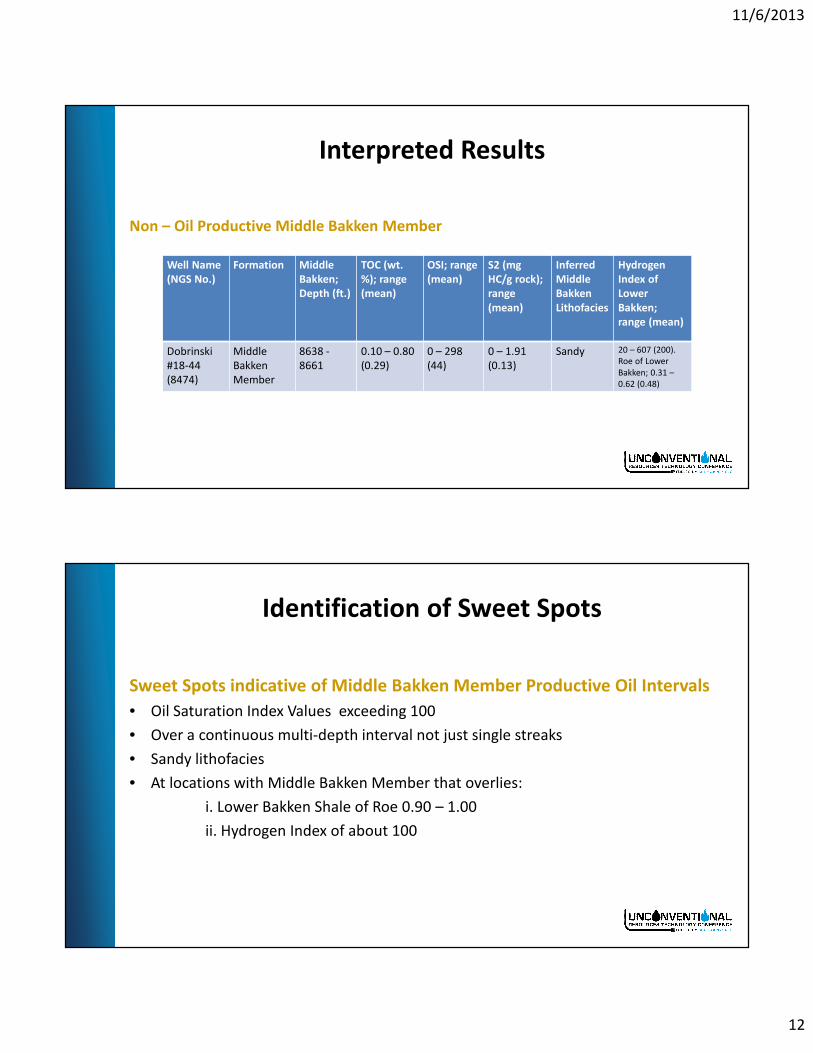
Interpreted Results
Non – Oil Productive Middle Bakken Member
Well Name(NGS No.)
Formation MiddleBakken;Depth (ft.)
TOC (wt.%); range(mean)
OSI; range(mean)
S2 (mgHC/g rock);range(mean)
InferredMiddleBakkenLithofacies
HydrogenIndex ofLowerBakken;range (mean)
Dobrinski#18-44(8474)
MiddleBakkenMember
8638 -8661
0.10 – 0.80(0.29)
0 – 298(44)
0 – 1.91(0.13)
Sandy 20 – 607 (200).Roe of LowerBakken; 0.31 –0.62 (0.48)
Identification of Sweet Spots
Sweet Spots indicative of Middle Bakken Member Productive Oil Intervals
• Oil Saturation Index Values exceeding 100
• Over a continuous multi-depth interval not just single streaks
• Sandy lithofacies
• At locations with Middle Bakken Member that overlies:
i. Lower Bakken Shale of Roe 0.90 – 1.00
ii. Hydrogen Index of about 100

11/6/2013
13
Some Exceptions
Long 1-01H Well
The productive oil Middle Bakken depth interval differs in that:
• Roe of underlying Lower Bakken is barely mature (0.61)
• Hydrogen Index of the underlying Lower Bakken averages 712
• Inferred to be migrated oil
Conclusions
Formation Tops
• Upper, Middle and Lower Bakken Formation Tops can be picked on the basis of theirpyrolysis and TOC data
• Using Pyrolysis and TOC to pick Formation Tops is similar to using wireline logsUsing Pyrolysis data, the Middle Bakken lithofacies can also be identified in terms of:
• Relative sandy, silty and shaly tendencies on the basis of S2 values;
• S2 values of <1.00, 1.00 – 1.60 and >1.60 mg HC/g rock
Sweet Spots marking Middle Bakken productive oil intervals
• Oil Saturation Index values >100 over a continuous multi-depth interval
• Locations where Middle Bakken overlies Lower Bakken of Roe 0.90 – 1.00 and HydrogenIndex of about 100

11/6/2013
14
Acknowledgements/Questions
I am grateful to Wildcat Technologies for sponsoring my participation at this landmarkconference and I wish to also say thank you to URTeC conference organizers for invitingme.
Thank you for listening to me and please let me have your questions.
References
HESS, 2011, Westward Expansion of the Bakken Oil Resource Play in North Dakota, Tight Oilfrom Shale Plays, World Congress 2011.Jarvie, D. M., 2012, Shale Resource Systems for Oil and Gas: in J. A. Breyer, ed., Shale Reservoirs– Giant Resources for the 21st Century: AAPG Memoir 97, p 69 – 87 and p.89 – 119.Gerhard, L. C., S. B. Anderson, J. A. LeFever and C. G. Carlson, 1982, Geological Development,Origin, and Energy Mineral Resources of Williston Basin, North Dakota: AAPG Bull. v.66, No. 8,p. 989 – 1020.LeFever, J. A., 2009, Montana-North Dakota? Middle Member Bakken Play, North DakotaGeological Survey.North Dakota Geological Survey, 2011.Kuhn, P. H., R. di Primio and B. Horsfield, 2009, Inconsistency of Hydrocarbon GenerationPotential and Production Data, The Bakken Play of North Dakota, 7th Petroleum GeologyConference – Queen Elizabeth II Conference Center, London.