q1 2015 earnings presentation
TRANSCRIPT

First Quarter Earnings
Presentation
MASCO CORPORATION
April 28, 2015

Safe Harbor Statement
Statements contained in this presentation that reflect our views about our future performance constitute “forward-looking statements” under the Private Securities Litigation Reform Act of 1995. Forward-looking statements can be identified by words such as “believe,” “anticipate,” “appear,” “may,” “will,” “should,” “intend,” “plan,” “estimate,” “expect,” “assume,” “seek,” “forecast,” and similar references to future periods. These views involve risks and uncertainties that are difficult to predict and, accordingly, our actual results may differ materially from the results discussed in our forward-looking statements. We caution you against relying on any of these forward-looking statements. Our future performance may be affected by our reliance on new home construction and home improvement, our reliance on key customers, the cost and availability of raw materials, uncertainty in the international economy, shifts in consumer preferences and purchasing practices, our ability to improve our underperforming businesses, our ability to maintain our competitive position in our industries, risks associated with the proposed spin-off of our Services Business, our ability to realize the expected benefits of the spin-off, the timing and terms of our share repurchase program, and our ability to reduce corporate expense and simplify our organizational structure. We discuss many of the risks we face in Item 1A, “Risk Factors” in our most recent Annual Report on Form 10-K, as well as in our Quarterly Reports on Form 10-Q and in other filings we make with the Securities and Exchange Commission. Our forward-looking statements in this presentation speak only as of the date of this presentation. Factors or events that could cause our actual results to differ may emerge from time to time, and it is not possible for us to predict all of them. Unless required by law, we undertake no obligation to update publicly any forward-looking statements as a result of new information, future events or otherwise.
The Company believes that the non-GAAP performance measures and ratios that are contained herein, used in managing the business, may provide users of this financial information with additional meaningful comparisons between current results and results in prior periods. Non-GAAP performance measures and ratios should be viewed in addition to, and not as an alternative for, the Company's reported results under accounting principles generally accepted in the United States. Additional information about the Company is contained in the Company's filings with the Securities and Exchange Commission and is available on Masco's website at www.masco.com.
2
Masco Q1 2015 Results
Topic
• Summary of Results Keith Allman
• Financial/Operations Review John Sznewajs
• Q&A
3

Q 1 2 0 1 5 I N R E V I E W
Focused Execution Continues to Deliver Results
● Drove growth across the portfolio in local currency
● Profit growth driven by improved cost productivity and operating leverage
● Repurchased ~4 million shares
● Acquired Endless Pools, Inc.
● Achieved record sales quarter for Delta Faucet and Hansgrohe in local currency
4
Driving Performance

Masco Q1 2015 Results
Topic
• Summary of Results Keith Allman
• Financial/Operations Review John Sznewajs
• Q&A
5

Strengthened Performance Across all Segments
6
*See Appendix for GAAP reconciliation.
Quarter Highlights • Total company sales increased 7% excluding the effects of foreign currency
translation • North American sales increased 5%; International sales increased 10% in local
currency • FX negatively impacted the top-line by $77 million and bottom-line by $10 million
($ in Millions) First Quarter
2015
Revenue Y-O-Y Change
$2,018 3%
Operating Profit* Y-O-Y Change
$181 15%
Operating Margin* Y-O-Y Change
9.0% 100 bps
Adjusted EPS* Y-O-Y Change
$0.20 43%
P L U M B I N G P R O D U C T S
7
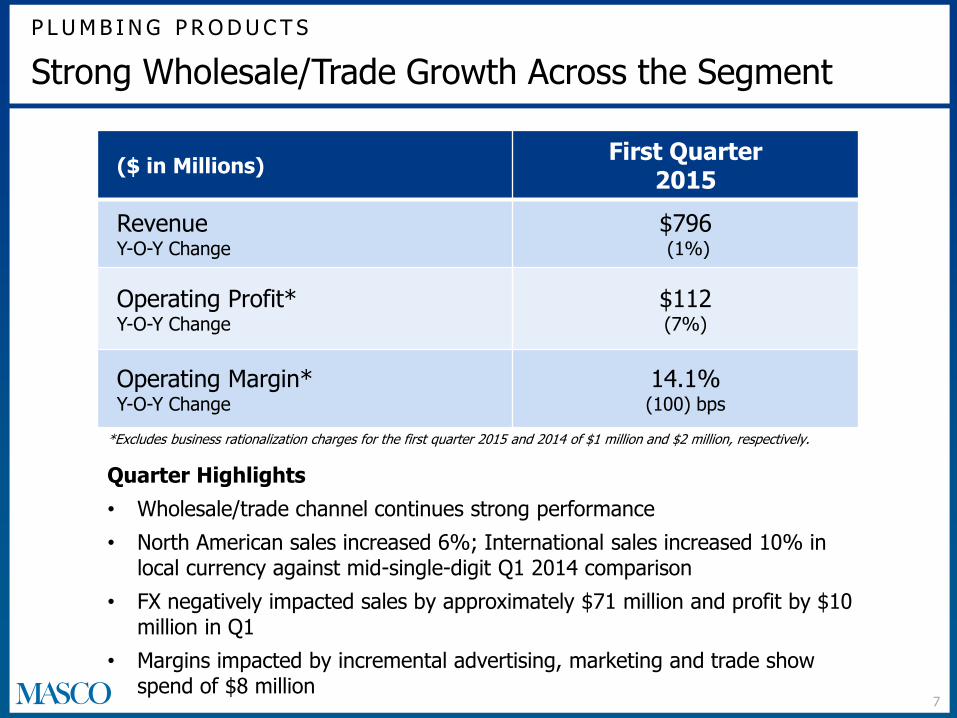
Strong Wholesale/Trade Growth Across the Segment
*Excludes business rationalization charges for the first quarter 2015 and 2014 of $1 million and $2 million, respectively.
($ in Millions) First Quarter
2015
Revenue Y-O-Y Change
$796 (1%)
Operating Profit* Y-O-Y Change
$112 (7%)
Operating Margin* Y-O-Y Change
14.1% (100) bps
Quarter Highlights
• Wholesale/trade channel continues strong performance
• North American sales increased 6%; International sales increased 10% in local currency against mid-single-digit Q1 2014 comparison
• FX negatively impacted sales by approximately $71 million and profit by $10 million in Q1
• Margins impacted by incremental advertising, marketing and trade show spend of $8 million
D E C O R AT I V E A R C H I T E C T U R A L P R O D U C T S
8
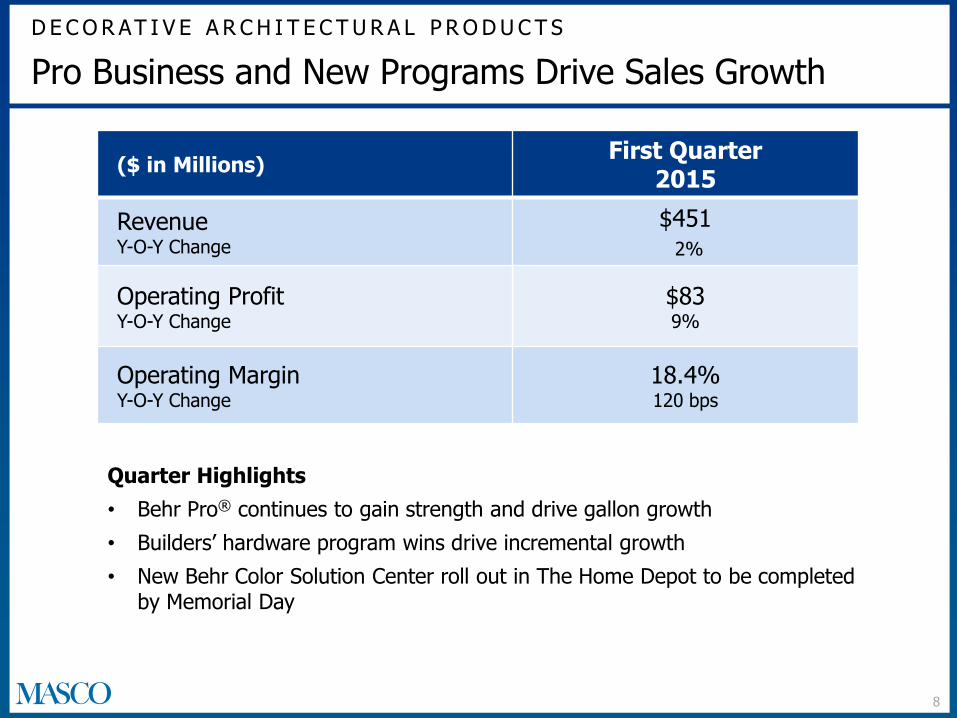
Pro Business and New Programs Drive Sales Growth
($ in Millions) First Quarter
2015
Revenue Y-O-Y Change
$451 2%
Operating Profit Y-O-Y Change
$83 9%
Operating Margin Y-O-Y Change
18.4% 120 bps
Quarter Highlights
• Behr Pro® continues to gain strength and drive gallon growth
• Builders’ hardware program wins drive incremental growth
• New Behr Color Solution Center roll out in The Home Depot to be completed by Memorial Day
C A B I N E T S A N D R E L AT E D P R O D U C T S
9
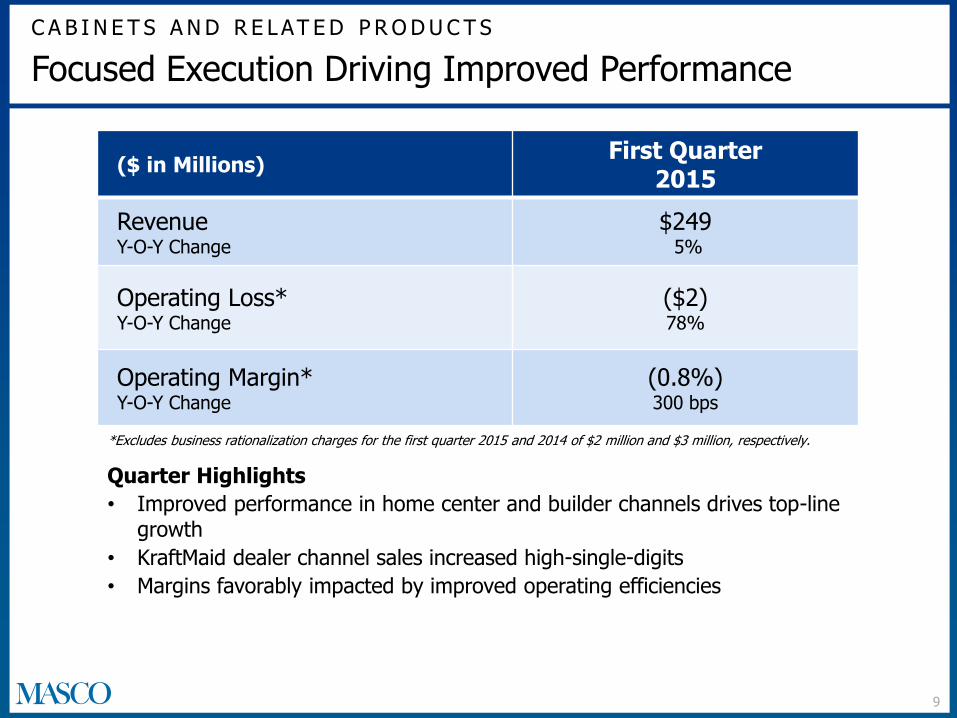
Focused Execution Driving Improved Performance
*Excludes business rationalization charges for the first quarter 2015 and 2014 of $2 million and $3 million, respectively.
($ in Millions) First Quarter
2015
Revenue Y-O-Y Change
$249 5%
Operating Loss* Y-O-Y Change
($2) 78%
Operating Margin* Y-O-Y Change
(0.8%) 300 bps
Quarter Highlights
• Improved performance in home center and builder channels drives top-line growth
• KraftMaid dealer channel sales increased high-single-digits
• Margins favorably impacted by improved operating efficiencies
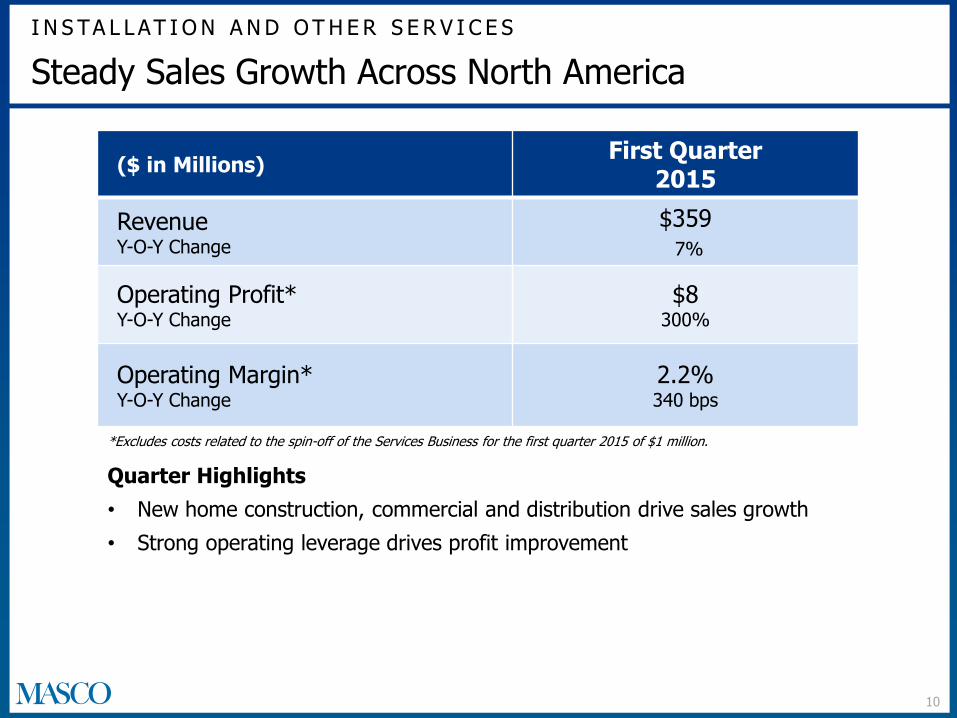
I N S TA L L AT I O N A N D O T H E R S E R V I C E S
10
Steady Sales Growth Across North America
($ in Millions) First Quarter
2015
Revenue Y-O-Y Change
$359 7%
Operating Profit* Y-O-Y Change
$8 300%
Operating Margin* Y-O-Y Change
2.2% 340 bps
Quarter Highlights
• New home construction, commercial and distribution drive sales growth
• Strong operating leverage drives profit improvement
*Excludes costs related to the spin-off of the Services Business for the first quarter 2015 of $1 million.

O T H E R S P E C I A LTY P R O D U C T S
11
Growth and Positive Mix Drive Performance
($ in Millions) First Quarter
2015
Revenue Y-O-Y Change
$163 7%
Operating Profit Y-O-Y Change
$6 20%
Operating Margin Y-O-Y Change
3.7% 40 bps
Quarter Highlights
• Sales increased 10% excluding the effects of foreign currency translation
• Continued strength in wholesale/dealer channel in North America window business
• Advertising spend and ERP implementation negatively impacted profit by $2 million in the quarter
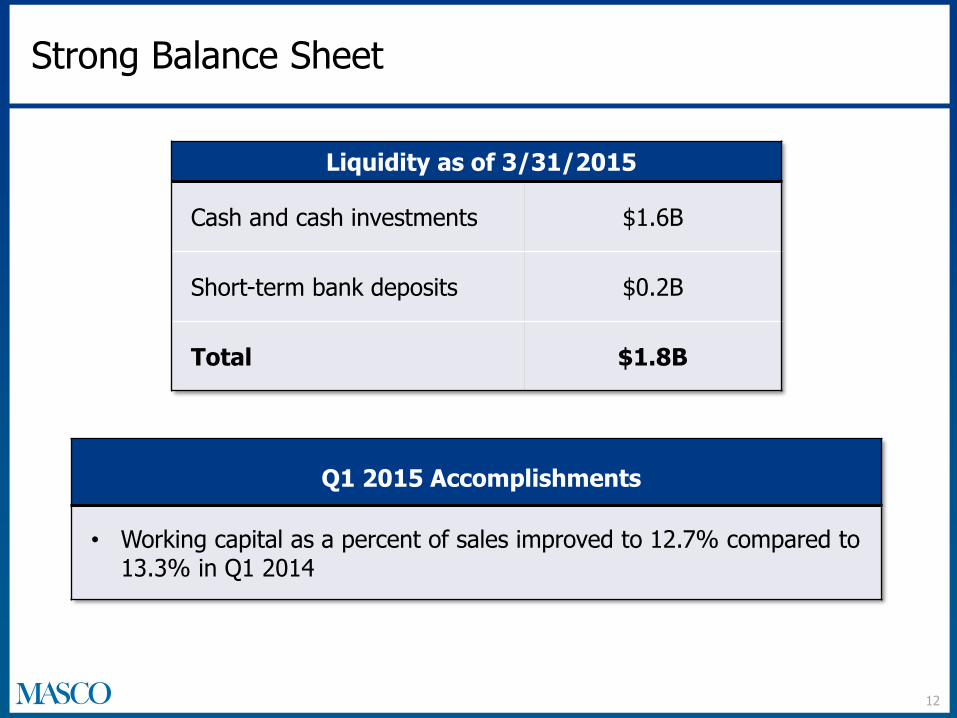
Strong Balance Sheet
Liquidity as of 3/31/2015
Cash and cash investments $1.6B
Short-term bank deposits $0.2B
Total $1.8B
12
Q1 2015 Accomplishments
• Working capital as a percent of sales improved to 12.7% compared to 13.3% in Q1 2014
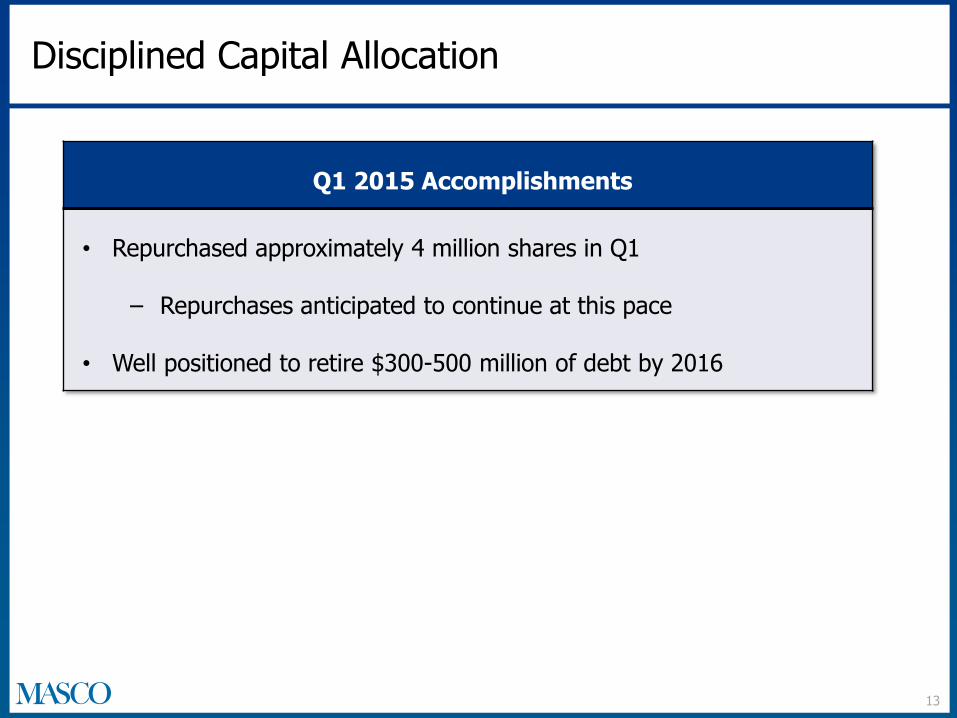
Disciplined Capital Allocation
Q1 2015 Accomplishments
• Repurchased approximately 4 million shares in Q1
‒ Repurchases anticipated to continue at this pace
• Well positioned to retire $300-500 million of debt by 2016
13
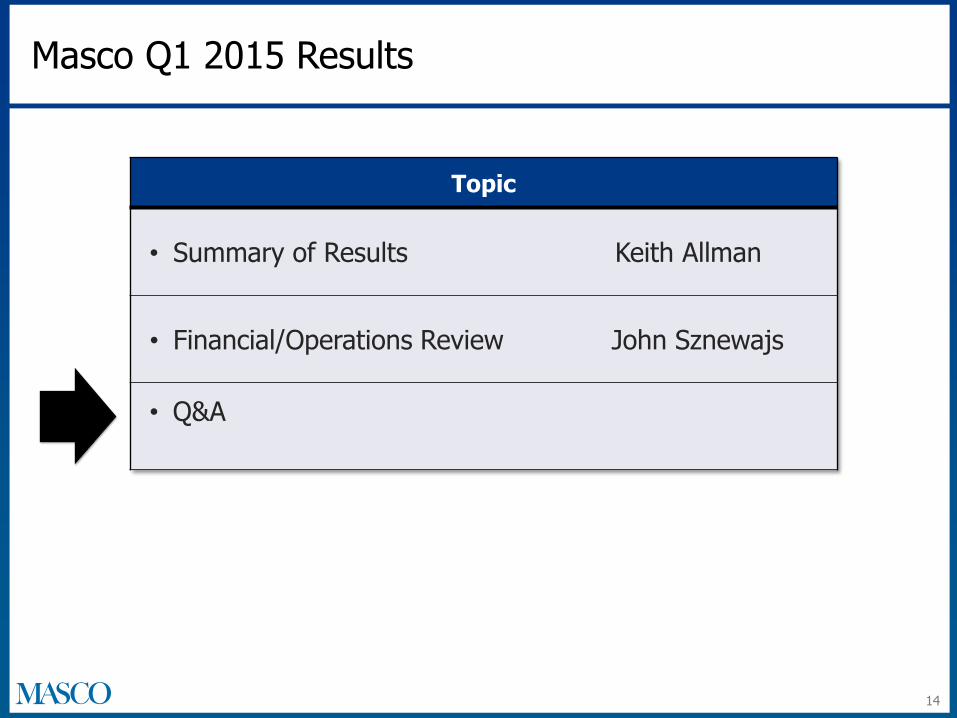
Masco Q1 2015 Results
Topic
• Summary of Results Keith Allman
• Financial/Operations Review John Sznewajs
• Q&A
14

Q&A
Appendix

Appendix – Profit Reconciliation – First Quarter
17
($ in Millions) Q1 2015 Q1 2014
Net Sales $ 2,018 $ 1,965
Gross Profit – As Reported $ 568 $ 547
Rationalization charges 1 4
Gross Profit – As Adjusted $ 569 $ 551
Gross Margin - As Reported 28.1% 27.8%
Gross Margin - As Adjusted 28.2% 28.0%
Operating Profit – As Reported $ 171 $ 152
Rationalization charges 6 5
Costs related to spin-off of Services Business 4 -
Operating Profit – As Adjusted $ 181 $ 157
Operating Margin - As Reported 8.5% 7.7%
Operating Margin - As Adjusted 9.0% 8.0%
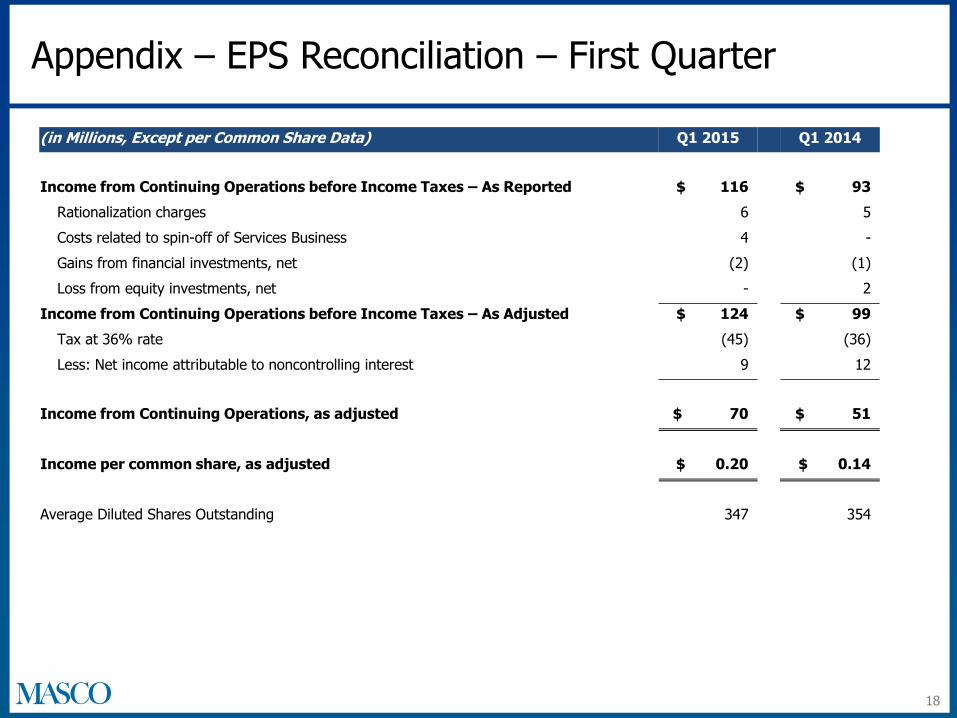
Appendix – EPS Reconciliation – First Quarter
18
(in Millions, Except per Common Share Data) Q1 2015 Q1 2014
Income from Continuing Operations before Income Taxes – As Reported $ 116 $ 93
Rationalization charges 6 5
Costs related to spin-off of Services Business 4 -
Gains from financial investments, net (2) (1)
Loss from equity investments, net - 2
Income from Continuing Operations before Income Taxes – As Adjusted $ 124 $ 99
Tax at 36% rate (45) (36)
Less: Net income attributable to noncontrolling interest 9 12
Income from Continuing Operations, as adjusted $ 70 $ 51
Income per common share, as adjusted $ 0.20 $ 0.14
Average Diluted Shares Outstanding 347 354

($ in Millions) 2015 Estimate 2014 Actual
Rationalization Charges1, 3 ~ $34 $72
Tax Rate4 ~ 36% 34%
Interest Expense7 ~ $230 $225
General Corp. Expense2 ~ $100 $103
Capital Expenditures ~ $190 $128
Depreciation & Amortization3
~ $154 $167
Shares Repurchased5 $400-500 $158
Shares Outstanding6 347 million 352 million
2015 Guidance Estimates
1. Based on 2015 business plans. 2015 includes approximately $26 million related to spin-off transaction costs. 2. Excludes rationalization expenses of $33 million for the year ended December 31, 2014 and $17 million (estimated) for the year ended December 31, 2015. 3. Includes accelerated depreciation of $1 million for the year ended December 31, 2014. Such expenses are also included in the rationalization charges. 4. Excludes $529 million release of the valuation allowance in 2014. 5. 2015 and 2014 share repurchases include approximately 675 thousand and 1.7 million shares , respectively, to offset grants of long-term stock awards. 6. Reflects shares outstanding as of March 31, 2015 and assumes no further share repurchases in 2015. 7. Reflects ~$5 million of incremental interest expense due to the March 2015 pre-funding of our June 2015 debt maturity.
19

2014 Segment Mix*
R&R = % of sales to repair and remodel channels NC = % of sales to new construction channels NA = % of sales within North America Int’l = % of sales outside North America *Based on Company estimates.
Business Segment
Plumbing Products
Installation and Other Services
Decorative Architectural Products
$3.3B
$1.5B
$2.0B
Revenue 2014 % of Total
39%
23%
18%
$8.5B 100% Total Company
Other Specialty Products $0.7B 8%
R&R% vs. NC NA% vs. Int’l
82% 59%
99% 100%
18% 100%
74% 74%
71% 81%
Cabinets and Related Products $1.0B 12% 55% 91%
20

2014 International Revenue Split*
*Based on Company estimates.
International Sales Accounted for ~19% of Total 2014 Masco Sales
28%
5%
10%
25%
9%
14%
9%
UK
Northern Europe
Southern Europe
Central Europe
Eastern Europe
Emerging markets
Other
21