q1 2015 revenues - stellantis.com
TRANSCRIPT

April, 29th 2015
Q1 2015
REVENUES

• This presentation does not constitute an offer to sell, or a solicitation of an offer to buy, PEUGEOT SA (“Company”) shares.
• This presentation may contain forward-looking statements. Such forward-looking statements do not constitute forecasts regarding the Company’s results or any other performance indicator, but rather trends or targets, as the case may be. These statements are by their nature subject to risks and uncertainties as described in the registration document filed with the French Autorité des Marchés Financiers (AMF). These statements do not reflect future performance of the Company, which may materially differ.
• The Company does not undertake to provide updates of these statements.
• More comprehensive information about PSA PEUGEOT CITROËN may be obtained on group website (www.psa-peugeot-citroen.com), under Regulated Information.
2

Jean-Baptiste
de Chatillon CFO and Member of the Managing Board

Highlights
4
Ahead of our roadmap
Group revenues up 4.6%
New car revenues, including China, up 5.5%*
Focus on profitable sales in every region
Favorable economic context in Europe (FX, interest rate, markets…)
And still accelerating “Back in the Race” action plans
* Proforma including 50% of DPCA and CAPSA new car revenues

726
443
171
56 15 5 36
712
439
186
36 2 6 43
Total AssembledVehicles
Europe China & SE Asia Latin America Eurasia India & Pacific Middle East & Africa
Consolidated worldwide unit sales
5
In thousands of units
Q1 2014
Q1 2015
* Assembled vehicles, excluding CKD’s
-1.9%
-0.9%
-34.8%
+8.6%
-86.1% +31.9% +19.2%
Volumes
Consolidated worldwide unit sales*
Ensure profitable growth worldwide

Inventories
6
188 200 184
226 222 187
31.03.13 31.03.14 31.03.15
414 422
371
In thousands of new vehicles*
Independent dealership inventory
Group inventory
* World figures excluding China
Structural improvement

Group Revenues
7
In million euros Q1 2014
IFRS 5
Q1 2015
IFRS 5 Change
Automotive 8,925 8,950 25
DPCA & CAPSA Revenues* 961 1,267 306
Pro forma Automotive Revenues incl. DPCA & CAPSA* 9,886 10,217 331
Faurecia 4,518 5,140 622
Other businesses and eliminations** (367) (416) 48
Group Revenues 13,076 13,674 598
* 50% of DPCA & CAPSA revenues
** Including remaining activities of Banque PSA Finance
o/w Automotive new car revenues, including China* 7,126 7,519 393
Increase in automotive revenues including China +3.3%

Automotive: new car revenue analysis
8
6,306 6,240
Q1 2014 Q1 2015
+1.7% +2.4% +2.0% +0.4% -0.1%
In million euros
* CKD, accounting treatment of buy back commitment, short term rental
** Including 50% of DPCA and CAPSA new car revenues
7,126 Incl. China
7,519 Incl. China
1,213 886 Product mix
FX Others*
Country mix Volumes Price
-5.3%
+1.1%
+5.5%**pro forma incl. DPCA & CAPSA
Price & product mix: positive impact
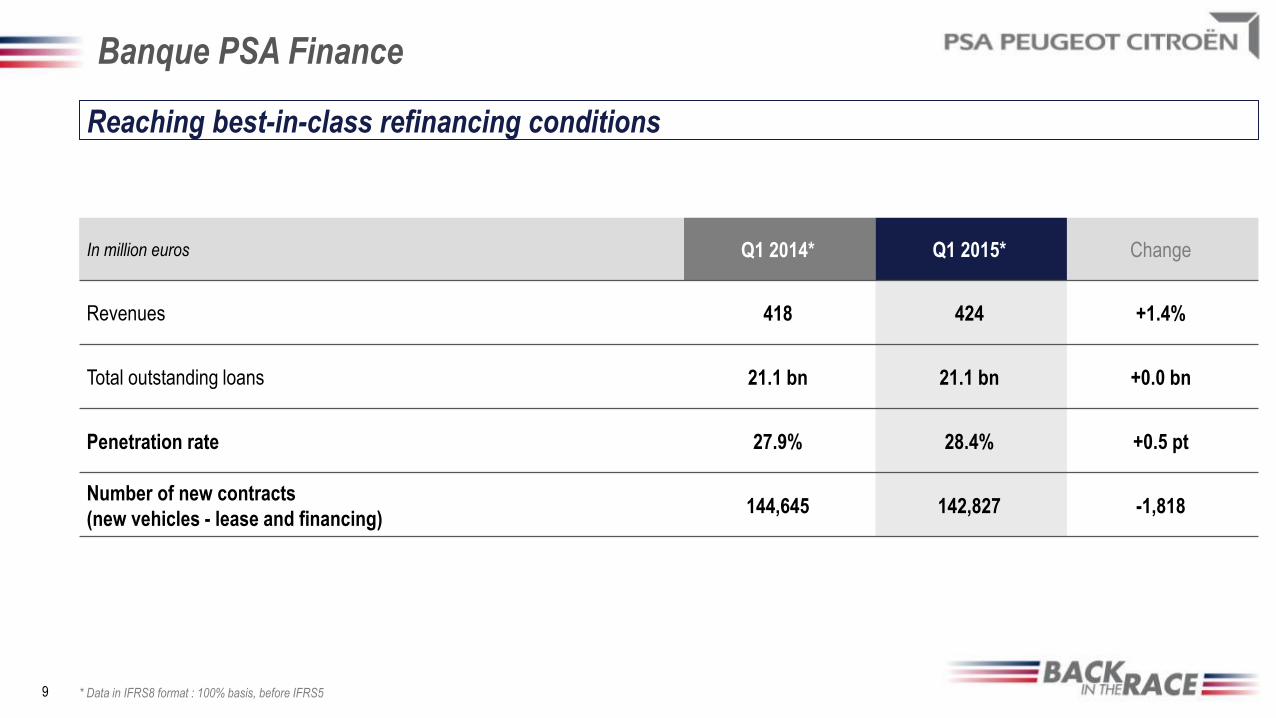
Banque PSA Finance
9
Reaching best-in-class refinancing conditions
In million euros Q1 2014* Q1 2015* Change
Revenues 418 424 +1.4%
Total outstanding loans 21.1 bn 21.1 bn +0.0 bn
Penetration rate 27.9% 28.4% +0.5 pt
Number of new contracts
(new vehicles - lease and financing) 144,645 142,827 -1,818
* Data in IFRS8 format : 100% basis, before IFRS5

Faurecia
10
In million euros Q1 2014 Q1 2015 Change
Automotive Seating 1,209 1,386 +14.6%
Interior Systems 996 1,130 +13.4%
Emissions Control Technologies Systems 846 965 +14.0%
Automotive Exteriors 437 475 +8.7%
Total product revenues 3,487 3,957 +13.5%
Monolith revenues 751 922 +22.8%
Development, Tooling & Prototype revenues 280 261 -6.7%
Total revenues 4,518 5,140 +13.8%
Strong growth

Jean-Baptiste
de Chatillon CFO and Member of the Managing Board
BACK IN THE
RACE

Back in the Race: 4 business objectives
Differentiate Brands and improve net pricing
Implement a global core model strategy
Ensure profitable growth worldwide
Enhance core competitiveness
12

Global core model strategy – 2015 Q1 Fact Sheet -
13
Shanghai
Share resources R&D Center with DFG
Share development CMP (ex-EMP1)
with DFG
Share development B-LCV with GM
More technologies Traffic Jam Assist 2018
More technologies Connected services
with IBM

Outlook
14 * Free cash flow without restructuring and exceptional
** ROI relating to revenues
2015 Market outlook Operational outlook (unchanged)
Europe: +4%
China: +7%
Latin America: -10%
Russia: -30%
€2bn cumulated Group operational free cash flow*
over 2015 – 2017
Reach 2% operating margin** in 2018 for the automotive
business, targeting 5% within the timing of the next mid-
term plan 2019 – 2023

Q&A

APPENDICES

Worldwide unit sales
17
units* Q1 2014 Q1 2015 Change
Europe** Peugeot Citroën DS Total PSA
239,161 179,455
24,303 442,919
245,760 174,273
18,921 438,954
+2.8% -2.9%
-22.2% -0.9%
China & South East Asia Peugeot Citroën DS Total PSA
87,803 80,360
3,127 171,290
107,901 73,813
4,268 185,982
+22.9% -8.1%
+36.0% +8.6%
Latin America Peugeot Citroën DS Total PSA
34,201 20,887
419 55,507
22,439 13,177
327 35,943
-34.4% -36.9% -22.0% -35.2%
Eurasia Peugeot Citroën DS Total PSA
8,997 6,108
320 15,425
1,191 940
17 2,148
-86.8% -84.6% -94.7% -86.1%
India-Pacific Peugeot Citroën DS Total PSA
3,553 845 522
4,920
5,163 1,014
301 6,478
+45.3% +20.0% -42.3% +31.7%
Middle East - Africa Peugeot Citroën DS Total PSA
25,922 9,490
372 35,784
26,790 15,571
351 42,712
+3.3% +64.1%
-5.6% +19.4%
Total Assembled vehicles Peugeot Citroën DS Total PSA
399,637 297,145
29,063 725,845
409,244 278,788
24,185 712,217
+2.4% -6.2%
-16.8% -1.9%
* Assembled vehicles, CKD units
** Europe = EU + EFTA + Albania + Bosnia + Croatia + Kosovo + Macedonia + Montenegro + Serbia