q1 2017 aerospace & defense year in review · jefferies llc / april 2017 q1 2017 defense &...
TRANSCRIPT

Jefferies LLC
Member SIPC
INVESTMENT BANKING
Q1 2017 Aerospace & Defense Year in Review
IN THIS ISSUE
Defense & Government Services Update Quarter in Review U.S. Defense Budget Update Public Market Performance M&A Activity Select Key Developments
Commercial Aerospace Update Quarter in Review Public Market Performance M&A Activity Select Key Developments
Equity Market Conditions
Debt Market Conditions
Jefferies Team
Jefferies Aerospace & Defense Group

Jefferies LLC April 2017 /
Important Disclosures This communication is being provided strictly for informational purposes only and is not intended as a recommendation or an offer or solicitation for the purchase or sale of any security referenced herein. This material has been prepared by Jefferies LLC (“Jefferies”) a U.S.-registered broker-dealer, employing appropriate expertise, and in the belief that it is fair and not misleading. The information upon which this material is based was obtained from sources believed to be reliable, but has not been independently verified by Jefferies, therefore, we do not guarantee its accuracy. This is not an offer or solicitation of an offer to buy or sell any security or investment. Any opinion or estimates constitute our best judgment as of this date, and are subject to change without notice. Jefferies and Jefferies International Limited and their affiliates and their respective directors, officers and employees may buy or sell securities mentioned herein as agent or principal for their own account. This report was created by members of the investment banking division of Jefferies, and has not been reviewed by or discussed with, any member of Jefferies’ research department. This report is not intended to be, and in no way constitutes a “research report”, as such term is defined in Rule 137 promulgated under the Securities Act of 1933, as amended. Jefferies’ investment banking department has done, and may continue to do business with, companies included in this report. This report is a marketing communication and is not and should not be construed as investment research. Reproduction without written permission of Jefferies is expressly forbidden. Additional Information This material is approved for distribution in the United Kingdom by Jefferies International Limited, which is authorised and regulated by the Financial Conduct Services Authority ("FCSA") and is located at Vintners Place, 68 Upper Thames Street, London EC4V 3BJ; telephone +44 (0) 20 7029 8000; facsimile +44 (0) 20 7029 8010. While we believe this information and materials upon which this information was based are accurate, except for any obligations under the rules of the FCSA, we do not guarantee its accuracy. In the UK, this publication is directed solely at persons who have professional experience in matters relating to investments falling within Articles 19(5) and 49(2)(a) to (d) of the Financial Services and Markets Act 2000 (Financial Promotion) Order 2005 (as amended) or at persons to whom it can be otherwise lawfully distributed. For Canadian investors, this material is intended for use only by professional or institutional investors. None of the investments or investment services mentioned or described herein is available to other persons or to anyone in Canada who is not a "Designated Institution" as defined by the Securities Act (Ontario). For investors in the Republic of Singapore, this material is intended for use only by accredited, expert or institutional investors as defined by the Securities and Futures Act and is distributed by Jefferies Singapore Limited which is regulated by the Monetary Authority of Singapore. Any matters arising from, or in connection with, this document should be brought to the attention of Jefferies Singapore Limited at 80 Raffles Place #15-20, UOB Plaza 2, Singapore 048624, telephone: +65 6551 3950. Recipients of this document in any other jurisdiction should inform themselves about and observe any applicable legal requirements in relation to the receipt of this report. All logos, trademarks and service marks appearing herein are property of Jefferies. Member SIPC • © 01/2014 Jefferies LLC
Disclosure
i

Jefferies LLC April 2017 /
Defense & Government Services Update
1

Jefferies LLC April 2017 /
Q1 2017 Defense & Government Services Quarter in Review
The Budget
The US defense budget is inflecting, ending a five-year decline that coincided with the drawdown of US activity in Iraq and Afghanistan
─ FY 2018 budget requests $639 billion, representing a $54 billion increase from the 2017 annualized CR level
─ Increasing instability in Eastern Europe, the Middle East, and Asia Pacific support expectations for budget growth to resume
Third offset strategy is driving investment in advanced military technologies and the growing presence of cyber threats prioritizes development of strong cybersecurity defenses
Public Market Performance
The broader market finished the quarter up with the S&P 500 increasing 5.5% vs. the beginning of the year
─ Defense Primes outperformed the S&P 500, with Boeing and BAE Systems share prices increasing by 13.6% and 8.6%, respectively
─ Midcap Defense saw strong performances all around, led by Mercury and Comtech experiencing increases of 29.2% and 24.4%, respectively
─ Government Services underperformed the market, with only NCI and VSE experience positive growth of 7.9% and 5.0% respectively
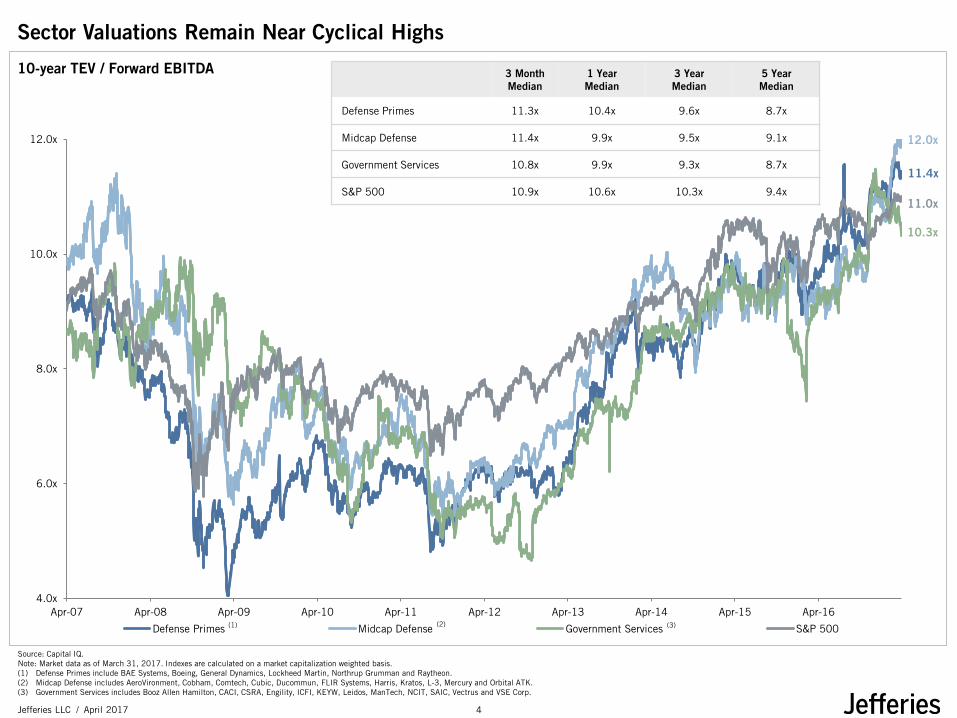
Prime and Midcap Defense valuations sector remained robust, while Government Services saw a slight decline
─ Defense Primes comparables are trading at 11.4x TEV / Forward EBITDA, slightly above their 2016 year end value of 11.0x
─ Midcap Defense comparables are trading at 12.0x TEV / Forward EBITDA, well above their 2016 year end value of 10.8x
─ Government Services comparables are trading at 10.3x TEV / Forward EBITDA, well below their 2016 year end value of 11.0x
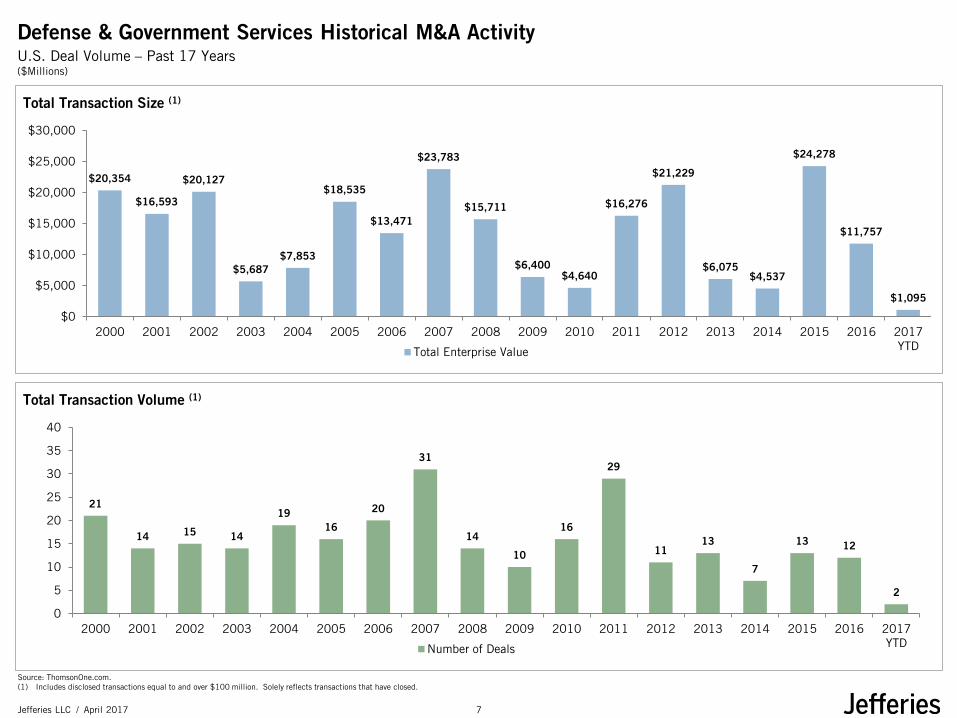
Mergers & Acquisitions
While Q1 2017 saw less M&A activity than Q4 2016, the sector continues to remain active on the M&A front with 2 major deals over $200 million announced in Q1
─ MacDonald, Dettwiler and Associates’ $3,597 million acquisition of DigitalGlobe
Transaction is expected to close in the second half of 2017
─ KeyW Holding Corporation’s $235 million acquisition of Sotera Defense Solutions
Both strategic buyers and financial sponsors continue to aggressively seek acquisition opportunities
─ Strategic buyers are well capitalized with strong balance sheets and seek to augment lackluster organic growth
─ Financial sponsors driven by robust access to capital and aggressive financing markets (in historical terms) seek to acquire at an attractive point in the cycle
Source: Capital IQ. Market data as of March 31, 2017.
2

Jefferies LLC April 2017 /
Key Points On March 16, 2017 President Trump’s
administration released its blueprint for FY 2018 budget
The budget requests $639 billion, which represents a $54 billion increase from the 2017 annualized CR level and an $18 billion increase compared to the Obama administration's forecast
The total $639 billion is comprised of $574 billion in the base budget (a 10% increase from 2017 CR level) and $65 billion for OCO (flat compared to 2017 CR level)
Proposed budget seeks to raise spending caps rather than repeal Budget Control Act
Increase in defense spending is expected to be offset by cuts to foreign aid and domestic agencies
Although the proposal does not provide program specific detail, it does provide a preview of what the budget will focus on:
─ Reverse Army end-strength reductions
─ Increase the number of Navy ships
─ Ensure a ready and fully equipped Marine Corps
─ Accelerate Air Force efforts to improve readiness, ensure technical superiority, and repair aging infrastructure
─ Building critical munitions, filling personnel gaps, and addressing deferred maintenance and modernization, cyber vulnerabilities, and degraded facilities
Department of Defense Spending (FY 2001 - FY 2018)
FY 2018 Base Budget Request Comparison
316 345
438 468 479
535
600
666 666 691 687
645
577 581 560 581 619 639
0
250
500
$750
Base Budget OCO Other
($Billions)
($Billions)
$490
$510
$530
$550
$570
$590
$610
FY11 FY12 FY13 FY14 FY15 FY16 FY17 FY18 FY19 FY20 FY21
FY 2013 PB FY 2015 PB FY 2016 PB FY 2017 PB FY 2018 PB Current Caps
Includes $30 billion of FY 2017 additional requests
Sources: Office of the Under Secretary of Defense (Comptroller) / CFO. Breaking Defense News.
Summary of the FY 2018 Budget Summary ($Billions)
3
Jefferies LLC April 2017 /
10-year TEV / Forward EBITDA
4.0x
6.0x
8.0x
10.0x
12.0x
Apr-07 Apr-08 Apr-09 Apr-10 Apr-11 Apr-12 Apr-13 Apr-14 Apr-15 Apr-16
Defense Primes Midcap Defense Government Services S&P 500
12.0x
10.3x
11.4x
(1) (2) (3)
Sector Valuations Remain Near Cyclical Highs
Source: Capital IQ. Note: Market data as of March 31, 2017. Indexes are calculated on a market capitalization weighted basis. (1) Defense Primes include BAE Systems, Boeing, General Dynamics, Lockheed Martin, Northrup Grumman and Raytheon. (2) Midcap Defense includes AeroVironment, Cobham, Comtech, Cubic, Ducommun, FLIR Systems, Harris, Kratos, L-3, Mercury and Orbital ATK. (3) Government Services includes Booz Allen Hamilton, CACI, CSRA, Engility, ICFI, KEYW, Leidos, ManTech, NCIT, SAIC, Vectrus and VSE Corp.
3 Month Median
1 Year Median
3 Year Median
5 Year Median
Defense Primes 11.3x 10.4x 9.6x 8.7x
Midcap Defense 11.4x 9.9x 9.5x 9.1x
Government Services 10.8x 9.9x 9.3x 8.7x
S&P 500 10.9x 10.6x 10.3x 9.4x 11.0x
4
Jefferies LLC April 2017 /
1.2x
0.7x
0.2x
0.3x
0.5x
0.6x
0.5x
NM
5.9x
1.1x
0.7x
1.7x
0.9x
0.5x
1.8x
1.2x
(1.5x)
0.5x
1.1x
1.4x
(0.8x)
(0.0x)
(0.3x)
(0.1x)
(0.7x)
(2.0x)
(1.8x)
(0.4x)
(0.7x)
0.1x
NA
(0.4x)
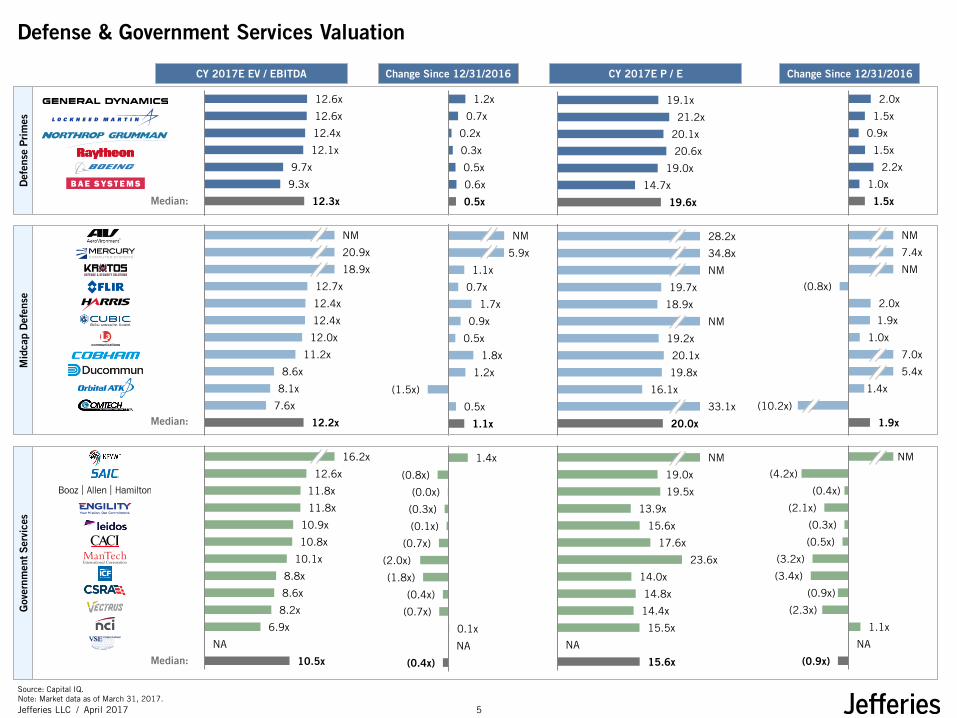
Defense & Government Services Valuation
Source: Capital IQ. Note: Market data as of March 31, 2017.
12.6x
12.6x
12.4x
12.1x
9.7x
9.3x
12.3x
NM
20.9x
18.9x
12.7x
12.4x
12.4x
12.0x
11.2x
8.6x
8.1x
7.6x
12.2x
16.2x
12.6x
11.8x
11.8x
10.9x
10.8x
10.1x
8.8x
8.6x
8.2x
6.9x
NA
10.5x
Def
ense
Pri
mes
19.1x
21.2x
20.1x
20.6x
19.0x
14.7x
19.6x
28.2x
34.8x
NM
19.7x
18.9x
NM
19.2x
20.1x
19.8x
16.1x
33.1x
20.0x
NM
19.0x
19.5x
13.9x
15.6x
17.6x
23.6x
14.0x
14.8x
14.4x
15.5x
NA
15.6x
2.0x
1.5x
0.9x
1.5x
2.2x
1.0x
1.5x
NM
7.4x
NM
(0.8x)
2.0x
1.9x
1.0x
7.0x
5.4x
1.4x
1.9x
NM
(4.2x)
(0.4x)
(2.1x)
(0.3x)
(0.5x)
(3.2x)
(3.4x)
(0.9x)
(2.3x)
1.1x
NA
(0.9x)
(10.2x)
CY 2017E EV / EBITDA Change Since 12/31/2016 CY 2017E P / E Change Since 12/31/2016
Median:
Median:
Median:
Gov
ernm
ent S
ervi
ces
Mid
cap
Def
ense
TBU Market data, old data is already set to properly
calculate delta
5

Jefferies LLC April 2017 /
$187.20
$267.60
$237.84
$152.50
$176.86
$8.05
$28.03
$39.05
$7.78
$36.28
$111.27
$52.80
$165.29
$1.67
$28.79
$98.00
$14.74
$9.44
$74.40
$35.39
$28.94
$51.14
$117.30
$34.63
$41.30
$29.29
$22.35
$15.05
$40.80
96.5%
97.5%
93.7%
96.8%
95.2%
97.8%
96.6%
86.4%
95.6%
84.7%
96.9%
98.5%
94.9%
96.5%
61.1%
85.6%
95.4%
59.1%
94.9%
69.6%
82.8%
91.8%
73.9%
93.0%
86.7%
76.1%
69.4%
87.3%
63.9%
98.3%
82.8%
84.7%
98.6%
Defense & Government Services Stock Price Performance
Source: Capital IQ. Note: Market data as of March 31, 2017.
8.4%
7.1%
2.3%
7.4%
13.6%
8.6%
7.9%
4.5%
29.2%
5.1%
0.2%
8.6%
10.1%
0.0%
(18.8%)
12.6%
11.7%
24.4%
8.6%
(19.9%)
(12.3%)
(1.9%)
(14.1%)
0.0%
(5.6%)
(18.0%)
(25.2%)
(8.0%)
(6.3%)
7.9%
5.0%
(7.1%)
5.5%
Stock Price Close % of 52 Week High YTD Share Performance
S&
P
S&P 500
Def
ense
Pri
mes
Median:
Gov
ernm
ent S
ervi
ces
Median:
Mid
cap
Def
ense
Median:
6
Jefferies LLC April 2017 /
Total Transaction Size (1)
Defense & Government Services Historical M&A Activity U.S. Deal Volume – Past 17 Years
$20,354
$16,593
$20,127
$5,687 $7,853
$18,535
$13,471
$23,783
$15,711
$6,400 $4,640
$16,276
$21,229
$6,075 $4,537
$24,278
$11,757
$1,095
$0
$5,000
$10,000
$15,000
$20,000
$25,000
$30,000
2000 2001 2002 2003 2004 2005 2006 2007 2008 2009 2010 2011 2012 2013 2014 2015 2016 2017YTDTotal Enterprise Value
($Millions)
Source: ThomsonOne.com. (1) Includes disclosed transactions equal to and over $100 million. Solely reflects transactions that have closed.
Total Transaction Volume (1)
21
14 15 14
19 16
20
31
14
10
16
29
11 13
7
13 12
2
0
5
10
15
20
25
30
35
40
2000 2001 2002 2003 2004 2005 2006 2007 2008 2009 2010 2011 2012 2013 2014 2015 2016 2017YTDNumber of Deals
TBU Include Mentor Graphics? Acquired by
Siemens for 4.3 bn, manufactures electronic systems for defense and
military customers
https://www.mentor.com/solutions/aerospace/electrical-systems-design-and-
harness-engineering/
7

Jefferies LLC April 2017 /
Selected Defense & Government Services Recent M&A Activity
Key Points
Budget pressure previously slowed M&A activity over the past several years
However, M&A activity has seen a strong comeback as of recent, driven by enhanced visibility via the FY ‘18 DoD Budget Request and robust financing markets
Recent Transactions
Announced Acquirer Target Transaction Value ($M)
EV / LTM EBITDA
Description
Mar 2017 $235 NA Provides technology-based systems, solutions, and services for national security agencies and programs of the U.S. government
Mar 2017 150 NA
Offers defense products ranging from high power and multi-color laser systems for aircraft protection to wearable/battery operated/multi-spectral beacons to prevent fire incidents
Feb 2017 3,597 9.0x Provides earth-imagery, data, and analysis in the United States and internationally
Feb 2017 NA NA
Develops and markets electromagnetic metal forming technology, magnetic processing of metals and ceramic powders, power distribution systems, and electrical and mechanical engineering solutions
Feb 2017 NA NA Provides professional security services in the United States and offers armed and unarmed security guard services, as well as administrative staffing services
Jan 2017 690 NA Provides information technology and engineering managed services to government agencies
($Millions)
Government Services
Source: SEC filings and company websites.
8

Jefferies LLC April 2017 /
Selected Key Developments in Q1 2017
Company Announcement
• January 1, AeroVironment appoints Teresa Covington to succeed Raymond Cook as Chief Financial Officer
• January 3, Engility appoints John Barter to Board of Directors
• January 26, KeyW announces an offering of 8,500,000 shares of common stock at $10.50 per share
• March 2, Kratos announces an offering of 10,350,000 shares of common stock at $7.25 per share
• January 26, Mercury announces an offering of 6,000,000 shares of common stock at $33.00 per share
• January 18, Raytheon appoints retired United States Navy Admiral James A. “Sandy” Winnefeld Jr. to Board of Directors
Source: SEC filings and company websites.
9
Jefferies LLC April 2017 /
Commercial Aerospace Update
10

Jefferies LLC April 2017 /
Q1 2017 Commercial Aerospace Quarter in Review
Industry Dynamics
Despite political instability and an uncertain economic backdrop in some parts of the world, YTD air passenger demand continues to accelerate, rising by 9.6% in January 2017 over 2016 levels, signaling the strongest increase in more than 5 years
─ Near record high load factors of 80.2% reported in January 2017
─ Recovery of air freight markets, with 6.9% growth in freight ton kilometers over January 2016
IATA’s latest forecast estimates $29.8 billion in global industry profits in 2017E as compared to $35.6 billion in 2016 and $35.3 billion in 2015
─ 2016 profits were the highest profits and margin (5.1%) generated by the airline industry to date
Public Market Performance
Public valuations in sector remained robust, continuing the momentum following the November elections, but remained below cyclicals highs experienced in H1 2015
─ Structures comparables are trading at 7.5x TEV / Forward EBITDA, below 2016 year end value of 8.6x
─ Services comparables are trading at 11.5x TEV / Forward EBITDA, below the 10 year high of 11.8x
─ Electro-Mechanical comparables are trading at 11.1x TEV / Forward EBITDA, below year to date high of 12.0x
─ Diversified Industrial / Aero comparables are trading at 11.2x, in line with the 2016 year end value of 10.4x
Companies actively seeking acquisitions to continue to consolidate and take advantage of premium public market valuations
Mergers & Acquisitions
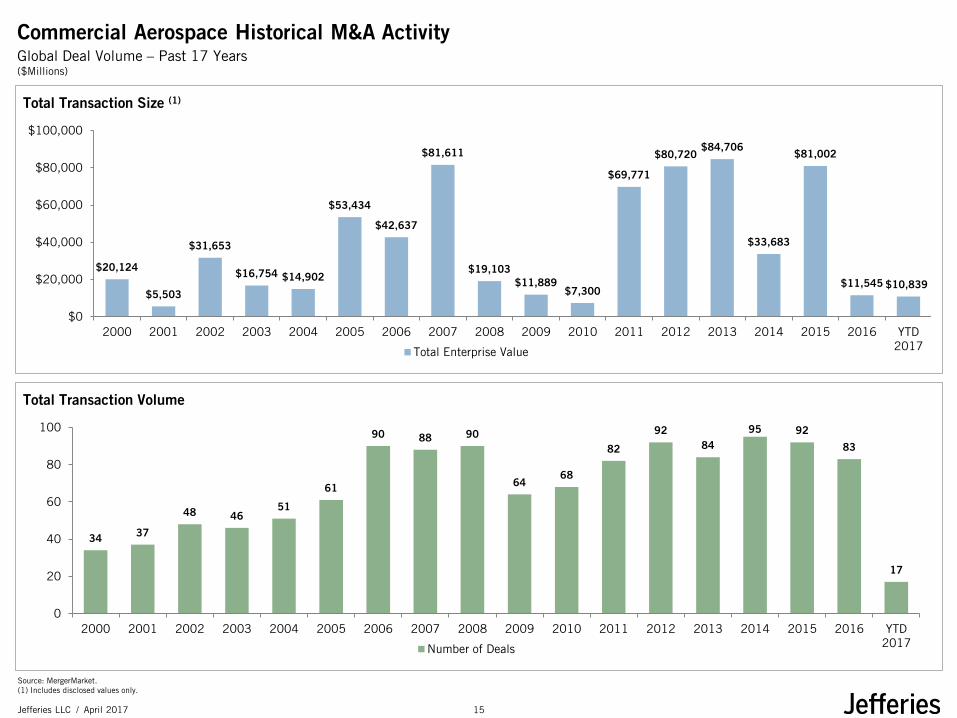
M&A activity continued in the first quarter of 2017
─ 17 acquisitions were announced in the global aerospace market from January – March 2017
─ Majority of these transactions were for undisclosed values with the exception of a small number of larger acquisitions of publicly traded aerospace companies
Following an active 2016 where most transactions were below $250 million in enterprise value, the first quarter of 2017 has seen a number of transformative deals in the sector
─ The most notable transactions include Safran SA’s €9,344 million acquisition of Zodiac Aerospace and Sonaca Group’s $428 million acquisition of LMI Aerospace, Inc.
Sonaca Group’s acquisition is expected to close mid-2017, while Safran SA’s acquisition faces mounting shareholder resistance, exacerbated by Zodiac’s recent profit warning
Consolidation in the airframe and engine structure manufacturing sector has remained a key driver of M&A for the past 5+ years with interest in aviation services including MRO and testing services picking up significant momentum recently
Continue to see significant scarcity value for commercial aerospace assets of scale – larger transactions have resulted in highly competitive auctions and premium valuations
Source: Capital IQ. Market data as of March 31, 2017.
11

Jefferies LLC April 2017 /
10-year TEV / Forward EBITDA
2.0x
4.0x
6.0x
8.0x
10.0x
12.0x
14.0x
Apr-07 Apr-08 Apr-09 Apr-10 Apr-11 Apr-12 Apr-13 Apr-14 Apr-15 Apr-16
Structures Services Electro-Mechanical Diversified Industrial / Aero S&P 500
11.5x
11.0x
7.5x
(1) (2) (3)
Sector Valuations Remain Near Cyclical Highs
Source: Capital IQ. Note: Market data as of March 31, 2017. Indexes are calculated on a market capitalization weighted basis. (1) Structures includes Barnes, GKN, Hexcel, Senior, Spirit, and Triumph Group. (2) Services includes AAR, BBA Aviation, CAE, Heico, KLX and Wesco. (3) Electro-Mechanical includes Astronics, Esterline, Meggitt, Moog and TransDigm. (4) Diversified Industrials/Aero includes Ametek, Curtiss-Wright, Eaton, Honeywell, Parker, Textron, United Technologies and Woodward.
11.1x
(4)
11.2x
3 Month Median
1 Year Median
3 Year Median
5 Year Median
Structures 7.5x 7.0x 7.4x 7.3x
Services 11.4x 10.6x 10.1x 9.9x
Electro-Mechanical 11.6x 11.8x 11.7x 11.2x
Diversified Industrial / Aero 11.1x 10.5x 10.1x 9.9x
S&P 500 10.9x 10.6x 10.3x 9.4x
12

Jefferies LLC April 2017 /
20.0x
18.9x
15.4x
12.1x
5.6x
10.6x
13.7x
34.1x
16.4x
15.5x
9.7x
19.6x
21.8x
18.0x
17.5x
17.7x
18.1x
15.9x
18.3x
12.3x
17.6x
22.2x
21.6x
16.7x
17.8x
20.7x
20.9x
17.1x
18.3x
19.5x
0.6x
0.6x
0.6x
(0.0x)
(0.1x)
0.3x
0.4x
1.0x
(0.5x)
(0.2x)
(1.3x)
0.4x
(0.2x)
(0.2x)
(0.4x)
(1.3x)
(0.6x)
(1.2x)
(0.0x)
(0.6x)
(0.6x)
1.0x
(0.2x)
0.8x
0.7x
(1.0x)
(1.0x)
0.2x
0.2x
0.2x
Commercial Aerospace Valuation
Source: Capital IQ. Note: Market data as of March 31, 2017.
11.3x
10.8x
8.7x
6.7x
6.2x
6.2x
7.7x
16.9x
12.0x
11.3x
9.4x
9.2x
8.2x
10.3x
12.4x
10.1x
9.7x
9.6x
9.5x
9.4x
9.7x
13.5x
13.1x
12.1x
11.9x
11.1x
10.5x
10.3x
9.8x
11.5x
1.1x
1.4x
2.3x
0.0x
(0.2x)
0.3x
0.7x
3.9x
1.4x
(0.0x)
(3.2x)
1.5x
0.9x
1.2x
(2.4x)
0.8x
(0.5x)
(0.6x)
0.8x
(0.4x)
(0.5x)
2.4x
0.7x
1.4x
1.3x
1.2x
(1.3x)
0.4x
1.7x
1.2x
CY 2017E EV / EBITDA Change Since 12/31/2016 CY 2017E P / E Change Since 12/31/2016
Median:
Median:
Median:
Median:
TBU Market data
Str
uctu
res
Ser
vice
s D
iver
sifie
d In
dust
rial
s E
lect
ro-M
echa
nica
l
TBU Market data, old data is already set to properly
calculate delta
13

Jefferies LLC April 2017 /
97.6%
98.8%
80.4%
92.1%
64.2%
95.8%
93.9%
98.0%
96.7%
85.3%
72.3%
98.1%
86.8%
91.7%
74.8%
97.3%
89.2%
77.3%
92.2%
91.8%
90.5%
97.5%
94.0%
99.4%
97.9%
99.4%
84.8%
98.1%
93.4%
97.7%
98.6%
Commercial Aerospace Stock Price Performance
Source: Capital IQ. Note: Market data as of March 31, 2017.
$54.55
$51.34
$2.58
$57.92
$25.75
$4.55
$87.20
$3.81
$44.70
$11.40
$15.25
$33.63
$220.16
$97.16
$86.05
$31.73
$67.35
$5.58
$54.08
$67.92
$74.15
$124.87
$160.32
$91.26
$112.21
$47.59
6.0%
8.3%
6.1%
(0.7%)
(2.8%)
9.5%
6.1%
13.0%
7.5%
(0.9%)
(23.7%)
8.2%
1.8%
4.6%
(11.6%)
4.7%
(3.5%)
(6.2%)
2.5%
(2.9%)
(3.2%)
11.3%
(1.6%)
10.5%
7.8%
14.5%
(7.2%)
2.4%
(2.0%)
5.1%
5.5%
Stock Price Close % of 52 Week High YTD Performance
S&P 500
Median:
Median:
Median:
Median:
TBU Market data, add WESCO
Str
uctu
res
Ser
vice
s D
iver
sifie
d In
dust
rial
s E
lect
ro-M
echa
nica
l S
&P
14
Jefferies LLC April 2017 /
Total Transaction Size (1)
Commercial Aerospace Historical M&A Activity Global Deal Volume – Past 17 Years
$20,124
$5,503
$31,653
$16,754 $14,902
$53,434
$42,637
$81,611
$19,103 $11,889
$7,300
$69,771
$80,720 $84,706
$33,683
$81,002
$11,545 $10,839
$0
$20,000
$40,000
$60,000
$80,000
$100,000
2000 2001 2002 2003 2004 2005 2006 2007 2008 2009 2010 2011 2012 2013 2014 2015 2016 YTD2017Total Enterprise Value
($Millions)
Source: MergerMarket. (1) Includes disclosed values only.
Total Transaction Volume
34 37
48 46 51
61
90 88 90
64 68
82
92 84
95 92
83
17
0
20
40
60
80
100
2000 2001 2002 2003 2004 2005 2006 2007 2008 2009 2010 2011 2012 2013 2014 2015 2016 YTD2017Number of Deals
15
Jefferies LLC April 2017 /
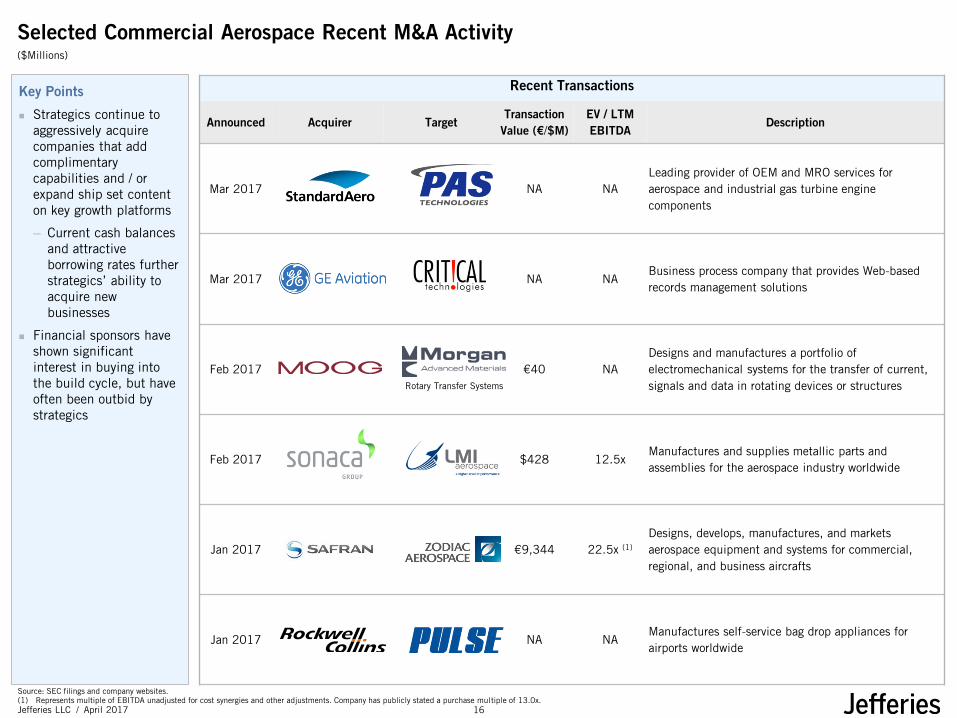
Selected Commercial Aerospace Recent M&A Activity
Key Points
Strategics continue to aggressively acquire companies that add complimentary capabilities and / or expand ship set content on key growth platforms
─ Current cash balances and attractive borrowing rates further strategics’ ability to acquire new businesses
Financial sponsors have shown significant interest in buying into the build cycle, but have often been outbid by strategics
Recent Transactions
Announced Acquirer Target Transaction
Value (€/$M) EV / LTM EBITDA
Description
Mar 2017 NA NA Leading provider of OEM and MRO services for aerospace and industrial gas turbine engine components
Mar 2017 NA NA Business process company that provides Web-based records management solutions
Feb 2017 €40 NA Designs and manufactures a portfolio of electromechanical systems for the transfer of current, signals and data in rotating devices or structures
Feb 2017 $428 12.5x Manufactures and supplies metallic parts and assemblies for the aerospace industry worldwide
Jan 2017 €9,344 22.5x (1) Designs, develops, manufactures, and markets aerospace equipment and systems for commercial, regional, and business aircrafts
Jan 2017 NA NA Manufactures self-service bag drop appliances for airports worldwide
($Millions)
Rotary Transfer Systems
Source: SEC filings and company websites. (1) Represents multiple of EBITDA unadjusted for cost synergies and other adjustments. Company has publicly stated a purchase multiple of 13.0x.
16

Jefferies LLC April 2017 /
Company Announcement
• March 7, Ametek appoints Thomas Amato to Board of Directors
• March 1, BBA Aviation Group Finance Director Mike Powell has announced his resignation and will be replaced by David Crook, effective June 1
• March 20, HEICO’s Board of Directors approved a 5-for-4 stock split on both its Class A Common Stock and Common Stock, marking the Company’s 15th stock split or stock dividend since 1995
• February 9, Hexcel’s Board of Directors authorized the repurchase an additional $300 million of the Company’s stock in addition to the remaining $93 million under the authorized share repurchase program
• February 24, TransDigm announces $300 million additional issuance to existing 6.50% Senior Subordinated Notes due 2025
• January 1, Textron appoints Ralph D. Heath to Board of Directors
• February 16, Woodward appoints Eileen P. Drake and Daniel G. Korte to Board of Directors • January 30, Woodward announces Board of Directors has authorized a new stock repurchase program up to $500
million
Selected Key Developments in Q1 2017
Source: SEC filings and company websites.
17

Jefferies LLC April 2017 /
Equity Market Conditions
18

Jefferies LLC April 2017 /
Sector Performance (1)
U.S. Equity Market Overview
Key Points
U.S. equity markets have traded at new or near all-time highs post election fueled by large inflows into equity funds and low volatility
Investors are focused on re-positioning sector weightings towards Industrials and Materials stocks with a focus on:
─ Size and pace of incremental infrastructure spend
─ Impact of deficit spending on interest rates
─ Details on fiscal policy changes at the individual and corporate level
─ Impact on global trade and labor markets
U.S. Sector Fund Flows continue to favour the industrials sector, comprising $17.5 billion since election
U.S. Fund Flows Volatility Measurements
S&P Sectors – LTM
S&P Sectors – Since Election
10.0
12.0
14.0
16.0
18.0
20.0
22.0
24.0
26.0
28.0
M A M J J A S O N D J F M A
VIX
Inde
x Va
lue
Volatility Remains Low VIX: 12.4
LTM Cumulative Fund Flows ($bn)
($100)
($50)
$0
$50
$100
M A M J J A S O N D J F M
Sector Fund Flows Since Election ($bn)
$22.4 $19.8
$17.5 $14.3
$10.3 $10.1
$0
$10
$20
$30
FIG TMT Industrials Consumer Energy Healthcare
U.S. Fund Flows 2017: $48.4
6%
7%
10%
12%
14%
15%
20%
24%
26%
27%
28%
0% 10% 20% 30%
Healthcare
Real Estate
Cons. Stpls
Telecom
Energy
Cons. Disc
Utilities
Industrials
Financials
Materials
Technology
1%
4%
5%
5%
7%
10%
12%
12%
12%
14%
19%
0% 5% 10% 15% 20% 25%
Energy
Cons. Stpls
Real Estate
Utilities
Telecom
Healthcare
Cons. Disc
Industrials
Materials
Technology
Financials
(1) S&P 1500 sectors
Source: CapIQ. Bloomberg, EPFR.
“Trump Bump” Favors Industrials & Materials
Materials & Industrials Consistently Remain in
the Best Performing Sectors LTM
19

Jefferies LLC April 2017 /
U.S. Industrials Equity Market Backdrop
Source: Dealogic. CapIQ. Bloomberg. (1) Excludes transactions less than $20.0 million.
Key Points
U.S. Industrials equity indices and fund flows have surged in 2017 as investors pour into construction / building, energy and metals & mining sectors
─ Trump administration pledges to boost infrastructure investment and relax the regulatory environment
Macroeconomic indicators strengthening:
─ PMI is up ~16% yoy and is the highest level reading since 2014
─ Industrial production and manufacturing output recovering
12 of the 14 Industrials sub-sectors are up this year
─ Maritime leads as shipping charter rates improve
─ Energy firms have not picked up capital expenditures, pushing oil field services stocks down
Solid equity issuance in first three months of the year
─ 2017 IPO issuance already 66% of 2016 on a deal value basis
U.S. Industrials Equity Issuance ($bn)
Industrials Sub-Sector Performance Year-to-date
U.S. Industrial Production & Equity Fund Flows
S&P 1500 Industrials Performance & Valuation
10.0x
12.0x
14.0x
16.0x
18.0x
20.0x
(10%)
(5%)
0%
5%
10%
15%
20%
25%
30%
35%
2014 2015 2016 2017
Price Performance Forward P/E
14.1%
12.2%
8.1%
8.0%
6.8%
4.6%
3.9%
3.4%
2.2%
2.2%
1.2%
1.1%
(1.1%) (9.4%)
(20%) (10%) 0% 10% 20%
Maritime
Distribution
Power & Renewables
Building Products
Chemicals
Aero / Def
Diversified Industrials
Construction & Engineering
Metals & Mining
Services
Paper & Packaging
Auto / Truck
Transportation
Oilfield Services
(1.5%)
(1.0%)
(0.5%)
0.0%
0.5%
1.0%
1.5%
2.0%
2.5%
3.0%
3.5%
($12)
($10)
($8)
($6)
($4)
($2)
$0
$2
$4
$6
$8
2014 2015 2016 2017
Equity Fund Flows
Industrial Production 9.0 5.8 3.9 2.6
27.7 28.2
21.8
6.1
11.6
3.7
4.5
2.4
$0
$10
$20
$30
$40
$50
2014 2015 2016 2017
Convert Follow-on IPO
20

Jefferies LLC April 2017 /
Debt Market Conditions
21
Jefferies LLC April 2017 /
4.00%
5.00%
6.00%
7.00%
8.00%
9.00%
10.00%
11.00%
Dec
-15
Jan-
16
Feb-
16
Mar
-16
Apr
-16
May
-16
Jun-
16
Jul-1
6
Aug
-16
Sep
-16
Oct
-16
Nov
-16
Dec
-16
Jan-
17
Feb-
17
Mar
-17
HY BB HY B
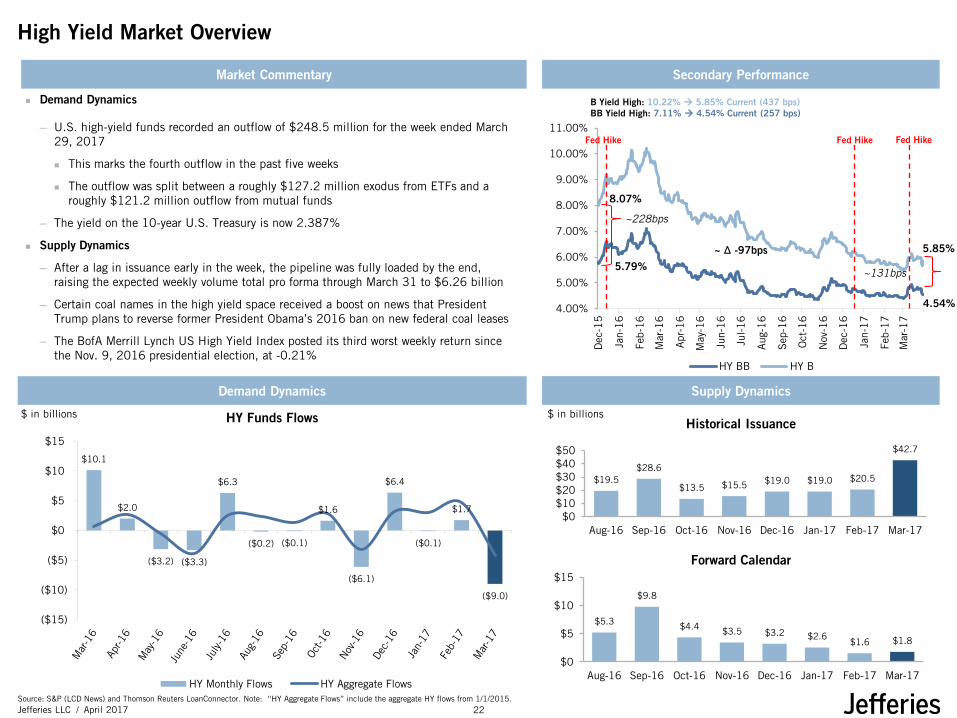
High Yield Market Overview
Demand Dynamics Supply Dynamics
$ in billions
Demand Dynamics
─ U.S. high-yield funds recorded an outflow of $248.5 million for the week ended March 29, 2017
This marks the fourth outflow in the past five weeks
The outflow was split between a roughly $127.2 million exodus from ETFs and a roughly $121.2 million outflow from mutual funds
─ The yield on the 10-year U.S. Treasury is now 2.387%
Supply Dynamics
─ After a lag in issuance early in the week, the pipeline was fully loaded by the end, raising the expected weekly volume total pro forma through March 31 to $6.26 billion
─ Certain coal names in the high yield space received a boost on news that President Trump plans to reverse former President Obama’s 2016 ban on new federal coal leases
─ The BofA Merrill Lynch US High Yield Index posted its third worst weekly return since the Nov. 9, 2016 presidential election, at -0.21%
$ in billions
Market Commentary Secondary Performance
5.85%
4.54%
HY Funds Flows
~228bps
~131bps
8.07%
5.79%
Historical Issuance
Forward Calendar
~ ∆ -97bps
B Yield High: 10.22% 5.85% Current (437 bps) BB Yield High: 7.11% 4.54% Current (257 bps)
Fed Hike
Fed Hike
Fed Hike
$10.1
$2.0
($3.2) ($3.3)
$6.3
($0.2) ($0.1)
$1.6
($6.1)
$6.4
($0.1)
$1.7
($9.0)
($15)
($10)
($5)
$0
$5
$10
$15
HY Monthly Flows HY Aggregate Flows
$19.5 $28.6
$13.5 $15.5 $19.0 $19.0 $20.5
$42.7
$0$10$20$30$40$50
Aug-16 Sep-16 Oct-16 Nov-16 Dec-16 Jan-17 Feb-17 Mar-17
$5.3
$9.8
$4.4 $3.5 $3.2 $2.6 $1.6 $1.8
$0
$5
$10
$15
Aug-16 Sep-16 Oct-16 Nov-16 Dec-16 Jan-17 Feb-17 Mar-17
Source: S&P (LCD News) and Thomson Reuters LoanConnector. Note: “HY Aggregate Flows” include the aggregate HY flows from 1/1/2015. 22

Jefferies LLC April 2017 /
L + 250
L + 350
L + 450
L + 550
L + 650
L + 750
L + 850
BB Yield B Yield
$ in billions
Leveraged Loan Market Overview
Supply Dynamics
Demand Dynamics
─ Fueled by the continued flood of cash into loan funds, institutional investors once again dominated the U.S. leveraged loan market in the first quarter, accounting for 89% of primary issuance
─ U.S. Leveraged loan funds saw a net inflow of $516.3 million for the week ended March 29, 2017
─ S&P LCD B-rated corporate index yield has declined 291 bps since reaching a high of L + 728 on February 12, 2016
Supply Dynamics
─ A market starved for new supply is getting little help from mergers and acquisitions. Institutional loan volume backing acquisitions, including LBOs, totaled around $17 billion in March
That’s up from $13.9 billion in February but is well off the blistering $37.4 billion tallied in January
─ There was $98.6 billion of institutional loan volume rated B or lower during the first three months of 2017, a four-year high, good for 67% of overall institutional volume
Market Commentary Secondary Performance
$ in billions
Demand Dynamics
Forward Calendar
L + 270
~220 bps
~167 bps
~ ∆ -53 bps
L + 645
L + 425
L + 437
B Yield High: L + 728 L + 437 Current (291 bps) BB Yield High: L + 446 L + 270 Current (175 bps)
Fed Hike
Historical Issuance
$1.7
$2.2
$5.7
$3.8 $3.6
$4.0
$0.0
$2.0
$4.0
$6.0
Past Six Months’ Loan Flows
<< UPDATE MONDAY (and 3rd bullet)
Fed Hike
Remember to move Fed Hike lines as months
move Fed Hike
$5.6
$6.4
$8.0
$4.5
$0.8
$2.2
$4.8
$7.1
$5.9
$14.3
$6.6
$0.5
$6.1
$9.2
$0.0
$2.0
$4.0
$6.0
$8.0
$10.0
$12.0
$14.0
$16.0YoY CLO Creation
Prior Year CLO Creation Current Year CLO Creation
$54.1 $45.9
$76.2
$39.8
$64.5
$125.6 $102.8 $99.0
$0
$50
$100
$150
Aug-16 Sep-16 Oct-16 Nov-16 Dec-16 Jan-17 Feb-17 Mar-17
$33.5
$52.5 $43.3 $44.0
$29.8 $25.4
$30.4 $31.9
$0
$20
$40
$60
Aug-16 Sep-16 Oct-16 Nov-16 Dec-16 Jan-17 Feb-17 Mar-17
Source: S&P (LCD News) and Thomson Reuters LoanConnector. 23
Jefferies LLC April 2017 /
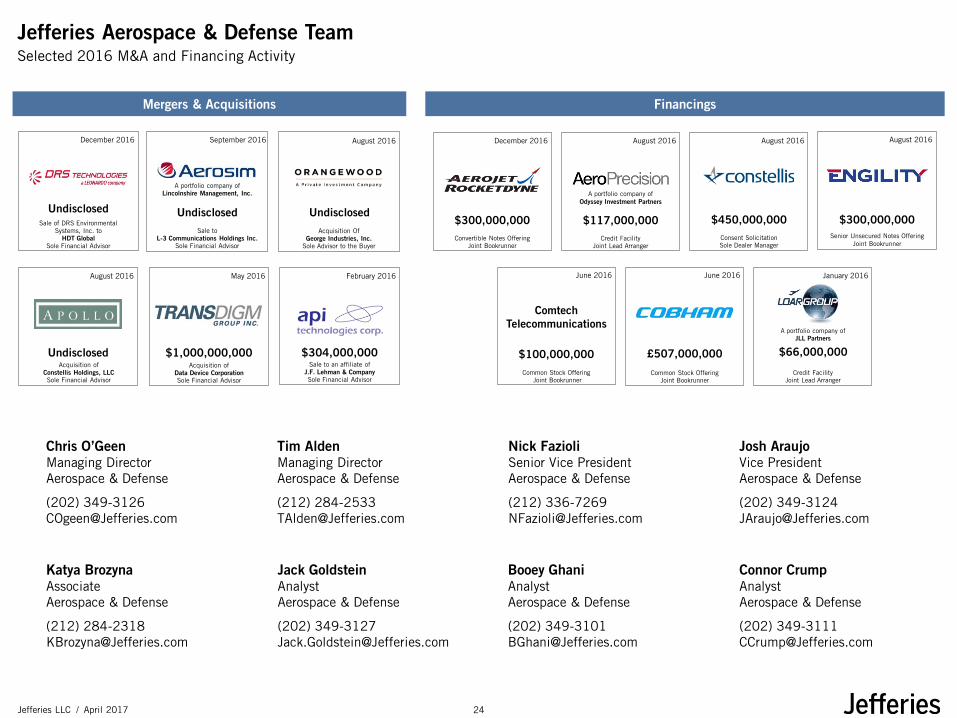
Jefferies Aerospace & Defense Team Selected 2016 M&A and Financing Activity
Nick Fazioli Senior Vice President Aerospace & Defense
(212) 336-7269 [email protected]
Josh Araujo Vice President Aerospace & Defense
(202) 349-3124 [email protected]
Chris O’Geen Managing Director Aerospace & Defense
(202) 349-3126 [email protected]
Tim Alden Managing Director Aerospace & Defense
(212) 284-2533 [email protected]
Katya Brozyna Associate Aerospace & Defense
(212) 284-2318 [email protected]
Jack Goldstein Analyst Aerospace & Defense
(202) 349-3127 [email protected]
Booey Ghani Analyst Aerospace & Defense
(202) 349-3101 [email protected]
Connor Crump Analyst Aerospace & Defense
(202) 349-3111 [email protected]
Mergers & Acquisitions
Sale to an affiliate of J.F. Lehman & Company Sole Financial Advisor
February 2016
$304,000,000 Acquisition of
Data Device Corporation Sole Financial Advisor
May 2016
$1,000,000,000
August 2016
Undisclosed Acquisition of
Constellis Holdings, LLC Sole Financial Advisor
Sale to L-3 Communications Holdings Inc.
Sole Financial Advisor
September 2016
Undisclosed
A portfolio company of Lincolnshire Management, Inc.
August 2016
Acquisition Of George Industries, Inc.
Sole Advisor to the Buyer
Undisclosed
January 2016
Credit Facility Joint Lead Arranger
$66,000,000
A portfolio company of JLL Partners
Common Stock Offering Joint Bookrunner
June 2016
£507,000,000
Common Stock Offering Joint Bookrunner
June 2016
$100,000,000
August 2016
Senior Unsecured Notes Offering Joint Bookrunner
$300,000,000
Credit Facility Joint Lead Arranger
August 2016
A portfolio company of Odyssey Investment Partners
$117,000,000
August 2016
$450,000,000 Consent Solicitation Sole Dealer Manager
Convertible Notes Offering Joint Bookrunner
December 2016
$300,000,000 Sale of DRS Environmental Systems, Inc. to
HDT Global Sole Financial Advisor
December 2016
Undisclosed Financings
Sale to an affiliate ofJ.F. Lehman & CompanySole Financial Advisor
February 2016
$304,000,000Acquisition of
Data Device CorporationSole Financial Advisor
May 2016
$1,000,000,000
August 2016
UndisclosedAcquisition of
Constellis Holdings, LLCSole Financial Advisor
Sale toL-3 Communications Holdings Inc.
Sole Financial Advisor
September 2016
Undisclosed
A portfolio company of Lincolnshire Management, Inc.
August 2016
Acquisition OfGeorge Industries, Inc.
Sole Advisor to the Buyer
UndisclosedSale of DRS Environmental
Systems, Inc. to HDT Global
Sole Financial Advisor
December 2016
Undisclosed
Comtech Telecommunications
January 2016
Credit FacilityJoint Lead Arranger
$66,000,000
A portfolio company ofJLL Partners
Common Stock OfferingJoint Bookrunner
June 2016
£507,000,000
Common Stock OfferingJoint Bookrunner
June 2016
$100,000,000
August 2016
Senior Unsecured Notes OfferingJoint Bookrunner
$300,000,000Credit Facility
Joint Lead Arranger
August 2016
A portfolio company ofOdyssey Investment Partners
$117,000,000
August 2016
$450,000,000Consent Solicitation Sole Dealer Manager
Convertible Notes OfferingJoint Bookrunner
December 2016
$300,000,000
ComtechTelecommunications
24