q1 2020 results - dangote cement
TRANSCRIPT

Q1 2020 resultsUNAUDITED RESULTS FOR THE THREE MONTHS ENDED 31ST MARCH 2020
27th MAY 2020
www.dangotecement.com@dangotecement

Q1 2020 PerformanceFinancial
• Group revenue up 3.8%, supported by higher volumes and realised prices in Nigeria
• Group EBITDA up 2.2%, due to strong operating performance in Pan-Africa
• Pan-Africa EBITDA up 23.4%, with a record high EBITDA margin of 20.9%
• Profit before tax up 11.5% YoY
• EPS up 1.7% to ₦3.6
Operational
• Group volumes flat at 6.3Mt despite first impact
of COVID-19 at the end of March
• Nigeria volumes up 0.7% - domestic growth compensates the absence of exports
• Pan-Africa sales slightly affected in the last week of March owing to COVID-19 lockdown in South Africa from 27 March
• Ghana and Congo began lockdown from 30 March. In Nigeria, lockdown of Lagos state, Abuja and Ogun state started from 31 March
• Resilient Q1 2020 results amid early impacts of COVID-19
Investor PresentationDangote Cement | Page 2
Three months ended 31st March 2020 2019 Change
Cement volumes ‘000t ‘000t %
Nigeria 4,018 3,991 0.7%
Pan-Africa 2,280 2,347 (2.9%)
Total 6,298 6,338 (0.6%)
Revenues ₦m ₦m
Nigeria 179,336 169,885 5.6%
Pan-Africa 69,846 70,272 (0.6%)
Inter-company sales - -
Total 249,182 240,157 3.8%
EBITDA ₦m ₦m
Nigeria 103,365 103,380 0.0%
Pan-Africa 14,627 11,854 23.4%
Inter-company and central costs (3,769) (3,473) 8.5%
Total 114,223 111,761 2.2%
EBITDA margin*
Nigeria 57.6% 60.9% (3.3pp)
Pan-Africa 20.9% 16.9% 4.0pp
Group 45.8% 46.5% (0.7pp)
• *Before central costs and eliminations

Three months to 31st March
2020 2019
₦m ₦m % change
Revenue 249,182 240,157 3.8%
Cost of sales (104,325) (99,478) 4.9%
Gross profit 144,857 140,679 3.0%
Gross margin 58.1% 58.6% (0.5pp)
EBITDA 114,223 111,761 2.2%
EBITDA margin 45.8% 46.5% (0.7pp)
EBIT 91,779 88,382 3.8%
EBIT margin 36.8% 36.8% 0.0pp
Finance income 5,290 2,286 (131.4%)
Finance cost (9,012) (11,708)
Profit before tax 88,057 78,960 11.5%
Income tax (expense)/credit (27,465) (18,706)
Profit for the period 60,592 60,254 0.6%
Earnings per share 3.60 3.54 1.7%
Group Financial Overview
Investor PresentationDangote Cement | Page 3
Income Statement

Q1 2020 EBITDA Development
Investor PresentationDangote Cement | Page 4
103.4
114.215.9
1.3 3.8
0.0
20.0
40.0
60.0
80.0
100.0
120.0
140.0
Nigeria Profitable Pan-African Non profitable Pan-Africa Central costs Total
Pan-African operations have
delivered their highest ever
quarterly EBITDA contributions at
NGN 14.6 B
Profitability (₦bn)
Group Financial Overview (cont’d)
Investor PresentationDangote Cement | Page 5
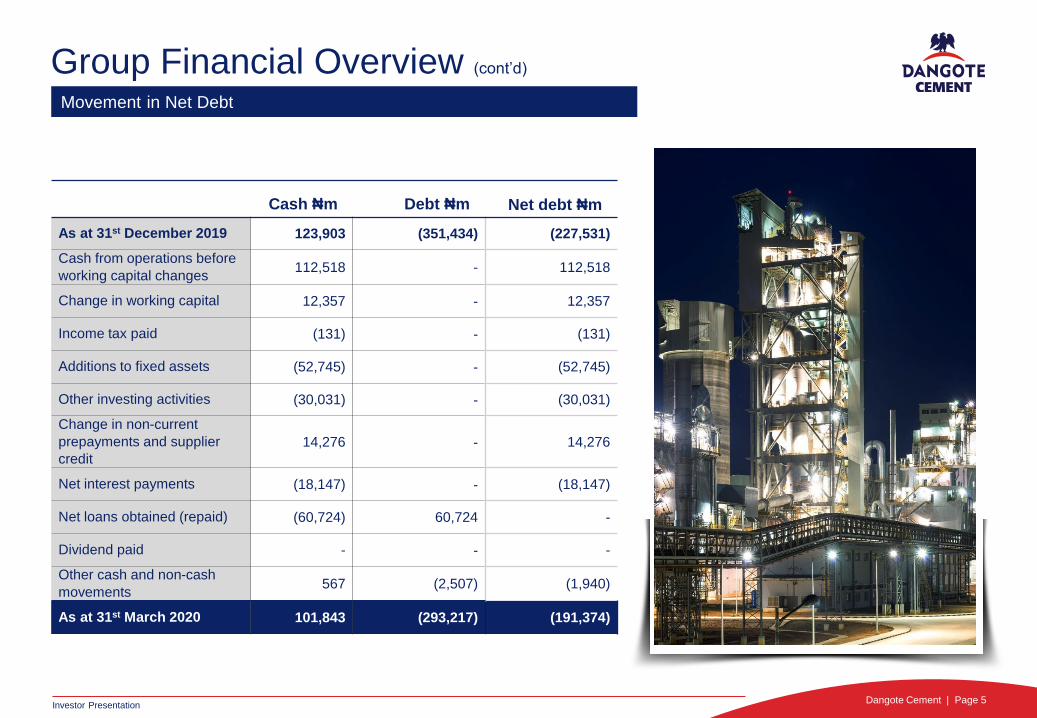
Cash ₦m Debt ₦m Net debt ₦m
As at 31st December 2019 123,903 (351,434) (227,531)
Cash from operations before
working capital changes112,518 - 112,518
Change in working capital 12,357 - 12,357
Income tax paid (131) - (131)
Additions to fixed assets (52,745) - (52,745)
Other investing activities (30,031) - (30,031)
Change in non-current
prepayments and supplier
credit
14,276 - 14,276
Net interest payments (18,147) - (18,147)
Net loans obtained (repaid) (60,724) 60,724 -
Dividend paid - - -
Other cash and non-cash
movements 567 (2,507) (1,940)
As at 31st March 2020 101,843 (293,217) (191,374)
Movement in Net Debt

Group Financial Overview (cont’d)
Investor PresentationDangote Cement | Page 6
As at 31/3/20
₦m
As at 31/12/19
₦m
Property, plant and equipment 1,239,382 1,206, 749
Other non-current assets 119,258 124,203
Intangible Assets 4,554 3,663
Current Assets 332,577 282,833
Cash and Cash Equivalents 101,843 123,903
Total Assets 1,797,614 1,741,351
Non-current liabilities 118,061 105,341
Current liabilities 437,841 386,639
Debt 293,217 351,434
Total Liabilities 849,119 843,414
Net Assets 948,495 897,937
Balance Sheet

Robust Capital Structure (includes bond issuance)
• Including the ₦100B bond issuance, DCP has a total debt of ₦393B.
• The short portion of DCPs debt (₦230B) is 59% of total debt.
• In addition to a strong operating cash flow, DCP also has over ₦300B head room with existing CP and bond programs to fund growth and eventually refinance short term debt.
• Including the bond issuance, DCPs debt to equity ratio is 42% (from 31% in Q1 2020), strengthening its capital structure.
• DCP has limited foreign currency debt exposure, with just 24% of total debt exposed to the dollar.
Investor PresentationDangote Cement | Page 7
In April, DCP successfully completed the issuance of ₦100B Series 1 5-year Bond. The transaction was 1.5 times oversubscribed and represents DCPs debut bond issuance.
192.6 230.0
100.0
46.7
49.2 4.7
163
0
100
200
300
400
Bank loan Bond Commercialpaper
Relatedparties
Power fund Total debt
Diverse Capital Structure, ₦B
Long term
Short term115
2355
47
38
100
0
50
100
150
200
2020 2021 2022 2023 2024 2025
Debt Maturity Profile, ₦B
Bank debt Commercial paper Related parties Bond Power intervention
300
100
150
47
Approved debt programme Draw down
Head Room to Fund Growth, ₦B
Bond Commercial Paper
₦303B
head room

• On 23 January 2020, Global Credit Ratings affirmed the long term and short-term national scale issuer ratings of AA+(NG) and A1+(NG) respectively, assigned to DCP, with the outlook accorded as stable.
• On 24 March 2020, Moody’s:
assigned a (P)B2 local currency rating and Aa3.ng national
scale rating (NSR) to the NGN300 billion domestic
medium-term note program issued by DCP.
affirmed DCP's B1 corporate family rating (CFR) and
Aa2.ng NSR. The rating outlook is negative, similar to that
of the sovereign.
Investor PresentationDangote Cement | Page 8
Facility Pricings Draw down Tenor
₦300B Bond Issuance
Programme12.5% ₦100B 2025
₦150B Commercial Paper
Programme7.5%-8% ₦47B 2019
Bank debt various ₦193B 2020-2022
Related parties 7%-15% ₦49B 2020-2022
Power intervention fund 7% ₦5B 2021
Total ₦393B
LENDING DIVERSIFICATION RATINGS
Robust Capital Structure (includes bond issuance)

Nigeria – Highest Quarterly Revenue
Investor PresentationDangote Cement | Page 9
Volumes (000’t)
Recorded the highest Q1 volume in
the last four years of 4.0Mt, despite
the absence of land exports.
Revenue (₦B)Record high revenue of ₦179B
supported by strong volumes and
higher pricing.
4,018 179
1Q201Q191Q181Q171Q201Q191Q181Q17
170
174
152
3,969
3,991
3,770
Three months ended 31st
March 2020 2019 Change
Volumes* (Kt) 4,018 3,991 0.7%
Revenue* (₦m) 179,336 169,885 5.6%
EBITDA* (₦m) 103,365 103,380 0.0%
EBITDA margin* 57.6% 60.9% (3.3pp)
* Before corporate costs and inter-company eliminations
• Strongest quarter over the last four years in terms of
volumes
• Q1 volumes up 0.7% YoY to 4.0Mt
• Excluding Q1 2019 exports, volumes were up 5% YoY
• Sales impact due to COVID-19 lockdown commenced in
key states on 31 March
• Strong EBITDA at ₦103.4B, with a margin of 57.6%

Pan-Africa – Record High EBITDA Margin• Sales volumes down 1.4% to 2.3Mt; revenues
relatively flat at ₦69.8B
• Lockdown in South Africa affected volumes at the end of March
• Record high EBITDA of ₦14.6B, supported by strong performance in Ethiopia and Senegal
• Record high EBITDA margin of 21%
• Volume growth in 6 of our 9 operations; strong volume growth in Congo and Sierra Leone
• 34% price improvement in Zambia
• Cash cost reduction in Ethiopia and Ghana
• Technical issues in Tanzania reduced volumes
Investor PresentationDangote Cement | Page 10
Three months ended 31st
March 2020 2019 Change
Volumes** sold (Kt) 2,316 2,350 (1.4%)
Revenue (₦m) 69,846 70,272 (0.6%)
EBITDA* (₦m) 14,627 11,854 23.4%
EBITDA margin 20.9% 16.9% 4.0pp
• *Before corporate costs and eliminations
• **Including clinker volumes
13%
15%
17%17%
21%
10%
12%
14%
16%
18%
20%
22%
FY16 FY17 FY18 FY19 1Q20
EBITDA margin trend
Record high
EBITDA margin

Country Updates
Dangote Cement | Page 11
• Estimated 820Kt total
market sales for Q1 2020
• DCP sales of 312Kt for Q1
2020, up 4% compared to
Q1 2019
• 38% market share for the
period
CAMEROON
• Estimated 186Kt total
market sales for Q1 2020
• DCP Congo sold 74Kt of
cement, a 25% increase
compared to Q1 2019
• 40% market share for the
period
• Lockdown due to COVID-19
began on 30 March and
was extended to 10 May.
CONGO
• Estimated 2.0Mt total
market sales for Q1 2020
• DCP sales of 557Kt for Q1
2020, up 6% compared to
Q1 2019
• 28% market share for the
period
• Improved plant performance
ETHIOPIA
Investor Presentation

Country Updates
Dangote Cement | Page 12
• Estimated 1.7Kt total
market sales for Q1 2020
• DCP Ghana sold 124Kt of
cement, a 6% increase
compared to Q1 2019
• 7% market share for the
period
• Lockdown due to COVID-19
began on 30 March and
was lifted on 19 April
GHANA
• Estimated 1.9Mt total
market sales for Q1 2020
• DCP sales of 407Kt for Q1
2020, up 5.4% compared to
Q1 2019
• 21% market share for the
period
SENEGAL
• Estimated 182Kt total
market sales for Q1 2020
• DCP sales of 67Kt for Q1
2020, up 15% compared to
Q1 2019
• 37% market share for the
period
SIERRA LEONE
Investor Presentation

Country Updates
Dangote Cement | Page 13
• Negative growth in cement
market due to a negative
growth in the South African
economy.
• DCP SA 1Q 2020 sales
were 1% lower year on year
• Total lockdown due to
COVID-19 in the last week
of March resulted in a loss
of sales.
SOUTH AFRICA
• Estimated 1.4Mt total
market sales for Q1 2020
• DCP sales (including
clinker) of 244Kt for Q1
2020, down 13% compared
to Q1 2019
• Production challenges
encountered reduced daily
production in Q1.
• 17% market share for the
period
• High rainfall made raw-
materials handling difficult
TANZANIA
• DCP sales of 134Kt for Q1
2020, down 39% compared
to Q1 2019
• 27% market share for the
period
• The economy entered
in recession in Q1. The
cement market dropped by
25% - 30% in Q1 2020
ZAMBIA
Investor Presentation

Sustainability & Governance
Investor PresentationDangote Cement | Page 14
SOCIAL
Stakeholder (communities and employees)
engagements to revalidate identified ESG
Material Indicators obtained from 2019
Sustainability surveys.
ENVIRONMENTAL
Completed an ESG Benchmarking Assessment of
DCP Environmental performance relative to
peers.
OPERATIONAL
Deployment of ESG Data Management System for
the collection and analysis of ESG data across the 7
Dangote Sustainability Pillars.
INSTITUTIONAL
Completion of United Nations
Global Compact 2020
Communication in Progress.
FINANCIAL
Delivered a resilient financial performance
in Nigeria and Pan-Africa in the quarter.
ECONOMIC
Completed the Socioeconomic Impact
Assessment (SIA) study of DCP operations
in 4 countries (Nigeria, South Africa,
Ethiopia & Senegal).
CULTURALTrained all DCP Sustainability leads and procurement teams
across our Nigeria & Pan Africa operations on Building a
Sustainable Business Culture.
The Dangote Way
Our 7 Sustainability Pillars support our unique approach to creating a world-class enterprise.
2019 Sustainability Report would be certified by the Global Reporting Initiative (GRI) and Externally Assured.
ESG impact

OutlookCOVID-19
• We have proactively deployed recommended measures to protect the health and well-being of our employees, customers, suppliers and communities. We are monitoring key dimensions of our operations in order to mitigate negative financial impact. We are closely controlling our capital expenses, working capital needs and fixed costs to maintain strong and resilient cash positions
• Given full lockdown in South Africa, Ghana, Congo and some parts of Nigeria from the end of March, April volumes were trending lower than the volumes and values realised during the same period last year.
• Ghana lifted its lockdown partially on 19 April, while Nigeria lifted its lockdown partially on 4 May. All other businesses remain fully operational and continue to supply customers while supporting measures required to protect all stakeholders.
• We are continuously assessing the impact of the COVID-19 pandemic on our business.
CAPITAL STRUCTURE
• Share buyback has been approved by SEC. We will review the opportunity to deploy this programme in due time.
• CP Programme: attractive short-term rates lead to full drawdown of the ₦150B in Q2
EXPORT STRATEGY
• This year we will begin exporting clinker via ports from Nigeria to West and Central Africa.
Investor PresentationDangote Cement | Page 15
Obajana integrated plant in Kogi, Nigeria
1.5Mt integrated plant in Congo

Investor RelationsContactsFor further information contact:
Temi AdurojaHead, Investor Relations
Dangote Cement Plc
+44 207 399 3070
www.dangotecement.com@dangotecement