q1 2021 quarterly report - miravo healthcare
TRANSCRIPT

Q1 2021
Quarterly Report
Nuvo Pharmaceuticals® Inc. d/b/a Miravo Healthcare™

1 | P a g e
Management’s Discussion and Analysis (MD&A) May 14, 2021 / The following information should be read in conjunction with Nuvo Pharmaceuticals Inc. d/b/a Miravo Healthcare (Miravo or the Company) Condensed Consolidated Interim Financial Statements for the three months ended March 31, 2021, which were prepared in accordance with International Financial Reporting Standards (IFRS) and International Accounting Standard (IAS) 34 - Interim Financial Reporting. Additional information about the Company, including the annual Consolidated Financial Statements and Annual Information Form (AIF) for the year ended December 31, 2020, can be found on SEDAR at www.sedar.com (under Nuvo Pharmaceuticals Inc.). Unless otherwise noted, all amounts in the MD&A, the Condensed Consolidated Interim Financial Statements and related Notes are expressed in thousands of Canadian dollars, except per share amounts. This MD&A contains “forward-looking information”. Please see the discussion under Forward-looking Statements below. The Company uses non-IFRS financial performance measures in this MD&A. For a detailed reconciliation of the non-IFRS measures used in this MD&A, please see the discussion under Non-IFRS Measures below.
Key Developments
Three months ended March 31, 2021 include the following:
• Adjusted total revenue(1) was $14.5 million, a decrease of 23% compared to $18.9 million for the three months ended March 31, 2020.
• Adjusted EBITDA(1) was $4.4 million, a decrease of 45% compared to $8.0 million for the three months ended March 31, 2020.
• Revenue related to Blexten® and Cambia® was $5.6 million, a decrease of 7% compared to revenue of $6.0 million for the three months ended March 31, 2020. Total Canadian prescriptions of Blexten and Cambia increased by 22% and 9% compared to the three months ended March 31, 2020.
• The Company repaid $3.6 million (US$2.9 million) of the Amortization Loan to Deerfield Management Company, L.P. (Deerfield).
• As at March 31, 2021, cash and cash equivalents were $23.8 million. (1) Non-International Financial Reporting Standards (IFRS) financial measure defined by the Company below.
Business Update
• As a result of the COVID-19 pandemic, the Company has made changes to operations to promote a healthy and
safe environment for its employees, while the business continues to supply global partners, wholesalers, pharmacies, and ultimately patients, with its healthcare products. The possibility of future supply disruptions resulted in forward buying linked to the COVID-19 pandemic, which increased revenue in the three months ended March 31, 2020. It is anticipated that the COVID-19 pandemic may continue to impact the timing of revenue in future quarters and the Company will monitor market dynamics accordingly.
• In April 2021, the Company filed and obtained a receipt for a final base shelf prospectus with the securities regulatory authorities in each of the provinces of Canada (the Prospectus). The Company has filed the Prospectus to maintain financial flexibility and to have the ability to offer the securities on an accelerated basis pursuant to the filing of prospectus supplements. The Prospectus is valid for a 25-month period, during which time the Company may offer and issue, from time-to-time, common shares, preferred shares, debt securities, warrants and subscription receipts, or any combination thereof, having an aggregate offering value of up to $40 million.

• In February 2021, Nuvo Pharmaceuticals (Ireland) DAC trading as Miravo Healthcare (Miravo Ireland) entered into an exclusive license and supply agreement (the License Agreement) with The Mentholatum Company for the right to commercialize the Resultz® formula and technology in the United States under the Mentholatum® brand. Miravo Ireland will earn revenue from The Mentholatum Company pursuant to the License Agreement. It is anticipated that The Mentholatum Company will launch Resultz during the summer of 2021. Resultz is currently manufactured by the Company's contract manufacturing partner in Europe.
• In January 2021, the Company launched NeoVisc® ONE 4 mL and NeoVisc® + 2 mL in Canada. Both NeoVisc+ and NeoVisc ONE were issued a Medical Device License by Health Canada in September 2020 for the treatment of pain and improvement of joint functionality in patients affected by degenerative (age-related changes) or mechanical arthropathy (related to overuse) of the knee.
• In January 2021, the Company’s exclusive partner for Pennsaid® 2% in Switzerland, Gebro Pharma AG (Gebro Pharma), launched the product into the Swiss market, generating net sales and related royalty revenue for Miravo.
Non-IFRS Financial Measures
The Company discloses non-IFRS measures (such as adjusted total revenue, adjusted EBITDA, adjusted EBITDA per share and cash value of loans) that do not have standardized meanings prescribed by IFRS. The Company believes that shareholders, investment analysts and other readers find such measures helpful in understanding the Company’s financial performance. Non-IFRS financial measures do not have any standardized meaning prescribed by IFRS and may not have been calculated in the same way as similarly named financial measures presented by other companies. These measures should be considered as supplemental in nature and not as a substitute for related financial information prepared in accordance with IFRS. Adjusted Total Revenue The Company defines adjusted total revenue as total revenue, plus amounts billed to customers for existing contract assets, less revenue recognized upon recognition of a contract asset. Management believes adjusted total revenue is a useful supplemental measure to determine the Company’s ability to generate cash from its customer contracts used to fund its operations. The following is a summary of how adjusted total revenue is calculated:
Adjusted total revenue was $14.5 million for the three months ended March 31, 2021 compared to $18.9 million for the three months ended March 31, 2020. The $4.4 million decrease in adjusted total revenue in the current quarter was primarily attributable to a decrease of $2.3 million of revenue in the Licensing and Royalty Business segment, combined with a decrease of $1.8 million in the Commercial Business segment and a decrease of $0.3 million of revenue from the Production and Service Business segment. For the three months ended March 31, 2021, the decrease in the Licensing and Royalty Business segment was primarily due to a $2.2 million decrease of the royalty earned on U.S. net sales of Vimovo due to a competitor launching a generic version of Vimovo in March 2020. During the three months ended March 31, 2021, the Company received a royalty of 10% based on U.S. net sales of Vimovo. In subsequent quarters, this royalty is anticipated to decrease to 5% of U.S. net sales of Vimovo due to a royalty step-down provision in Miravo Ireland’s license agreement with Horizon Therapeutics plc that is anticipated to be triggered as a result of continued generic competitor market share gains. In the current
Three Months ended
March 31, 2021 Three Months ended
March 31, 2020
$ $
Total revenue 14,422 24,361
Add:
Amounts billed to customers for existing contract assets 127 48
Deduct:
Revenue recognized upon recognition of a contract asset - (5,496)
Adjusted total revenue 14,549 18,913

quarter, the strengthening of the Canadian dollar against the U.S. dollar reduced the contribution from certain U.S. denominated royalty streams by $0.2 million compared to the comparative quarter. Adjusted total revenue attributable to the Commercial Business segment declined during the three months ended March 31, 2021, as an increase in sales related to certain promoted products was more than offset by a decline in revenue from the segment’s mature products. During the comparative quarter, the possibility of future supply disruptions resulted in forward buying linked to the COVID-19 pandemic, which increased revenue in the Company’s Commercial Business segment in the three months ended March 31, 2020. The Production and Service Business segment revenue decreased primarily due to a decline in the Company’s Resultz product sales, as well as a strengthening of the Canadian dollar against the U.S. dollar, which decreased the value of U.S. denominated sales by $0.1 million compared to the three months ended March 31, 2020. Adjusted EBITDA EBITDA refers to net income (loss) determined in accordance with IFRS, before depreciation and amortization, net interest expense (income) and income tax expense (recovery). The Company defines adjusted EBITDA as EBITDA, plus amounts billed to customers for existing contract assets, inventory step-up expenses, stock-based compensation expense, Other Expenses (Income), less revenue recognized upon recognition of a contract asset and other income. Management believes adjusted EBITDA is a useful supplemental measure to determine the Company’s ability to generate cash available for working capital, capital expenditures, debt repayments, interest expense and income taxes. The following is a summary of how EBITDA and adjusted EBITDA are calculated:
(1) The Company’s derivative liabilities are measured at fair value through profit or loss at each reporting date. As a result of the increase in the
share price in the current quarter and an increase in the volatility of the Company’s shares, amongst other inputs, the value of the Company’s derivative liabilities increased and the Company recognized a net non-cash $18.4 million loss on the change in fair value of derivative liabilities for the three months ended March 31, 2021.
Adjusted EBITDA was $4.4 million for the three months ended March 31, 2021 compared to $8.0 million for the three months ended March 31, 2020. The decrease in the current quarter was primarily attributable to a decrease in gross profit and an increase in sales and marketing expenses, slightly offset by a decrease in general and administrative (G&A) expenses.
Three Months ended
March 31, 2021 Three Months ended
March 31, 2020
$ $
Net income (loss) (17,989) (1,729)
Add back:
Income tax expense 256 1,382
Net interest expense 2,586 3,100
Depreciation and amortization 2,076 2,349
EBITDA (13,071) 5,102
Add back:
Amounts billed to customers for existing contract assets 127 48
Stock-based compensation 105 105
Deduct:
Revenue recognized upon recognition of a contract asset - (5,496)
Other Expenses (Income):
Change in fair value of derivative liabilities(1) 18,389 2,417
Change in fair value of contingent and variable consideration (gain) (616) 2,129
Foreign currency loss (gain) (714) 4,697
Inventory step-up 35 362
Other gains (losses) 96 (1,374)
Adjusted EBITDA 4,351 7,990

Adjusted EBITDA Per Common Share The Company defines adjusted EBITDA per common share as adjusted EBITDA divided by the average number of issued and outstanding common shares of the Company as follows:
Adjusted EBITDA per common share was $0.38 for the three months ended March 31, 2021 compared to adjusted EBITDA per common share of $0.70 for the three months ended March 31, 2020.
Cash Value of Loans The Company’s long-term debt is carried at amortized cost in accordance with IFRS. The Deerfield Loans were initially measured at fair value using a discounted cash flow model that considers the present value of contractual cash flows using a risk-adjusted discount rate. As the Company revises its estimated future contractual cash flows it will adjust the gross carrying amount of the amortized cost of a financial liability to reflect actual and revised estimated contractual cash flows. The Company defines cash value of loans as the total sum of money borrowed under the Deerfield Facility Agreement less any payments to date. Cash value of loans does not consider fair value discounting when describing the Company’s outstanding debt. Management believes cash value of loans is a useful supplemental measure to describe the debt outstanding under the Deerfield Facility Agreement. The following is a summary of how cash value of loans is calculated as at March 31, 2021:
March 31, 2021 December 31, 2020
$US Amortization
Loan Convertible
Loan Amortization
Loan Convertible
Loan
Total long-term debt 38,231 41,621 40,426 41,042
IFRS present value adjustment (interest and principal) 5,587 10,879 6,254 11,458
Cash Value of Loans 43,818 52,500 46,680 52,500
CDN$ Amortization
Loan Convertible
Loan Amortization
Loan Convertible
Loan
Total long-term debt 48,075 52,339 51,453 52,244
IFRS present value adjustment (interest and principal) 7,026 13,680 7,980 14,599
Cash Value of Loans 55,101 66,019 59,433 66,843
During the three months ended March 31, 2021, the Company repaid $3.6 million (US$2.9 million) of the Amortization Loan to Deerfield reducing its cash value of loans outstanding to $121.1 million (US$96.3 million). Since the inception of the Deerfield Financing on December 31, 2018, the Company has repaid US$22.2 million towards the Deerfield Loans.
The Company’s Business
Miravo is a publicly traded, Canadian healthcare company with global reach and a diversified portfolio of prescription and non-prescription products. Miravo’s head office is located in Mississauga, Ontario, Canada, its international operations are headquartered in Dublin, Ireland and its manufacturing facility is located in Varennes, Québec, Canada. The Varennes facility operates in a Good Manufacturing Practices (GMP) environment respecting the U.S., Canada and E.U. GMP regulations and is regularly inspected by Health Canada and the U.S. Food and Drug Administration (FDA).
Three Months ended
March 31, 2021 Three Months ended
March 31, 2020
$ $
Adjusted EBITDA 4,351 7,990
Adjusted EBITDA per common share 0.38 0.70
Average number of common shares outstanding (in thousands) - basic 11,388 11,388

As at March 31, 2021, the Company employed a total of 102 full-time employees across its manufacturing facility in Varennes, Québec, corporate office, Commercial Business in Mississauga, Ontario and international headquarters in Dublin, Ireland.
Global Presence
Intellectual Property The Company protects its intellectual property by means of a combination of patents, data exclusivity, trademarks, rights, licenses, non-disclosure agreements and contractual provisions. Miravo currently holds over one hundred patents in a number of jurisdictions and has several patent applications pending. Additionally, the Company holds commercial licenses and cross-licenses to access third-party intellectual property. Operating Segments The Company has three operating segments: Commercial Business, Production and Service Business and Licensing and Royalty Business. Commercial Business The Commercial Business segment is comprised of products commercialized by the Company in Canada. This segment includes the Company’s promoted products - Blexten, Cambia, Suvexx and NeoVisc, as well as a number of mature assets. The Company sells its products to wholesalers who in turn supply retail and hospital pharmacies across Canada. The Company’s promoted products are primarily prescribed by Canadian healthcare professionals, including neurologists, pain and migraine specialists, dermatologists, allergists, primary care physicians, prescribing pharmacists and nurse practitioners, which the Company’s in-house commercial team calls on and supports through various educational and product detailing activities. The mature assets are prescribed to treat patients across a broad range of therapeutic areas, including pain management, cardiology, urology, gastroenterology, antihyperlipidemic/metabolic agents, dermatology and various non-prescription medicines. These mature assets receive no or minimal promotional support, and in some cases, have lost market exclusivity and now compete with generic alternatives.
Products generating revenue Products partnered Unpartnered

The Company’s approved products related to the Commercial Business segment are as follows:
Distributed by Miravo in Canada
Product Description Product Description
Second-generation antihistamine for the treatment of seasonal allergies and urticaria (hives).
Treatment of mild to moderate acute migraine with or without aura in adults 18 years and older.
Treatment of moderate to severe acute migraine with or without aura in adults.
Viscosupplementation for knee osteoarthritis
Pesticide-free topical treatment of head lice infestations.
Once daily treatment for patients with high cholesterol or high levels of triglycerides.
Relief for tension-type headaches.
Instillation for the treatment of mild to severe GAG layer damage of the urinary bladder.
Indicated for the cleansing of the colon in preparation for colonoscopy.
Once daily treatment for psoriasis and other keratinization disorders.
Laxative for the treatment of occasional constipation and, irregularity.
Fully resorbable, antibiotic, collagen “haemostat” for surgical implantation during surgery to reduce the risk of surgical site infections.
Probiotic for the management and relief of chronic constipation and associated abdominal pain and cramps
Iron supplement for the prevention and treatment of iron deficiency.
1. Products are available in Canada and not promoted in any capacity
Production and Service Business The Production and Service Business segment includes revenue from the sale of products manufactured by Miravo from its manufacturing facility in Varennes, Québec or contracted by Miravo Ireland from its international headquarters in Dublin, Ireland, as well as service revenue for testing, development and related quality assurance and quality control services provided by the Company. Key revenue streams in this segment, include Pennsaid 2%, Pennsaid and the bulk drug product for the Heated Lidocaine/Tetracaine (HLT) Patch, as well as ad hoc service agreements for testing, development and related quality assurance and quality control services. The Company currently supplies Pennsaid 2% to Horizon for the U.S. market and to Gebro Pharma for the Swiss market, and is actively engaged in ongoing partnering efforts for Pennsaid 2% in the rest of the world. The Company will continue to focus on identifying license partners for Resultz in key unpartnered territories around the world, which has the potential to increase production revenue. Miravo believes its Production and Service Business segment has continued growth potential, as Miravo has the in-house capabilities and capacity to produce Pennsaid 2% and Resultz for new license partners. Licensing and Royalty Business The Licensing and Royalty Business segment includes the revenue generated from the licensing of the intellectual property and the ongoing royalties received under these exclusive licensing agreements. The Company’s Licensing and Royalty Business segment revenue is primarily generated from:
• Net sales of Vimovo in the U.S. through the Company’s partner Horizon;
• Net sales of Vimovo in various ex-U.S. markets, including Europe, Canada and South America by the Company’s partner Grunenthal GmbH (Grunenthal);
• Net sales of Resultz in select European markets by the Company’s various European license partners (See table below for full details);
• Net sales of Cabpirin related to the licensing of the Company’s Yosprala intellectual property in the Japanese market; and

• Net sales of Pennsaid 2% in Swtizerland by the Company’s partner Gebro.
The Company’s out-licensing efforts for Pennsaid 2%, Resultz, Suvexx and Yosprala are targeted on all markets that remain unlicensed with a particular focus on Europe, the Middle East and Asia. The Company enters into exclusive, long-term licensing agreements with strategic partners in specific geographies. Miravo believes its Licensing and Royalty Business segment has growth potential, as Pennsaid 2%, Resultz and Suvexx are protected by patents that provide licensees with market exclusivity and protection from generic competition, as well as favourable product profiles (See Commercial Products below). The Company’s approved products related to the Production and Service Business and Licensing and Royalty Business are segmented as follows:
Product Description Segments Licensee or Distributor Territories
Pesticide-free topical treatment of head lice infestations.
Production and Service Business Licensing and Royalty Business
Fagron Belgium NV Heumann Pharma GmbH & Co. Generica KG Reckitt Benckiser (Brands) Limited Sato Pharmaceutical Co., Ltd. The Mentholatum Company
Treatment of acute migraine
Licensing and Royalty Business
Currax Holdings USA LLC Orion Corporation
Topical treatment of osteoarthritic pain in a more convenient format.
Production and Service Business Licensing and Royalty Business
Horizon Therapeutics plc Paladin Labs Inc.. Sayre Therapeutics PVT Ltd
Gebro Pharma AG
Topical treatment of osteoarthritic pain.
Production and Service Business Licensing and Royalty Business
Paladin Labs Inc. Vianex S.A. Recordati S.p.A.
Oral treatment for relief of arthritis symptoms with a reduced risk of developing gastric ulcers.
Licensing and Royalty Business
Horizon Therapeutics plc Grunenthal GmbH
Topical patch used to help prevent pain associated with needle sticks and other superficial skin procedures.
Licensing and Royalty Business Production and Service Business
Galen US Incorporated Eurocept International B.V.
Once daily treatment to help in the prevention of heart attacks and strokes with a reduced risk of developing gastric ulcers.
Licensing and Royalty Business
Genus Lifesciences Inc. Takeda Pharmaceutical Company Limited
Instillation for the treatment of mild to severe GAG layer damage of the urinary bladder.
Licensing and Royalty Business
Aspire Pharmaceuticals
Growth Strategy The Company intends to further expand its Canadian and international businesses through continued organic growth of existing products, targeted in-licensing and acquisition opportunities, which leverage the Company’s in-house commercial, scientific and manufacturing infrastructure and out-licensing of distribution rights for Miravo’s proprietary products - Pennsaid 2%, Resultz, Suvexx and Yosprala in global markets. The Company plans to continue to build on its commercial presence in Canada and will look to utilize a network of license and distribution partners for its products in global markets. The Company targets global and regional pharmaceutical companies that have therapeutic area expertise and established commercial infrastructure as potential license and distribution partners.

To achieve its strategic objectives, the Company focuses on leveraging its competitive advantages through its in-house capabilities:
• Attracting, developing, pursuing and consummating transactions to in-license or acquire accretive, growth-oriented products;
• Creating intellectual property portfolios that provide defense against generic threats;
• Launching new products in Canada;
• Managing complex relationships with regulators to register new products in Canada, the U.S., Europe and other global markets; and
• Developing innovative processes to enhance the quality and efficiency of manufacturing operations.
Products
Commercial Products Products Commercialized by Miravo in Canada Blexten Blexten is a second-generation antihistamine drug for the symptomatic relief of allergic rhinitis and chronic spontaneous urticaria. Blexten exerts its effect through its highly selective inhibition of peripheral histamine H1 receptors and has an efficacy comparable to cetirizine and desloratadine. In comparative studies, Blexten demonstrated somnolence rates similar to placebo representing a potentially non-sedating effect at therapeutic doses. It was developed in Spain by Faes Farma, S.A. (Faes). Bilastine, (the active ingredient in Blexten), is approved in Canada and over 100 countries worldwide, including Japan and most European countries. In 2014, Miravo entered into an exclusive license and supply agreement with Faes for the exclusive right to sell bilastine in Canada, which is sold under the brand name Blexten. The exclusive license is inclusive of prescription and non-prescription rights for Blexten, as well as adult and pediatric presentations in Canada. In April 2016, Health Canada approved Blexten (bilastine 20 mg oral tablet) for the treatment of the symptoms of seasonal allergic rhinitis and chronic spontaneous urticaria (such as itchiness and hives). Blexten was commercially launched in Canada in December 2016. Miravo is contracted to pay additional milestone payments of approximately €0.3 million and $0.8 million to Faes if certain sales targets or other milestone events are achieved over the life of the license and supply agreement term. Cambia Cambia (diclofenac potassium for oral solution) is a patent protected, nonsteroidal anti-inflammatory drug (NSAID) and is currently the only prescription NSAID approved and available in Canada for the acute treatment of migraine with or without aura in adults 18 years of age or older. In 2010, Miravo signed a license agreement with Nautilus Neurosciences, Inc. (Nautilus) for the exclusive rights to develop, register, promote, manufacture, use, distribute, market and sell Cambia in Canada. Since 2011, three separate amendments to the license agreement have been executed. The license was assigned by Nautilus to Depomed, Inc. (Depomed) in December 2013. Depomed has subsequently been renamed Assertio Therapeutics Inc. The Company pays a tiered royalty on net sales of Cambia and future sales-based milestone payments of up to US$5.3 million may be payable over time. Cambia was approved by Health Canada in March 2012 and was commercially launched to specialists in Canada in October 2012 and broadly to all primary care physicians in February 2013. Suvexx Suvexx (sumatriptan/naproxen sodium) is a patent protected migraine medicine that was developed by POZEN, Inc. (POZEN) in collaboration with Glaxo Group Limited, d/b/a GSK (GSK). The product is formulated with POZEN's patented technology (originally acquired by Miravo as part of the Aralez Transaction on December 31, 2018) of combining a triptan, sumatriptan 85 mg, with an NSAID, naproxen sodium 500 mg and GSK's RT Technology in a single tablet. The Company received Health Canada approval for Suvexx in the first quarter of 2020 and the product was commercially launched in Canada in September 2020. NeoVisc Line Extension In January 2020, Miravo closed a licensing transaction bringing new line extensions to the NeoVisc Canadian business. NeoVisc is an injectable viscosupplement used by orthopedic surgeons, sports medicine physicians and

healthcare practitioners to replenish synovial fluid in the joints of patients with osteoarthritis. NeoVisc ONE is a low single-dose injection volume (4 mL) viscosupplement. The reduction of injection volume makes administration of NeoVisc ONE easier for healthcare professionals and more comfortable for patients. Neovisc+ consists of a three (2 mL) injection dosing regimen that is administered to a patient over the course of a three week period. Both NeoVisc ONE and NeoVisc+ were issued a Medical Device License by Health Canada in September 2020. The new and improved NeoVisc formats were launched in Canada in January 2021. Mature Assets Commercialized by Miravo in Canada The Commercial business also consists of a number of mature assets including the Canadian business for Resultz®,
Bezalip® SR, Proferrin®, Fiorinal®1, Fiorinal® C1, Collatamp® G, PegaLAX®, Mutaflor®, MoviPrep®, Uracyst® and Soriatane™.
1. Products are available in Canada and not promoted in any capacity
Fiorinal On October 30, 2019, Miravo received an amended application for authorization to institute a class action against a group of 34 defendants, including Miravo, that manufacture, market, and/or distribute opioids in Québec. The claim is for $30, plus interest for compensatory damages for each class member, $25.0 million from each defendant for punitive damages and pecuniary damages for each class member. The proposed class is all natural persons in Québec who have been prescribed and consumed any one or more of the opioids manufactured, marketed, distributed and/or sold by the defendants between 1996 and the present day and who suffer or have suffered from opioid use disorder. The proposed class includes any direct heirs of any deceased persons who met the above-description and excludes certain persons subject to a prior settlement agreement. The amended application is currently pending before the Superior Court in the Province of Québec. The Company believes that the claim is without merit and intends to vigorously defend the matter. Products Out-licensed and/or Manufactured by Miravo
Pennsaid 2% Pennsaid 2% is a follow-on product to original Pennsaid (described below). Pennsaid 2% is a topical pain product that combines a dimethyl sulfoxide (DMSO) based transdermal carrier with 2% diclofenac sodium. Pennsaid 2% is more viscous, is supplied in a metered dose pump bottle and has been approved in the U.S. and Switzerland for twice daily dosing compared to four times a day for original Pennsaid. This provides Pennsaid 2% with potential advantages over Pennsaid and other competitor products and with patent protection. Miravo owns the worldwide rights to Pennsaid 2%, excluding the U.S. rights owned by Horizon. United States Pennsaid 2% was approved on January 16, 2014 in the U.S. and launched by the Company’s then U.S. Pennsaid and Pennsaid 2% licensee, Mallinckrodt Inc. (Mallinckrodt) in February 2014 for the treatment of pain of osteoarthritis of the knee. In September 2014, the Company reached a settlement related to its litigation with Mallinckrodt. Under the terms of the settlement agreement, Mallinckrodt returned the U.S. sales and marketing rights to Pennsaid and Pennsaid 2% to Miravo. In October 2014, Miravo sold the U.S. rights to Pennsaid 2% to Horizon for US$45.0 million. Under the terms of this agreement, the Company earns revenue from the manufacturing and sale of Pennsaid 2% to Horizon. Miravo records revenue from Horizon when it ships Pennsaid 2% commercial bottles and product samples to Horizon for the U.S. market. The Company earns product revenue from Horizon pursuant to a long-term, exclusive supply agreement, as well as contract service revenue. Rest of World Gebro Pharma has the exclusive rights to register, distribute, market and sell Pennsaid 2% in Switzerland and Liechtenstein. In January 2020, Gebro Pharma received marketing authorization for Pennsaid 2% from Swissmedic, the overseeing Swiss regulatory authority. Gebro Pharma launched Pennsaid 2% in Switzerland in January 2021. The Company is eligible to receive milestone payments and royalties on net sales of Pennsaid 2% in Switzerland and Liechtenstein and will earn product revenue from the supply of Pennsaid 2% to Gebro Pharma on an exclusive basis from its manufacturing facility in Varennes, Québec. Unlicensed Territories The Company is currently pursuing Pennsaid 2% registration in Greece. The Company is preparing its regulatory dossier for Pennsaid 2% for submission to the Greek National Organization for Medicines (EOF) as a National procedure.
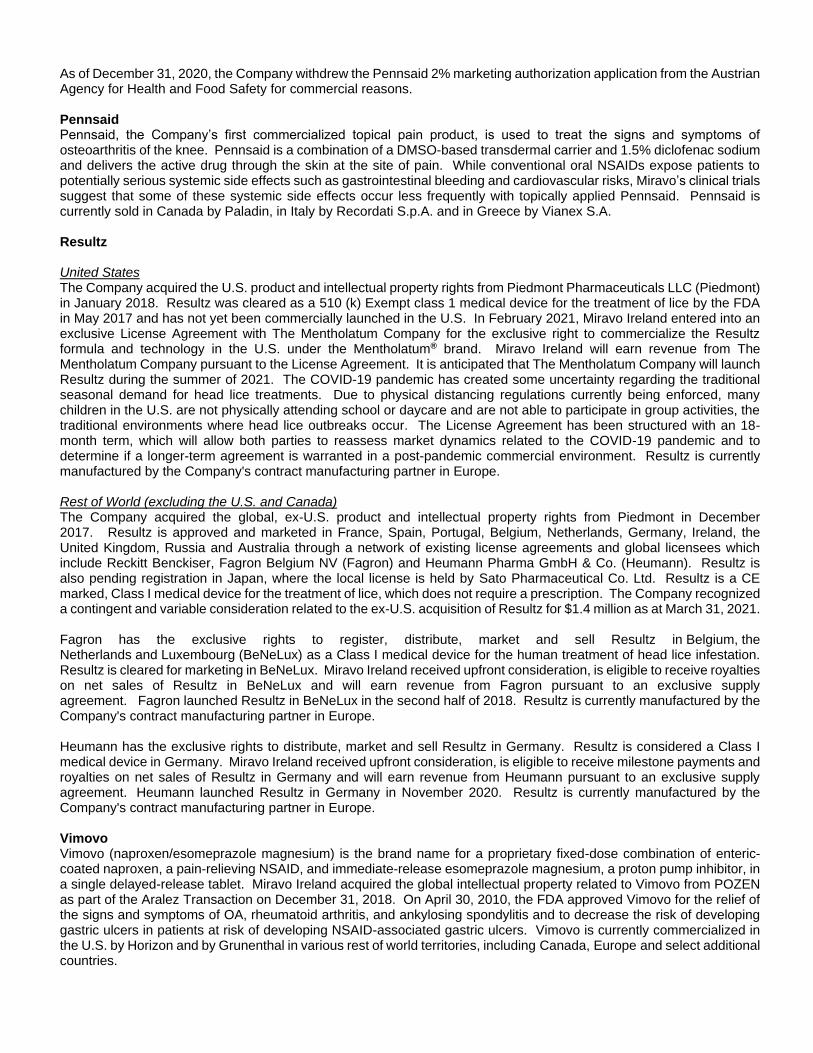
As of December 31, 2020, the Company withdrew the Pennsaid 2% marketing authorization application from the Austrian Agency for Health and Food Safety for commercial reasons. Pennsaid Pennsaid, the Company’s first commercialized topical pain product, is used to treat the signs and symptoms of osteoarthritis of the knee. Pennsaid is a combination of a DMSO-based transdermal carrier and 1.5% diclofenac sodium and delivers the active drug through the skin at the site of pain. While conventional oral NSAIDs expose patients to potentially serious systemic side effects such as gastrointestinal bleeding and cardiovascular risks, Miravo’s clinical trials suggest that some of these systemic side effects occur less frequently with topically applied Pennsaid. Pennsaid is currently sold in Canada by Paladin, in Italy by Recordati S.p.A. and in Greece by Vianex S.A. Resultz United States The Company acquired the U.S. product and intellectual property rights from Piedmont Pharmaceuticals LLC (Piedmont) in January 2018. Resultz was cleared as a 510 (k) Exempt class 1 medical device for the treatment of lice by the FDA in May 2017 and has not yet been commercially launched in the U.S. In February 2021, Miravo Ireland entered into an exclusive License Agreement with The Mentholatum Company for the exclusive right to commercialize the Resultz formula and technology in the U.S. under the Mentholatum® brand. Miravo Ireland will earn revenue from The Mentholatum Company pursuant to the License Agreement. It is anticipated that The Mentholatum Company will launch Resultz during the summer of 2021. The COVID-19 pandemic has created some uncertainty regarding the traditional seasonal demand for head lice treatments. Due to physical distancing regulations currently being enforced, many children in the U.S. are not physically attending school or daycare and are not able to participate in group activities, the traditional environments where head lice outbreaks occur. The License Agreement has been structured with an 18-month term, which will allow both parties to reassess market dynamics related to the COVID-19 pandemic and to determine if a longer-term agreement is warranted in a post-pandemic commercial environment. Resultz is currently manufactured by the Company's contract manufacturing partner in Europe. Rest of World (excluding the U.S. and Canada) The Company acquired the global, ex-U.S. product and intellectual property rights from Piedmont in December 2017. Resultz is approved and marketed in France, Spain, Portugal, Belgium, Netherlands, Germany, Ireland, the United Kingdom, Russia and Australia through a network of existing license agreements and global licensees which include Reckitt Benckiser, Fagron Belgium NV (Fagron) and Heumann Pharma GmbH & Co. (Heumann). Resultz is also pending registration in Japan, where the local license is held by Sato Pharmaceutical Co. Ltd. Resultz is a CE marked, Class I medical device for the treatment of lice, which does not require a prescription. The Company recognized a contingent and variable consideration related to the ex-U.S. acquisition of Resultz for $1.4 million as at March 31, 2021. Fagron has the exclusive rights to register, distribute, market and sell Resultz in Belgium, the Netherlands and Luxembourg (BeNeLux) as a Class I medical device for the human treatment of head lice infestation. Resultz is cleared for marketing in BeNeLux. Miravo Ireland received upfront consideration, is eligible to receive royalties on net sales of Resultz in BeNeLux and will earn revenue from Fagron pursuant to an exclusive supply agreement. Fagron launched Resultz in BeNeLux in the second half of 2018. Resultz is currently manufactured by the Company's contract manufacturing partner in Europe. Heumann has the exclusive rights to distribute, market and sell Resultz in Germany. Resultz is considered a Class I medical device in Germany. Miravo Ireland received upfront consideration, is eligible to receive milestone payments and royalties on net sales of Resultz in Germany and will earn revenue from Heumann pursuant to an exclusive supply agreement. Heumann launched Resultz in Germany in November 2020. Resultz is currently manufactured by the Company's contract manufacturing partner in Europe. Vimovo Vimovo (naproxen/esomeprazole magnesium) is the brand name for a proprietary fixed-dose combination of enteric-coated naproxen, a pain-relieving NSAID, and immediate-release esomeprazole magnesium, a proton pump inhibitor, in a single delayed-release tablet. Miravo Ireland acquired the global intellectual property related to Vimovo from POZEN as part of the Aralez Transaction on December 31, 2018. On April 30, 2010, the FDA approved Vimovo for the relief of the signs and symptoms of OA, rheumatoid arthritis, and ankylosing spondylitis and to decrease the risk of developing gastric ulcers in patients at risk of developing NSAID-associated gastric ulcers. Vimovo is currently commercialized in the U.S. by Horizon and by Grunenthal in various rest of world territories, including Canada, Europe and select additional countries.

United States Under the terms of the license agreement with Horizon, Miravo Ireland a royalty of 10% based on U.S. net sales of Vimovo. In subsequent quarters, this royalty is anticipated to decrease to 5% of U.S. net sales of Vimovo due a royalty step-down provision in Miravo Ireland’s license agreement with Horizon that is anticipated to be triggered due to continued generic competitor market share gains. A guaranteed minimum annual royalty payment of US$7.5 million (US$1.9 million per quarter) ceased when Dr. Reddy's Laboratories Inc. (Dr. Reddy’s) launched a generic version of Vimovo in the U.S. during the first quarter of 2020. Horizon’s royalty payment obligation with respect to Vimovo expires on the later of (a) the last to expire of certain patents covering Vimovo, and (b) ten years after the first commercial sale of Vimovo in the U.S. which occurred in 2010. Horizon and Miravo Ireland have reached litigation settlements with five other generic companies: (i) Teva Pharmaceuticals Industries Limited (formerly known as Actavis Laboratories FL, Inc., which itself was formerly known as Watson Laboratorie, Inc. - Florida) and Actavis Pharma, Inc. (collectively, Actavis Pharma) (ii) Lupin; (iii) Mylan Pharmaceuticals Inc., Mylan Laboratories Limited, and Mylan Inc. (collectively, Mylan); (iv) Ajanta Pharma Ltd. and Ajanta Pharma USA, Inc. (collectively, Ajanta); and (v) Anchen Pharmaceuticals, Inc. (Anchen). Certain of these settlement agreements include provisions allowing generic versions of Vimovo to enter the U.S. market as a consequence of Dr. Reddy’s launching their generic version of Vimovo in March 2020. When the Company acquired the Vimovo patents as part of the Aralez Transaction, the Company anticipated that the US$7.5 million (US$1.9 million per quarter) annual minimum royalty payments would cease in 2022. Dr. Reddy’s launch of a generic version of Vimovo in the U.S. is “at risk” to Dr. Reddy’s, as there is pending patent infringement litigation in the United States District Court for the District of New Jersey (the Court) against Dr. Reddy’s, involving issued U.S. Patent Nos. 8,858,996 and 9,161,920 (the ‘996 and ‘920 Patents) owned by Miravo Ireland that cover Vimovo. In this litigation, Dr. Reddy’s is arguing that these issued patents are invalid and unenforceable. In October 2020, Dr. Reddy’s filed a motion for summary judgment requesting that the Court find the ‘996 and ‘920 Patents invalid. The Court denied this motion in February 2021, and as a result, the pending litigation against Dr. Reddy’s involving the ‘996 and ‘920 Patents continues. It is anticipated that fact discovery will be completed in June 2021. A trial date has not yet been set by the Court. In the event Miravo Ireland’s patents are found by the Court to be valid and infringed, Miravo Ireland and Horizon may be entitled to damages from Dr. Reddy’s. Rest of World (excluding the U.S.) Grunenthal holds the rights to commercialize Vimovo outside of the U.S. and Japan and pays Miravo Ireland a 10% royalty on net sales. Grunenthal’s royalty payment obligation with respect to Vimovo expires on a country-by-country basis upon the later of (a) expiration of the last-to-expire of certain patent rights related to Vimovo in that country, and (b) ten years after the first commercial sale of Vimovo in such country. The royalty rate may be reduced to the mid-single digits in the event of a loss of market share as a result of certain competing products. Canada is the only country where a generic naproxen/esomeprazole magnesium product was approved and commercialized in 2017, prior to the Company purchasing this royalty stream. Suvexx/Treximet Suvexx/Treximet (sumatriptan/naproxen sodium) is a migraine medicine that was developed by POZEN in collaboration with GSK. The product is formulated with POZEN's patented technology (now owned by Miravo) of combining a triptan, sumatriptan 85 mg, with an NSAID, naproxen sodium 500 mg and GSK's RT Technology in a single tablet. United States In 2008, the FDA approved Treximet (the U.S. brand name) for the acute treatment of migraine attacks with or without aura in adults. Treximet is currently commercialized in the U.S. by Currax Holdings USA LLC. Rest of World (excluding the U.S.) Orion holds the exclusive license and supply agreement (the License Agreement) for the right to package, distribute, market and sell Suvexx in Finland, Sweden, Denmark, Norway, Poland, Hungary, Latvia, Lithuania and Estonia (the Territory). Orion will be responsible for obtaining and maintaining the marketing authorizations for Suvexx in the Territory and will also manage all Territory specific commercial activities. Orion’s marketing authorization application is currently under review by Fimea, the Finnish Medicines Agency. Miravo Ireland will receive up to €1.7 million in upfront consideration, regulatory and sales-based milestone payments, as well as royalties on net sales of Suvexx in the Territory and revenue pursuant to the supply of product. Suvexx is currently manufactured by the Company's contract manufacturing partner in the U.S.

Yosprala Yosprala is currently the only prescription fixed-dose combination of aspirin (acetylsalicylic acid), an anti-platelet agent, and omeprazole, a proton-pump inhibitor, in the U.S. It is indicated for patients who require aspirin for secondary prevention of cardiovascular and cerebrovascular events and who are at risk of developing aspirin associated gastric ulcers. Yosprala is designed to support both cardio- and gastro-protection for at-risk patients through the proprietary Intelli-COAT system, which is formulated to sequentially deliver immediate-release omeprazole (40 mg) followed by a delayed-release, enteric-coated aspirin core in either 81 mg or 325 mg dose strengths. Yosprala was approved by the FDA in September 2016 and was commercially launched in the U.S. in October 2016. Yosprala is licensed in the U.S. by Genus Lifesciences Inc. (Genus) and the Company is entitled to receive a single-digit royalty on net sales in the U.S. by Genus until July 2023. In early 2021, Genus advised the Company that they have discontinued sales of the product. The intellectual property related to Yosprala was licensed to Takeda Pharmaceutical Company Limited (Takeda) in May 2017, on a non-exclusive basis for the Japanese market. In March 2020, Miravo Ireland received notice from Takeda that Japan’s Ministry of Health, Labor and Welfare (the MHLW) approved Cabpirin. Cabpirin is a fixed dose combination of vonoprazan fumarate and low-dose aspirin which is protected by Miravo Ireland's Japanese patent for the Yosprala formulation. In the year ended December 31, 2020, Miravo Ireland received $2.5 million (US$1.8 million), in milestone payments, net of withholding tax of 10%, triggered by the MHLW approval. Miravo Ireland is also contractually entitled to receive a second US$1.8 million milestone payment, net of withholding tax of 10% on May 31, 2022 provided the licensed intellectual property remains valid and enforceable. Miravo Ireland will receive a single-digit royalty on net sales of Cabpirin in Japan until patent expiry on May 31, 2022. Miravo Ireland is entitled to retain 50% of all royalty and milestone revenues generated from the Yosprala intellectual property on a global basis, with the remaining 50% to be paid to the estate of POZEN. The Heated Lidocaine/Tetracaine Patch The HLT Patch is a topical patch that combines lidocaine, tetracaine and heat, using Miravo’s proprietary Controlled Heat-Assisted Drug Delivery (CHADD™) technology. The CHADD unit generates gentle heating of the skin and in a well-controlled clinical trial has demonstrated that it contributes to the efficacy of the HLT Patch by improving the flux rate of lidocaine and tetracaine through the skin. The HLT Patch resembles a small adhesive bandage in appearance and for its currently approved indication is applied to the skin 20 to 30 minutes prior to painful medical procedures, such as venous access, blood draws, needle injections and minor dermatologic surgical procedures. The HLT Patch is marketed in the U.S. by Galen US Incorporated (Galen) under the brand name Synera. In Europe, the HLT Patch is marketed by the Company’s European-based licensee, Eurocept International B.V. (Eurocept) under the brand name Rapydan. The HLT Patch is manufactured by a third-party contract manufacturing organization for Galen and Eurocept. Currently, Miravo manufactures the bulk drug product for both parties.
Product Pipeline
Products Phase 2 Phase 3 Regulatory Submission Preparation
Regulatory Submission
Approved
Blexten Pediatric
Suvexx in 9 EU markets
Blexten Pediatric Miravo’s original license agreement for Blexten included Canadian rights for the pediatric dosage formats. Blexten pediatric dosing consists of either an oral solution formulation (2.5mg/mL) and an orally dispersible tablet formulation (10mg tablets). Miravo filed the pediatric dossier to Health Canada during the second quarter of 2020 and the dossier was accepted for review during the fourth quarter. A regulatory decision from Health Canada is anticipated by late summer 2021. Blexten Ophthalmic In April 2018, Miravo executed an amendment to add an ophthalmic formulation of Blexten, currently under development, to the portfolio. The ophthalmic version of Blexten provides physicians the ability to treat patients suffering from ocular symptoms such as itchy, watery or red eyes related to seasonal allergies with a highly effective, non-drowsy and long-

lasting formulation. The Company has elected not to proceed with filing a New Drug Submission for Blexten ophthalmic with Health Canada as the revised Patented Medicines Price Review Board regulations on drug pricing have resulted in anticipated market pricing that is no longer commercially viable. Resultz Reformulation Miravo has developed an improved reformulated version of Resultz and filed a U.S. provisional patent application in May 2021 to protect this new technology. Additional basic development work is anticipated to be conducted to support the new product.
Selected Financial Information
(1) Non-current financial liabilities are the sum of the long-term portion of long-term debt, other obligations and derivative liabilities.
Three Months ended March 31, 2021
Three Months ended March 31, 2020
$ $
Operations
Product sales 11,412 13,474
License revenue 3,010 10,872
Contract revenue - 15
Total Revenue 14,422 24,361
Cost of goods sold 4,625 5,486
Gross profit 9,797 18,875
Sales and marketing expenses 2,930 2,230
General and administrative expenses 2,946 3,940
Amortization of intangibles 1,913 2,083
Net interest expense 2,586 3,100
Total operating expenses 10,375 11,353
Other expenses (income) 17,155 7,869
Loss before income taxes (17,733) (347)
Income tax expense 256 1,382
Net loss (17,989) (1,729)
Unrealized gain on translation of foreign operations 255 454
Total comprehensive loss (17,734) (1,275)
Total assets 149,724 167,780
Total non-current financial liabilities(1) 123,795 126,511
Share Information
Net loss per common share
- basic (1.58) (0.15)
- diluted (1.58) (0.15)
Dividends declared per share, common shares - -

(1) Adjusted EBITDA, adjusted total revenue, adjusted EBITDA per common share and cash value of loans are Non-IFRS measures. See Non-IFRS
Measures above for a reconciliation of non-IFRS measures to IFRS.
Results of Operations
Total Revenue Total revenue is comprised of product sales, license revenue and contract revenue. Total revenue was $14.4 million for the three months ended March 31, 2021 compared to $24.4 million for the three months ended March 31, 2020. Product sales, which represent the Company’s sales to wholesalers, licensees and distributors, were $11.4 million for the three months ended March 31, 2021 compared to $13.5 million for the three months ended March 31, 2020. The decrease in the current quarter is primarily related to a decrease of $1.8 million in the Commercial Business segment, which includes promoted products, as well as a number of mature assets. The COVID-19 pandemic impacted the timing of revenue in the three months ended March 31, 2021, as the Company experienced forward buying in the three months ended March 31, 2020. License revenue was $3.0 million for the three months ended March 31, 2021 compared to $10.9 million for the three months ended March 31, 2020. The Company receives license revenue from its exclusive licensing agreements with global partners related to net sales of Vimovo, Resultz, Pennsaid, the HLT Patch, Yosprala and Treximet in certain territories. The $7.9 million decline in license revenue during the three months ended March 31, 2021 was primarily attributable to a $2.2 million reduction on the Company’s U.S. Vimovo royalty due to a competitor launch of a generic version of Vimovo in March 2020 as well as a strengthening of the Canadian dollar against the US dollar reducing the contribution from certain US denominated royalty streams. in the comparative quarter, the Company recognized a $5.5 million contract asset related to the use of its Yosprala intellectual property by Takeda in Japan. Contract revenue is mainly derived from ad hoc service agreements for testing, development and related quality assurance and quality control services provided by the Company. Adjusted total revenue decreased to $14.5 million for the three months ended March 31, 2021 compared to $18.9 million for the three months ended March 31, 2020. Adjusted total revenue is a non-IFRS measure (See Non-IFRS Financial Measures above).
Non-IFRS Measures(1)
Three Months ended
March 31, 2021 Three Months ended
March 31, 2020
$ $
Adjusted total revenue 14,549 18,913
Adjusted EBITDA 4,351 7,990
Adjusted EBITDA per common share
- basic 0.38 0.70
Average number of common shares outstanding
- basic 11,388 11,388
Cash value of loans US$96,318 US$107,277
0
5,000
10,000
15,000
20,000
25,000
Product Sales License Revenue Contract Revenue Total Revenue
$ T
housands
Q1 2021 Q1 2020

Canada Emergency Wage Subsidy During the three months ended March 31, 2021, the Company recorded $154 in government assistance resulting from the Canada Emergency Wage Subsidy. The funding was recorded as a reduction of the related salary expenditures with $51 recorded in sales and marketing expense, $62 recorded in G&A expenses and $41 recorded in cost of goods sold (COGS). Cost of Goods Sold COGS for the three months ended March 31, 2021 was $4.6 million compared to $5.5 million for the three months ended March 31, 2020. In the current quarter, gross margin on product sales for the three months ended March 31, 2021 was $6.8 million or 59% compared to $8.0 million or 59% for the three months ended March 31, 2020. The decrease in gross margin was the result of a decrease in product sales and a change in mix of product sales from both the Production and Service Business segment and the Commercial Business segment. Gross Profit
Gross profit on total revenue was $9.8 million or 68% for the three months ended March 31, 2021 compared to a gross profit of $18.9 million or 77% for the three months ended March 31, 2020. The decrease in gross profit for the current quarter was primarily attributable to an decrease in license revenue (See Total Revenue above) and gross margin on product sales (See Cost of Goods Sold above). The decrease in the gross profit percentage was mainly attributable to the decrease in licensing revenue. Operating Expenses
Total operating expenses includes sales and marketing expenses, G&A expenses, amortization of intangibles and net interest expense. Total operating expenses for the three months ended March 31, 2021 were $10.4 million, a decrease of $1.0 million from $11.4 million for the three months ended March 31, 2020. The decrease in total operating expenses
0
3,000
6,000
9,000
12,000
Sales &marketingexpenses
General &administrative
expenses
Amortization ofintangibles
Net interestexpense(income)
Total
$ T
housands
Q1 2021 Q1 2020
0
4,000
8,000
12,000
16,000
20,000
Q1
$ T
housands
2021 2020

for the current quarter was a result of a decrease in G&A expenses, amortization of intangibles and net interest expense slightly offset by an increase in sales and marketing expenses. Sales and Marketing The Company incurred $2.9 million in expenses for sales and marketing for the three months ended March 31, 2021 compared to $2.2 million for the three months ended March 31, 2020. The increase in sales and marketing expense was the result of targeted investment in certain promotional efforts for the Company’s promoted products - Blexten, Cambia, Suvexx and NeoVisc, as well as certain incremental expenses to support the recent, current and upcoming product launches for Suvexx, NeoVisc and Blexten Pediatric. The increase in sales and marketing expenses was slightly offset by $51 received from the Canadian government for the Canadian Emergency Wage Subsidy (CEWS). General and Administrative G&A expenses were $2.9 million for the three months ended March 31, 2021 compared to $3.9 million for the three months ended March 31, 2020. The decrease in G&A costs for the current quarter was the result of a decrease in regulatory consulting fees, professional fees and the receipt of $62 from the Canadian government for the CEWS. Amortization of Intangibles For the three months ended March 31, 2021, the Company recognized non-cash costs of $1.9 million for amortization of intangibles compared to $2.1 million in the comparative quarter. In the current and comparative quarters, amortization related to the licenses and patents acquired by the Company. Net Interest Expense Net interest expense for the three months ended March 31, 2021 was $2.6 million compared to net interest expense of $3.1 million for the three months ended March 31, 2020. The Company’s Amortization Loan and Convertible Loan, each components of the Deerfield Financing, are carried at amortized cost with effective interest rates of 10.20% and 10.13%, respectively. The Company’s Bridge Loan had an effective interest rate of 9.7% and was repaid in the three months ended March 31, 2020.
The Deerfield Financing requires the Company to make quarterly interest payments on outstanding loans. The coupon rate for the Amortization Loan and the Convertible Loan is 3.5%. The coupon rate for the Bridge Loan was 12.5%. During the three months ended March 31, 2021, the Company made interest payments of $1.1 million to Deerfield. During the three months ended March 31, 2020, the Company made interest payments of $1.3 million to Deerfield. Other Expenses (Income) During the three months ended March 31, 2020, the Company recognized non-cash other expenses of $17.2 million compared to $7.9 million of expenses for the three months ended March 31, 2020.
The Company holds two derivative liabilities related to the Deerfield Financing - the conversion feature that is embedded in the Convertible Loan and the warrants (Warrants). These derivative liabilities are measured at fair value at each reporting period. As a result of the increase in the share price in the current quarter and an increase in the volatility of the Company’s shares, amongst other inputs, the value of the Company’s derivative liabilities increased and the
Three months ended
March 31, 2021 Three months ended
March 31, 2020
$ $
Cash interest paid 1,051 1,339
Non cash interest expense 1,535 1,761
Total interest expense 2,586 3,100
Three Months ended
March 31, 2021 Three Months ended
March 31, 2020
in thousands $ $
Change in fair value of derivative liabilities 18,389 2,417
Change in fair value of contingent and variable consideration (gain) (616) 2,129
Foreign currency loss (gain) (714) 4,697
Other losses (gain) 96 (1,374)
Total other expenses 17,155 7,869

Company recognized a net non-cash $18.4 million loss on the change in fair value of derivative liabilities for the three months ended March 31, 2021 [net $2.4 million loss for the three months ended March 31, 2020]. During the three months ended March 31, 2021, the Company recognized a non-cash gain of $0.6 million on the change in fair value of contingent and variable consideration compared to a loss of $2.1 million for the three months ended March 31, 2020. The Company reassesses the value of contingent consideration related to Resultz and Yosprala at each reporting period. The ex-U.S. Resultz acquisition included contingent consideration related to meeting certain milestones in partnered markets, payable only if those targets are achieved, as well as variable consideration based on annual royalties earned in the non-partnered markets. The Yosprala purchase agreement included contingent consideration in the form of 50% of the lifetime net earnings from the monetization of Yosprala intellectual property. The Company has estimated contingent consideration for Yosprala intellectual property in the Japanese market. Foreign Currency The Company recognized a foreign currency gain of $0.7 million during the three months ended March 31, 2021 compared to a $4.7 million loss during the three months ended March 31, 2020. In the current quarter, the strengthening of the Canadian dollar against the U.S. dollar decreased the carrying value of the Company’s long-term debt. In the comparative quarter, the strengthening of the U.S. dollar against the Canadian dollar increased the carrying value of the Company’s long-term debt. Other Losses During the three months ended March 31, 2021, the Company recognized other losses of $96, primarily related to the disposal two intangible assets, and related inventories and the changes in the assumptions regarding the timing and amount of debt repayments due to forecasted excess cash flows. Net Income (Loss) and Total Comprehensive Income (Loss)
Income Tax Expense During the three months ended March 31, 2021, the Company recognized a $256 income tax expense compared to $1.4 million during the three months ended March 31, 2020 as a result of taxable income in Miravo Ireland. Net Loss
Net loss for the three months ended March 31, 2021 was $17.9 million compared to a net loss of $1.7 million for the three months ended March 31, 2020. In the current three-month period, gross profit decreased by $9.1 million, total
Three Months ended
March 31, 2021 Three Months ended
March 31, 2020
$ $
Net loss before income taxes (17,733) (347)
Income tax expense 256 1,382
Net loss (17,989) (1,729)
Unrealized gain on translation of foreign operations 255 454
Total comprehensive loss (17,734) (1,275)
-20,000
-16,000
-12,000
-8,000
-4,000
0
Q1
$ T
housands
2021 2020

operating expenses decreased by $1.0 million and other expenses increased by $9.3 million. The increase in other expenses was primarily related to the change in fair value of derivative liabilities. Total Comprehensive Loss Total comprehensive loss for the three months ended March 31, 2021 was $17.7 million compared to total comprehensive loss of $1.7 million for the three months ended March 31, 2020. Net Loss Per Common Share
Three Months ended
March 31, 2021 Three Months ended
March 31, 2020
$ $
Net loss from per common share
- basic (1.58) (0.15)
- diluted (1.58) (0.15)
Average number of common shares outstanding
- basic 11,388 11,388
- diluted 11,388 11,388
Net loss per common share was $1.58 for the three months ended March 31, 2021 compared to a net loss per common share of $0.15 for the three months ended March 31, 2020. On a diluted basis, net loss per common share was $1.58 for the three months ended March 31, 2021 compared to a net loss per common share of $0.15 for the three months ended March 31, 2020. The weighted average number of common shares outstanding on a basic basis was 11.4 million for the three months ended March 31, 2021 and March 31, 2020. The weighted average number of common shares outstanding on a diluted basis was 11.4 million for the three months ended March 31, 2021 and March 31, 2020.
Operating Segments IFRS 8 - Operating Segments (IFRS 8) requires operating segments to be determined based on internal reports that are regularly reviewed by the chief operating decision maker for the purpose of allocating resources to the segment and to assessing its performance. For the three months ended March 31, 2021, the Company had three operating segments: Commercial Business, Production and Service Business and Licensing and Royalty Business. Operating Segments The Commercial Business segment is comprised of products commercialized by the Company in Canada. This segment includes the Company’s promoted products - Blexten, Cambia, Suvexx, and NeoVisc, as well as a number of mature assets. The Production and Service Business segment includes revenue from the sale of products manufactured by the Company from its manufacturing facility in Varennes, Québec or contracted by Miravo Ireland from its international headquarters in Dublin, Ireland, as well as service revenue for testing, development and related quality assurance and quality control services provided by the Company. Key revenue streams in this segment include Pennsaid 2%, Pennsaid, and the bulk drug product for the HLT Patch. The Licensing and Royalty Business segment includes the revenue generated by the licensing of intellectual property and ongoing royalties from exclusive licensing agreements with global partners. Key revenue streams in this segment include royalties from the Company’s Vimovo, Yosprala, Resultz and HLT Patch license agreements.

Total Revenue by Operating Segment
Selected Segmented Financial Information Commercial Business
Three Months ended
March 31, 2021 Three Months ended
March 31, 2020 Change
$ $ $
Revenue 8,796 10,568 (1,772)
Cost of Sales 2,766 3,694 (928)
Gross profit 6,030 6,874 (844)
Gross profit % 68.6% 65.0% 3.6%
During the three months ended March 31, 2021, the Company’s Commercial Business segment contributed $8.8 million or 60.1% of the Company’s total revenue [$10.6 million or 43.4% during the three months ended March 31, 2020] and $6.0 million or 61.5% of the Company’s gross profit [$6.8 million or 36.4% during the three months ended March 31, 2020]. COGS for the three months ended March 31, 2021 included $35 of inventory step-up expense compared to $0.4 million for the three months ended March 31, 2020. Revenue attributable to the Commercial Business segment declined during the three months ended March 31, 2021, as an increase in sales related to certain promoted products was offset by a decline in revenue from the segment’s mature products. During the three months ended March 31, 2020, the possibility of future supply disruptions linked to the COVID-19 pandemic resulted in forward buying, which increased revenue in the Company’s Commercial Business segment in the three months ended March 31, 2020. Gross Profit attributable to the Commercial Business segment declined to $6.0 million or 68.6% compared to $6.9 million or 65% in the three months ended March 31, 2020. Despite the decline in revenue, gross profit increased during the quarter due to a change in product mix and a reduction in inventory step-up expense. Production and Service Business
Three Months ended
March 31, 2021 Three Months ended
March 31, 2020 Change
$ $ $
Revenue 2,616 2,921 (305)
Cost of Sales 1,859 1,792 67
Gross profit 757 1,129 (372)
Gross profit % 28.9% 38.7% (9.8%)
0
5,000
10,000
15,000
20,000
25,000
CommercialBusiness
Production &Service Business
Licensing &Royalty Business
Total
$ T
hou
san
ds
Q1 2021 Q1 2020

During the three months ended March 31, 2021, the Company’s Production and Service Business segment contributed $2.6 million or 18.1% of the Company’s total revenue [$2.9 million or 11.9% during the three months ended March 31, 2020] and $0.8 million or 7.7% of the Company’s gross profit [$1.1 million or 5.9% during the three months ended March 31, 2020]. The decrease in the Production and Service Business segment revenue during the three months ended March 31, 2021 was primarily the result of a decrease in the Company’s Resultz product sales as well as a strengthening of the Canadian dollar against the US dollar. Gross profit as a percentage of revenue decreased compared to the prior year due to a change in product mix as well as unfavourable foreign exchange movement. Licensing and Royalty Business
Three Months ended
March 31, 2021 Three Months ended
March 31, 2020 Change
$ $ $
Revenue 3,010 10,872 (7,862)
Cost of Sales - - -
Gross profit 3,010 10,872 (7,862)
Gross profit % 100% 100% -
During the three months ended March 31, 2021, the Company’s Licensing and Royalty Business segment contributed $3.0 million or 20.9% of the Company’s total revenue [$10.9 million or 44.6% during the three months ended March 31, 2020] and $3.0 million or 30.7% of the Company’s gross profit [$10.9 million or 57.6% during the three months ended March 31, 2020]. License revenue was $3.0 million for the three months ended March 31, 2021 compared to $10.9 million for the three months ended March 31, 2020. The $7.9 million decline in license revenue during the three months ended March 31, 2021 was primarily attributable to a $2.2 million reduction on the Company’s U.S. Vimovo royalty due to a competitor launch of a generic version of Vimovo in March 2020 as well as a strengthening of the Canadian dollar against the US dollar reducing the contribution from certain royalty streams. In the comparative quarter, the Company recognized a $5.5 million contract asset related to the use of its Yosprala intellectual property by Takeda in Japan.
Financial Position
As at
March 31, 2021 As at
December 31, 2020
$ $
Financial Position
Working capital 10,149 10,654
Contract assets 2,794 2,845
Long-lived assets 101,752 104,409
Right-of-use assets 1,000 1,027
Long-term debt (including current portion) 100,374 103,697
Other obligations (including current portion) 3,842 4,719
Derivative liabilities 31,918 13,665
Total equity 2,729 20,362
Working Capital The Company defines the working capital above as total current assets (excluding cash and contract assets), less accounts payable and accrued liabilities and current income tax liabilities. The $0.5 million decrease in working capital from December 31, 2020 to March 31, 2021 was primarily due to the following factors:
• Accounts receivable increased $0.9 million related to the timing of receipts of royalty payments.
• Inventory increased $0.7 million as a result of the timing of purchases and supply chain management.
• Other current assets decreased $0.7 million, primarily due to the timing of purchases.
• Accounts payable and accrued liabilities increased by $1.4 million, primarily attributable to the timing of payments.
• Current income tax liabilities decreased by $0.1 million.

Contract Assets Contract assets represent the present value of current and future guaranteed minimum sales-based royalties, upfront fees and milestone payments that are expected to be received over the life of the licensing agreements. The Company’s contract assets are subject to estimation regarding the likelihood of the minimum guaranteed sales-based royalties. Contract asset balances are reduced as the contractual minimums are realized throughout the life of the agreement. In the three months ended March 31, 2020, the Company recognized a contract asset of $5.0 million (US$3.6 million), recorded net of withholding tax, representing the discounted present value, related to future milestone payments for Yosprala. This addition included $2.5 million (US$1.8 million) received by Miravo Ireland in the three months ended June 30, 2020, net of withholding tax, triggered by regulatory approval in Japan, which resulted in a reduction to the contract asset of $2.5 million. Miravo Ireland is also contractually entitled to receive a second US$1.8 million, net of withholding tax, milestone payment on May 31, 2022 provided the licensed intellectual property remains valid and enforceable. Long-lived Assets Long-lived assets consist of property, plant and equipment (PP&E), intangible assets and goodwill. The $2.7 million decrease for the three months ended March 31, 2021 was primarily related to $2.1 million of intangible assets and PP&E amortization, $0.5 million disposal of intangible assets and a reduction of $0.3 million due to foreign exchange translation, partially offset by an increase in the balance due to additions of PP&E and software totalling $0.2 million. Right-of-use Assets Right-of-use assets consist of leased assets, which under IFRS 16 - Leases (IFRS 16), are accounted for as a right-of-use asset with a corresponding lease liability. The Company adopted IFRS 16 on January 1, 2019. On February 26, 2020, the Company renegotiated its premises leases, which resulted in the surrender of two of its leases and the signing of a new lease. The renegotiation has been accounted for as a single lease modification, as it was completed with the overall objective of consolidating the premises leased by the Company and all leases were entered into with the same lessor. As part of the renegotiation, the Company agreed to pay a termination fee of $0.2 million. The decrease in the area under lease due to the modification has resulted in a decrease to the right-of-use asset of $0.1 million and the increase in the lease term and corresponding increase in lease payments has resulted in an increase to the right-of-use asset of $0.7 million. Long-term Debt Long-term debt includes the long-term carrying values of the Company’s Amortization Loan and Convertible Loan. No new loan facilities were entered into during the three months ended March 31, 2021. As payments are made, and interest is accreted, the net impact reduces the long-term debt balance over time. During the three months ended March 31, 2021, the Company made principal payments of $3.6 million to Deerfield under the Deerfield Financing. Other Obligations As at March 31, 2021, the Company recognized $1.5 million [December 31, 2020 - $1.5 million] of lease obligations related to IFRS 16. The Company recognized $2.4 million in contingent and variable consideration as at March 31, 2021 [December 31, 2020 - $3.3 million], which represented the present value of the Company’s probability-weighted estimate of the cash outflow related to the ex-U.S. Resultz acquisition and the profits earned from Yosprala. The ex-U.S. Resultz acquisition included contingent consideration related to meeting certain milestones in partnered markets, payable only if those targets are achieved, as well as variable consideration based on annual royalties earned in the non-partnered markets. The Yosprala purchase agreement included contingent consideration in the form of 50% of the lifetime net earnings from monetization of Yosprala intellectual property. The Company has estimated contingent consideration for the use of Yosprala intellectual property in the Japanese market. Derivative liabilities The Company’s derivative liabilities include the conversion feature embedded in the Convertible Loan and the Warrants. These derivative liabilities are measured at fair value at each reporting period. As a result of the increase in the share price in the current quarter and an increase in the volatility of the Company’s shares, amongst other inputs, the value of the Company’s derivative liabilities increased and the Company recognized a net non-cash $18.4 million loss on the change in fair value of derivative liabilities for the three months ended March 31, 2021 [net $2.4 million loss

for the three months ended March 31, 2020]. There were no conversions or Warrant exercises during the three months ended March 31, 2021 or the three months ended March 31, 2020. Fluctuations in Operating Results The Company anticipates that its quarterly and annual results of operations will be impacted for the foreseeable future by several factors, including the level and timing of product sales to the Company’s customers, licensees and distributors, the timing and amount of royalties, milestones and other payments made or received pursuant to current and future licensing arrangements, interest costs associated with servicing the Deerfield Financing, revaluation of derivative liabilities, fluctuations in foreign exchange rates and the COVID-19 pandemic. Liquidity and Capital Resources
Cash and Cash Equivalents Cash and cash equivalents were $23.8 million as at March 31, 2021 compared to $16.3 million as at March 31, 2020. Cash Provided by Operations Cash provided by operations was $2.7 million for the three months ended March 31, 2021 compared to cash provided by operations of $6.2 million for the comparative three-month period ended March 31, 2020. Cash Provided by Operating Activities Overall cash provided by operating activities was $3.1 million for the three months ended March 31, 2021 compared to cash provided by operating activities of $5.1 million for the three months ended March 31, 2020. In the current quarter, the $0.5 million provided by non-cash working capital was primarily attributable to a $1.4 million increase of accounts payable and accrued liabilities, primarily due to the timing of payments, a decrease of $0.7 million of other current assets, primarily related to an decrease in promotional supplies and prepaid expenses, slightly offset by a $0.9 million increase in accounts receivable due to the timing of royalty receipts and a $0.7 million increase of inventories as a result of the timing of purchases. Cash Provided by/Used in Investing Activities Net cash provided by investing activities was $0.3 million for the three months ended March 31, 2021 compared to net cash used in investing activities of $22 for the three months ended March 31, 2020. In the current quarter, cash provided by investing activities included the disposal of intangible assets, offset by additions to intangible assets and PP&E. Cash Used in Financing Activities Net cash used in financing activities was $3.6 million for the three months ended March 31, 2021 compared to net cash used in financing activities of $11.7 million for the three months ended March 31, 2020. During the three months ended March 31, 2021, the Company repaid $3.6 million of debt to Deerfield and paid $56 as cash payments for lease liabilities.
Three Months ended
March 31, 2021 Three Months ended
March 31, 2020
$ $
Net loss (17,989) (1,729)
Items not involving current cash flows 20,662 7,932
Cash provided by operations 2,673 6,203
Net change in non-cash working capital 512 (1,127)
Payment of contingent consideration (90) -
Cash provided by operating activities 3,095 5,076
Cash provided by (used in) investing activities 254 (22)
Cash used in financing activities (3,619) (11,739)
(270) (6,685)
Effect of exchange rates on cash 215 (34)
Net change in cash during the period (55) (6,719)
Cash and cash equivalents, beginning of the period 23,807 23,019
Cash and cash equivalents, end of the period 23,752 16,300

During the three months ended March 31, 2020, the Company repaid $11.5 million of debt to Deerfield and paid $0.2 million for lease liabilities. Capital Structure The Company’s stated strategy is to expand its Canadian and international business through targeted in-licensing and acquisition opportunities. To execute this strategy, the Company may need to access the additional capacity under its senior secured term loan facility or seek alternate sources of financing. In April 2021, the Company filed and obtained a receipt for a final base shelf prospectus with the securities regulatory authorities in each of the provinces of Canada. The Company has filed the Prospectus to maintain financial flexibility and to have the ability to offer the securities on an accelerated basis pursuant to the filing of prospectus supplements. The Prospectus is valid for a 25-month period, during which time the Company may offer and issue, from time-to-time, common shares, preferred shares, debt securities, warrants and subscription receipts, or any combination thereof, having an aggregate offering value of up to $40 million. The Company expects to continue to be able to meet all obligations as they become due using some or all of the following sources of liquidity: cash flow generated from operations, existing cash and cash equivalents on hand, and additional borrowing capacity under its senior secured term loan facility. In addition, subject to market conditions, the Company may raise funding through equity financing. The Company believes that its capital structure will provide it with financial flexibility to pursue future growth strategies. However, the Company’s ability to fund operating expenses and debt service requirements will depend on, among other things, future operating performance, which will be affected by general economic, industry, financial and other factors, including the impact of the COVID-19 pandemic and other factors beyond the Company’s control. See “Risk Factors”.
Selected Quarterly Information
The following is selected quarterly financial information for the Company over the last eight quarterly reporting periods.
Q1 2021
Q4 2020
Q3 2020
Q2 2020
Q1 2020(1)
Q4 2019
Q3 2019
Q2 2019
$ $ $ $ $ $ $ $
Product sales 11,412 12,876 13,597 12,253 13,474 13,317 14,102 13,235
License revenue 3,010 4,373 2,997 3,277 10,872 6,043 4,646 2,655
Contract revenue - 34 7 - 15 233 75 690
Sales and marketing expenses 2,930 2,352 1,643 2,703 2,230 1,968 1,955 3,043 General and administrative
expenses 2,946 3,461 2,684 2,808 3,940 3,941 3,584 5,125
Net income (loss) (17,989) 2,399 (2,832) (1,967) (1,729) (418) 4,425 6,796 Net income (loss) per common
share
- basic (1.58) 0.21 (0.25) (0.17) (0.15) (0.04) 0.39 0.60
- diluted (1.58) 0.05 (0.25) (0.17) (0.15) (0.04) 0.10 (0.52)
Non-IFRS Measures
Adjusted total revenue 14,549 17,331 16,669 18,046 18,913 19,644 18,889 19,078
Adjusted EBITDA 4,351 6,242 6,565 7,646 7,990 8,570 7,784 5,663 Adjusted EBITDA per common
share
- basic 0.38 0.55 0.58 0.67 0.70 0.75 0.68 0.50
Cash value of loans (US$) 96,318 99,180 101,982 104,777 107,277 115,952 118,452 118,452
(i) Includes restated figures for the three months ended March 31, 2020.

FINANCIAL INSTRUMENTS AND RISK MANAGEMENT Financial Instruments at Amortized Cost For the three months ended March 31, 2021, the Company recognized $15 in interest income from financial assets held at amortized cost [March 31, 2020 - $35]. For the three months ended March 31, 2021, the Company recognized $2.6 million in interest expense from financial liabilities held at amortized cost [March 31, 2020 - $3.1 million]. Credit Risk The Company, in the normal course of business, is exposed to credit risk from its global customers, most of whom are in the pharmaceutical industry. The accounts receivable and contract assets are subject to normal industry risks in each geographic region in which the Company operates. The Company attempts to manage these risks prior to the signing of distribution or licensing agreements by dealing with creditworthy customers; however, due to the limited number of potential customers in each market, this is not always possible. In addition, a customer’s creditworthiness may change subsequent to becoming a licensee or distributor and the terms and conditions in the agreement may prevent the Company from seeking new licensees or distributors in these territories during the term of the agreement. As at March 31, 2021, the Company’s largest customer represented 22% [December 31, 2020 - 30%] of accounts receivable. Pursuant to their collective terms, accounts receivable, net of allowance, were aged as follows:
March 31, 2021 December 31, 2020
$ $
Current 8,301 7,018
0 - 30 days past due - 463
31 - 60 days past due 133 2
Over 60 days past due(i) 7 5
8,441 7,488
(i) See “loss allowance provision” below.
The loss allowance provision for the Production and Service Business segment as at March 31, 2021 was determined using reference to expected loss rates and management judgment as follows:
Current
Less than 181 days past due
181 to 270 days past due
271 to 365 days past due
More than 365 days past due Total
Expected loss rate % 0% 0% 25% 50% 100%
Gross carrying amount $ 1,443 - - - - 1,443
The loss allowance provision for the Commercial Business and Licensing and Royalty Business segments as at March 31, 2021 was determined using reference to expected loss rates and management judgment as follows:
Current
Less than 61 days past due
61 to 120 days past due
121 to 180 days past due
More than 181 days past due Total
Expected loss rate % 0% 0% 25% 50% 100%
Gross carrying amount $ 6,863 130 9 - - 7,002
Loss allowance provision(i) $ (5) 10 (9) - - (4)
(i) Loss allowance provision balance consists of credit memos and purchase deductions on invoices that take time to be processed. As a result,
loss provision is 0%.
During the three months ended March 31, 2021, the Company recorded $82 bad debt reversal in total comprehensive income (loss) [December 31, 2020 - $nil]. For the three months ended March 31, 2021, the impairment of accounts receivable was assessed based on the expected credit losses model in compliance with IFRS 9. Individual receivables that were known to be uncollectible were written off by reducing the carrying amount directly. For contract assets within the scope of IFRS 15 - Revenue from Contracts with Customers, the Company recognizes an asset to the extent contractual minimums established in certain customer licensing agreements are deemed fixed

consideration. After analysis of historical default rates and forward-looking estimates, the Company’s contract assets were considered to have low credit risk, and as a result, the Company has not recognized a loss allowance as at March 31, 2021 [December 31, 2020 - $nil]. The Company’s cash and cash equivalents subject the Company to a concentration of credit risk. As at March 31, 2021, the Company had $23.8 million deposited with three financial institutions in various bank accounts. These financial institutions are major banks located in Canada, the U.S. and Ireland, which the Company believes lessens the degree of credit risk. The Company has not recognized a loss allowance as at March 31, 2021 [December 31, 2020 - $nil]. The Company has not noted a significant change in the credit risk of the financial instruments related to the COVID-19 pandemic. Financial Instruments IFRS 7 - Financial Instruments, Disclosures requires disclosure of a three-level hierarchy that reflects the significance of the inputs used in making fair value measurements. All assets and liabilities for which fair value is measured or disclosed in these Condensed Consolidated Interim Financial Statements are categorized within the fair value hierarchy, described as follows, based on the lowest level input that is significant to the fair value measurement as a whole:
• Level 1 - Unadjusted quoted prices at the measurement date for identical assets or liabilities in active markets
• Level 2 - Observable inputs other than quoted prices in Level 1, such as quoted prices for similar assets and liabilities in active markets; quoted prices for identical or similar assets and liabilities in markets that are not active or other inputs that are observable or can be corroborated by observable market data
• Level 3 - Significant unobservable inputs that are supported by little or no market activity The Company reviews the fair value hierarchy classification on a quarterly basis. Changes to the ability to observe valuation inputs may result in a reclassification of levels for certain securities within the fair value hierarchy. The Company did not have any transfer of assets and liabilities between Level 1, Level 2 and Level 3 of the fair value hierarchy during the three months ended March 31, 2021. As at March 31, 2021, the Company’s financial assets and liabilities consisted of cash and cash equivalents, accounts receivable, accounts payable and accrued liabilities, contingent and variable consideration, long-term debt and derivative liabilities. The Company has determined the estimated fair values of its financial instruments based on appropriate valuation methodologies. However, considerable judgment is required to develop these estimates. Accordingly, these estimated values are not necessarily indicative of the amounts the Company could realize in a current market exchange. The estimated fair value amounts can be materially affected by the use of different assumptions or methodologies. The Company’s cash and cash equivalents, accounts receivable, accounts payable and accrued liabilities (excluding SARs) are measured at amortized cost and their fair values approximate carrying values. Cash and cash equivalents are Level 1, while the other short-term financial instruments are Level 3. Level 2 liabilities include obligations of the Companyfor the SARs Plan. The fair values of each tranche of SARs issued and outstanding are revalued at each reporting period using the Black-Scholes option pricing model. The Company accrued $4 for SARs as at March 31, 2021 [March 31, 2020 - $nil]. The fair values of the Loans are Level 3 measurements determined using a discounted cash flow model that considers the present value of the contractual cash flows using a risk-adjusted discount rate. The Company recognized $100.4 million for the Amortization Loan and host liability of the Convertible Loan as at March 31, 2021 [December 31, 2020 - $103.7 million]. The conversion feature that accompanies the Company’s Convertible Loan is considered a Level 3 liability. The value is determined as the difference between the fair value of the hybrid Convertible Loan contract, determined using an income approach with a binomial-lattice model and the fair value of the host liability contract, determined using a discounted cash flow model. The Company recognized $13.1 million for the conversion feature as at March 31, 2021 [December 31, 2020 - $5.7 million]. The fair values of the prepayment option that allows the Company to make prepayments against the Amortization Loan at any time is considered a Level 3 financial instrument. The fair value of the prepayment option bifurcated from the Amortization Loan was a derivative asset with a nominal value as at March 31, 2021 and is presented net of the non-current portion of the long-term debt. The fair value of this option was determined using a binomial-lattice model.

The fair value of the Company’s Warrants is revalued at each reporting period using the Black-Scholes option pricing model. As at March 31, 2021, the Company recognized a $18.9 million derivative liability related to outstanding Warrants [December 31, 2020 - $8.0 million]. These Warrants are Level 3. Level 3 liabilities include the fair value of contingent and variable consideration related to the acquisition of the ex-U.S. rights to Resultz and the Aralez Transaction.
Risk Factors The following is a discussion of liquidity risk, interest rate risk, currency risk and market risk and related mitigation strategies that have been identified. Credit risk has been discussed in the Company’s assessment of impairment under IFRS 9. This is not an exhaustive list of all risks nor will the mitigation strategies eliminate all risks listed.
Liquidity Risk Liquidity risk is the risk that the Company will encounter difficulties in meeting its financial obligations as they become due. As at March 31, 2021, the Company’s financial liabilities had undiscounted contractual maturities (including interest payments where applicable) as summarized below:
Current Non-current
Total
$
Within 12 Months
$
1 to 2 Years
$
2 to 5 Years
$
> 5 Years
$
Accounts payable and accrued liabilities 9,676 9,676 - - -
Other obligations 4,419 237 1,328 1,640 1,214
Senior secured Amortization Loan 59,361 11,180 27,317 20,864 -
Senior secured Convertible Loan 75,396 2,343 4,685 68,368 -
148,852 23,436 33,330 90,872 1,214
The Company’s ability to satisfy its debt obligations will depend principally upon its future operating performance. The Company’s inability to generate sufficient cash flows to satisfy its debt service obligations or to refinance its obligations on commercially reasonable terms could have a materially adverse impact on the Company’s business, financial condition or operating results. The Deerfield Facility Agreement contains customary representations and warranties and affirmative and negative covenants, including, among other things, an annual financial covenant based on minimum levels of net sales per fiscal year. Each quarter, the Company is required to pay to the lenders the greater of US$2.5 million or 50% of the Company’s excess cash flows, a defined term in the Deerfield Facility Agreement. The Company agreed to an amendment to the financing agreement dated June 25, 2019 to provide, among other things, for a payment deferral mechanism in the event that Vimovo U.S. market exclusivity is lost. The amendment allows the Company to defer a portion of the mandatory minimum quarterly repayments by the difference between one quarter of the then existing US$7.5 million (US$1.9 million per quarter) minimum annual royalty due from Vimovo sales in the U.S. and the actual amount of royalties received in the applicable quarter, in the event Vimovo U.S. market exclusivity is lost earlier than had been expected (2022) prior to the Court of Appeals decision. A generic version of Vimovo entered the U.S. market in the three months ended March 31, 2020. The amount of any principal repayment deferred would, until repaid in accordance with the amendment, be subject to an interest rate of 12.5% per annum. To-date, the Company has not availed itself of the deferral mechanism. Due to the impact of the COVID-19 pandemic on the economic environment, the Company has reviewed the working capital requirements needed as a result of managing the supply chain and changes in demand. Company anticipates that its current cash of $23.8 million as at March 31, 2021, together with the cash flows generated from operations, will be sufficient to execute its current business plan for the next 12 months and to meet its current debt obligations.
Interest Rate Risk The Company’s policy is to minimize interest rate cash flow risk exposures on its long-term financing. The Company’s loans and borrowings and lease obligations are at fixed interest rates.

The fair value of the Company’s prepayment option on the Amortization Loan and the Company’s derivative liabilities are impacted by market rate changes.
Currency Risk The Company operates globally, which gives rise to a risk that income and cash flows may be adversely affected by fluctuations in foreign currency exchange rates. The Company is primarily exposed to the U.S. dollar, euro and British Pound (GBP), but also transacts in other foreign currencies. The Company currently does not use financial instruments to hedge these risks. The significant balances in foreign currencies were as follows:
U.S. Dollar Euro British Pound
March 31, 2021
$
Dec. 31, 2020
$
March 31, 2021
€
Dec. 31, 2020
€
March 31, 2021
£
Dec. 31, 2020
£
Cash and cash equivalents 6,677 7,214 1,021 1,444 1,196 1,147
Accounts receivable 3,173 3,145 256 133 49 48
Contract assets 1,764 1,964 - - 346 183
Loans and borrowings (79,841) (81,468) - - - -
Derivative liabilities (10,390) (4,452) - - - - Accounts payable and
accrued liabilities (809) (803) (140) (281) - -
Other obligations (1,260) (1,882) (521) (552) - -
(80,686) (76,282) 616 744 1,591 1,378
Based on the aforementioned net exposure as at March 31, 2021, and assuming that all other variables remain constant, a 10% appreciation or depreciation of the Canadian dollar against the U.S. dollar would have an effect of $10.1 million on total comprehensive income (loss), a 10% appreciation or depreciation of the Canadian dollar against the euro would have an effect of $91 on total comprehensive income (loss) and a 10% appreciation or depreciation of the Canadian dollar against the GBP would have an effect of $276 on total comprehensive income (loss). In terms of the U.S. dollar, the Company has five significant exposures: its U.S. dollar-denominated cash held in its Canadian operations, its U.S. dollar-denominated loans and borrowings and derivative liabilities held in its Canadian and European operations, its net investment and net cash flows in its European operations, the cost of purchasing raw materials either priced in U.S. dollars or sourced from U.S. suppliers and payments made to the Company under its U.S. dollar-denominated licensing arrangements. The Company does not currently hedge its U.S. dollar cash flows. The Company funds its U.S. dollar-denominated interest expense and loan obligations using the Company’s U.S. dollar-denominated cash and cash equivalents and payments received under the terms of the licensing and supply agreements. Periodically, the Company reviews its projected future U.S. dollar cash flows and if the U.S. dollars held are insufficient, the Company may convert a portion of its other currencies into U.S. dollars. If the amount of U.S. dollars held is excessive, they may be converted into Canadian dollars or other currencies, as needed for the Company’s other operations. In terms of the euro, the Company has three significant exposures: its euro-denominated cash held in its Canadian operations and by Miravo Ireland, sales of Pennsaid by the Canadian operations to European distributors and the cost of purchasing raw materials priced in euros. The Company does not currently hedge its euro cash flows. Sales to European distributors for Pennsaid are primarily contracted in euros. The Company receives payments from the distributors in its euro bank accounts and uses these funds to pay euro-denominated expenditures and to fund the day-to-day expenses of the Miravo Ireland operations as required. Periodically, the Company reviews the amount of euros held, and if they are excessive compared to the Company’s projected future euro cash flows, they may be converted into U.S. or Canadian dollars. If the amount of euros held is insufficient, the Company may convert a portion of other currencies into euros. In terms of the GBP, the Company has three significant exposures: its GBP-denominated cash held in its Canadian operations and by Miravo Ireland, the cost of purchasing raw materials or services priced in GBP and payments made

to the Company under its GBP-denominated licensing arrangements and minimum royalties received and accounted for as a contract asset in GBP. The Company does not currently hedge its GBP cash flows. The Company receives payments from the distributors in its GBP bank accounts and uses these funds to pay GBP-denominated expenditures and to fund the day-to-day expenses of the Company’s operations as required. Periodically, the Company reviews the amount of GBP held, and if they are excessive compared to the Company’s projected future GBP cash flows, they may be converted into U.S. or Canadian dollars. If the amount of GBP held is insufficient, the Company may convert a portion of other currencies into GBP. Market Risk The Company’s derivative liabilities, the Warrants and the conversion feature that accompanies the Company’s Convertible Loan, are impacted by a variety of valuation inputs, including changes in the Company’s share price. As at March 31, 2021, a $1.00 increase in the Company’s share price would increase the value of the Warrants by $16.3 million and an increase to the conversion feature of $11.6 million, with a corresponding loss of $27.8 million recognized in the change in fair value of derivative liabilities. As at March 31, 2021, a further $1.00 increase in the Company’s share price for a total adjustment of $2.00 would further increase the value of the Warrants by $17.5 million and increase the value of the conversion feature by $12.9 million, with a corresponding additional loss of $30.5 million recognized in the change in fair value of derivative liabilities. The Company has not noted a significant change in the market risk due to changes to the Company’s share price as a result of the impact of the COVID-19 pandemic on the economic environment.
Contractual Obligations
The following table lists the Company’s contractual obligations for the twelve months ending March 31 as follows:
(1) Included in the Deerfield Financing is the Convertible Loan in the principal amount of US$52.5 million, convertible into 19,444,444 common shares
of the Company at a conversion price of US$2.70. (2) Other obligations include accounts payable and accrued liabilities and contingent and variable consideration.
The Deerfield Financing On December 31, 2018, the Company and Miravo Ireland, as borrowers, and Aralez Pharmaceuticals Canada Inc., as guarantor, entered into the Deerfield Facility Agreement with Deerfield, as agent and certain funds managed by Deerfield, as lenders, to fund the purchase price of the Aralez Transaction (the Deerfield Financing). The Deerfield Financing consisted of (i) a 6-year, amortizing loan made available to Miravo Ireland in the principal amount of US$60 million with an interest rate of 3.5% per annum (the Amortization Loan), (ii) an 18-month Bridge Loan made available to the Company in the principal amount of US$6.0 million with an interest rate of 12.5% per annum (the Bridge Loan), (iii) a 6-year, Convertible Loan made available to the Company in the principal amount of US$52.5 million with an interest rate of 3.5% per annum, initially convertible into 19,444,444 common shares of the Company at a conversion price of US$2.70 (the Convertible Notes), and (iv) 25,555,556 million common share purchase Warrants, each such Warrant initially exercisable for one common share of the Company for a period of six years from the date of issuance at an exercise price of $3.53 per share. Each quarter, the Company shall pay to the lenders the greater of US$2.5 million or 50% of the Company’s excess cash flows (a defined term in the Deerfield Facility Agreement), which is applied in the following order: (a) any unpaid fees and transaction costs; (b) proportionately to any accrued and unpaid interest related to these Loans; (c) any unpaid
2021 2022 2023 2024 2025 2026 and thereafter Total
$ $ $ $ $ $ $
Variable lease payments 234 223 223 223 223 1,023 2,149
Lease liability (principal and interest) 225 230 238 238 243 1,214 2,388
Deerfield Financing(1) 16,667 16,221 15,776 89,229 - - 137,893
Purchase commitments 3,273 4,282 3,698 3,198 - - 14,451
Other obligations(2) 11,662 1,135 809 2,586 356 214 16,762
32,061 22,091 20,744 95,474 822 2,451 173,643

principal of the Bridge Loan, including the applicable prepayment fee; (d) any unpaid principal of the Amortization Loan, including the applicable prepayment fee; and (e) any other obligations owing to the lenders, administrative agent or other secured parties (the Waterfall Provisions). Quarterly principal payments are to be made on the Amortization Loan until December 31, 2024. The Company agreed to an amendment to the financing agreement dated June 25, 2019 to provide, among other things, for a payment deferral mechanism in the event that Vimovo U.S. market exclusivity is lost. The amendment allows the Company to defer a portion of the mandatory minimum quarterly repayments by the difference between one quarter of the then existing US$7.5 million (US$1.9 million per quarter) minimum annual royalty due from Vimovo sales in the U.S. and the actual amount of royalties received in the applicable quarter, in the event Vimovo U.S. market exclusivity is lost earlier than had been expected (2022) prior to the Court of Appeals decision. A generic version of Vimovo entered the U.S. market in the three months ended March 31, 2020 resulting in such loss of exclusivity. The amount of any principal repayment deferred would, until repaid in accordance with the amendment, be subject to an interest rate of 12.5% per annum. To-date, the Company has not availed itself of the deferral mechanism. The carrying value of the debt includes assumptions regarding the deferral option when estimating the timing of payments. As a result of changes in the assumptions regarding the timing of loan payments, for the three months ended March 31, 2021, the Amortization Loan was revalued and a loss of $26 was recorded.
Litigation
From time-to-time, during the ordinary course of business, the Company may be threatened with, or may be named as, a defendant in various legal proceedings, including lawsuits based upon product liability, personal injury, breach of contract and lost profits or other consequential damage claims. On October 30, 2019, the Company received an application for an industry-wide class action in the Superior Court of Québec. In the application, the Company was named as a defendant, along with 33 other defendants which includes a group of companies that manufacture, market, and/or distribute opioids in Québec. The claim is for $30, plus interest for compensatory damages for each class member, $25.0 million from each defendant for punitive damages and pecuniary damages for each class member. The Company believes that the claim is without merit and intends to vigorously defend the matter.
Off-Balance Sheet Arrangements
The Company does not have any off-balance sheet arrangements.
Related Party Transactions
For the three months ended March 31, 2021, there were no related party transactions.
Outstanding Share Data
The number of common shares outstanding as at March 31, 2021 was 11.4 million. The Company had no preferred shares issued and outstanding as at March 31, 2021. As at March 31, 2021, there were 1.7 million options outstanding of which 1.2 million have vested. The Company also has 25.6 common share purchase Warrants outstanding, each exercisable for one common share of the Company at an exercise price of $3.53 per share. The Convertible Loan is convertible into 19.4 million common shares of the Company at a conversion price of US$2.70 per share.
Critical Accounting Policies and Estimates
The preparation of the Consolidated Financial Statements in conformity with IFRS requires management to make estimates and assumptions that affect the reported amounts of assets and liabilities, the disclosure of contingent assets and liabilities at the date of the Consolidated Financial Statements and the reported amounts of revenue and expenses during the reporting periods. Management has identified accounting estimates that it believes are most critical to understanding the Consolidated Financial Statements and those that require the application of management’s most subjective judgments, often requiring the need to make estimates about the effect of matters that are inherently uncertain

and may change in subsequent periods. The Company’s actual results could differ from these estimates and such differences could be material. All significant accounting policies are disclosed in Note 2, Basis of Preparation of the Company’s Condensed Consolidated Interim Financial Statements for the three months ended March 31, 2021 and in Note 3, Summary of Significant Accounting Policies of the Company’s annual Consolidated Financial Statements found on SEDAR at www.sedar.com (under Nuvo Pharmaceuticals Inc.).
Recent Accounting Pronouncements
Accounting Standards Issued But Not Yet Applied Certain new standards, interpretations, amendments, and improvements to existing standards were issued by the IASB or IFRS Interpretations Committee that are mandatory for fiscal periods beginning on or after January 1, 2021.
(a) Amendments to IAS 1, Classification of Liabilities as Current or Non-current (IAS 1) In January 2020, the IASB issued amendments to paragraphs 69 to 76 of IAS 1 to specify the requirements for classifying liabilities as current or non-current. The amendments clarify:
• What is meant by a right to defer settlement
• That a right to defer must exist at the end of the reporting period
• That classification is unaffected by the likelihood that an entity will exercise its deferral right
• That only if an embedded derivative in a convertible liability is itself an equity instrument would the terms of a liability not impact its classification
The amendments are effective for annual reporting periods beginning on or after January 1, 2023 and must be applied retrospectively. The amendments to IAS 1 are not expected to have a significant impact on the Company’s Consolidated Financial Statements.
(b) Reference to the Conceptual Framework – Amendments to IFRS 3
In May 2020, the IASB issued Amendments to IFRS - 3 Business Combinations. The amendments are intended to replace a reference to the Framework for the Preparation and Presentation of Financial Statements, issued in 1989, with a reference to the Conceptual Framework for Financial Reporting issued in March 2018 without significantly changing its requirements. The IASB also added an exception to the recognition principle of IFRS 3 to avoid the issue of potential ‘day 2’ gains or losses arising for liabilities and contingent liabilities that would be within the scope of IAS 37 or IFRIC 21 Levies, if incurred separately. At the same time, the IASB decided to clarify existing guidance in IFRS 3 for contingent assets that would not be affected by replacing the reference to the Framework for the Preparation and Presentation of Financial Statements. The amendments are effective for annual reporting periods beginning on or after January 1, 2022 and apply prospectively.
(c) Property, Plant and Equipment: Proceeds before Intended Use - Amendments to IAS 16 In May 2020, the IASB issued Property, Plant and Equipment - Proceeds before Intended Use, which prohibits entities deducting from the cost of an item of PP&E, any proceeds from selling items produced while bringing that asset to the location and condition necessary for it to be capable of operating in the manner intended by management. Instead, an entity recognizes the proceeds from selling such items, and the costs of producing those items, in profit or loss. The amendment is effective for annual reporting periods beginning on or after January 1, 2022 and must be applied retrospectively to items of PP&E made available for use on or after the beginning of the earliest period presented when the entity first applies the amendment. The amendments are not expected to have a material impact on the Company.
(d) Onerous Contracts – Costs of Fulfilling a Contract – Amendments to IAS 37
In May 2020, the IASB issued amendments to IAS 37 to specify which costs an entity needs to include when assessing whether a contract is onerous or loss-making. The amendments apply a “directly related cost approach”. The costs that relate directly to a contract to provide goods or services include both incremental costs and an allocation of costs directly related to contract activities. G&A costs do not relate directly to a contract and are excluded unless they are explicitly chargeable to the counterparty under the contract. The amendments are effective for annual reporting periods beginning on or after January 1, 2022. The Company will apply these amendments to contracts for which it has not yet fulfilled all its obligations at the beginning of the annual reporting period in which it first applies the amendments. The amendments are not expected to have a material impact on the Company.

(e) Amendments to IFRS 9 – Financial Instruments As part of its 2018-2020 annual improvements to IFRS standards process the IASB issued amendment to IFRS 9. The amendment clarifies the fees that an entity includes when assessing whether the terms of a new or modified financial liability are substantially different from the terms of the original financial liability. These fees include only those paid or received between the borrower and the lender, including fees paid or received by either the borrower or lender on the other’s behalf. An entity applies the amendment to financial liabilities that are modified or exchanged on or after the beginning of the annual reporting period in which the entity first applies the amendment. The amendment is effective for annual reporting periods beginning on or after January 1, 2022 with earlier adoption permitted. The Company will apply the amendments to financial liabilities that are modified or exchanged on or after the beginning of the annual reporting period in which the entity first applies the amendment. The amendments are not expected to have a material impact on the Company.
Management’s Responsibility for Financial Reporting
The Company’s management maintains appropriate information systems, procedures and controls to ensure that information used internally and disclosed externally is complete, accurate, reliable and timely. Disclosure controls and procedures (DCP) are designed to provide reasonable assurance that (i) material information relating to the Company is made known to management by others, particularly during the period in which the filings are being prepared, and (ii) information required to be disclosed by the Company in its filings under Canadian securities legislation is recorded, processed, summarized and reported in a timely manner. The system of DCP includes, among other things, the Company’s Corporate Disclosure and Code of Conduct and Business Ethics policies, the review and approval procedures of the Corporate Disclosure Committee and continuous review and monitoring procedures by senior management. Management is also responsible for the design of internal controls over financial reporting (ICFR) within the Company, in order to provide reasonable assurance regarding the reliability of financial reporting and the preparation of financial statements for external purposes in accordance with IFRS. As of the end of the period covered by this MD&A, the Chief Executive Officer and the Chief Financial Officer of the Company have reviewed and evaluated the Company’s DCP (as that term is defined in National Instrument 52-109 – Certification of Disclosures in Issuers’ Annual and Interim Filings (NI 52-109)) and, based upon that review and evaluation, concluded that those DCP were effective and met the requirements thereof. Nevertheless, management recognizes that any controls and procedures, no matter how well designed and operated, can only provide reasonable assurance and not absolute assurance of achieving the desired control objectives. NI 52-109 requires the Chief Executive Officer and Chief Financial Officer to certify that they are responsible for establishing and maintaining ICFR for the Company and that those internal controls have been designed and are effective in providing reasonable assurance regarding the reliability of financial reporting and the preparation of financial statements for external purposes in accordance with IFRS. The Chief Executive Officer and Chief Financial Officer are also responsible for disclosing any changes to the internal controls for the Company that have materially affected, or are reasonably likely to materially affect, the Company’s ICFR. Management, including the Chief Executive Officer and Chief Financial Officer, does not expect that the disclosure controls or internal controls over financial reporting of the Company will prevent or detect all errors and all fraud or will be effective under all potential future conditions. A control system is subject to inherent limitations and, no matter how well designed and operated, can provide only reasonable, not absolute, assurance that the control systems objectives will be met. Further, the design of a control system must reflect that there are resource constraints, and the benefits of controls must be considered relative to their costs. Inherent limitations include the realities that judgments in decision making can be faulty, and that breakdowns can occur because of simple errors or mistakes. Controls can also be circumvented by individual acts of some persons, by collusion of two or more people or by management override of the controls. Due to the inherent limitations in a cost-effective control system, misstatements due to error or fraud may occur and not be detected. The design of any control system is also based in part upon certain assumptions about the likelihood of future events, and there can be no assurance that any design will succeed in achieving its stated goals under all potential conditions. Projections of any evaluations of effectiveness to future periods are subject to the risk that controls may become inadequate because of changes in conditions, or that the degree of compliance with the policies or procedures may deteriorate.

The Chief Executive Officer and Chief Financial Officer have evaluated the design and operating effectiveness of the internal controls over financial reporting of the Company and concluded that, as of March 31, 2021, and subject to the inherent limitations described above, internal controls over financial reporting were appropriately designed and were operating effectively in accordance with the framework and criteria used by the Company. There have been no changes in the ICFR of the Company during the period of this MD&A that have materially affected, or are reasonably likely to materially affect, the Company’s ICFR.
Risk Factors
Prospects for companies in the biotechnology and pharmaceutical industry generally may be regarded as uncertain given the nature of the industry and, accordingly, investments in biotechnology and pharmaceutical companies should be regarded as speculative. An investor should carefully consider the information contained in this MD&A, in addition to the risk factors discussed in the Company’s AIF under the heading “Risk Factors”, which section is hereby incorporated herein by reference. The disclosures in this MD&A are subject to the risk factors outlined in the AIF. Additional risks and uncertainties not presently known to the Company or that the Company believes to be immaterial may also adversely affect the Company’s business. If any one or more of the risks occur as outlined in the AIF, the Company’s business, financial condition and results of operations could be seriously harmed. Further, if the Company fails to meet the expectations of the public market in any given period, the market price of the Company’s common shares could decline. Before making an investment decision, each prospective investor should carefully consider the risk factors included in the AIF and other public documents.
Disease Outbreaks The occurrence of an illness that leads, or is anticipated to lead, to a local, regional, or national outbreak or epidemic, or to an international outbreak or pandemic, such as Middle East Respiratory Syndrome (MERS-CoV), Severe Acute Respiratory Syndrome (SARS), Ebola (EVD), H1N1 influenza virus, avian flu, or most notably the ongoing COVID-19 pandemic, or any similar illness or mutations thereof, could affect the Company’s business as a result of a general or acute short or medium-term decline in economic activity affecting the Company’s supply chain, the markets for its products, production capacity and staffing levels, and could lead to increased government regulation, quarantine measures, as well as restrictions on travel and the movement of persons or goods. Each of these risk factors has the potential to have a material adverse impact on the Company’s business, financial condition and results of operations.
Forward-looking Statements
This MD&A contains “forward-looking information” as defined under Canadian securities laws (collectively, forward-looking statements). This document should be read in conjunction with material contained in the Company’s Condensed Consolidated Financial Interim Statements for the three months ended March 31, 2021, along with the Company’s other publicly filed documents. Forward-looking statements appear in this MD&A and include, but are not limited to, statements which reflect management’s expectations regarding objectives, plans, goals, strategies, future growth, results of operations, performance, business prospects, opportunities and macroeconomic and industry trends.
The words “plans”, “expects”, “does not expect”, “goals”, “seek”, “strategy”, “future”, “estimates”, “intends”, “anticipates”, “does not anticipate”, “projected”, “believes” or variations of such words and phrases or statements to the effect that certain actions, events or results “may”, “will”, “could”, “would”, “should”, “might”, “likely”, “occur”, “be achieved” or “continue” and similar expressions identify forward-looking statements. In addition, any statements that refer to expectations, intentions, projections or other characterizations of future events or circumstances contain forward-looking statements. Forward-looking statements are not historical facts but instead represent management’s expectations, estimates and projections regarding future events or circumstances. Some of the specific forward-looking statements in this MD&A include, but are not limited to, statements with respect to the following:
• the ability of the Company to execute its growth strategies;
• the ability of the Company to meet its debt commitments;
• the Company’s competitive position within its industry;
• expectations regarding laws, rules and regulations applicable to the Company and the drug development process in general;
• expectations regarding ongoing litigation with respect to the Company’s and competitors’ products;

• expectations regarding industry and demographic trends applicable to the Company;
• expectations regarding the receipt of regulatory decisions applicable to the Company’s or competitors’ products;
• expectations regarding the receipt of milestone and royalty payments in respect of the Company’s products; and
• the expected impact of COVID-19 on the operations, business and financial results of the Company. Such forward-looking statements are qualified in their entirety by the inherent risks, uncertainties and changes in circumstances surrounding future expectations which are difficult to predict and many of which are beyond the control of the Company. Forward-looking statements are necessarily based on a number of estimates and assumptions that, while considered reasonable by management of the Company as of the date of this MD&A, are inherently subject to significant business, economic and competitive uncertainties and contingencies. The Company’s estimates, beliefs and assumptions, which may prove to be incorrect, include the various assumptions set forth herein, including, but not limited to, the Company’s future growth potential, results of operations, future prospects and opportunities, the competitive landscape, industry trends, legislative or regulatory matters, future levels of indebtedness, availability of capital and current economic conditions. When relying on forward-looking statements to make decisions, the Company cautions readers not to place undue reliance on these statements, as forward-looking statements involve significant risks and uncertainties. Forward-looking statements should not be read as guarantees of future performance or results and will not necessarily be accurate indications of whether or not the times at or by which such performance or results will be achieved. A number of factors could cause actual results to differ, possibly materially from the results discussed in the forward-looking statements, including, but not limited to:
• the impact of changing conditions in the regulatory environment and drug development processes;
• increasing competition in the industries in which the Company operates;
• the inability of the Company to meet its debt commitments;
• the impact of unexpected product liability matters;
• the impact of ongoing litigation involving the Company and/or its products;
• the impact of changes in relationships with customers and suppliers;
• the degree of intellectual property protection currently afforded to the Company’s products;
• the conditions applicable to the Company’s milestone and royalty payments being met or unmet;
• the degree of market acceptance of the Company’s products;
• changes in prevailing economic conditions;
• developments and changes in applicable laws and regulations;
• the impact of COVID-19 on the operations, business and financial results of the Company; and
• such other factors discussed under “Risk Factors” in the Company’s most recent AIF. If any risks or uncertainties with respect to the above materialize, or if the opinions, estimates or assumptions underlying the forward-looking statements prove incorrect, actual results or future events might vary materially from those anticipated in the forward-looking statements. The opinions, estimates or assumptions referred to above and described in greater detail under “Risk Factors” in the AIF should be considered carefully by readers. Although management has attempted to identify important risk factors that could cause actual results to differ materially from those contained in forward-looking statements, there may be other risk factors not presently known that management believes are not material that could also cause actual results or future events to differ materially from those expressed in such forward-looking statements. All forward-looking statements are based only on information currently available to the Company and are made as of the date of this MD&A. Except as expressly required by applicable Canadian securities law, the Company assumes no obligation to publicly update or revise any forward-looking statement, whether as a result of new information, future events or otherwise. All forward-looking statements in this MD&A are qualified by these cautionary statements.
Additional Information
Additional information relating to the Company, including the Company’s most recently filed AIF and Management Information Circular, can be found on SEDAR at www.sedar.com (under Nuvo Pharmaceuticals Inc.).

NUVO PHARMACEUTICALS INC.
CONSOLIDATED INTERIM STATEMENTS OF FINANCIAL POSITION
As at March 31, 2021
As at December 31, 2020
(Canadian dollars in thousands) Notes $ $
ASSETS
CURRENT
Cash and cash equivalents 17 23,752 23,807
Accounts receivable 17 8,441 7,488
Inventories 3 10,028 9,490
Other current assets 4 1,957 2,699
Contract assets 17, 18 292 251
TOTAL CURRENT ASSETS 44,470 43,735
NON-CURRENT
Contract assets 17, 18 2,502 2,594
Right-of-use assets 1,000 1,027
Property, plant and equipment 3,452 3,478
Intangible assets 5 70,945 73,486
Goodwill 6 27,355 27,445
TOTAL ASSETS 149,724 151,765
LIABILITIES AND EQUITY
CURRENT
Accounts payable and accrued liabilities 9,676 8,314
Current portion of long-term debt 7 11,910 12,337
Current portion of other obligations 9 429 396
Current income tax liabilities 601 709
TOTAL CURRENT LIABILITIES 22,616 21,756
Long-term debt 88,464 91,360
Other obligations 7 3,413 4,323
Derivative liabilities 8 31,918 13,665
Deferred income tax liabilities 584 299
TOTAL LIABILITIES 146,995 131,403
EQUITY
Common shares 10 184,764 184,764
Contributed surplus 10, 11 16,254 16,153
Accumulated other comprehensive income (AOCI) 292 37
Deficit (198,581) (180,592)
TOTAL EQUITY 2,729 20,362
TOTAL LIABILITIES AND EQUITY 149,724 151,765
Note 16, Commitments and Contingencies See accompanying Notes.

NUVO PHARMACEUTICALS INC. CONSOLIDATED INTERIM STATEMENTS OF INCOME (LOSS) AND
COMPREHENSIVE INCOME (LOSS)
Three Months ended March 31, 2021
Three Months ended
March 31, 2020(i)
(Canadian dollars in thousands, except per share and share figures) Notes $
$
REVENUE
Product sales 18, 19 11,412 13,474
License revenue 18, 19 3,010 10,872
Contract revenue 18, 19 - 15
Total revenue 14,422 24,361
Cost of goods sold 3, 19, 20 4,625 5,486
Gross profit 9,797 18,875
OPERATING EXPENSES
Sales and marketing expenses 19, 20 2,930 2,230
General and administrative expenses 19, 20 2,946 3,940
Amortization of intangibles 5, 19 1,913 2,083
Net interest expense 12, 19 2,586 3,100
Total operating expenses 10,375 11,353
OTHER EXPENSES (INCOME)
Change in fair value of derivative liabilities 8, 19 18,389 2,417
Change in fair value of contingent and variable consideration (gain) 9, 19 (616) 2,129
Foreign currency loss (gain) (714) 4,697
Other losses (gains) 13, 19 96 (1,374)
Net loss before income taxes
(17,733) (347)
Income tax expense 19 256 1,382
NET LOSS (17,989) (1,729)
Other comprehensive loss to be reclassified to net loss in subsequent periods
Unrealized gain on translation of foreign operations 255 454
TOTAL COMPREHENSIVE LOSS (17,734) (1,275)
Net loss per common share
- basic 14 (1.58) (0.15)
- diluted 14 (1.58) (0.15)
Average number of common shares outstanding (in thousands)
- basic 14 11,388 11,388
- diluted 14 11,388 11,388
(i) Includes restated figures for the three months ended March 31, 2020. See accompanying Notes.

NUVO PHARMACEUTICALS INC. CONSOLIDATED INTERIM STATEMENTS OF CHANGES IN EQUITY
Common Shares Contributed
Surplus
AOCI
Deficit
Total (Canadian dollars in thousands, except for number of shares) 000s $ $ $ $ $
Notes 10, 11 10, 11 10, 11
Balance, December 31, 2019 11,388 184,764 15,892 (63) (176,501) 24,092
Stock option compensation expense - - 105 - - 105 Unrealized gain on translation of foreign
operations - - - 454 - 454
Net loss - - - - (1,729) (1,729)
Balance, March 31, 2020 11,388 184,764 15,997 391 (178,230) 22,922
Stock option compensation expense - - 156 - - 156 Unrealized loss on translation of foreign
operations - - - (354) - (354)
Net loss - - - - (2,362) (2,362)
Balance, December 31, 2020 11,388 184,764 16,153 37 (180,592) 20,362
Stock option compensation expense - - 101 - - 101 Unrealized gain on translation of foreign
operations - - - 255 - 255
Net loss - - - - (17,989) (17,989)
Balance, March 31, 2021 11,388 184,764 16,254 292 (198,581) 2,729
See accompanying Notes.

NUVO PHARMACEUTICALS INC. CONSOLIDATED INTERIM STATEMENTS OF CASH FLOWS
Three Months ended
March 31, 2021 Three Months ended
March 31, 2020
(Canadian dollars in thousands) Notes $ $
OPERATING ACTIVITIES
Net loss (17,989) (1,729)
Items not involving current cash flows:
Depreciation and amortization 2,076 2,349
Other losses 70 -
Provision for deferred income taxes 285 -
Contract asset additions 18 - (5,496)
Accreted non-cash interest, net and amortization of
deferred financing fees 7 1,636 1,803
Change in fair value of long-term debt 7 26 (1,564)
Change in fair value of derivative liabilities 8 18,389 2,417
Equity-settled stock-based compensation 11 101 105
Cash-settled stock appreciation rights 11 4 -
Unrealized foreign exchange loss (gain) (1,280) 5,620
Change in fair value of contingent and variable
consideration 9 (616) 2,129
Change in allowance for doubtful accounts (82) 5
Inventory write-down 3 18 16
Inventory step-up expense 3 35 362
Disposal of fixed assets - 186
2,673 6,203
Net change in non-cash working capital 15 512 (1,127)
Payment of contingent consideration 9 (90) -
CASH PROVIDED BY OPERATING ACTIVITIES 3,095 5,076
INVESTING ACTIVITIES
Acquisition of property, plant and equipment (110) (22)
Acquisition of intangible assets 5 (124) -
Disposal of intangible assets 5 488 -
CASH PROVIDED BY (USED IN) INVESTING ACTIVITIES 254 (22)
FINANCING ACTIVITIES
Principal payment on debt 7 (3,563) (11,549)
Cash payment of lease liabilities (56) (190)
CASH USED IN FINANCING ACTIVITIES (3,619) (11,739)
Effect of exchange rate changes on cash 215 (34)
Net change in cash during the period (55) (6,719)
Cash and cash equivalents, beginning of period 23,807 23,019
CASH AND CASH EQUIVALENTS, END OF PERIOD 23,752 16,300
See accompanying Notes.
Supplemental Cash Flow Information
Interest received(i) 6 62
Interest paid(i) 1,051 1,339
Income taxes paid 26 - (i) Amounts have been reflected as operating cash flows in the Consolidated Interim Statements of Cash Flows. See accompanying Notes.

NUVO PHARMACEUTICALS INC.
NOTES TO THE CONDENSED CONSOLIDATED INTERIM FINANCIAL STATEMENTS Unless noted otherwise, all amounts shown are in thousands of Canadian dollars, except per share amounts. 1. NATURE OF BUSINESS Nuvo Pharmaceuticals® Inc. d/b/a Miravo Healthcare™ (Miravo or the Company) is a Canadian focused, healthcare company with global reach and a diversified portfolio of commercial products. The Company’s products target several therapeutic areas, including pain, allergy, neurology and dermatology. The Company’s strategy is to in-license and acquire growth-oriented, complementary products for Canadian and international markets. The Company’s registered office and principal place of business is located at 6733 Mississauga Road, Suite 800, Mississauga, Ontario, Canada, L5N 6J5, its international operations are located in Dublin, Ireland and its manufacturing facility is located in Varennes, Québec, Canada. The Varennes facility operates in a Good Manufacturing Practices (GMP) environment respecting the U.S., Canada and E.U. GMP regulations and is regularly inspected by Health Canada and the U.S. Food and Drug Administration (FDA). 2. BASIS OF PREPARATION Statement of Compliance These Condensed Consolidated Interim Financial Statements have been prepared by management in accordance with International Financial Reporting Standards (IFRS), as issued by the International Accounting Standards Board (IASB). The policies applied to these Condensed Consolidated Interim Financial Statements are based on IFRS, which have been applied consistently to all periods presented. These Condensed Consolidated Interim Financial Statements were issued and effective as at May 14, 2021, the date the Board of Directors approved these Condensed Consolidated Interim Financial Statements. The preparation of financial statements in accordance with International Accounting Standards (IAS) 34 requires the use of certain critical accounting estimates. It also requires management to exercise judgment in applying the Company’s accounting policies. The areas involving a higher degree of judgment or complexity or areas where assumptions and estimates are significant to these Condensed Consolidated Interim Financial Statements were the same as those that applied to the Company’s annual Consolidated Financial Statements as at and for the year ended December 31, 2020, except as noted below (See “Use of Estimates and Judgments”). Basis of Measurement These Condensed Consolidated Interim Financial Statements have been prepared under the historical cost convention, except for the revaluation of certain financial assets and financial liabilities to fair value. Items included in the financial statements of each consolidated entity in the Company are measured using the currency of the primary economic environment in which the entity operates (the functional currency). These Condensed Consolidated Interim Financial Statements are presented in Canadian dollars, which is the Company’s functional currency and presentation currency.
Basis of Consolidation These Condensed Consolidated Interim Financial Statements include the accounts of the Company and its subsidiaries as follows:
All significant intercompany balances and transactions have been eliminated upon consolidation.
% Ownership
Aralez Pharmaceuticals Canada Inc. 100
Nuvo Pharmaceuticals (Ireland) Designated Activity Company 100

Use of Estimates and Judgments The key assumptions concerning the future and other key sources of estimation uncertainty at the reporting date, that have a significant risk of causing a material adjustment to the carrying amounts of assets and liabilities within the next financial year, are described below. The Company based its assumptions and estimates on parameters available when these Condensed Consolidated Interim Financial Statements were prepared. Existing circumstances and assumptions about future developments; however, may change due to market changes or circumstances arising that are beyond the control of the Company. Such changes are reflected in the assumptions when they occur.
(i) Determination of Share Appreciation Rights Liabilities Share Appreciation Rights (SARs) are accounted for by the Company as cash-settled awards. SARs are issued to directors, officers or employees to provide incentive compensation based on the appreciation in value of the Company’s common shares. Fair market value is determined by the closing price of the Company’s common share, determined based on Black-Scholes option pricing model. Under the SARs Plan, participants receive, upon vesting, a cash amount equal to the difference between the SARs’ fair market value and the grant price value, also known as the intrinsic value. Until SARs vest, compensation expense is measured based on the fair value of the SARs at the end of each reporting period. The fair value of the liability is remeasured at the end of each reporting date and adjusted at the settlement date when the intrinsic value is realized. The SARs accrual is included in accounts payable and accrued liabilities (See Note 11, Stock-based Compensation and Other Stock-based Payments).
Financial Instruments
There are three measurement categories in which the Company classifies its financial assets:
• Amortized cost: Financial instruments that are held for collection of contractual cash flows, where those cash flows represent solely payments of principal and interest, are measured at amortized cost. Interest income (expense) from these financial instruments is recorded in net income (loss) using the effective interest rate method.
• Fair value through other comprehensive income (FVOCI): Debt instruments that are held for collection of contractual cash flows and for selling the financial instruments, where the financial instruments’ cash flows represent solely payments of principal and interest, are measured at FVOCI. Movements in the carrying amount are taken through OCI, except for the recognition of impairment gains or losses, interest income and foreign exchange gains and losses that are recognized in net income (loss). When the financial instrument is derecognized, the cumulative gain or loss previously recognized in OCI is reclassified from equity to net income (loss) and recognized in other gains (losses). Interest income (expense) from these financial instruments is included in interest using the effective interest rate method. Foreign exchange gains (losses) are presented in other gains (losses) and impairment expenses in other expenses (income).
• Fair value through profit (loss) (FVTPL): Financial instruments that do not meet the criteria for amortized cost or FVOCI are measured at FVTPL. A gain or loss on a financial instrument that is subsequently measured at FVTPL and is not part of a hedging relationship is recognized in net income (loss) and presented net in comprehensive income (loss) within other gains (losses) in the period in which it arises.
Financial liabilities are either classified as amortized cost or FVTPL. For financial liabilities held at amortized cost, when the Company revises its estimates of payments, it will adjust the gross carrying amount of the amortized cost of a financial liability to reflect actual and revised estimated contractual cash flows. The Company recalculates the gross carrying amount of the amortized cost of the financial liability as the present value of the estimated future contractual cash flows that are discounted at the financial instrument’s original effective interest rate. The adjustment is recognized in income (loss) for the period. The Company classifies its financial instruments as follows:
• Cash and cash equivalents, accounts receivable, accounts payable, accrued liabilities, long-term debt and other obligations are measured at amortized cost. Interest income and interest expense are recorded in net income (loss), as applicable.
• Embedded derivatives, including the conversion feature of the Convertible Loan and the prepayment option on the Bridge Loan and Amortization Loan, are separated from the host contract and accounted for separately if the host contract is not a financial asset and certain criteria are met. The conversion feature, prepayment option and the Warrants are initially measured at fair value and subsequently measured at FVTPL.

Accounting Standards Issued But Not Yet Applied Certain new standards, interpretations, amendments and improvements to existing standards were issued by the IASB or IFRS Interpretations Committee that are mandatory for fiscal periods beginning on or after January 1, 2021.
(a) Amendments to IAS 1, Classification of Liabilities as Current or Non-current (IAS 1) In January 2020, the IASB issued amendments to paragraphs 69 to 76 of IAS 1 to specify the requirements for classifying liabilities as current or non-current. The amendments clarify:
• What is meant by a right to defer settlement
• That a right to defer must exist at the end of the reporting period
• That classification is unaffected by the likelihood that an entity will exercise its deferral right
• That only if an embedded derivative in a convertible liability is itself an equity instrument would the terms of a liability not impact its classification
The amendments are effective for annual reporting periods beginning on or after January 1, 2023 and must be applied retrospectively. The amendments to IAS 1 are not expected to have a significant impact on the Company’s Consolidated Financial Statements.
(b) Reference to the Conceptual Framework - Amendments to IFRS 3
In May 2020, the IASB issued Amendments to IFRS 3 - Business Combinations (IFRS 3). The amendments are intended to replace a reference to the Framework for the Preparation and Presentation of Financial Statements, issued in 1989, with a reference to the Conceptual Framework for Financial Reporting issued in March 2018 without significantly changing its requirements. The IASB also added an exception to the recognition principle of IFRS 3 to avoid the issue of potential ‘day 2’ gains or losses arising for liabilities and contingent liabilities that would be within the scope of IAS 37 or IFRIC 21 Levies, if incurred separately. At the same time, the IASB decided to clarify existing guidance in IFRS 3 for contingent assets that would not be affected by replacing the reference to the Framework for the Preparation and Presentation of Financial Statements. The amendments are effective for annual reporting periods beginning on or after 1 January 2022 and apply prospectively.
(c) Property, Plant and Equipment: Proceeds before Intended Use - Amendments to IAS 16 In May 2020, the IASB issued IAS 16, Property, Plant and Equipment - Proceeds before Intended Use, which prohibits entities deducting from the cost of an item of property, plant and equipment (PP&E), any proceeds from selling items produced while bringing that asset to the location and condition necessary for it to be capable of operating in the manner intended by management. Instead, an entity recognizes the proceeds from selling such items, and the costs of producing those items, in profit or loss. The amendment is effective for annual reporting periods beginning on or after January 1, 2022 and must be applied retrospectively to items of PP&E made available for use on or after the beginning of the earliest period presented when the entity first applies the amendment. The amendments are not expected to have a material impact on the Company.
(d) Onerous Contracts – Costs of Fulfilling a Contract - Amendments to IAS 37
In May 2020, the IASB issued amendments to IAS 37, Provisions, Contingent Liabilities and Contingent Assets (IAS 37) to specify which costs an entity needs to include when assessing whether a contract is onerous or loss-making. The amendments apply a “directly related cost approach”. The costs that relate directly to a contract to provide goods or services include both incremental costs and an allocation of costs directly related to contract activities. General and administrative (G&A) costs do not relate directly to a contract and are excluded unless they are explicitly chargeable to the counterparty under the contract. The amendments are effective for annual reporting periods beginning on or after January 1, 2022. The Company will apply these amendments to contracts for which it has not yet fulfilled all its obligations at the beginning of the annual reporting period in which it first applies the amendments. The amendments are not expected to have a material impact on the Company.
(e) Amendments to IFRS 9 - Financial Instruments As part of its 2018-2020 annual improvements to IFRS standards process the IASB issued amendments to IFRS 9 - Financial Instruments (IFRS 9). The amendments clarify the fees that an entity includes when assessing whether the terms of a new or modified financial liability are substantially different from the terms

of the original financial liability. These fees include only those paid or received between the borrower and the lender, including fees paid or received by either the borrower or lender on the other’s behalf. An entity applies the amendments to financial liabilities that are modified or exchanged on or after the beginning of the annual reporting period in which the entity first applies the amendment. The amendments are effective for annual reporting periods beginning on or after 1 January 2022 with earlier adoption permitted. The Company will apply the amendments to financial liabilities that are modified or exchanged on or after the beginning of the annual reporting period in which the entity first applies the amendment. The amendments are not expected to have a material impact on the Company.
3. INVENTORIES Inventories consist of the following as at
March 31, 2021 December 31, 2020
$ $
Raw materials 2,106 2,514
Work in process 831 546
Finished goods, net of provision(i) 7,091 6,430
10,028 9,490
(i) Includes $nil inventory step-up value for inventory acquired by the Company as part of the Aralez Transaction [December 31, 2020 - $35]. During the three months ended March 31, 2021, inventories in the amount of $3.1 million were recognized as cost of goods sold (COGS) [March 31, 2020 - $3.0 million]. During the three months ended March 31, 2021, inventories in the amount of $18 were written down [March 31, 2020 - $16] and there were no reversals of prior year write-downs during the three months ended March 31, 2021 and 2020. COGS for the three months ended March 31, 2021, included $35 of inventory step-up expense [March 31, 2020 - $0.4 million] for the sale of inventory that was acquired by the Company as part of the Aralez Transaction. In accordance with IFRS 3, inventory was initially recognized at fair value less reasonable selling costs. 4. OTHER CURRENT ASSETS Other current assets consist of the following as at:
March 31, 2021 December 31, 2020
$ $
Deposits 291 295
Promotional supplies 904 1,072
Prepaid expenses 658 959
Other receivables 104 373
1,957 2,699

5. INTANGIBLE ASSETS Intangible assets consist of the following as at:
Patents Brand Licenses Software Total
Cost $ $ $ $ $
Balance, December 31, 2020 38,423 2,125 50,817 193 91,558
Additions - - - 124 124
Disposals(i) - - (574) - (574)
Foreign exchange movements (459) 1 - - (458)
Balance, March 31, 2021 37,964 2,126 50,243 317 90,650
Accumulated amortization
Balance, December 31, 2020 12,284 - 5,788 - 18,072
Amortization expense 1,193 - 720 - 1,913
Disposals(i) - - (86) - (86)
Foreign exchange movements (194) - - - (194)
Balance, March 31, 2021 13,283 - 6,422 - 19,705
Net book value as at March 31, 2021 24,681 2,126 43,821 317 70,945
(i) During the three months ended March 31, 2021, the Company disposed of two mature products from its commercial segment for proceeds
of $0.5 million.
The Company determined that there were no indicators of impairment that exist for intangible assets as at March 31, 2021. In the current quarter, there were no changes to the key assumptions and sensitivities used in the annual impairment test as at December 31, 2020. 6. GOODWILL
Goodwill consists of the following as at:
March 31, 2021 December 31, 2020
Cost $ $
Ex-U.S. Resultz® acquisition 1,187 1,187
Aralez Transaction 26,763 26,763
Foreign exchange movements, cumulative (595) (505)
Balance 27,355 27,445
Goodwill continuity for the period ended:
2021
$ 2020
$
Balance, January 1 27,445 27,580
Foreign exchange movements (90) 983
Balance, March 31 27,355 28,563
Goodwill is recognized on the acquisition date when total consideration exceeds the net identifiable assets acquired. The Company determined that there were no indicators of impairment that exist for goodwill as at March 31, 2021.

7. LOANS AND BORROWINGS The Company’s loans are financed by Deerfield Management Company, L.P. (Deerfield). On December 31, 2018, the Company received total proceeds of $161.7 million (US$118.5 million) from Deerfield in exchange for issuing the Amortization Loan, the Bridge Loan, the Convertible Loan and Warrants. In addition to these freestanding instruments, there were two embedded derivatives requiring bifurcation: the conversion feature in the Convertible Loan (See Note 8, Derivative Liabilities) and the prepayment option in the Amortization Loan. The Company’s loans and borrowings were measured at amortized cost as follows:
March 31, 2021
$ December 31, 2020
$
CURRENT
Bridge Loan (i) - -
Amortization Loan (ii) 11,910 12,337
11,910 12,337
NON-CURRENT
Amortization Loan (ii) 36,152 39,116
Convertible Loan – debt host (iii) 52,312 52,244
88,464 91,360
The Loans are guaranteed by Aralez Pharmaceuticals Canada Inc. (Aralez Canada) and cross-guaranteed by each of the Company and Miravo Ireland as to each other’s obligations and are secured by a first-ranking charge over substantially all property of each of the Company, Miravo Ireland and Aralez Canada.
During the three months ended March 31, 2021, the Company made principal loan repayments of $3.6 million (US$2.9 million) applied to the Amortization Loan. In the year ended December 31, 2019, the Company was permitted to delay the minimum principal payments if a minimum of US$10 million in aggregate was paid by the payment date of the fourth quarter. During the three months ended March 31, 2020, the Company made principal loan repayments of $4.5 million (US$3.5 million) applied to the Bridge Loan and $7.0 million (US$5.2 million) applied to the Amortization Loan. (i) Bridge Loan The Bridge Loan was issued on December 31, 2018 in the principal amount of $8.2 million (US$6.0 million). The carrying value reflects an allocation of transaction costs, which reduced the carrying value of the respective liability and are reflected in the calculation of interest expense under the effective interest rate method. The change in the carrying value of this liability was as follows:
2021
$ 2020
$
As at January 1 - 4,493
Principal repayment - (4,528)
Interest accretion during the period - (8)
Modification on prepayment and debt amendment - -
Foreign currency movement - 43
Balance, March 31 - -
During the three months ended March 31, 2020, the Company repaid the outstanding balance of the Bridge Loan. (ii) Amortization Loan The Amortization Loan was issued on December 31, 2018 in the principal amount of $81.9 million (US$60 million). The carrying value reflects an allocation of transaction costs, which reduced the carrying value of the respective liability and are reflected in the calculation of interest expense under the effective interest rate method.

The change in the carrying value of this liability was as follows:
2021
$ 2020
$
As at January 1 51,453 68,464
Principal repayment (3,563) (7,021)
Interest accretion during the period 812 1,085
Change in fair value of long-term debt 26 (1,564)
Foreign currency movement (683) 5,892
Balance, March 31 48,045 66,856
Interest on the Amortization Loan is accrued and paid on a quarterly basis. Any repayment of principal on the Amortization Loan prior to its payment terms is considered a prepayment to which a 0.25% prepayment fee applies. The Company has the right to prepay the Amortization Loan at any time. The fair value of the prepayment option bifurcated from the Amortization Loan was a derivative asset with a nominal value as at March 31, 2021 and is presented net of the non-current portion of the long-term debt. Each quarter, the Company is required to pay to the lenders the greater of US$2.5 million or 50% of the Company’s excess cash flows, a defined term in the facility agreement with Deerfield (Deerfield Facility Agreement), which is applied in the following order: (a) any unpaid fees and transaction costs; (b) proportionately to any accrued and unpaid interest related to these Loans; (c) any unpaid principal of the Bridge Loan, including the applicable prepayment fee; (d) any unpaid principal of the Amortization Loan, including the applicable prepayment fee; and (e) any other obligations owing to the lenders, administrative agent or other secured parties (the Waterfall Provisions). The Company agreed to an amendment to the financing agreement dated June 25, 2019 to provide, among other things, for a payment deferral mechanism in the event that Vimovo U.S. market exclusivity is lost. The amendment allows the Company to defer a portion of the mandatory minimum quarterly repayments by the difference between one quarter of the then existing US$7.5 million (US$1.9 million per quarter) minimum annual royalty due from Vimovo sales in the U.S. and the actual amount of royalties received in the applicable quarter, in the event Vimovo U.S. market exclusivity is lost earlier than had been expected (2022) prior to the Court of Appeals decision. A generic version of Vimovo entered the U.S. market in the three months ended March 31, 2020. The amount of any principal repayment deferred would, until repaid in accordance with the amendment, be subject to an interest rate of 12.5% per annum. To-date, the Company has not availed itself of the deferral mechanism. The carrying value of the debt includes assumptions regarding the deferral option when estimating the timing of payments. As a result of changes in the assumptions regarding the timing of the payments, a loss of $26 was recorded in the three months ended March 31, 2021 [March 31, 2020 - gain of $1.6 million]. (iii) Convertible Loan The Convertible Loan was issued on December 31, 2018 in the principal amount of $71.6 million (US$52.5 million). The fair value of the conversion feature as at March 31, 2021 in the amount of $13.1 million has been classified as a derivative financial liability, as described in Note 8, Derivative Liabilities. The carrying value reflects an allocation of transaction costs, which reduces the carrying value of the respective liability and are reflected in the calculation of interest expense under the effective interest rate method. The change in carrying value of this liability was as follows:
2021
$ 2020
$
As at January 1 52,244 50,420
Interest accretion during the period 743 712
Foreign currency movement (658) 4,658
Balance, March 31 52,329 55,790
Interest on the Convertible Loan is accrued and paid on a quarterly basis.

The Convertible Loan is convertible at any time at the option of the holder into 19,444,444 common shares of the Company at a conversion price of US$2.70 per share, subject to certain restrictions described in Note 8, Derivative Liabilities. Early repayment is not permitted for the Convertible Loan. Any debenture not converted will be repaid on December 31, 2024. 8. DERIVATIVE LIABILITIES The Company’s derivative liabilities are measured at FVTPL and are summarized below:
March 31, 2021
$ December 31, 2020
$
Conversion feature on Convertible Loan 13,050 5,664
Warrants 18,868 8,001
31,918 13,665
During the three months ended March 31, 2021, the Company recognized a non-cash $18.4 million charge on the change in fair value of derivative liabilities [$2.4 million for the three months ended March 31, 2020]. During the three months ended March 31, 2021, the Company recognized a gain on foreign exchange of $0.1 million [$0.1 million loss for the three months ended March 31, 2020]. Conversion feature The conversion feature is embedded in the Convertible Loan described in Note 7, Loans and Borrowings and allows the holder to convert the outstanding principal amount of the debentures into common shares of the Company at any time at a conversion price of US$2.70 per share, subject to a restriction that the holder shall not ultimately hold more than 4.985% of the total number of common shares of the Company at any one time. Warrants On December 31, 2018, the Company issued 25,555,556 Warrants with a total fair value of $19.1 million (US$14.0 million). Each Warrant is exercisable at the option of the holder for one common share of the Company at an exercise price of $3.53 per Warrant and expires December 31, 2024. Any exercise is subject to a restriction that the holder shall not ultimately hold more than 4.985% of the total number of common shares of the Company at any one time. The fair value of the Warrants is determined using the Black-Scholes option pricing model. The Warrants contain contingent settlement provisions that would require the Company to settle the Warrants as a financial liability in certain circumstances, some of which are beyond the control of both the Company and the holder, such as bankruptcy or insolvency, which requires the Warrants to be classified as derivative liabilities. There are three methods of Warrant settlement, all at the option of the holder. The first method of settlement requires the holder to remit the exercise price of $3.53 per Warrant and the Company will issue a common share of the Company. The second method results in the $3.53 per Warrant strike price being applied as a payment against the principal balance of the Amortization Loan outstanding. The third method of exercise applies to those Warrants classified as Flexible Exercise Shares (FES). Warrants considered FES can be exercised without upfront remuneration to the Company. Instead, the Company issues fractional shares equal to the difference between the current share price and the $3.53 exercise price of the Warrant. As at March 31, 2021, 9,326,667 of the 25,555,556 Warrants outstanding were classified as FES. Following a Major Transaction (as defined in the Deerfield Facility Agreement), subject to certain conditions, the Warrants will become exercisable for an additional number of common shares determined in accordance with the terms of the Warrants, subject to continued application of the 4.985% cap. In the case of certain Major Transactions involving the conversion of the common shares into the right to receive cash, securities or other assets (either under the Major Transaction or a subsequent liquidation of the Company), a holder of Warrants is permitted to exercise the Warrants (without the application of the 4.985% cap) for the additional number of common shares described above immediately prior to and conditional upon completion of the Major Transaction, such that the holder ultimately receives the cash, securities or other assets, as applicable, in exchange for such common shares on the same terms as other holders of common shares. See the Deerfield Facility Agreement and the forms of Convertible Notes and Warrants filed under the Company’s profile on www.sedar.com (under Nuvo Pharmaceuticals Inc.).

Inputs to fair value models Key assumptions used in determining the fair values of the Company’s derivative liabilities at initial recognition and period-end are summarized below as at:
Conversion Feature
Issue date December 31, 2018 December 31, 2018
Valuation date March 31, 2021 December 31, 2020
Share price $1.67 $0.91
Risk-free interest rate 0.56% 0.26%
Discount for lack of marketability 16.00% 10.00%
Dividend yield 0% 0%
Volatility factor 98.0% 91.5%
Expected life 3.76 years 4 years
Warrants
Issue date December 31, 2018 December 31, 2018
Valuation date March 31, 2021 December 31, 2020
Share price $1.67 $0.91
Risk-free interest rate 0.68% 0.32%
Discount for lack of marketability 16.00% 10.00%
Dividend yield 0% 0%
Volatility factor 98.0% 91.5%
Expected life 3.76 years 4 years
9. OTHER OBLIGATIONS Other obligations consist of the following as at:
March 31, 2021 December 31, 2020
$ $
Contingent and variable consideration related to the ex-U.S. acquisition of Resultz 1,371 2,180
Contingent and variable consideration related to the Aralez Transaction 982 1,074
Lease obligations(i) 1,489 1,465
Less amounts due within one year (429) (396)
Long-term balance 3,413 4,323
(i) As at March 31, 2021, the Company recognized $1.5 million [December 31, 2020 - $1.5 million] of lease obligations related to IFRS 16 -
Leases.
The Company recognized $2.4 million in contingent and variable consideration as at March 31, 2021 [December 31, 2020 - $3.2 million], which represented the present value of the Company’s probability-weighted estimate of the cash outflow related to the ex-U.S. Resultz acquisition and the profits earned from Yosprala, which was acquired as part of the Aralez Transaction. For the three months ended March 31, 2021, the contingent consideration liability related to the ex-U.S. Resultz acquisition and the Aralez Transaction. The ex-U.S. Resultz acquisition included additional contingent consideration based on meeting certain milestones in partnered markets, payable only if those targets are achieved, as well as variable consideration based on annual royalties earned in non-partnered markets. The Aralez Transaction included contingent consideration in the form of 50% of the lifetime net earnings from monetization of Yosprala. The fair value of contingent consideration initially recognized represented the present value of the Company’s probability-weighted estimate of cash outflows related to the monetization of Yosprala in the U.S. market. In the three months ended March 31, 2021, the Company made a contingent consideration payment of $90.

Contingent and Variable Consideration The change in the carrying value of this liability was as follows:
2021
$ 2020
$
As at January 1 3,254 2,814
Recognition of contingent consideration in relation to the Aralez Transaction - 2,548 Remeasurement of contingent consideration in relation to the ex-U.S. acquisition
of Resultz (741) (407)
Payments during the period (90) -
Additions to contingent consideration in relation to the Aralez Transaction 93 -
Interest Accretion 25 -
Foreign exchange (188) 254
Balance, March 31 2,353 5,209
Lease Obligations The change in the carrying value of this liability was as follows:
2021
$ 2020
$
As at January 1 1,465 594
Modification of lease - 632
Payments during the period (56) (190)
Interest expense during the period 37 9
Lease Incentive 43 -
Balance, March 31 1,489 1,045
10. CAPITAL STOCK Authorized
• Unlimited first and second preferred shares, non-voting, non-participating, issuable in series, number, designation, rights, privileges, restrictions and conditions are determinable by the Company’s Board of Directors.
• Unlimited common shares, voting, without par value. 11. STOCK-BASED COMPENSATION AND OTHER STOCK-BASED PAYMENTS The Company has four stock-based compensation plans: the Share Option Plan, the Share Purchase Plan, the Share Bonus Plan, each a component of the Company’s Share Incentive Plan, and the Share Appreciation Rights Plan. Share Incentive Plan On May 11, 2020, the Company’s shareholders approved a resolution affirming, ratifying and approving the Share Incentive Plan and approving all of the unallocated common shares issuable pursuant to the Share Incentive Plan. The Toronto Stock Exchange (TSX) requires that the Company’s Share Incentive Plan, along with any unallocated options, rights or other entitlements, receive shareholder approval at the Company’s annual meeting every three years. The maximum number of common shares that will be reserved for issuance under the Share Incentive Plan shall be 15% of the total number of common shares outstanding from time-to-time. The allocation of such maximum percentage among the three sub plans comprising the Share Incentive Plan shall be determined by the Board of Directors from time-to-time (provided that the maximum number of common shares that may be issued under the Share Bonus Plan shall not exceed a fixed number of common shares, which was 344,615). As at March 31, 2021, the number of common shares available for issuance under the Share Incentive Plan was 40,337.

Share Option Plan Under the Share Option Plan, the Company may grant options to purchase common shares to officers, directors, employees or consultants of the Company or its affiliates. Options issued under the Share Option Plan are granted for a term not exceeding ten years from the date of grant. All options issued to-date have a life of ten years. In general, options have vested either immediately upon grant or over a period of one to four years or upon the achievement of certain performance-related measures or milestones. Under the provisions of the Share Option Plan, the exercise price of all stock options shall not be less than the closing price of the common shares on the last trading date immediately preceding the grant date of the option. The following is a schedule of the options outstanding as at:
Options
Range of Exercise Price
Weighted Average Exercise Price
000s $ $
Balance, December 31, 2020 1,572 0.57 - 5.75 3.38
Granted 96 1.74 1.74
Balance, March 31, 2021 1,668 0.57 - 5.75 3.29
The fair value of each tranche is measured at the date of grant using the Black-Scholes option pricing model. Options were valued with a calculated forfeiture rate of 7% [December 31, 2020 - 7%] and the remaining model inputs for options granted during the three months ended March 31, 2021 were as follows:
Options Grant Date Share Price
Exercise Price
Risk-free Interest Rate
Expected Life
Volatility Factor Fair Values
000s $ $ % (years) % $
96 March 11, 2021 1.74 1.74 1.09 5 - 7 72 - 73 1.06 – 1.17
The following table summarizes the outstanding and exercisable options held by directors, officers, employees and consultants as at March 31, 2021:
Outstanding Exercisable Exercise
Price Range Options Remaining
Contractual Life Weighted Average
Exercise Price Vested
Options Weighted Average
Exercise Price
$ 000s years $ 000s $
0.57 - 1.53 350 8.11 0.72 138 0.92
1.54 - 2.65 498 6.90 2.28 312 2.45
2.66 - 5.08 341 4.60 4.12 308 4.18
5.09 - 5.75 479 5.60 5.63 478 5.63
1,668 6.31 3.29 1,236 3.94
Share Purchase Plan Under the Share Purchase Plan, eligible officers or employees of the Company may contribute up to 10% of their annual base salary to the plan to purchase the Company’s common shares. The Company matches each participant’s contribution by issuing the Company’s common shares having a value equal to the aggregate amount contributed by each participating employee. During the three months ended March 31, 2021 and March 31, 2020, there was no issuance of shares under the Share Purchase Plan. Share Appreciation Rights On March 5, 2021, the Company’s directors approved a SARs Plan for directors, officers and employees of the Company and its affiliates to provide incentive compensation based on the appreciation in value of the Company’s common shares. Pursuant to the terms of the SARs Plan, participants are eligible to receive a grant of SARs, which are priced at no less than the value of the closing price of the Company’s common shares on the TSX on the day preceding the date of the grant (Grant Price). Upon vesting, a cash amount equal to the difference between the SARs fair market value on the vesting date and the Grant Price, also known as the intrinsic value, is paid to the participant. Fair market value on the vesting date is the closing price of the Company’s common share on the TSX on the day preceding the vesting date. The compensation expense is measured quarterly based on the fair value

of the SARs, amortized over the vesting period, using the Black-Scholes option pricing model. The fair value of the liability is remeasured at the end of each reporting period. The SARs accrual is included in accounts payable and accrued liabilities. The fair value of the tranche issued and outstanding in the period was measured as at March 31, 2021, determined based on the Black-Scholes option pricing model, using the following inputs:
SARs
Grant Date
Exercise Price (Grant Price)
Risk-free Interest Rate
Expected Life
Volatility Factor
Fair Values
(000s) $ % (years) % $
284 March 11, 2021 1.74 0.23 3 90.52 0.99
The following table summarizes the outstanding SARs and related accrual as at March 31, 2021:
Number of SARs
Fair Values Accrual
000s $ $
Balance, December 31, 2020 - - -
Granted 284 0.99 -
Remeasurement - (0.05) 4
Balance, March 31, 2021 284 0.94 4
Summary of Stock-based Compensation
Three Months ended
March 31, 2021 Three Months ended
March 31, 2020
$ $
Stock option compensation expense under the Share Option Plan 101 105
SARs compensation expense 4 -
Stock-based compensation expense 105 105
Recorded in the Consolidated Interim Statements of Loss and Comprehensive Loss as follows:
Cost of goods sold 11 12
Sales and marketing expenses 3 3
General and administrative expenses 91 90
105 105
12. NET INTEREST EXPENSE
Three Months ended
March 31, 2021 Three Months ended
March 31, 2020
$ $
Interest expense on financial liabilities measured at amortized cost(i) 2,636 3,140
Interest income on contract assets (35) (5)
Interest income on cash and cash equivalents (15) (35)
Net interest expense (income) 2,586 3,100
(i) The Deerfield Financing requires the Company to make quarterly interest payments on outstanding loans. The coupon rate for the
Amortization Loan and the Convertible Loan is 3.5%. During the three months ended March 31, 2021, the Company made cash interest payments of $1.1 million (US$0.8 million) to Deerfield [March 31, 2020 - $1.3 million (US $1.0 million)].

13. OTHER LOSSES (GAINS)
Three Months ended
March 31, 2021 Three Months ended
March 31, 2020
$ $
Loss (gain) on valuation of long-term debt(i) 26 (1,564)
Loss (gain) on disposal of fixed assets - 186
Other 70 4
Other losses (gains) 96 (1,374)
(i) As a result of changes in the assumptions regarding the timing and amount of debt repayments, a loss on revaluation of long-term debt of
$26 was recorded in the three months ended March 31, 2021 [March 31, 2020 – gain of $1.6 million].
14. NET INCOME (LOSS) PER COMMON SHARE Net income (loss) per common share is computed as follows:
Three Months ended March 31, 2021
Three Months ended March 31, 2020
$ $
Basic income (loss) per share:
Net loss (17,989) (1,729)
Average number of shares outstanding during the period 11,388 11,388
Basic loss per share (1.58) (0.15)
Net loss (17,989) (1,729)
Dilutive effect of:
Warrants - -
Convertible Loan - -
Stock options - -
Net loss, assuming dilution (17,989) (1,729)
Average number of shares outstanding during the period 11,388 11,388
Dilutive effect of:
Warrants - -
Convertible Loan - -
Stock options - -
Weighted average common shares outstanding, assuming dilution 11,388 11,388
Diluted loss per share (1.58) (0.15)
The following table presents the maximum number of shares that would be outstanding if all dilutive and potentially dilutive instruments were exercised or converted as at:
March 31, 2021 March 31, 2020
Weighted Average
Exercise Price Units
Outstanding Weighted Average
Exercise Price Units
Outstanding
$ 000s $ 000s
Common shares issued and outstanding n/a 11,388 n/a 11,388
Stock options outstanding (Note 11) 3.29 1,668 3.60 1,630
Warrants (Note 8) 3.53 25,556 3.53 25,556
Convertible Loan (Note 7) US2.70 19,444 US$2.70 19,444
58,056 58,018

15. NET CHANGE IN NON-CASH WORKING CAPITAL Net change in non-cash working capital consists of:
Three Months ended
March 31, 2021 Three Months ended
March 31, 2020
$ $
Accounts receivable (891) (137)
Inventories (658) (1,145)
Contract assets 55 43
Other current assets 742 (948)
Accounts payable and accrued liabilities 1,372 (322)
Current income taxes payable (108) 1,382
Net change in non-cash working capital 512 (1,127)
16. COMMITMENTS AND CONTINGENCIES The Company has minimum future payments under variable lease payment obligations, purchase commitments, minimum royalties and anticipated milestones for the 12 months ending March 31 as follows:
$
2021 5,480
2022 4,601
2023 4,017
2024 4,848
2025 579
2026 and thereafter 1,237
20,762
For the three months ended March 31, 2021, payments for lease obligations totalled $56 [March 31, 2020 - $0.2 million]. Under the terms of the Pennsaid 2% U.S. Asset Sale with Horizon, the Company is contractually obligated to manufacture Pennsaid 2% for the U.S. market to December 2029 and, unless terminated, the supply agreement will renew for successive two-year terms, thereafter. The agreement provides for tiered pricing based on volumes of product shipped. The Company is also required to maintain certain raw material inventory levels. The Company has additional long-term supply contracts where the Company is contractually obligated to manufacture Pennsaid 2% and Pennsaid for its customers. The Company has a long-term supply agreement with a third-party manufacturer for the supply of dimethyl sulfoxide, one of the key raw materials in Pennsaid 2% and Pennsaid, which expires in December 2022. The agreement automatically renews for successive three-year terms, unless terminated in writing by either party at least 12 months prior to the expiration of the current term. The agreement requires the Company to purchase 100% of its dimethyl sulfoxide requirements from the third-party manufacturer at specified pricing, but does not contain any minimum purchase commitments. The Company has a long-term supply agreement with a third-party manufacturer for Blexten®.. The agreement automatically renews for successive five-year terms, unless terminated in writing by either party at least 12 months prior to the expiration of the current term in 2024. The agreement requires the Company to purchase 100% of its Blexten requirements from the third-party manufacturer at specified pricing. Under certain licensing agreements for the Heated Lidocaine/Tetracaine (HLT) Patch, Resultz, Blexten, Cambia® and Durela®, the Company is required to make royalty payments ranging from 1% to 30% for annual net sales and certain milestone payments.

Under certain exclusive distribution agreements, the Company is required to make minimum royalty payments to a company of $0.3 million per year and 30% incremental royalty payments on net receipts above the minimum payments for Soriatane™. During the current and comparative three-month periods, the Company leased property for offices in Canada. The Company expenses the lease payments for short-term leases and low-value leases as incurred. There are no financial covenants imposed by any of the leases.
Three months ended
March 31, 2021
$
Interest expense on lease liabilities 37
Expenses related to variable lease payments not classified as lease obligations 61
Total cash outflow for leases classified as lease obligations 56
The Company did not have any sale and leaseback transactions during the three months ended March 31, 2021. The Company’s future cash outflows may change due to variable lease payments, renewal options, termination options, residual value guarantees and leases not yet commenced to which the Company is committed, but are not reflected in the lease obligations. The following is a maturity analysis for undiscounted lease payments that are reflected in the lease obligations as at March 31, 2021:
$
Less than 1 year 225
1 to 2 years 230
2 to 3 years 238
3 to 4 years 238
Beyond 4 years 1,457
2,388
On October 30, 2019, the Company received an application for an industry-wide class action in the Superior Court of Québec. In the application, the Company was named as a defendant, along with 33 other defendants, which includes a group of companies that manufacture, market and/or distribute opioids in Québec. The claim is for $30, plus interest for compensatory damages for each class member, $25.0 million from each defendant for punitive damages and pecuniary damages for each class member. The financial impact cannot be estimated at this time, as the class has not yet been defined by the court. The Company believes that the claim is without merit and intends to vigorously defend the matter. 17. FINANCIAL INSTRUMENTS AND RISK MANAGEMENT Financial Instruments at Amortized Cost For the three months ended March 31, 2021, the Company recognized $15 in interest income from financial assets held at amortized cost [March 31, 2020 - $35]. For the three months ended March 31, 2021, the Company recognized $2.6 million in interest expense from financial liabilities held at amortized cost [March 31, 2020 - $3.1 million]. Credit Risk The Company, in the normal course of business, is exposed to credit risk from its global customers, most of whom are in the pharmaceutical industry. The accounts receivable and contract assets are subject to normal industry risks in each geographic region in which the Company operates. The Company attempts to manage these risks prior to the signing of distribution or licensing agreements by dealing with creditworthy customers; however, due to the limited number of potential customers in each market, this is not always possible. In addition, a customer’s creditworthiness may change subsequent to becoming a licensee or distributor and the terms and conditions in the

agreement may prevent the Company from seeking new licensees or distributors in these territories during the term of the agreement. As at March 31, 2021, the Company’s largest customer represented 22% [December 31, 2020 - 30%] of accounts receivable. Pursuant to their collective terms, accounts receivable, net of allowance, were aged as follows:
March 31, 2021 December 31, 2020
$ $
Current 8,301 7,018
0 - 30 days past due - 463
31 - 60 days past due 133 2
Over 60 days past due(i) 7 5
8,441 7,488
(i) See “loss allowance provision” below.
The loss allowance provision for the Production and Service Business segment as at March 31, 2021 was determined using reference to expected loss rates and management judgment as follows:
Current
Less than 181 days past due
181 to 270 days past due
271 to 365 days past due
More than 365 days past due Total
Expected loss rate % 0% 0% 25% 50% 100%
Gross carrying amount $ 1,443 - - - - 1,443
The loss allowance provision for the Commercial Business and Licensing and Royalty Business segments as at March 31, 2021 was determined using reference to expected loss rates and management judgment as follows:
Current
Less than 61 days past due
61 to 120 days past due
121 to 180 days past due
More than 181 days past due Total
Expected loss rate % 0% 0% 25% 50% 100%
Gross carrying amount $ 6,863 130 9 - - 7,002
Loss allowance provision(i) $ (5) 10 (9) - - (4)
(i) Loss allowance provision balance consists of credit memos and purchase deductions on invoices that take time to be processed. As a
result, loss provision is 0%.
During the three months ended March 31, 2021, the Company recorded $82 bad debt reversal in total comprehensive income (loss) [December 31, 2020 - $nil]. For the three months ended March 31, 2021, the impairment of accounts receivable was assessed based on the expected credit losses model in compliance with IFRS 9. Individual receivables that were known to be uncollectible were written off by reducing the carrying amount directly. For contract assets within the scope of IFRS 15 - Revenue from Contracts with Customers, the Company recognizes an asset to the extent contractual minimums established in certain customer licensing agreements are deemed fixed consideration. After analysis of historical default rates and forward-looking estimates, the Company’s contract assets were considered to have low credit risk, and as a result, the Company has not recognized a loss allowance as at March 31, 2021 [December 31, 2020 - $nil]. The Company’s cash and cash equivalents subject the Company to a concentration of credit risk. As at March 31, 2021, the Company had $23.8 million deposited with three financial institutions in various bank accounts. These financial institutions are major banks located in Canada, the U.S. and Ireland, which the Company believes lessens the degree of credit risk. The Company has not recognized a loss allowance as at March 31, 2021 [December 31, 2020 - $nil]. The Company has not noted a significant change in the credit risk of the financial instruments related to the recent novel coronavirus (COVID-19) pandemic.

Financial Instruments IFRS 7 - Financial Instruments, Disclosures requires disclosure of a three-level hierarchy that reflects the significance of the inputs used in making fair value measurements. All assets and liabilities for which fair value is measured or disclosed in these Condensed Consolidated Interim Financial Statements are categorized within the fair value hierarchy, described as follows, based on the lowest level input that is significant to the fair value measurement as a whole:
• Level 1 - Unadjusted quoted prices at the measurement date for identical assets or liabilities in active markets
• Level 2 - Observable inputs other than quoted prices in Level 1, such as quoted prices for similar assets and liabilities in active markets; quoted prices for identical or similar assets and liabilities in markets that are not active or other inputs that are observable or can be corroborated by observable market data
• Level 3 - Significant unobservable inputs that are supported by little or no market activity The Company reviews the fair value hierarchy classification on a quarterly basis. Changes to the ability to observe valuation inputs may result in a reclassification of levels for certain securities within the fair value hierarchy. The Company did not have any transfer of assets and liabilities between Level 1, Level 2 and Level 3 of the fair value hierarchy during the three months ended March 31, 2021. As at March 31, 2021, the Company’s financial assets and liabilities consisted of cash and cash equivalents, accounts receivable, accounts payable and accrued liabilities, contingent and variable consideration, long-term debt and derivative liabilities. The Company has determined the estimated fair values of its financial instruments based on appropriate valuation methodologies. However, considerable judgment is required to develop these estimates. Accordingly, these estimated values are not necessarily indicative of the amounts the Company could realize in a current market exchange. The estimated fair value amounts can be materially affected by the use of different assumptions or methodologies. The Company’s cash and cash equivalents, accounts receivable, accounts payable and accrued liabilities (excluding SARs) are measured at amortized cost and their fair values approximate carrying values. Cash and cash equivalents are Level 1, while the other short-term financial instruments are Level 3. Level 2 liabilities include obligations of the Company for the SARs Plan described in Note 11, Stock-based Compensation and Other Stock-based Payments. The fair values of each tranche of SARs issued and outstanding are revalued at each reporting period using the Black-Scholes option pricing model. The Company accrued $4 for SARs as at March 31, 2021 [March 31, 2020 - $nil]. The fair values of the Loans are Level 3 measurements determined using a discounted cash flow model that considers the present value of the contractual cash flows using a risk-adjusted discount rate. The Company recognized $100.4 million for the Amortization Loan and host liability of the Convertible Loan as at March 31, 2021 [December 31, 2020 - $103.7 million]. The conversion feature that accompanies the Company’s Convertible Loan is considered a Level 3 liability. The value is determined as the difference between the fair value of the hybrid Convertible Loan contract, determined using an income approach with a binomial-lattice model and the fair value of the host liability contract, determined using a discounted cash flow model, as described in Note 8, Derivative Liabilities. The Company recognized $13.1 million for the conversion feature as at March 31, 2021 [December 31, 2020 - $5.7 million]. The fair values of the prepayment option that allows the Company to make prepayments against the Amortization Loan at any time is considered a Level 3 financial instrument. The fair value of the prepayment option bifurcated from the Amortization Loan was a derivative asset with a nominal value as at March 31, 2021 and is presented net of the non-current portion of the long-term debt (See Note 7, Loans and Borrowings). The fair value of this option was determined using a binomial-lattice model. The fair value of the Company’s Warrants is revalued at each reporting period using the Black-Scholes option pricing model. As at March 31, 2021, the Company recognized a $18.9 million derivative liability related to outstanding Warrants [December 31, 2020 - $8.0 million]. These Warrants are Level 3. Level 3 liabilities include the fair value of contingent and variable consideration related to the acquisition of the ex-U.S. rights to Resultz and the Aralez Transaction.

Risk Factors The following is a discussion of liquidity risk, interest rate risk, currency risk and market risk and related mitigation strategies that have been identified. Credit risk has been discussed in the Company’s assessment of impairment under IFRS 9. This is not an exhaustive list of all risks nor will the mitigation strategies eliminate all risks listed. Liquidity Risk Liquidity risk is the risk that the Company will encounter difficulties in meeting its financial obligations as they become due. As at March 31, 2021, the Company’s financial liabilities had undiscounted contractual maturities (including interest payments where applicable) as summarized below:
Current Non-current
Total
$
Within 12 Months
$
1 to 2 Years
$
2 to 5 Years
$
> 5 Years
$
Accounts payable and accrued liabilities 9,676 9,676 - - -
Other obligations 4,419 237 1,328 1,640 1,214
Senior secured Amortization Loan 59,361 11,180 27,317 20,864 -
Senior secured Convertible Loan 75,396 2,343 4,685 68,368 -
148,852 23,436 33,330 90,872 1,214
The Company’s ability to satisfy its debt obligations will depend principally upon its future operating performance. The Company’s inability to generate sufficient cash flows to satisfy its debt service obligations or to refinance its obligations on commercially reasonable terms could have a materially adverse impact on the Company’s business, financial condition or operating results. The Deerfield Facility Agreement contains customary representations and warranties and affirmative and negative covenants, including, among other things, an annual financial covenant based on minimum levels of net sales per fiscal year. Each quarter, the Company is required to pay to the lenders the greater of US$2.5 million or 50% of the Company’s excess cash flows, a defined term in the Deerfield Facility Agreement. The Company agreed to an amendment to the financing agreement dated June 25, 2019 to provide, among other things, for a payment deferral mechanism in the event that Vimovo U.S. market exclusivity is lost. The amendment allows the Company to defer a portion of the mandatory minimum quarterly repayments by the difference between one quarter of the then existing US$7.5 million (US$1.9 million per quarter) minimum annual royalty due from Vimovo sales in the U.S. and the actual amount of royalties received in the applicable quarter, in the event Vimovo U.S. market exclusivity is lost earlier than had been expected (2022) prior to the Court of Appeals decision. A generic version of Vimovo entered the U.S. market in the three months ended March 31, 2020. The amount of any principal repayment deferred would, until repaid in accordance with the amendment, be subject to an interest rate of 12.5% per annum. To-date, the Company has not availed itself of the deferral mechanism. Due to the impact of the COVID-19 pandemic on the economic environment, the Company has reviewed the working capital requirements needed as a result of managing the supply chain and changes in demand. Company anticipates that its current cash of $23.8 million as at March 31, 2021, together with the cash flows generated from operations, will be sufficient to execute its current business plan for the next 12 months and to meet its current debt obligations. Interest Rate Risk The Company’s policy is to minimize interest rate cash flow risk exposures on its long-term financing. The Company’s loans and borrowings and lease obligations are at fixed interest rates. The fair value of the Company’s prepayment option on the Amortization Loan and the Company’s derivative liabilities are impacted by market rate changes.

Currency Risk The Company operates globally, which gives rise to a risk that income and cash flows may be adversely affected by fluctuations in foreign currency exchange rates. The Company is primarily exposed to the U.S. dollar, euro and British Pound (GBP), but also transacts in other foreign currencies. The Company currently does not use financial instruments to hedge these risks. The significant balances in foreign currencies were as follows:
U.S. Dollar Euro British Pound
March 31, 2021
$
Dec. 31, 2020
$
March 31, 2021
€
Dec. 31, 2020
€
March 31, 2021
£
Dec. 31, 2020
£
Cash and cash equivalents 6,677 7,214 1,021 1,444 1,196 1,147
Accounts receivable 3,173 3,145 256 133 49 48
Contract assets 1,764 1,964 - - 346 183
Loans and borrowings (79,841) (81,468) - - - -
Derivative liabilities (10,390) (4,452) - - - - Accounts payable and
accrued liabilities (809) (803) (140) (281) - -
Other obligations (1,260) (1,882) (521) (552) - -
(80,686) (76,282) 616 744 1,591 1,378
Based on the aforementioned net exposure as at March 31, 2021, and assuming that all other variables remain constant, a 10% appreciation or depreciation of the Canadian dollar against the U.S. dollar would have an effect of $10.1 million on total comprehensive income (loss), a 10% appreciation or depreciation of the Canadian dollar against the euro would have an effect of $91 on total comprehensive income (loss) and a 10% appreciation or depreciation of the Canadian dollar against the GBP would have an effect of $276 on total comprehensive income (loss). In terms of the U.S. dollar, the Company has five significant exposures: its U.S. dollar-denominated cash held in its Canadian operations, its U.S. dollar-denominated loans and borrowings and derivative liabilities held in its Canadian and European operations, its net investment and net cash flows in its European operations, the cost of purchasing raw materials either priced in U.S. dollars or sourced from U.S. suppliers and payments made to the Company under its U.S. dollar-denominated licensing arrangements. The Company does not currently hedge its U.S. dollar cash flows. The Company funds its U.S. dollar-denominated interest expense and loan obligations using the Company’s U.S. dollar-denominated cash and cash equivalents and payments received under the terms of the licensing and supply agreements. Periodically, the Company reviews its projected future U.S. dollar cash flows and if the U.S. dollars held are insufficient, the Company may convert a portion of its other currencies into U.S. dollars. If the amount of U.S. dollars held is excessive, they may be converted into Canadian dollars or other currencies, as needed for the Company’s other operations. In terms of the euro, the Company has three significant exposures: its euro-denominated cash held in its Canadian operations and by Miravo Ireland, sales of Pennsaid by the Canadian operations to European distributors and the cost of purchasing raw materials priced in euros. The Company does not currently hedge its euro cash flows. Sales to European distributors for Pennsaid are primarily contracted in euros. The Company receives payments from the distributors in its euro bank accounts and uses these funds to pay euro-denominated expenditures and to fund the day-to-day expenses of the Miravo Ireland operations as required. Periodically, the Company reviews the amount of euros held, and if they are excessive compared to the Company’s projected future euro cash flows, they may be converted into U.S. or Canadian dollars. If the amount of euros held is insufficient, the Company may convert a portion of other currencies into euros. In terms of the GBP, the Company has three significant exposures: its GBP-denominated cash held in its Canadian operations and by Miravo Ireland, the cost of purchasing raw materials or services priced in GBP and payments made to the Company under its GBP-denominated licensing arrangements and minimum royalties received and accounted for as a contract asset in GBP.

The Company does not currently hedge its GBP cash flows. The Company receives payments from the distributors in its GBP bank accounts and uses these funds to pay GBP-denominated expenditures and to fund the day-to-day expenses of the Company’s operations as required. Periodically, the Company reviews the amount of GBP held, and if they are excessive compared to the Company’s projected future GBP cash flows, they may be converted into U.S. or Canadian dollars. If the amount of GBP held is insufficient, the Company may convert a portion of other currencies into GBP. Market Risk The Company’s derivative liabilities, the Warrants and the conversion feature that accompanies the Company’s Convertible Loan, are impacted by a variety of valuation inputs (See Note 8, Derivative Liabilities), including changes in the Company’s share price. As at March 31, 2021, a $1.00 increase in the Company’s share price would increase the value of the Warrants by $16.3 million and an increase to the conversion feature of $11.6 million, with a corresponding loss of $27.8 million recognized in the change in fair value of derivative liabilities. As at March 31, 2021, a further $1.00 increase in the Company’s share price for a total adjustment of $2.00 would further increase the value of the Warrants by $17.5 million and increase the value of the conversion feature by $12.9 million, with a corresponding additional loss of $30.5 million recognized in the change in fair value of derivative liabilities. The Company has not noted a significant change in the market risk due to changes to the Company’s share price as a result of the impact of the COVID-19 pandemic on the economic environment. 18. REVENUE In the following table, revenue is disaggregated by primary geographic market, major categories of revenue and timing of revenue recognition as follows:
Three months ended March 31
2021 2020 2021 2020 2021 2020 2021 2020
$ $ $ $ $ $ $ $
United States International Canada Total
Primary categories of revenue
Product sales 2,274 2,092 341 814 8,797 10,568 11,412 13,474
License revenue 723 2,926 2,229 7,829 58 117 3,010 10,872
Contract revenue - - - 15 - - - 15
2,997 5,018 2,570 8,658 8,855 10,685 14,422 24,361
Timing of revenue recognition
Transferred over time - - - - - - - -
Transferred at a point in time 2,997 5,018 2,570 8,658 8,855 10,685 14,422 24,361
2,997 5,018 2,570 8,658 8,855 10,685 14,422 24,361
Accounts Receivable and Contract Assets
March 31, 2021 December 31, 2020
$ $
Accounts receivable 8,441 7,488
Contract assets 2,794 2,845
The timing of revenue recognition, billings and cash collections result in accounts receivable and unbilled receivables (contract assets). Generally, receipt of payment occurs subsequent to billing and revenue recognition, resulting in accounts receivable. The Company’s contract assets relate to license revenue attributable to minimum guaranteed sales-based royalties, upfront fees and milestone payments, which have not been billed at the reporting date. Unbilled receivables (contract assets) will be billed (and subsequently transferred to accounts receivable) in accordance with the agreed-upon contractual terms.

Significant changes in the contract assets’ current and long-term balance during the period were as follows:
2021
$ 2020
$
Balance, December 31 2,845 402
Additions to contract assets(i) - 5,573
Transfers to accounts receivable (56) (43)
Interest accretion (43) (5)
Foreign exchange movements 48 34
Balance, March 31 2,794 5,961
(i) During the three months ended March 31, 2020, the Company recognized a contract asset of $5.6 million (US$4.0 million) representing the
present value, discounted at 1.7%, relating to future milestone payments for Yosprala in the Japanese market. The contract asset recognized and associated revenue represents the present value of $5.6 million (US$4.0 million) in milestone payments during the term of the agreement.
Significant Customers For the three months ended March 31, 2021, the Company’s four largest customers generating product sales represented 91% [March 31, 2020 - 84%] of total product sales and the Company’s largest customer represented 31% [March 31, 2020 - 32%] of total product sales. 19. SEGMENT REPORTING Operating Segments The Company has three operating segments: Commercial Business, Production and Service Business and Licensing and Royalty Business. The Commercial Business segment is comprised of products commercialized by the Company in Canada. This includes products with dedicated promotional efforts - Blexten, Cambia, Suvexx® and NeoVisc, as well as a number of mature assets. The Production and Service Business segment includes revenue from the sale of products manufactured by the Company from its manufacturing facility in Varennes, Québec or contracted by Miravo Ireland from its international headquarters in Dublin, Ireland, as well as service revenue for testing, development and related quality assurance and quality control services provided by the Company. Key revenue streams in this segment include product sales of Pennsaid 2%, Pennsaid and the bulk drug product for the HLT Patch. The Licensing and Royalty Business segment includes the revenue generated by the licensing of intellectual property and ongoing royalties from exclusive licensing agreements with global partners. Key revenue streams in this segment include royalties from the Company’s ex-U.S. and U.S. Vimovo, Yosprala, Resultz, Suvexx/Treximet and HLT Patch license agreements.

The Corporate and Other total includes overhead and financing costs incurred by the Company to support its public company infrastructure and the three operating segments.
Commercial
Business
Production and Service
Business
Licensing and Royalty
Business
Corporate and Other Total
Three months ended March 31, 2021 $ $ $ $ $
Total revenue 8,796 2,616 3,010 - 14,422
Cost of goods sold 2,766 1,859 - - 4,625
Gross profit 6,030 757 3.010 - 9,797
Sales and marketing expenses 2,930 - - - 2,930
General and administrative expenses - - - 2,946 2,946
Interest expense (income) - - (35) 2,621 2,586
Amortization of intangibles - - - 1,913 1,913
Other expenses - - - 17,155 17,155
Income tax expense - - - 256 256
Segment net income (loss) 3,100 757 3,045 (24,891) (17,989)
Commercial Business
Production and Service
Business
Licensing and Royalty
Business
Corporate and Other Total
Three months ended March 31, 2020 $ $ $ $ $
Total revenue 10,568 2,921 10,872 - 24,361
Cost of goods sold 3,694 1,792 - - 5,486
Gross profit 6,874 1,129 10,872 - 18,875
Sales and marketing expenses 2,230 - - 2,230
General and administrative expenses - - - 3,940 3,940
Interest expense (income) - - (5) 3,105 3,100
Amortization of intangibles - - - 2,083 2,083
Other expenses - - - 7,869 7,869
Income tax expense - - - 1,382 1,382
Segment net income (loss) 4,644 1,129 10,877 (18,379) (1,729)
20. GOVERNMENT GRANTS In April 2020, the Government of Canada announced the Canada Emergency Wage Subsidy (CEWS) in order to help employers keep and/or return employees to work in response to challenges posed by the COVID-19 pandemic. In the first quarter of 2021, the Company determined that it met the employer eligibility criteria and applied for the CEWS. As at March 31, 2021, the Company has recorded $154 in government assistance resulting from the CEWS. The funding has been recorded as a reduction of the related salary expenditures with $51 recorded in sales and marketing expense, $62 recorded in G&A expenses and $41 recorded in COGS. There are no unfulfilled conditions or other contingencies attaching to the current CEWS.