q1 fy10 20.06.09 2.30pm final.ppt - jsw.in coke consumption increased from 54.9% to 87.1% fluxes...
TRANSCRIPT

Q1 FY10
Global Development
Steel Scenario
Agenda
Financial Performance
Project Progress
2

Global DevelopmentGlobal DevelopmentGlobal DevelopmentGlobal Development
3

Global Development
Global growth rates revised upwards
IMF Revised GDP growth projection for 2010
2010 20102010
2009 2009
2009
-1.3
-3.8
1.6
-1.4
-3.8
1.51.9
0
4
2.5
0.6
4.7
World Adv. Economies Emerging Economies
%
Apr09 Est. July09 Est.
0
10
20
30
40
50
60
70
80
90
Jan
-07
Ma
r-0
7
Ma
y-0
7
Jul-
07
Se
p-0
7
No
v-0
7
Jan
-08
Ma
r-0
8
Ma
y-0
8
Jul-
08
Se
p-0
8
No
v-0
8
Jan
-09
Ma
r-0
9
Ma
y-0
9
Jul-
09
Receding volatility in the stock market
CBOE Volatility Index
80
100
120
140
160
180
Jan
-09
Jan
-09
Jan
-09
Fe
b-0
9
Fe
b-0
9
Ma
r-0
9
Ma
r-0
9
Ap
r-0
9
Ap
r-0
9
Ma
y-0
9
Ma
y-0
9
Jun
-09
Jun
-09
Metals Food Agricultural raw materials Crude oil
0%
2%
6% 6%
8%
12%
14%
RMB JPY INR EURO RUB GBP BRL
Commodity prices moving up USD depreciates against major currencies
Period: April 1,2009 to June 30,2009
Source: IMF/ Bloomberg/CBOE.com
CBOE: Chicago Board Options Exchange
World Adv. Economies Emerging Economies Jan
Ma
r
Ma
y
Jul
Se
p
No
v
Jan
Ma
r
Ma
y
Jul
Se
p
No
v
Jan
Ma
r
Ma
y
Jul
4
0
100
200
300
400
500
Jun-07 Oct-07 Feb-08 Jun-08 Oct-08 Feb-09 Jun-09
4.25 4.25
5.5
0.5
7.47
9
0.25
21.5
0.1
5.31 5.5
0.251 0.5
0.1
5.31 4.75
Federal Reserve
European Central
Bank
Bank of England
Bank of Japan
People's Bank of China
Reserve bank of
India
2008-Peak Jan-09 Jul-09
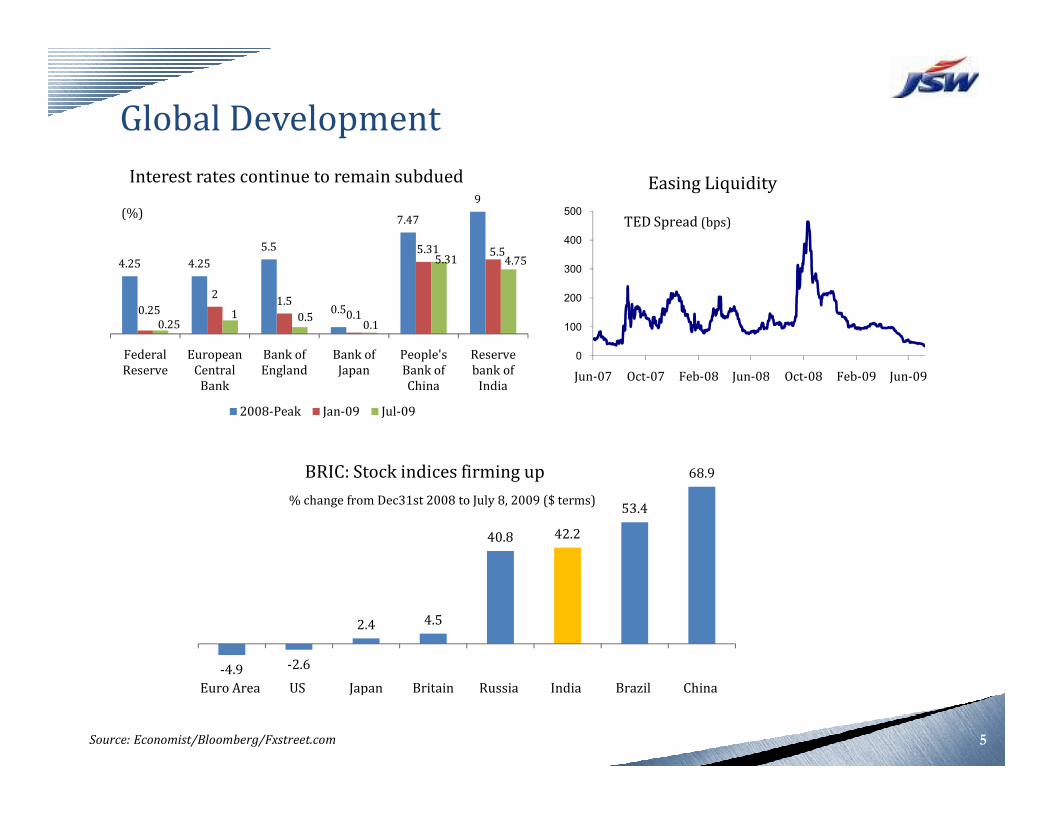
Interest rates continue to remain subdued
Global Development
TED Spread (bps)(%)
Easing Liquidity
-4.9 -2.6
2.4 4.5
40.8 42.2
53.4
68.9
Euro Area US Japan Britain Russia India Brazil China
2008-Peak Jan-09 Jul-09
BRIC: Stock indices firming up
% change from Dec31st 2008 to July 8, 2009 ($ terms)
Source: Economist/Bloomberg/Fxstreet.com 5
30.00
35.00
40.00
45.00
50.00
55.00
60.00
Jan
-07
Ma
r-0
7
Ma
y-0
7
Jul-
07
Se
p-0
7
No
v-0
7
Jan
-08
Ma
r-0
8
Ma
y-0
8
Jul-
08
Se
p-0
8
No
v-0
8
Jan
-09
Ma
r-0
9
-40.00
-30.00
-20.00
-10.00
0.00
10.00
20.00
Jan
-07
Ma
r-0
7
Ma
y-0
7
Jul-
07
Se
p-0
7
No
v-0
7
Jan
-08
Ma
r-0
8
Ma
y-0
8
Jul-
08
Se
p-0
8
No
v-0
8
Jan
-09
Ma
r-0
9
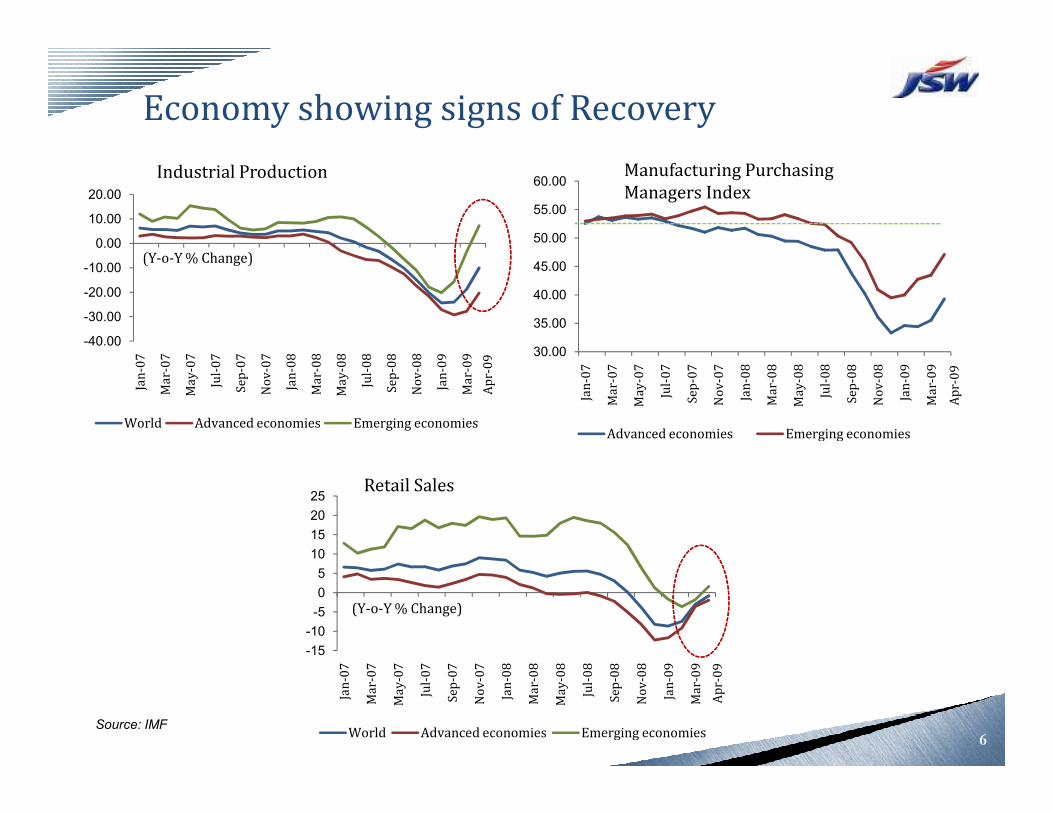
Economy showing signs of Recovery
Industrial Production Manufacturing Purchasing Managers Index
(Y-o-Y % Change)
Ap
r-0
9
Ap
r-0
9
-15
-10
-5
0
5
10
15
20
25
Jan
-07
Ma
r-0
7
Ma
y-0
7
Jul-
07
Se
p-0
7
No
v-0
7
Jan
-08
Ma
r-0
8
Ma
y-0
8
Jul-
08
Se
p-0
8
No
v-0
8
Jan
-09
Ma
r-0
9
World Advanced economies Emerging economies
Ma
y
Ma
y
Advanced economies Emerging economiesWorld Advanced economies Emerging economies
Retail Sales
(Y-o-Y % Change)
Source: IMFA
pr-
09
6
Steel ScenarioSteel ScenarioSteel ScenarioSteel Scenario
7
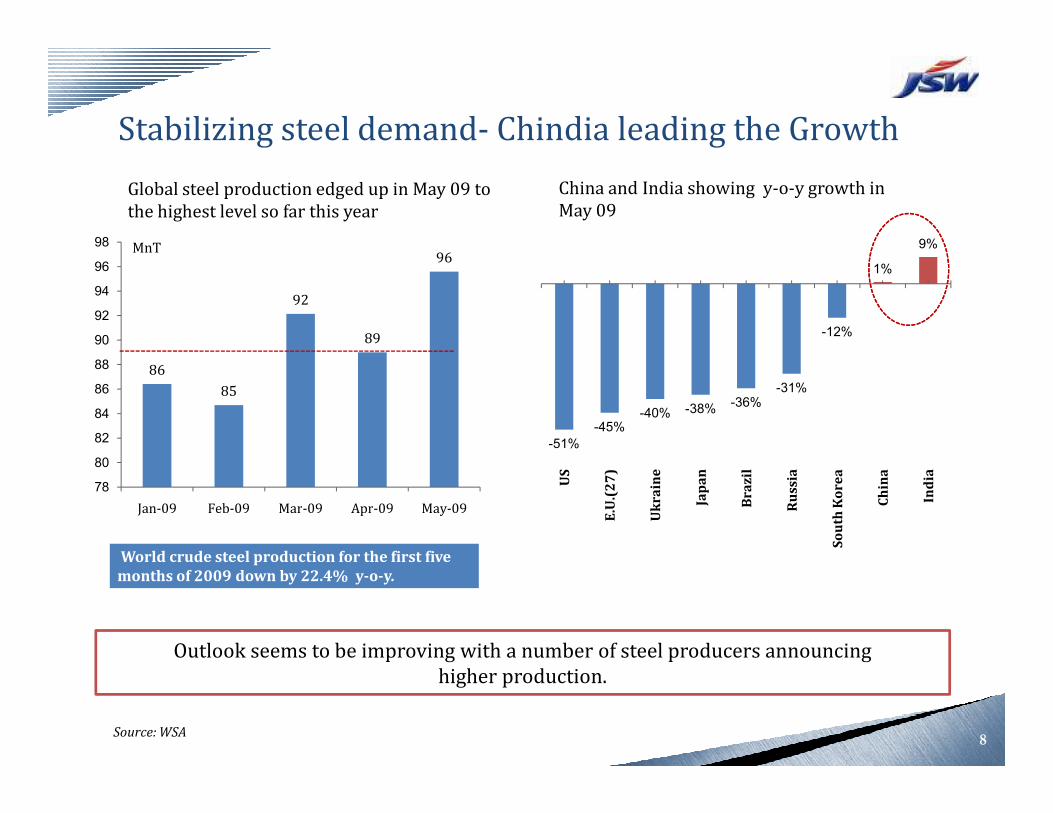
Global steel production edged up in May 09 to the highest level so far this year
86
85
92
89
96
84
86
88
90
92
94
96
98
-40% -38%-36%
-31%
-12%
1%
9%
China and India showing y-o-y growth in May 09
MnT
Stabilizing steel demand- Chindia leading the Growth
78
80
82
84
Jan-09 Feb-09 Mar-09 Apr-09 May-09
-51%
-45%-40% -38%
-36%
US
E.U
.(2
7)
Uk
ra
ine
Jap
an
Br
az
il
Ru
ssia
So
uth
Ko
re
a
Ch
ina
Ind
ia
Outlook seems to be improving with a number of steel producers announcing higher production.
Source: WSA8
World crude steel production for the first five
months of 2009 down by 22.4% y-o-y.
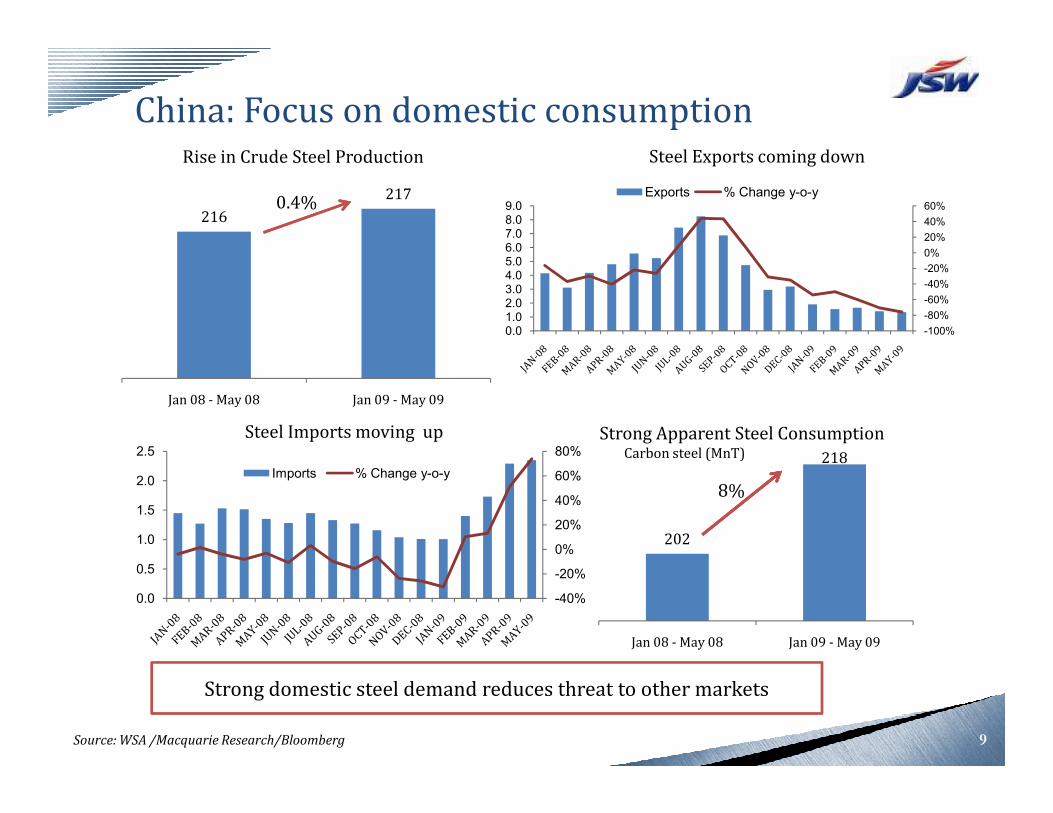
216
217
Jan 08 - May 08 Jan 09 - May 09
Steel Exports coming down
China: Focus on domestic consumptionRise in Crude Steel Production
0.4%
-100%
-80%
-60%
-40%
-20%
0%
20%
40%
60%
0.01.02.03.04.05.06.07.08.09.0
Exports % Change y-o-y
-40%
-20%
0%
20%
40%
60%
80%
0.0
0.5
1.0
1.5
2.0
2.5
Imports % Change y-o-y
Jan 08 - May 08 Jan 09 - May 09
202
218
Jan 08 - May 08 Jan 09 - May 09
Strong domestic steel demand reduces threat to other markets
8%
Strong Apparent Steel ConsumptionCarbon steel (MnT)
Source: WSA /Macquarie Research/Bloomberg
Steel Imports moving up
9

India: Growth intactGDP growth rate(Y-o-Y % Change)
* RBI estimates
Sectoral Trends for Apr-May 09(Y-o-Y % Change)
10.5
6.5
11.7
3.9
1.9
0
2
4
6
8
10
12
14
Two Wheelers
Sales
PV Sales Cement Production
Infrastructure Index
IIP
9.5 9.79
6.75.7
FY06 FY07 FY08 FY09 FY10E *
Source: SIAM/JPC/EAC
* RBI estimates
Apparent Steel Consumption(MnT)
12.2
12.85.2%
13.5
14.0
Steel Production(MnT)
3.4%
Apr-Jun 09 Apr-Jun 09 Apr-Jun 08 Apr-Jun 08
10
Sales

Budget Boosters for the Industry
Allocation for programs that will support Infrastructure spending
� Allocation to Housing, NHAI, Railways, JNNRUM, APDPR ~Rs. 458 bn (USD 9.6 bn).
� Plan expenditure Rs. 3,251.5 bn ( USD 67.9 bn) increase of 34% over previous year.
� IIFCL will refinance 60% of commercial bank loans for PPP projects in critical sectors amounting Rs. 1,000 bn (USD 20.89bn).
Indian Steel industry to benefit from the proposed measures.
USD/Rs. = 47.87
Source : RBI reference rate as on 30.06.09
NHAI = National Highway Authority of India
JNNURM = Jawaharlal Nehru National Urban Renewal Mission
APDPR= Accelerated Power development and Reform Programme
IIFCL : India Infrastructure Finance Company Ltd.11
amounting Rs. 1,000 bn (USD 20.89bn).
� Excise duty for petrol driven trucks/lorries reduced from 20% to 8%.
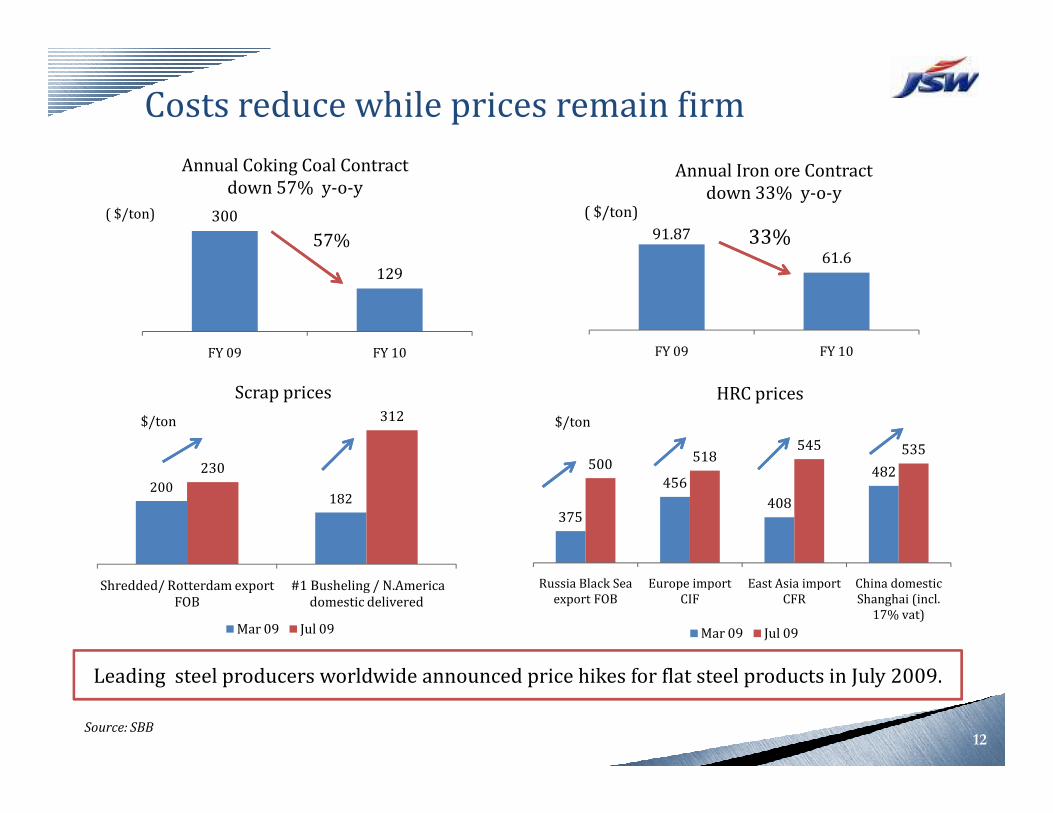
Costs reduce while prices remain firm
Scrap prices HRC prices
300
129
FY 09 FY 10
91.87
61.6
FY 09 FY 10
Annual Coking Coal Contract down 57% y-o-y
Annual Iron ore Contract down 33% y-o-y
( $/ton) ( $/ton)
57% 33%
375
456
408
482500
518545 535
Russia Black Sea export FOB
Europe import CIF
East Asia import CFR
China domestic Shanghai (incl.
17% vat)
Mar 09 Jul 09
200182
230
312
Shredded/ Rotterdam export FOB
#1 Busheling / N.America domestic delivered
Mar 09 Jul 09
$/ton$/ton
Source: SBB
Leading steel producers worldwide announced price hikes for flat steel products in July 2009.
12
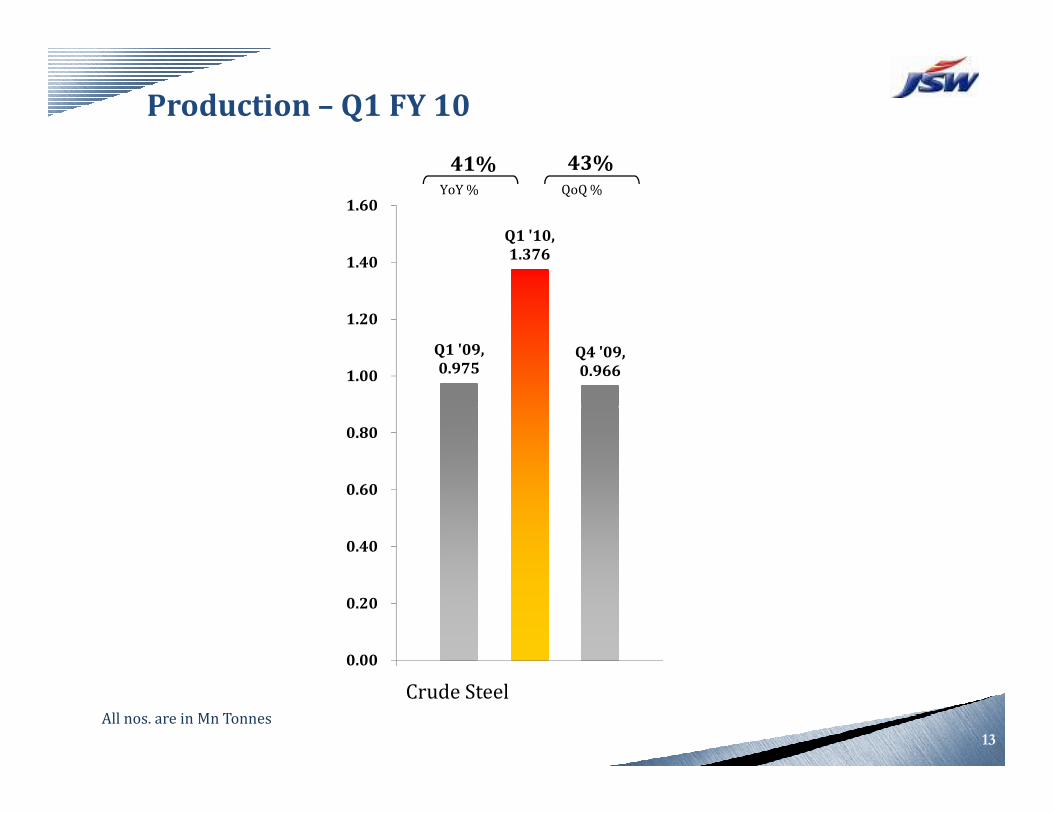
Production – Q1 FY 10
Q1 '09,
0.975
Q1 '10,
1.376
Q4 '09,
0.9661.00
1.20
1.40
1.60 YoY % QoQ %
41% 43%
13
0.00
0.20
0.40
0.60
0.80
Crude SteelAll nos. are in Mn Tonnes

Production – Q1 FY 10
Q1 '10,
0.181
YoY % QoQ %
98% 108%Q1 '09,
0.593
Q1 '10,
0.871Q4 '09,
0.826
Rolled : Flat
YoY % QoQ %
47% 5%
14
Q1 '09,
0.092Q4 '09,
0.087
Rolled : Long
Q1 '09,
0.161
Q1 '10,
0.227
Q4 '09,
0.23
Q1 '09,
0.23
Q1 '10,
0.355 Q4 '09,
0.322
CR / CRCA
YoY % QoQ %
54% 10%
GI / GL
YoY % QoQ %
41% -1%
All nos. are in Mn Tonnes

Saleable Steel Sales – Q1 FY 10
Q1 '09,
0.817
Q1 '10,
1.321
Q4 '09,
1.062
1.00
1.20
1.40
YoY % QoQ %
62% 24%
15
0.817
0.00
0.20
0.40
0.60
0.80
Total SalesAll nos. are in Mn Tonnes

Saleable Steel Sales – Q1 FY 10
Q1 '09,
0.582
Q1 '10,
0.855
Q4 '09,
0.855
YoY % QoQ %
47% 0%
Q1 '09,
0.207
Q1 '10,
0.366 Q4 '09,
0.330
YoY % QoQ %
77% 11%
16
Q1 '09,
0.065
Q1 '10,
0.154
Q4 '09,
0.096
Rolled : Flat
Q1 '09,
0.169
Q1 '10,
0.311
Q4 '09,
0.110
Semis
YoY % QoQ %
84% 183%
Value Added (CR/GI/PPGI)
Rolled : Long
YoY % QoQ %
136% 60%
All nos. are in Mn Tonnes
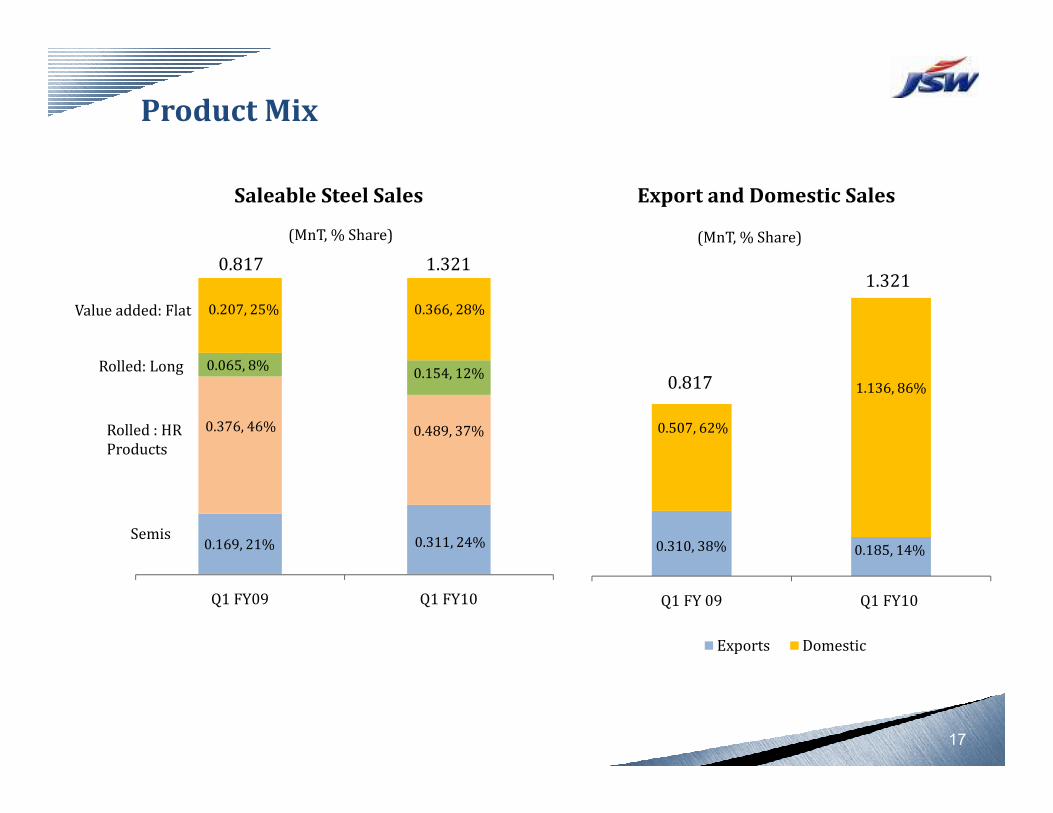
Product Mix
0.817
1.321
1.136, 86%
Export and Domestic SalesSaleable Steel Sales
(MnT, % Share)
0.065, 8%0.154, 12%
0.207, 25% 0.366, 28%
1.3210.817
Rolled: Long
Value added: Flat
(MnT, % Share)
Q1 FY 09 Q1 FY10
Exports Domestic
0.310, 38% 0.185, 14%
0.507, 62%
17
Q1 FY09 Q1 FY10
0.311, 24%0.169, 21%
0.376, 46% 0.489, 37%
Semis
Rolled : HR Products

8 10
18
50
67
Q1 FY09 Q2 FY09 Q3 FY09 Q4 FY09 Q1 FY10
JSW Shoppe % Share through JSW Shoppe in Q1 FY10
Focus on Retail Sales (Domestic)
0.770,88%
0.103,12%
No
. of
sho
pp
e
(Excl. semis)
(MnT, % Share)
38%
7%
55%Value added: Flat
Rolled : Long
JSW Shoppe Others
Q1 FY09 Q2 FY09 Q3 FY09 Q4 FY09 Q1 FY10
468
592
FY 09 June' 09
Avg. Sales through JSW Shoppe(Tonnes/month/shoppe)
27%
18
Rolled : HR Products

Financial PerformanceFinancial PerformanceFinancial PerformanceFinancial Performance
19
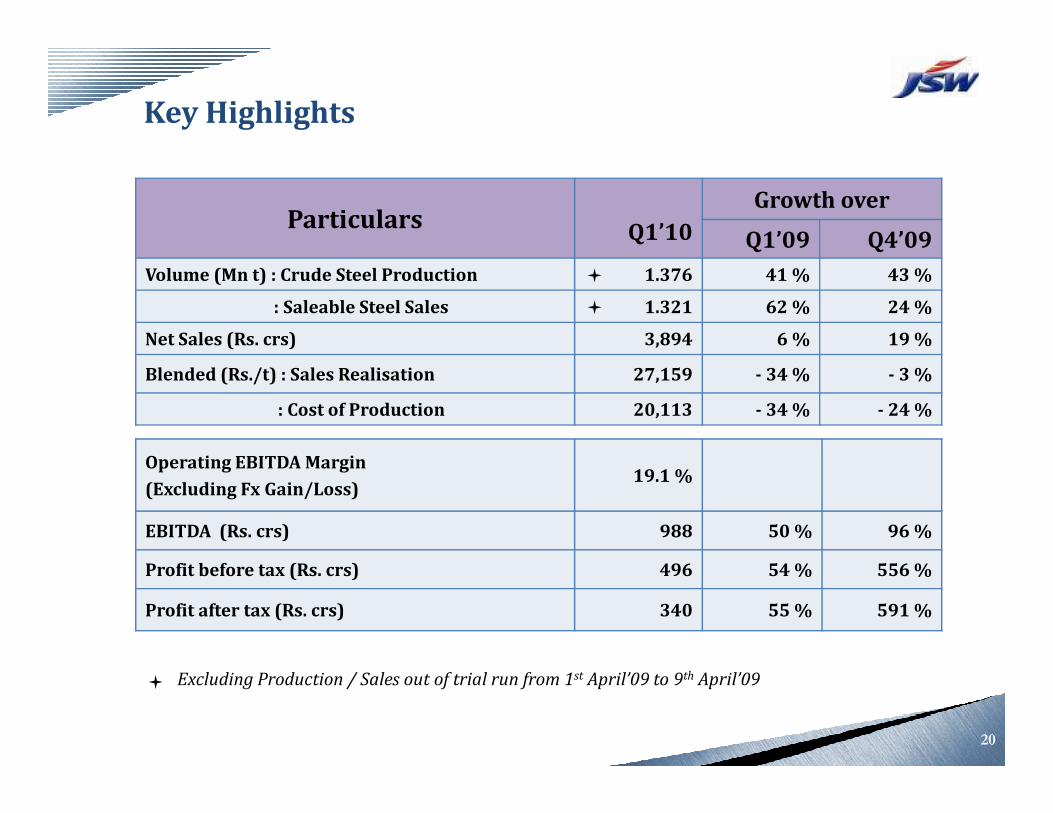
ParticularsQ1’10
Growth over
Q1’09 Q4’09
Volume (Mn t) : Crude Steel Production 1.376 41 % 43 %
: Saleable Steel Sales 1.321 62 % 24 %
Net Sales (Rs. crs) 3,894 6 % 19 %
Blended (Rs./t) : Sales Realisation 27,159 - 34 % - 3 %
: Cost of Production 20,113 - 34 % - 24 %
Key Highlights
20
: Cost of Production 20,113 - 34 % - 24 %
Operating EBITDA Margin
(Excluding Fx Gain/Loss)19.1 %
EBITDA (Rs. crs) 988 50 % 96 %
Profit before tax (Rs. crs) 496 54 % 556 %
Profit after tax (Rs. crs) 340 55 % 591 %
Excluding Production / Sales out of trial run from 1st April’09 to 9th April’09

Sales Realisation v/s Cost of Production
FX Loss,
1582
FX Loss,
1626
20000
25000
30000
35000
YoY % QoQ %
- 34% - 24%
30,607 20,113 26,608Q1 '09,
41168
Q1 '10,
27159
Q4 '09,
27881
25000
30000
35000
40000
45000
YoY % QoQ %
- 34% - 3%
21
Blended Realisation (Rs. / t)
Cost,
28981Cost,
21683
Cost,
25026
-5000
0
5000
10000
15000
20000
Q1 '09 Q1 '10 Q4 '09
FX gain
1570
Blended Cost (Rs. / t)
0
5000
10000
15000
20000

� Own coke consumption increased from 54.9% to 87.1%
� Fluxes consumption reduced from 349 kg/t to 314 kg/t
� Increase in Corex Gas Utilisation from 93% to 97.2%.
Efficiency Improvements at Vijayanagar (Q1 FY10 Vs Q1 FY09)
22
� Gas mixing station commissioned to improve utilisation of coke oven gas,
93% Gas utilisation achieved in Recovery type Coke Oven.
� Power generation increased from 149 MW to 180 MW.
� LD Gas recovery increased from 87 m3 to 104 m3 from SMS1.
� Yield at HSM improved from 96.8% to 97.14%
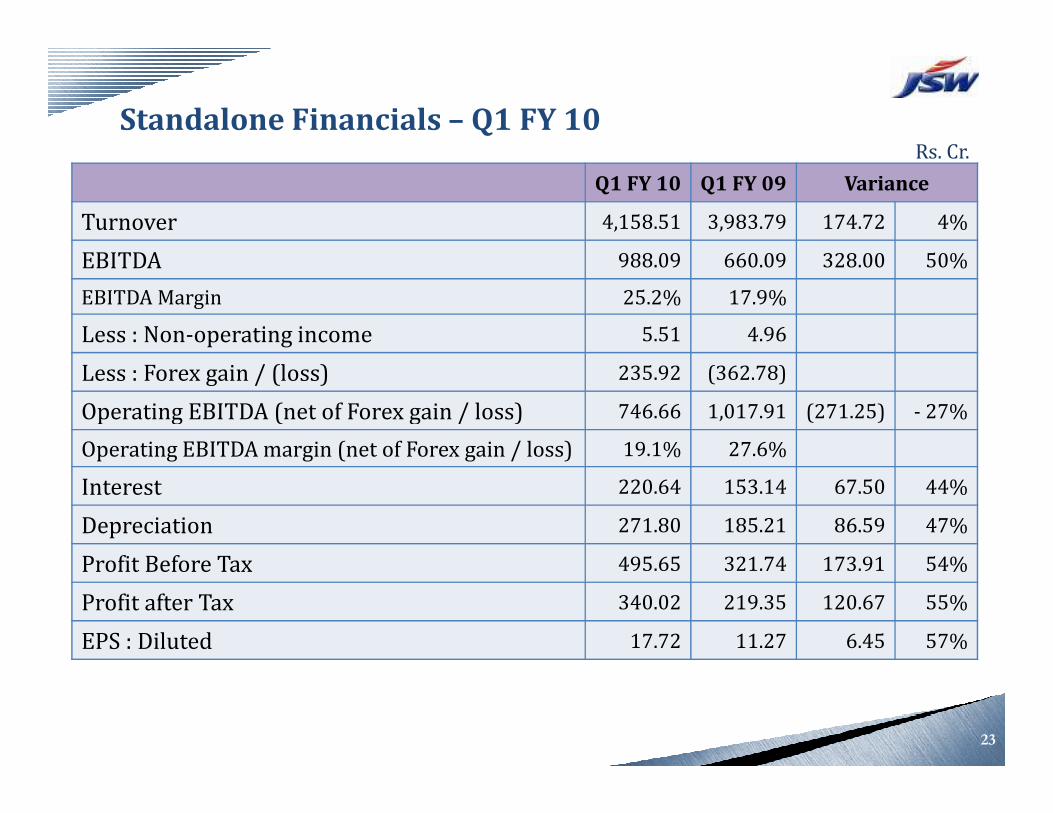
Standalone Financials – Q1 FY 10Rs. Cr.
Q1 FY 10 Q1 FY 09 Variance
Turnover 4,158.51 3,983.79 174.72 4%
EBITDA 988.09 660.09 328.00 50%
EBITDA Margin 25.2% 17.9%
Less : Non-operating income 5.51 4.96
Less : Forex gain / (loss) 235.92 (362.78)
Operating EBITDA (net of Forex gain / loss) 746.66 1,017.91 (271.25) - 27%
23
Operating EBITDA (net of Forex gain / loss) 746.66 1,017.91 (271.25) - 27%
Operating EBITDA margin (net of Forex gain / loss) 19.1% 27.6%
Interest 220.64 153.14 67.50 44%
Depreciation 271.80 185.21 86.59 47%
Profit Before Tax 495.65 321.74 173.91 54%
Profit after Tax 340.02 219.35 120.67 55%
EPS : Diluted 17.72 11.27 6.45 57%
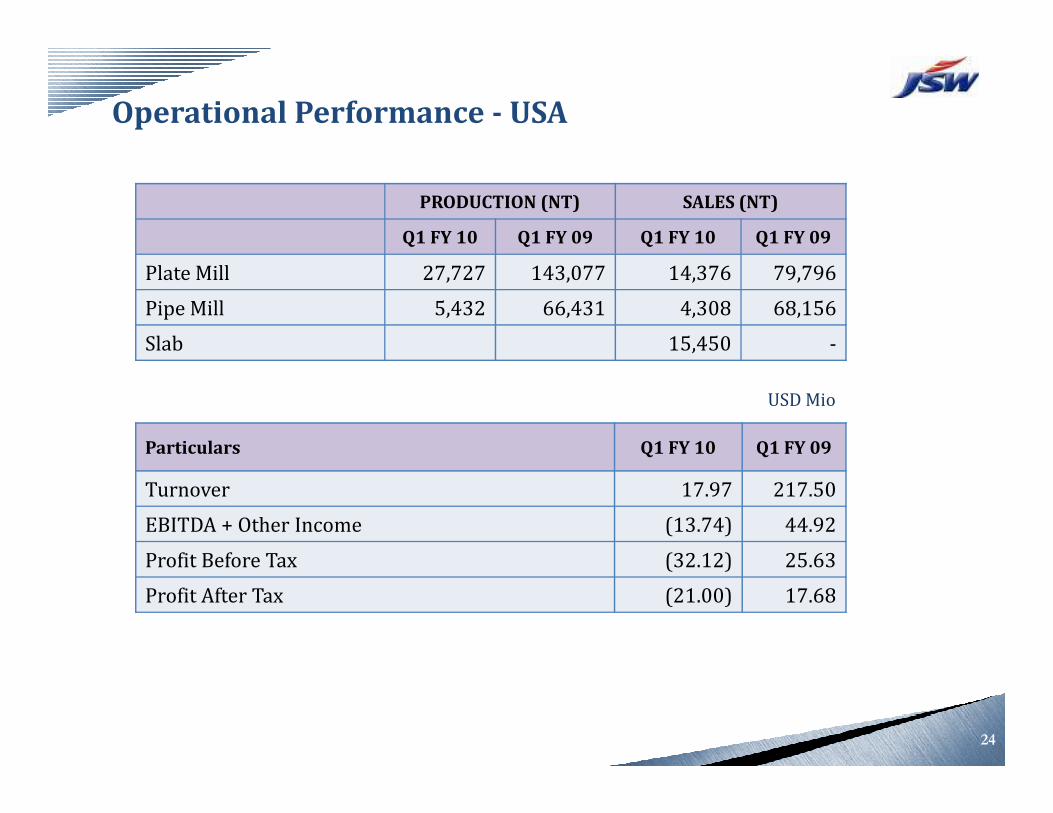
Operational Performance - USA
PRODUCTION (NT) SALES (NT)
Q1 FY 10 Q1 FY 09 Q1 FY 10 Q1 FY 09
Plate Mill 27,727 143,077 14,376 79,796
Pipe Mill 5,432 66,431 4,308 68,156
Slab 15,450 -
USD Mio
24
Particulars Q1 FY 10 Q1 FY 09
Turnover 17.97 217.50
EBITDA + Other Income (13.74) 44.92
Profit Before Tax (32.12) 25.63
Profit After Tax (21.00) 17.68
USD Mio

Consolidated Financial – Q1 FY10
Q1 FY 10 Q1 FY 09
Total Income 4,013.78 4,479.42
EBITDA 928.11 843.48
Cash Profit 629.78 608.72
Rs. Cr.
25
Cash Profit 629.78 608.72
Profit Before Tax 313.16 388.85
Net Profit 234.08 250.23

Financial Covenants Relaxation / Waivers
Loan / Facility Loan O/S
(USD mio)
Syndicated External Commercial Borrowings 175
Advance Payment Against Steel Supply Agreement 150
Syndicated ECB USD 175 mio
– Consent of required majority of lenders actual (79.5%) for proposed amendments obtained till September 30, 2011.
APSSA USD 150 mio
- Waiver from required majority of lenders for March 2009 covenants obtained till March 31, 2009.
- For future period, lenders consent to bring the covenants in line with the other loan is being pursued.
26

3,828 3,815
678 445
6000
7000
8000
9000
10000
3.3 3.26
2.5
3
3.5
3,815
445
5,000
7,000
9,000
11,000
Adj. Long Term Debt Gearing - Standalone
Long Term Debt & Networth
FX Loss
FCL
Rs
. Cr.
X
10,047
Rs
. Cr.
9,8849,884
8,309
5,542 5,625
0
1000
2000
3000
4000
5000
As on 31/03/09 As on 30/06/09
FX LOSS FCL RTL
1.241.17
0.5
1
1.5
2
D:E Adj L.T. Debt/EBITDA
5,625
(1,000)
1,000
3,000
L.T. Debt Networth
27
Adj. L.T. Debt Gearing of 1.17
RTL
Q4 FY09 Q1 FY10
Wt Avg Cost of Debt (%) 8.22 8.23
FD & MF (Rs. Cr.) 190 136

Adj. Long Term Debt Gearing – Consolidated
Adj. Long Term Debt & Networth
7,254
1,101
6,000
8,000
10,000
12,000
14,000
16,000
FX Loss
FCL
X
14,631
Rs
. Cr.
14,065
Rs
. Cr.
14,065
8,309
16281101
8000
10000
12000
14000
16000
4.57
5.05
4
5
6
28
Adj. L.T. Debt Gearing of 1.67
5,710
0
2,000
4,000
6,000
L.T. Debt Networth
RTL
Q4 ’09 Q1 ’10
Wt Avg. Cost of Debt (%) 7.16 7.05
FD & MF (Rs. Cr.) 190 151
Rs
. Cr.
5,627 5,710
7,376 7,254
0
2000
4000
6000
8000
As on 31/03/09 As on 30/06/09
FX LOSS FCL RTL
1.791.67
0
1
2
3
D:E Adj LT Debt/EBITDA

Project ProgressProject ProgressProject ProgressProject Progress
29
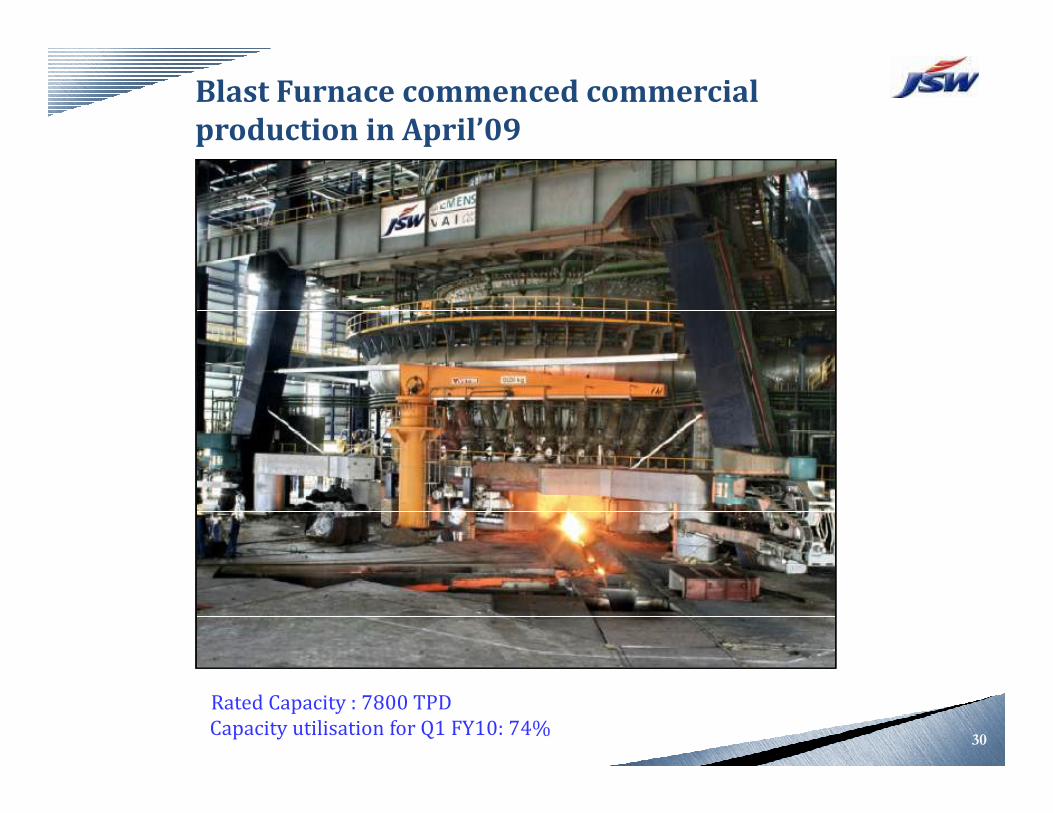
Blast Furnace commenced commercial
production in April’09
Rated Capacity : 7800 TPDCapacity utilisation for Q1 FY10: 74%
30

Hot Strip Mill- Phase I (3.5 MTPA)
Project Progress till 30th June, 2009 % Progress
Civil 77
Structural Fabrication 93
Structural Erection 84
Equipments Erection 25
31

BENEFICIATION PLANT
Project Progress till 30th June, 2009 % Progress
Civil 57
Structural Fabrication 73
Structural Erection 46
Equipments 11
32

3.2 MTPA Expansion3.2 MTPA Expansion3.2 MTPA Expansion3.2 MTPA Expansion
33

BLAST FURNACE
34

Steel Melting Shop
35
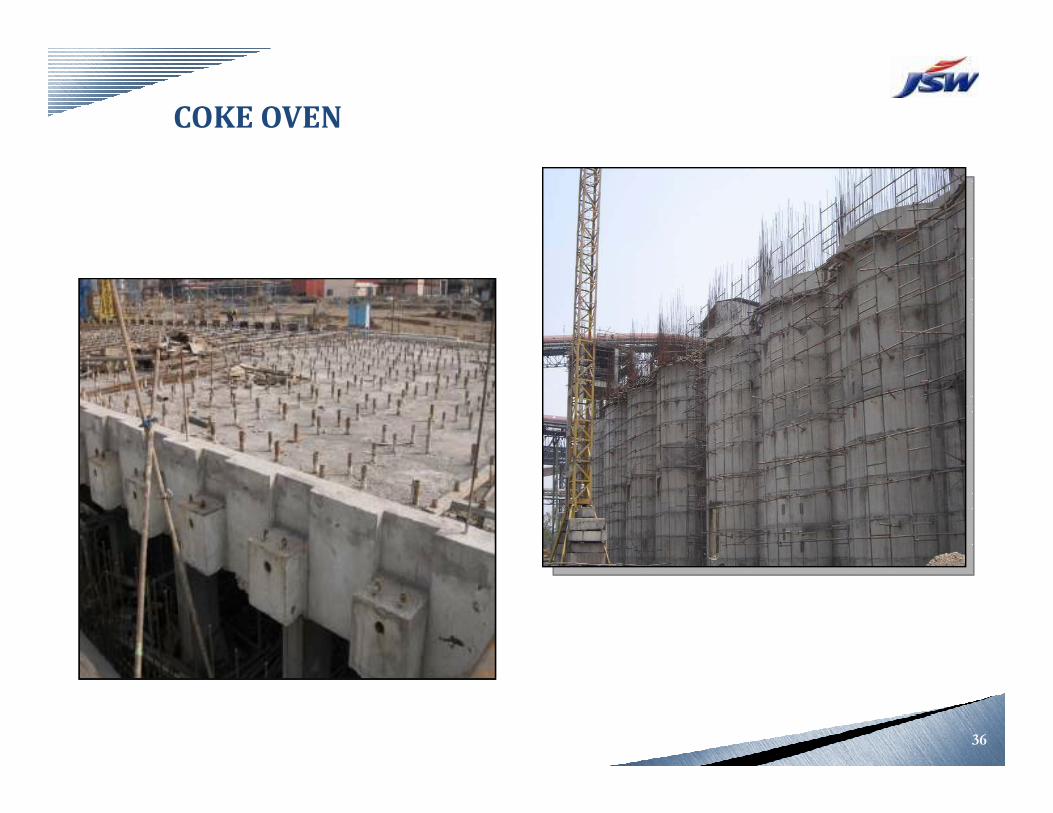
COKE OVEN
36

SINTER PLANT
37
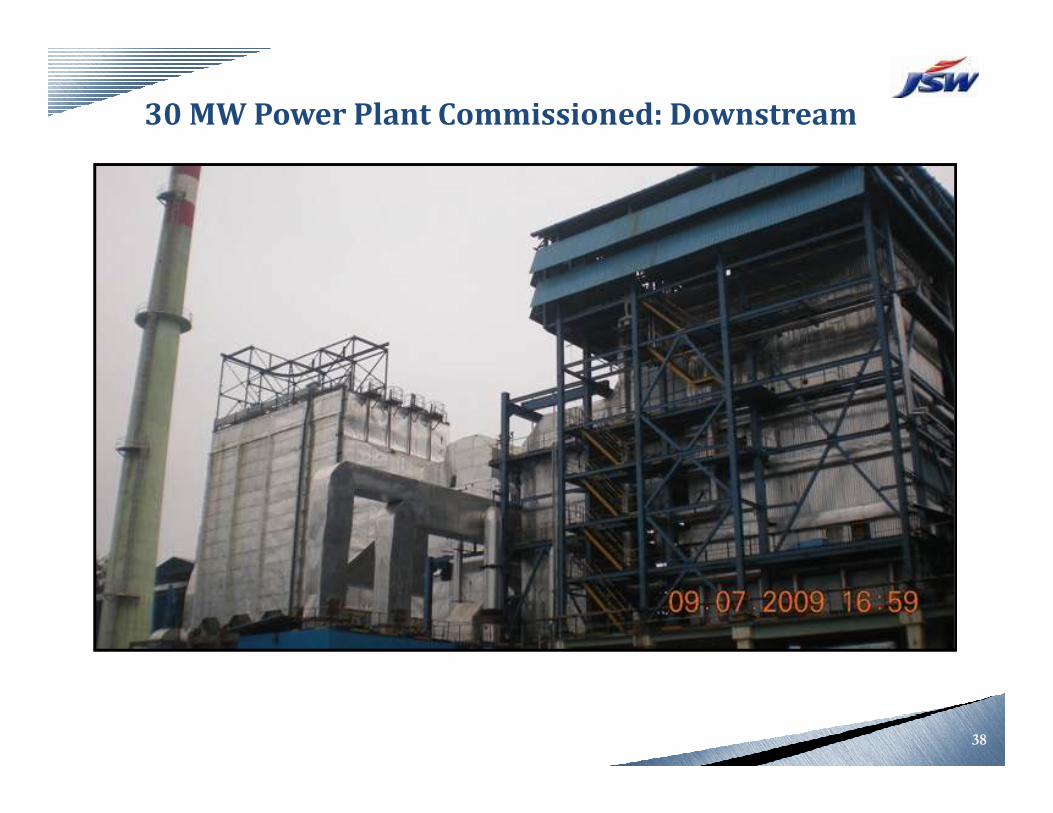
30 MW Power Plant Commissioned: Downstream
38

Q & A
39

Forward Looking and Cautionary Statement
Certain statements in this report concerning our future growth prospects are forward
looking statements, which involve a number of risks, and uncertainties that could
cause actual results to differ materially from those in such forward looking statements.
The risk and uncertainties relating to these statements include, but are not limited to
risks and uncertainties regarding fluctuations in earnings, our ability to manage
growth, intense competition within Steel industry including those factors which may
affect our cost advantage, wage increases in India, our ability to attract and retain
highly skilled professionals, time and cost overruns on fixed-price, fixed-time framehighly skilled professionals, time and cost overruns on fixed-price, fixed-time frame
contracts, our ability to commission mines within contemplated time and costs, our
ability to raise the finance within time and cost client concentration, restrictions on
immigration, our ability to manage our internal operations, reduced demand for
steel, our ability to successfully complete and integrate potential acquisitions, liability
for damages on our service contracts, the success of the companies in which the
Company has made strategic investments, withdrawal of fiscal/governmental
incentives, impact of regulatory measures, political instability, legal restrictions on
raising capital or acquiring companies outside India, unauthorized use of our
intellectual property and general economic conditions affecting our industry. The
company does not undertake to update any forward looking statements that may be
made from time to time by or on behalf of the company.
40