q1 fy20 supplemental earnings slides · 2019-08-05 · fy17 results exclude impact. totals may not...
TRANSCRIPT
Q1 FY20 Supplemental Earnings SlidesAugust 5, 2019
© 2019 LiveRamp. All rights reserved.
Safe Harbor Statement
Some of the matters discussed in this presentation contain forward-looking statements regarding the Company’s future business prospects which are subject to certain risks and uncertainties, including competitive pressures, adverse economic conditions and governmental regulations.
These issues and other factors that may be identified from time to time in the Company’s reports filed with the SEC could cause actual results to differ materially from those indicated in the forward-looking statements.
Our discussion today will include non-GAAP financial measures. We refer you to the appendix of this presentation and the Investor Relations section of our website, which include reconciliations to the comparable GAAP measures for each of the non-GAAP financial measures included in this discussion.
Our website is www.LiveRamp.com. The information contained on, or that can be accessed through, our website is not incorporated by reference into this presentation, and you should not consider any information contained on, or that can be accessed through, our website as part of this presentation.
Slide 2 of 23

© 2019 LiveRamp. All rights reserved.
Best-in-Class SaaS ModelQ1 FY20, Non-GAAP
Predictable, Recurring Revenue
Subscription Customer Growth
Land & Expand with Network Effects
Profitable Long-term Model
Revenue Run-Rate
Direct Clients
Dollar-based Net Retention
Long-term Gross Margin
Target
Subscription % of TotalRevenue
LTM Direct Net Client
Adds
$1M Clients
75%$330M 108%
>80% 105 45
Slide 3 of 23
6901 2,3
5
Long-term Op Margin
Target
25%
4

© 2019 LiveRamp. All rights reserved.
Summary Financial Results$Ms, except per share amounts
Slide 4 of 23
GAAP Non-GAAP 6
Q120 YoY Q120 YoY
Revenue $83 32% $83 32%
Gross profit $46 19% $51 13%
Gross margin 56% (6) Pts 62% (10) Pts
Operating loss ($48) nm ($22) nm
Operating margin (59%) (11) pts (27%) (18) Pts
Net loss ($42) nm ($16) nm
EPS ($0.61) nm ($0.24) nm
Share count 68.9 (10%) 68.9 (10%)
Note: Results include non-recurring transition expenses of $7 Million, of which $3 million was reported in gross profit.
© 2019 LiveRamp. All rights reserved.
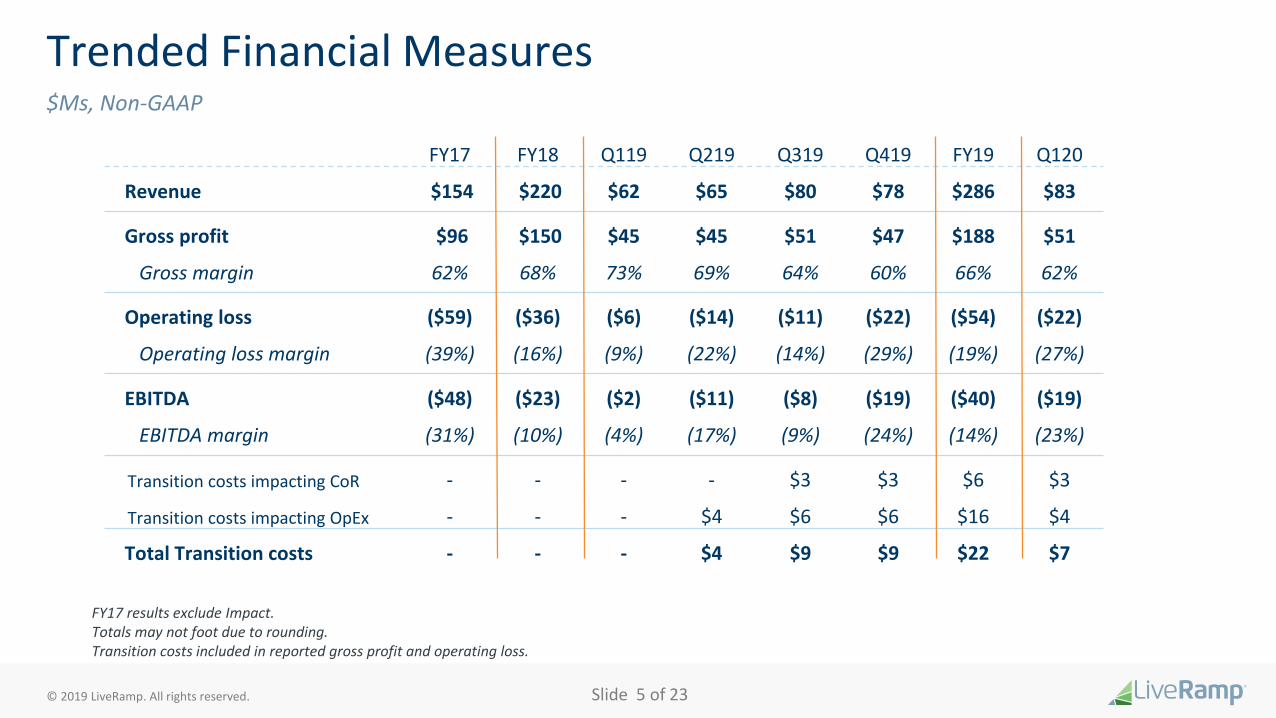
Trended Financial Measures$Ms, Non-GAAP
Slide 5 of 23
FY17 results exclude Impact.Totals may not foot due to rounding.Transition costs included in reported gross profit and operating loss.
FY17 FY18 Q119 Q219 Q319 Q419 FY19 Q120
Revenue $154 $220 $62 $65 $80 $78 $286 $83
Gross profit $96 $150 $45 $45 $51 $47 $188 $51
Gross margin 62% 68% 73% 69% 64% 60% 66% 62%
Operating loss ($59) ($36) ($6) ($14) ($11) ($22) ($54) ($22)
Operating loss margin (39%) (16%) (9%) (22%) (14%) (29%) (19%) (27%)
EBITDA ($48) ($23) ($2) ($11) ($8) ($19) ($40) ($19)
EBITDA margin (31%) (10%) (4%) (17%) (9%) (24%) (14%) (23%)
Transition costs impacting CoR - - - - $3 $3 $6 $3
Transition costs impacting OpEx - - - $4 $6 $6 $16 $4
Total Transition costs - - - $4 $9 $9 $22 $7

© 2019 LiveRamp. All rights reserved.
Revenue Summary$Ms
Slide 6 of 23
Totals may not foot due to rounding.
As Reported Excluding Facebook
Revenue by Type Q120 Q119 YoY Q120 Q119 YoY
Subscription $68 $51 33% $68 $51 33%
Marketplace & Other $14 $11 27% $14 $8 76%
Total $83 $62 32% $83 $59 39%
Revenue by Geography Q120 Q119 YoY Q120 Q119 YoY
US $77 $56 36% $77 $54 41%
International $6 $6 (4%) $6 $5 20%
Total $83 $62 32% $83 $59 39%

© 2019 LiveRamp. All rights reserved.
Trended Revenue$Ms, Non-GAAP
Slide 7 of 23
FY17 results exclude Impact.Totals may not foot due to rounding.
Revenue as Reported FY17 FY18 Q119 Q219 Q319 Q419 FY19 Q120
Subscription $113 $172 $51 $55 $65 $66 $237 $68
YoY % 57% 52% 38% 30% 42% 40% 38% 33%
Marketplace & Other 41 48 11 10 15 13 49 14
YoY % 22% 21% 15% (15%) 13% (4%) 2% 27%
Total $154 $220 $62 $65 $80 $78 $286 $83
YoY % 46% 43% 34% 20% 35% 30% 30% 32%
Revenue excluding Facebook FY17 FY18 Q119 Q219 Q319 Q419 FY19 Q120
Subscription ex FB $113 $172 $51 $55 $65 $66 $237 $68
YoY % ex FB 57% 52% 38% 30% 42% 40% 38% 33%
Marketplace & Other ex FB 20 27 8 8 15 13 44 14
YoY % ex FB 18% 35% 93% 27% 91% 43% 60% 76%
Total ex FB $133 $199 $59 $63 $80 $78 $281 $83
YoY % ex FB 51% 48% 44% 29% 49% 40% 41% 39%

© 2019 LiveRamp. All rights reserved.
Cash Flow$Ms
Slide 8 of 23
Q120 Q119
Operating cash flow ($15) ($2)
Capital expenditures 7 $5 $2
Free Cash Flow ($20) ($4)

Disciplined Capital Allocation
Bold business transformation
$2.1 billion in after-tax proceeds from sale of
non-core assets8
Meaningful TAM expansion & value creation through
disciplined M&A
Over $1.0 billion in share repurchases to date,
including tender offer completed Q3’19, since
FY129
Capitalize on the network effect of our platform
Financial flexibility
More of the same
Leverage our core competencies – identity,
data ethics, global network
$482 million remaining buyback capacity through
December 31, 2020
Slide 9 of 23

Outlook
© 2019 LiveRamp. All rights reserved.
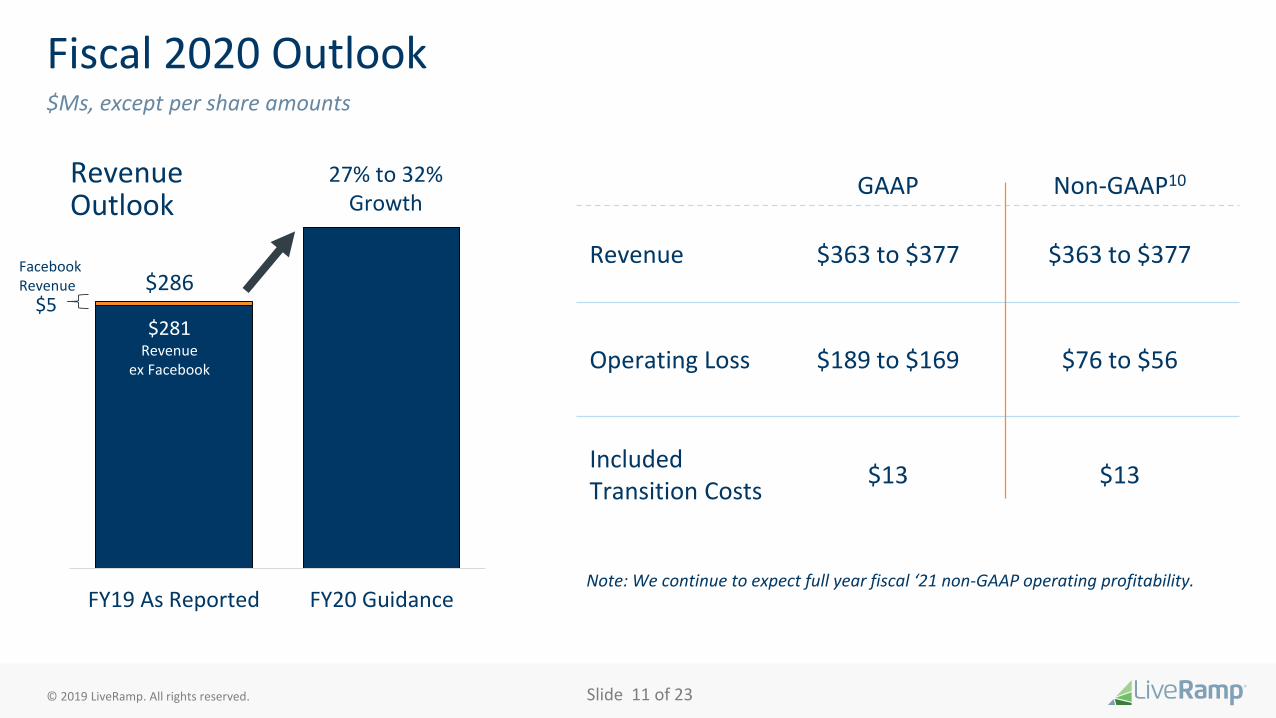
Fiscal 2020 Outlook$Ms, except per share amounts
Slide 11 of 23
FY19 As Reported FY20 Guidance
27% to 32% Growth
$5$286
$281Revenue
ex Facebook
Facebook Revenue
Revenue Outlook
Note: We continue to expect full year fiscal ‘21 non-GAAP operating profitability.
GAAP Non-GAAP10
Revenue $363 to $377 $363 to $377
Operating Loss $189 to $169 $76 to $56
Included Transition Costs
$13 $13

© 2019 LiveRamp. All rights reserved.
$Ms, Non-GAAP
Slide 12 of 23
Pro forma figures are unaudited and subject to change.Numbers may not foot due to rounding.
FY20E
FY19A Q120A Q220 Q320 Q420 FY20E
Revenue phasing by quarter 100% 22% 23% 27% 28% 100%
Transition costs (cost of revenue) $6 $3 $2 - - $5
Transition costs (op expenses) $15 $4 $4 - - $8
Total transition costs $ $22 $7 $6 - - $13
Guidance Phasing & Estimated Transition Costs

© 2019 LiveRamp. All rights reserved.
Ms
Slide 13 of 23
FY20E
Ongoing stock-based comp $56
Acquisition-related stock based comp $32
Total stock-based comp $8811
Interest income $18
Non-GAAP tax rate 0%
Share count (basic) ~68
Capital spending (% of rev.) 5%
Other Guidance Items

Appendix

© 2019 LiveRamp. All rights reserved.
Knockout Combination
Together
Enabling an open and flexible currency on which TV is bought, sold and measured
Global leader in true omnichannelidentity and data connectivity
Neutral, safe and secure choice
Unmatched scale and ubiquity: • 75%+ TV network adoption• 300+ top brands and agencies• 550+ ecosystem partners• 150+ unique data providers
Largest open, people-based identity graph and
relationships with world’s largest brands and agencies
Largest, most comprehensive cross-
screen data set and key sell-side relationships
Slide 15 of 23
© 2019 LiveRamp. All rights reserved.
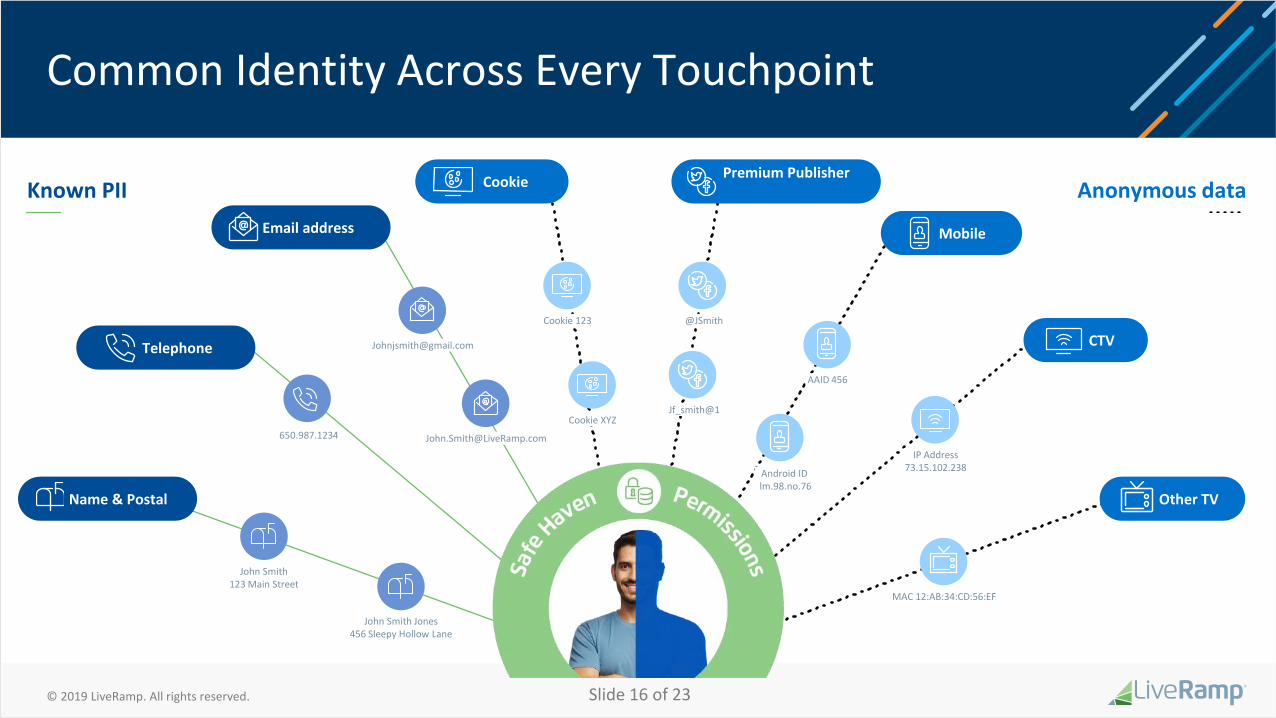
Common Identity Across Every Touchpoint
Known PII Anonymous data
John Smith123 Main Street
John Smith Jones456 Sleepy Hollow Lane
Name & Postal
Telephone
Email address
CookiePremium Publisher
Mobile
CTV
Other TV
Cookie 123 @JSmith
AAID 456
IP Address73.15.102.238
MAC 12:AB:34:CD:56:EF
650.987.1234 [email protected]
Cookie XYZ
Android IDlm.98.no.76
Jf_smith@1
Slide 16 of 23

Automate Opt Outs, SARs, Deletion Requests
Update on CCPA Readiness
Product Complete Data Inventory
Q2
Launch New Consumer Rights Portal
Document & Publish Policies Conduct Training
Complete Procedure Definition
Review Match, ATS, Smart Reach and Offline Partners
Write & Negotiate Obligation Terms
Review Data Store Sellers;
Q3
Governance
External Reviews & Comms
Slide 17 of 23

© 2019 LiveRamp. All rights reserved.
GAAP to Non-GAAP ReconciliationIncome Statement (part 1 of 2), $Ks
Slide 18 of 23
FY 17 Q1 18 Q2 18 Q3 18 Q4 18 FY 18 Q1 19 Q2 19 Q3 19 Q4 19 FY 19 Q1 20
Total Revenue 174,760$ 46,757$ 54,013$ 59,121$ 60,210$ 220,101$ 62,471$ 64,812$ 80,021$ 78,316$ 285,620$ 82,511$
Gross Profit (GAAP) 74,784$ 22,696$ 30,004$ 34,595$ 36,410$ 123,705$ 38,817$ 40,346$ 45,183$ 40,556$ 164,902$ 46,085$
% of Revenue 42.8% 48.5% 55.5% 58.5% 60.5% 56.2% 62.1% 62.3% 56.5% 51.8% 57.7% 55.9%
Excluded items:
Purchased intangible asset amortization 18,618 5,959 6,015 5,965 5,956 23,895 5,970 3,548 3,359 2,981 15,858 3,123
Non-cash stock compensation 4,318 637 654 673 687 2,651 712 782 1,052 2,163 4,709 755
Accelerated depreciation - - - - - - - - 1,527 1,445 2,972 1,487
Gross Profit - Non-GAAP 97,720$ 29,292$ 36,673$ 41,233$ 43,053$ 150,251$ 45,499$ 44,676$ 51,121$ 47,145$ 188,441$ 51,450$
% of Revenue 56% 62.6% 67.9% 69.7% 71.5% 68.3% 72.8% 68.9% 63.9% 60.2% 66.0% 62.4%
R&D (GAAP) 49,367$ 14,840$ 15,599$ 14,311$ 15,963$ 60,713$ 16,970$ 16,940$ 20,469$ 31,318$ 85,697$ 23,722$
% of Revenue 28.2% 31.7% 28.9% 24.2% 26.5% 27.6% 27.2% 26.1% 25.6% 40.0% 30.0% 28.8%
Excluded items:
Non-cash stock compensation 10,513 3,693 3,636 3,177 5,138 15,644 4,341 3,745 5,945 14,193 28,224 4,451
R&D - Non-GAAP 38,854$ 11,147$ 11,963$ 11,134$ 10,825$ 45,069$ 12,629$ 13,195$ 14,524$ 17,125$ 57,473$ 19,271$
% of Revenue 23.8% 23.8% 22.1% 18.8% 18.0% 20.5% 20.2% 20.4% 18.2% 21.9% 20.1% 23.4%
S&M (GAAP) 59,258$ 24,091$ 25,981$ 27,832$ 30,735$ 108,639$ 33,323$ 35,940$ 40,054$ 49,223$ 158,540$ 43,144$
% of Revenue 33.9% 51.5% 48.1% 47.1% 51.0% 49.4% 53.3% 55.5% 50.1% 62.9% 55.5% 52.3%
Excluded items:
Non-cash stock compensation 7,493 5,454 5,730 6,251 5,946 23,381 9,920 9,854 9,460 14,736 43,970 8,920
S&M - Non-GAAP 51,765$ 18,637$ 20,251$ 21,581$ 24,789$ 85,258$ 23,403$ 26,086$ 30,594$ 34,487$ 114,570$ 34,224$
% of Revenue 29.6% 39.9% 37.5% 36.5% 41.2% 38.7% 37.5% 40.2% 38.2% 44.0% 40.1% 41.5%
G&A (GAAP) 92,898$ 23,587$ 23,724$ 20,929$ 16,914$ 85,154$ 18,125$ 25,176$ 27,828$ 27,749$ 98,878$ 25,318$
% of Revenue 53.2% 50.4% 43.9% 35.4% 28.1% 38.7% 29.0% 38.8% 34.8% 35.4% 34.6% 30.7%
Excluded items:
Non-cash stock compensation 17,471 2,616 3,134 3,190 2,252 11,192 2,824 3,286 9,625 10,083 25,818 4,504
Separation & transformation costs 8,639 7,119 5,453 5,214 - 17,786 - 2,122 700 (705) 2,117 -
Accelerated depreciation - - - - - - - - 432 408 840 419
G&A - Non-GAAP 66,789$ $13,852 $15,136 $12,525 $14,662 $56,176 $15,301 $19,768 $17,071 $17,963 $70,102 20,395$
% of Revenue 38.2% 29.6% 28.0% 21.2% 24.4% 25.5% 24.5% 30.5% 21.3% 22.9% 24.5% 24.7%
12

© 2019 LiveRamp. All rights reserved.
GAAP to Non-GAAP ReconciliationIncome Statement (part 2 of 2), $Ks
Slide 19 of 23
FY 17 Q1 18 Q2 18 Q3 18 Q4 18 FY 18 Q1 19 Q2 19 Q3 19 Q4 19 FY 19 Q1 20
Loss from operations (GAAP) (131,412)$ (39,819)$ (38,133)$ (27,689)$ (27,883)$ (133,524)$ (29,602)$ (38,199)$ (48,211)$ (82,134)$ (198,146)$ (48,375)$
% of Revenue -75.2% -85.2% -70.6% -46.8% -46.3% -60.7% -37.8% -48.8% -61.6% -104.9% -69.4% -58.6%
Excluded items:
Purchased intangible asset amortization 18,618$ 5,959$ 6,015$ 5,965$ 5,956$ 23,895$ 5,970$ 3,548$ 3,359$ 2,981$ 15,858$ 3,123$
Non-cash stock compensation 39,795 12,400 13,154 13,290 14,022 52,866 17,798 17,667 26,082 41,175 102,722 18,630
Restructuring & merger charges 4,672 (3) 2,833 (788) 681 2,723 1 489 5,043 14,400 19,933 2,276
Separation & transformation costs 8,639 7,119 5,453 5,214 - 17,786 - 2,122 700 (705) 2,117 -
Accelerated depreciation - - - - - - - - 1,959 1,853 3,812 1,906
Loss from operations - Non-GAAP (59,688)$ (14,344)$ (10,678)$ (4,008)$ (7,224)$ (36,254)$ (5,833)$ (14,373)$ (11,068)$ (22,430)$ (53,704)$ (22,440)$
% of Revenue -34.2% -30.7% -19.8% -6.8% -12.0% -16.5% -9.3% -22.2% -13.8% -28.6% -18.8% -27.2%
Loss from continuing ops before tax (GAAP) ($130,760) ($40,399) ($37,870) ($27,257) ($27,496) ($133,022) ($29,246) ($38,480) ($37,807) ($73,823) ($179,356) ($42,493)
Excluded items:
Purchased intangible asset amortization 18,618$ 5,959$ 6,015$ 5,965$ 5,956$ 23,895$ 5,970$ 3,548$ 3,359$ 2,981$ 15,858$ 3,123$
Non-cash stock compensation 39,795 12,400 13,154 13,290 14,022 52,866 17,798 17,667 26,082 41,175 102,722 18,630
Restructuring & merger charges 4,672 (3) 2,833 (788) 681 2,723 1 489 5,043 14,400 19,933 2,276
Separation & transformation costs 8,639 7,119 5,453 5,214 - 17,786 - 2,122 700 (705) 2,117 -
Accelerated depreciation - - - - - - - - 1,959 1,853 3,812 1,906
Loss from continuing ops before tax - Non-GAAP ($59,036) ($14,924) ($10,415) ($3,576) ($6,837) ($35,752) ($5,477) ($14,654) ($664) ($14,119) ($34,914) ($16,558)
% of Revenue -33.8% -31.9% -19.3% -6.0% -11.4% -16.2% -8.8% -22.6% -0.8% -18.0% -12.2% -20.1%
12

© 2019 LiveRamp. All rights reserved.
Adjusted EBITDA Reconciliation$Ks
Slide 20 of 23
FY 17 Q1 18 Q2 18 Q3 18 Q4 18 FY 18 Q1 19 Q2 19 Q3 19 Q4 19 FY 19 Q1 20
Net earnings (loss) from continuing operations (GAAP) (85,576)$ (26,215)$ (25,191)$ 3,117$ (19,010)$ (67,299)$ (27,818)$ (41,180)$ (15,261)$ (49,688)$ (133,947)$ (42,140)$
Income taxes (benefit) (45,184) (14,184) (12,679) (30,374) (8,486) (65,723) (1,428) 2,700 (22,546) (24,135) (45,409) (353)
Other income (expense) 652 (580) 263 432 387 502 356 (281) 10,404 8,311 18,790 5,882
Loss from operations (GAAP) (131,412) (39,819) (38,133) (27,689) (27,883) (133,524) (29,602) (38,199) (48,211) (82,134) (198,146) (48,375)
Depreciation and amortization 29,848 9,193 9,765 9,297 9,392 37,647 9,403 7,018 8,853 8,508 33,782 8,877
EBITDA (101,564)$ (30,626)$ (28,368)$ (18,392)$ (18,491)$ (95,877)$ (20,199)$ (31,181)$ (39,358)$ (73,626)$ (164,364)$ (39,498)$
Other adjustments:
Non-cash stock compensation 39,772$ 12,400$ 13,154$ 13,290$ 14,022$ 52,866$ 17,798$ 17,667$ 26,082$ 41,174$ 102,721$ 18,630$
Restructuring and merger charges 4,753 (3) 2,833 (788) 681 2,723 1 489 5,043 14,400 19,933 2,276
Separation and transformation 8,639 7,119 5,453 5,214 - 17,786 - 2,122 700 (705) 2,117 -
Adjusted EBITDA (48,400)$ (11,110)$ (6,928)$ (676)$ (3,787)$ (22,502)$ (2,400)$ (10,903)$ (7,533)$ (18,756)$ (39,593)$ (18,592)$
12
© 2019 LiveRamp. All rights reserved.
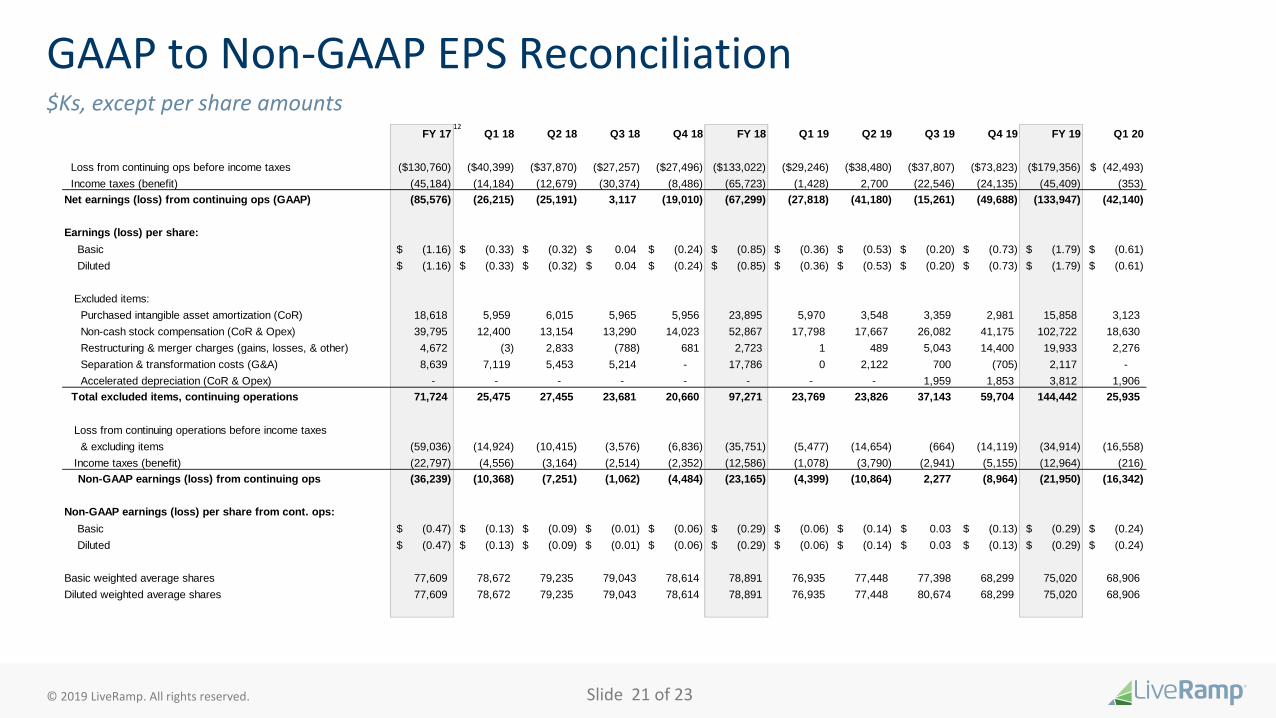
GAAP to Non-GAAP EPS Reconciliation$Ks, except per share amounts
Slide 21 of 23
FY 17 Q1 18 Q2 18 Q3 18 Q4 18 FY 18 Q1 19 Q2 19 Q3 19 Q4 19 FY 19 Q1 20
Loss from continuing ops before income taxes ($130,760) ($40,399) ($37,870) ($27,257) ($27,496) ($133,022) ($29,246) ($38,480) ($37,807) ($73,823) ($179,356) (42,493)$
Income taxes (benefit) (45,184) (14,184) (12,679) (30,374) (8,486) (65,723) (1,428) 2,700 (22,546) (24,135) (45,409) (353)
Net earnings (loss) from continuing ops (GAAP) (85,576) (26,215) (25,191) 3,117 (19,010) (67,299) (27,818) (41,180) (15,261) (49,688) (133,947) (42,140)
Earnings (loss) per share:
Basic (1.16)$ (0.33)$ (0.32)$ 0.04$ (0.24)$ (0.85)$ (0.36)$ (0.53)$ (0.20)$ (0.73)$ (1.79)$ (0.61)$
Diluted (1.16)$ (0.33)$ (0.32)$ 0.04$ (0.24)$ (0.85)$ (0.36)$ (0.53)$ (0.20)$ (0.73)$ (1.79)$ (0.61)$
Excluded items:
Purchased intangible asset amortization (CoR) 18,618 5,959 6,015 5,965 5,956 23,895 5,970 3,548 3,359 2,981 15,858 3,123
Non-cash stock compensation (CoR & Opex) 39,795 12,400 13,154 13,290 14,023 52,867 17,798 17,667 26,082 41,175 102,722 18,630
Restructuring & merger charges (gains, losses, & other) 4,672 (3) 2,833 (788) 681 2,723 1 489 5,043 14,400 19,933 2,276
Separation & transformation costs (G&A) 8,639 7,119 5,453 5,214 - 17,786 0 2,122 700 (705) 2,117 -
Accelerated depreciation (CoR & Opex) - - - - - - - - 1,959 1,853 3,812 1,906
Total excluded items, continuing operations 71,724 25,475 27,455 23,681 20,660 97,271 23,769 23,826 37,143 59,704 144,442 25,935
Loss from continuing operations before income taxes
& excluding items (59,036) (14,924) (10,415) (3,576) (6,836) (35,751) (5,477) (14,654) (664) (14,119) (34,914) (16,558)
Income taxes (benefit) (22,797) (4,556) (3,164) (2,514) (2,352) (12,586) (1,078) (3,790) (2,941) (5,155) (12,964) (216)
Non-GAAP earnings (loss) from continuing ops (36,239) (10,368) (7,251) (1,062) (4,484) (23,165) (4,399) (10,864) 2,277 (8,964) (21,950) (16,342)
Non-GAAP earnings (loss) per share from cont. ops:
Basic (0.47)$ (0.13)$ (0.09)$ (0.01)$ (0.06)$ (0.29)$ (0.06)$ (0.14)$ 0.03$ (0.13)$ (0.29)$ (0.24)$
Diluted (0.47)$ (0.13)$ (0.09)$ (0.01)$ (0.06)$ (0.29)$ (0.06)$ (0.14)$ 0.03$ (0.13)$ (0.29)$ (0.24)$
Basic weighted average shares 77,609 78,672 79,235 79,043 78,614 78,891 76,935 77,448 77,398 68,299 75,020 68,906
Diluted weighted average shares 77,609 78,672 79,235 79,043 78,614 78,891 76,935 77,448 80,674 68,299 75,020 68,906
12

© 2019 LiveRamp. All rights reserved.
Footnotes
Slide 22 of 23
1 Revenue run-rate equals most recent quarter revenue total multiplied by four.
2 Direct client count excludes agency and reseller deployments and Data Store-only customers.
3 Beginning in Q3’19 we began reporting client count net of 40 client contracts that were absorbed into one large reseller contract (no net revenue impact to LiveRamp). Historical customer counts net of IPG contracts are: FY16: 258, FY17: 402, FY18: 550, Q119:,585 Q219: 610, Q319: 640, Q419: 665, Q120: 690.
4 Dollar-based net retention is defined as current period net revenue from customers who have been on the platform for one year or more, divided by prior year revenue, inclusive of upsell, churn and downsell.
5 $1M clients are counted as $250k or more subscription-only revenue in the quarter.
6 Non-GAAP financial results represent continuing operations less excluded items (i.e. non-cash stock compensation, purchased intangible asset amortization, accelerated depreciation, restructuring charges and separation costs). Excluding non-recurring transition expenses, Q1’20 non-GAAP gross profit was $54M, non-GAAP gross margin was 66%, non-GAAP operating loss was $16M and non-GAAP operating margin was (17%). Q1’20 non-GAAP EPS of ($0.24) includes approximately $6 million of interest income associated with cash received from the divestiture of Acxiom Marketing Solutions.
7 Historic capital expenditures related to Acxiom include capitalized software development costs.
8 $2.1 billion includes the sale of Acxiom Marketing Solutions (AMS) for after-tax proceeds of $1.8 billion and $300 million in after-tax proceeds for divestitures prior to the sales of AMS since FY12.
9 Over $1.0 billion in share repurchases includes a $500 million tender offer completed in December 2018 and $518 million in regular buybacks since FY12.
10 Non-GAAP guidance excludes non-cash stock compensation, purchased intangible asset amortization, accelerated depreciation, restructuring charges and separation costs.
11 Includes $32 million of acquisition-related stock-based compensation.
12 FY 17 results include $20 million in revenue and $1 million of loss from operations related to Acxiom Impact divested in 2016.

© 2019 LiveRamp. All rights reserved.