q17.8 - appendix 1 - 2003 ground contamination report ...... · task 1 preparatory works task 2...
TRANSCRIPT

Applicant’s Response to ExA’s First Written Questions Document Ref. 9.1
Q17.8 - APPENDIX 1 - 2003 GROUND CONTAMINATION REPO RT & FIGURES
100400XEB0200XSURVEY2003
SCOPE OF WORK FOR A CONTAMINATED LAND AND WATER SURVEY AT
DRAX POWER STATION
3.1 Scope of Work
The objectives of the investigation will be to assess potential major liabilities associated with the
site and to verify the site condition further to the survey report of January 2000. It is anticipated
that the assessment will largely replicate the previous survey and provide an update but also
incorporate significant events as a result of operations since the last survey. The assessment report
produced from this study will be incorporated into the technical risk assessment to be produced by
Stone & Webster, as an appendix.
3.2 Objectives
The objectives to be met by the investigation are as follows: •
•
•
•
The previous site survey issued by Dames & Moore, background information regarding recent site operations, and the results of a site walkover/staff interviews, will be utilised to update the conceptual site model (CSM). The CSM will define potential contaminant source, pathway, and receptor relationships for the site.
the installation of boreholes, trial pits and window sampling collection of soil and groundwater
samples for subsequent laboratory analysis. The sampling programme will seek to characterise contamination in potential source areas pathways and receptors defined by the CSM. Where surface waters are the potential receptor, water and sediment samples will be collected to characterise the type and degree of impact present;
the results of the analytical testing programme will be assessed through the performance of a
qualitative risk assessment. This will provide a provisional assessment of the significance of observed contamination by comparison against appropriate standards. In the event that potentially significant contamination is detected, then URS should advise and prepare a cost estimate to undertake a site-specific quantitative risk assessment in line with the UK government guidance.
an interpretative report will be produced which summarises the findings of the investigation and
risk assessment, identifies outstanding risks and liabilities associated with the site and provides an outline of potential remedial works (and costs) required including recommendations for further work to better define the scale of work required.
3.3 Tasks The tasks associated with this scope and their specific description is expected to update the Scope of Works as provided in Section 3.0 of the Dames & Moore proposal dated 16 September 1999.

The assessment should include: Task 1 Preparatory Works Task 2 Siteworks Task 3 Laboratory Analysis Task 4 Quantitative Risk Assessment (QRA) Task 5 Data assessment and Reporting Task 1 Preparatory Works
This task will include a site walkover to finalise the precise location of sampling points. The site
walkover should include the designated Project Manager, a Stone & Webster representative and an AES
Drax representative.
Additionally a site specific Health and Safety Plan for the works will be prepared.
Task 2 Site Works
The proposal should include a description of all potential on site activities including:
• Concrete coring
• Shell & Auger Drilling – Deep Groundwater Sampling
• Window Sampling – Soil and Groundwater
• Trial-Pitting – Soil Sampling
• Downhole and Headspace Analysis with PID
• Soil Sampling
• Groundwater Monitoring Well Installation and Well Development
• Groundwater Sampling
• Levelling
Task 3 Laboratory Analysis
The proposal should indicate the chosen laboratory facility and confirm the necessary accreditations. The analytical schedule should include: • Heavy metals • Major ions (including sulphates and chlorides) • PAHs • PCBs • VOC

• Total Petroleum Hydrocarbons • Asbestos • Total Organic Carbon • Grain size distribution The proposal will define the appropriate number and type of samples. Task 4 Risk Assessment The proposal should include details of an initial assessment of the analytical data, including the criteria to be used for comparisons. The assessment should include any areas of concern and recommendations for quantitative risk assessment if appropriate. Task 5 Data Assessment and Reporting The methodologies, results, conclusions, and recommendations should be presented to Stone & Webster in the form of a report. The report should include: • Summary of field methodologies • Plans of borehole locations, water levels and spatial distribution of contaminants • Review of temporal variation in deep groundwater and surface water quality through the results
from this study and previous monitoring undertaken by the site • Borehole and trial pit logs • Tables of analytical results and results from on site testing • Conclusions with respect to the nature, source, distribution, potential severity, mobility and extent
of contamination, together with potential risks posed by the observed contamination and associated liability (in terms of migration potential and remedial costs).

44354-002-734/JDWW/OM/ar 11th September 2003
FINAL REPORT
SITE ENVIRONMENTAL CONTAMINATION INVESTIGATION AT DRAX POWER STATION on behalf of STONE & WEBSTER
3rd Floor Minerva House 29 East Parade
Leeds LS1 5PS
Tel: 0113 242 3779
Fax: 0113 246 0243
Stone & Webster URS Corporation Ltd
44354-002-734/JDWW/OM/ar 11th September 2003 Rpt01 Final Report
FINAL REPORT
SITE ENVIRONMENTAL CONTAMINATION INVESTIGATION DRAX POWER STATION
on behalf of STONE & WEBSTER
TABLE OF CONTENTS
PAGE NO.
1. INTRODUCTION ................................................................................................................................5
1.1. GENERAL INTRODUCTION..................................................................................................5
1.2. TERMS OF REFERENCE ........................................................................................................5
1.3. REPORT LIMITATIONS..........................................................................................................5
1.4. REPORT LAYOUT...................................................................................................................6
2. PROJECT BACKGROUND.................................................................................................................7
2.1. SITE DESCRIPTION ................................................................................................................7
2.2. RAW MATERIALS USED ON-SITE.......................................................................................7
2.3. WASTES GENERATED ON-SITE ..........................................................................................9
2.4. OTHER ON-SITE SUBSTANCES OF POTENTIAL CONCERN.........................................10
2.5. ENVIRONMENTAL SETTING .............................................................................................10
2.6. LEGISLATIVE FRAMEWORK .............................................................................................11
2.7. CONCEPTUAL SITE MODEL AND INVESTIGATION STRATEGY................................11 2.7.1. Potential Sources .......................................................................................................11 2.7.2. Potential Pathways & Receptors................................................................................11
3. OBJECTIVES..................................................................................................................................... 13
4. SCOPE OF WORKS........................................................................................................................... 14
4.1. INTRODUCTION ...................................................................................................................14
4.2. TASK 1 – PREPARATORY WORKS ....................................................................................14
4.3. TASK 2 – SITEWORKS .........................................................................................................15
4.4. TASK 2A – ABSESTOS LIABILITY REVIEW ....................................................................17
4.5. TASK 3 - LABORATORY ANALYSIS .................................................................................17
4.6. TASKS 4 & 5 – ASSESSMENT AND REPORTING.............................................................17
5. INVESTIGATION RESULTS............................................................................................................ 18
5.1. INTRODUCTION ...................................................................................................................18
5.2. SITE GEOLOGY.....................................................................................................................18
5.3. SITE HYDROGEOLOGY.......................................................................................................19 5.3.1. Shallow Groundwater ................................................................................................19 5.3.2. Deep Groundwater.....................................................................................................19
5.4. SITE OBSERVATIONS AND TESTING...............................................................................20
5.5. LABORATORY RESULTS ....................................................................................................20 5.5.1. Introduction ...............................................................................................................20
Stone & Webster URS Corporation Ltd
44354-002-734/JDWW/OM/ar 11th September 2003 Rpt01 Final Report
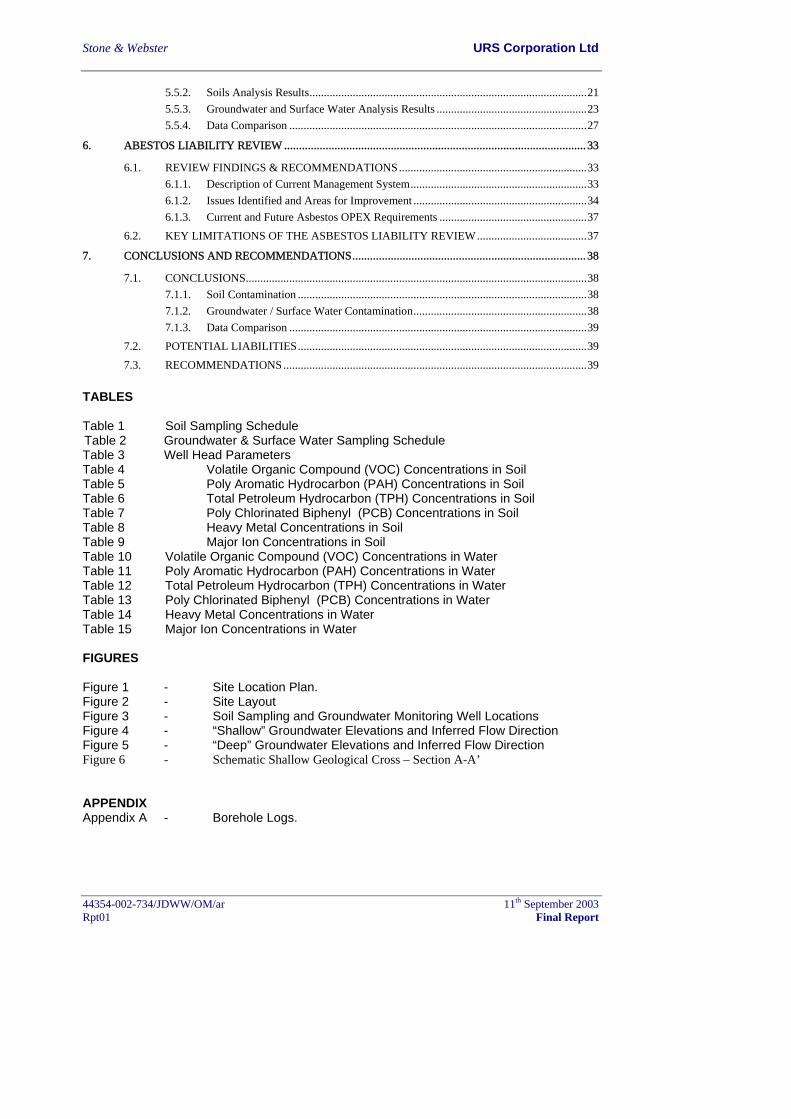
5.5.2. Soils Analysis Results................................................................................................21 5.5.3. Groundwater and Surface Water Analysis Results ....................................................23 5.5.4. Data Comparison .......................................................................................................27
6. ABESTOS LIABILITY REVIEW ...................................................................................................... 33
6.1. REVIEW FINDINGS & RECOMMENDATIONS.................................................................33 6.1.1. Description of Current Management System.............................................................33 6.1.2. Issues Identified and Areas for Improvement ............................................................34 6.1.3. Current and Future Asbestos OPEX Requirements ...................................................37
6.2. KEY LIMITATIONS OF THE ASBESTOS LIABILITY REVIEW......................................37
7. CONCLUSIONS AND RECOMMENDATIONS............................................................................... 38
7.1. CONCLUSIONS......................................................................................................................38 7.1.1. Soil Contamination ....................................................................................................38 7.1.2. Groundwater / Surface Water Contamination............................................................38 7.1.3. Data Comparison .......................................................................................................39
7.2. POTENTIAL LIABILITIES....................................................................................................39
7.3. RECOMMENDATIONS.........................................................................................................39
TABLES Table 1 Soil Sampling Schedule Table 2 Groundwater & Surface Water Sampling Schedule Table 3 Well Head Parameters Table 4 Volatile Organic Compound (VOC) Concentrations in Soil Table 5 Poly Aromatic Hydrocarbon (PAH) Concentrations in Soil Table 6 Total Petroleum Hydrocarbon (TPH) Concentrations in Soil Table 7 Poly Chlorinated Biphenyl (PCB) Concentrations in Soil Table 8 Heavy Metal Concentrations in Soil Table 9 Major Ion Concentrations in Soil Table 10 Volatile Organic Compound (VOC) Concentrations in Water Table 11 Poly Aromatic Hydrocarbon (PAH) Concentrations in Water Table 12 Total Petroleum Hydrocarbon (TPH) Concentrations in Water Table 13 Poly Chlorinated Biphenyl (PCB) Concentrations in Water Table 14 Heavy Metal Concentrations in Water Table 15 Major Ion Concentrations in Water FIGURES Figure 1 - Site Location Plan. Figure 2 - Site Layout Figure 3 - Soil Sampling and Groundwater Monitoring Well Locations Figure 4 - “Shallow” Groundwater Elevations and Inferred Flow Direction Figure 5 - “Deep” Groundwater Elevations and Inferred Flow Direction Figure 6 - Schematic Shallow Geological Cross – Section A-A’ APPENDIX Appendix A - Borehole Logs.
Stone & Webster URS Corporation Ltd
44354-002-734/JDWW/OM/ar 11th September 2003 Rpt01 Final Report
i
•
•
•
•
•
FINAL REPORT
SITE ENVIRONMENTAL CONTAMINATION INVESTIGATION DRAX POWER STATION
on behalf of STONE & WEBSTER
EXECUTIVE SUMMARY
This Final report presents the findings of an environmental investigation at the Drax Power Station, North Yorkshire performed by URS for Stone & Webster Consultants acting as Independent Technical Advisor to the Lenders. We understand that a copy of this report will be made available to the owner/operator of the site for their records.
The objectives of this investigation were as follows:
Combine and update a previous report issued by URS (as Dames & Moore), site operational information, and information from intrusive works in 2003, to update the conceptual site model (CSM).
Replicate and where appropriate supplement the previous investigation to enable a comparison against previous site conditions. This required an intrusive investigation collecting soil and groundwater samples for laboratory analysis, using existing wells where possible, and replacing wells lost or destroyed in areas of concern.
Assess results of analytical testing through performance of a preliminary qualitative risk assessment (QRA), comparing contaminant concentrations against generic Tier 1 screening criteria. If the preliminary QRA suggests potential for significant contamination, then advice and cost estimates for a detailed (site-specific) QRA to be provided.
Review current baseline information, registers, risk assessments and management plans for asbestos containing materials (ACMs) to assess extent of liabilities for continued operation of the site, with particular reference to new regulations.
Provide an interpretative report summarising findings of investigation and risk assessment, identifying risks and liabilities and providing an outline of potential remedial works (and costs) if required;
The initial task of this study was to both review the previous investigation report by URS (as Dames & Moore) and complete a site walkover assessing the condition of remaining wells. After completion of appropriate health & safety procedures, URS site engineers supervised the intrusive investigation. It comprised: • Window sampling (shallow drilling) and well installation at seven locations to investigate new
areas of potential contamination identified during the walkover (waste pit and transformer fire area) and to replace a previous well that had been destroyed.
• Cable percussion borehole drilling and well installation at two locations to replace former groundwater monitoring wells installed into the Sandstone Aquifer.
Stone & Webster URS Corporation Ltd
44354-002-734/JDWW/OM/ar 11th September 2003 Rpt01 Final Report
ii
• •
• Sampling of soils, groundwater and surface water from previous and new locations, for laboratory analysis of chemical contaminants.
• Detailed logging of soils and monitoring of groundwater elevations to confirm the geological understanding of the site and update the interpretation of the groundwater-flow regime.
The geological sequence beneath the site can be summarised as follows: • Made Ground: predominantly granular (sand, concrete, ash, siltstone, sandstone fragments)
and of variable depth (0.5 – 5.0m);
• Vale of York Drift: firm to stiff brown clay alluvial deposits, which typically extend to depths of up to 16m below ground level. These were observed to contain occasional sandy lenses;
• Sherwood Sandstone Group: this is a fine to medium-grained and typically fractured sandstone unit.
Groundwater observations were follows:
• Groundwater levels measured in the “shallow” (window sample) monitoring wells indicate a
“general” flow direction towards the northeast. This suggests shallow groundwater flow towards the natural discharge via a network of drains and streams feeding the River Ouse. Previous interpretations of the shallow groundwater flow direction were masked by shallow sub-surface features (foundations etc).
• The Sherwood Sandstone is a Major Aquifer of regional significance, in which groundwater is confined by overlying lower permeability horizons. Groundwater from this unit is abstracted from two 105m deep on-site boreholes for boiler water make-up. Regionally there are a number of other abstractions from this unit for both industrial and potable supply. Regional groundwater flow in the Sherwood Sandstone is understood to be towards the southwest towards two groups of abstraction wells, some 3 km from the site. Groundwater levels in the “deep” monitoring wells indicate a flow direction towards the southwest and a “depression” in the groundwater elevation due to the on-site abstraction boreholes. The inferred groundwater contours suggest ‘capture’ by the on-site abstractions of all deep groundwater passing beneath the site.
Potential receptors for soil and groundwater contamination at the Drax site can be divided into two groups:
Human Health: Mainly limited to site staff and visitors; Controlled Water: Principally surface waters and the Sandstone Major Aquifer.
Soil and water samples collected at the site were submitted for analysis for the following range of determinands: • Volatile Organic Compounds, Total Petroleum Hydrocarbons, Polychlorinated Biphenyls, Heavy
Metals, Asbestos, Major Ions.
Stone & Webster URS Corporation Ltd
44354-002-734/JDWW/OM/ar 11th September 2003 Rpt01 Final Report
iii
A summary of the analytical data produced for the Drax site and the comparison against generic quality standards is as follows:
Shallow Soils: In general, soil contamination is absent from most of the areas of the site investigated. A small number of isolated elevated concentrations were identified as follows: • A single elevated PAH (benzo(a)pyrene) concentration at WS206 (0.5-0.6m bgl).
• Diesel Range Organics (DRO) were in excess of 8000mg/kg (0.3-0.4m bgl) decreasing to less than 6000mg/kg (4.8 – 4.9m bgl) in WS207, adjacent to the transformer fire area. These elevated soil concentrations were not reflected by the groundwater results from this borehole or others in close proximity.
No other soil contamination was identified in this investigation. Groundwater and Surface Water: The majority of the groundwater and surface water samples analyses were not contaminated in excess of Tier 1 screening criteria, with the following small number of exceptions: • SW6 contained 155ug/l DRO, identified as biodegraded diesel.
• BH5 contained 292ug/l DRO, identified as diesel.
• At the southern end of the site, DRO was present in WS116, WS119, WS121 and WS122 in an area of fuel storage.
• Marginal exceedences of arsenic, cadmium and chromium in WS105, WS122, WS131 and SW3.
• Localized exceedences of nickel, selenium and boron in WS105, WS125 SW3, SW4 and SW7.
• WS105 contained high concentrations of dissolved ions. Elsewhere across the site, ions were generally slightly elevated, with manganese particularly high in SW4, and alkalinity high in WS111. Elevated ion concentrations may not solely be attributable to site processes and activities.
Marginal and localized exceedences of screening criteria suggest contamination present may be at relatively low levels and restricted to comparatively small areas of the site. The investigation has not identified site wide elevated concentrations of compounds related to site activities. Some compounds, in elevated concentrations, such as petroleum hydrocarbons may be attributable to site activities in specific areas but a number of elevated concentrations may result from off-site sources or as a natural condition.
Comparison against previous data: In general, the groundwater results are similar to the previous investigation results, with the exception of a general increase in concentrations of diesel range organics (DRO) across the site. Volatile Organic Compounds (VOCs) were not detected during the current round of sampling. The extent to which increased levels of DRO are a concern should be considered in the context of (1) present conditions and (2) the increasing trend suggested by the data available to date. With regard to the former issue, the observed concentrations are not thought likely to represent a significant risk to either human health or controlled waters under

Stone & Webster URS Corporation Ltd
44354-002-734/JDWW/OM/ar 11th September 2003 Rpt01 Final Report
iv
present site conditions. This opinion is based on experience of similar situations where the degradation potential of DRO compounds is such that they would not be expected to migrate as far as a sensitive receptor. In the event that a regulator became involved then it would be necessary to confirm this through the completion of a quantitative risk assessment. In respect of what the data suggests regarding the trends over time, then the overall increase seen at many (though not all) locations could be of concern if it were to continue. The deterioration appears to be principally focused on shallow groundwater quality in the southern are of the station. There are a number of locations in this area where hydrocarbons are stored and handled. They include drainage systems and storage tanks. Consideration should be given to investigating operating procedures and containment measures in this area to avoid any further loss of material that could exacerbate the situation further. The asbestos survey has revealed that recent increases from anticipated operational expenditure (OPEX) have occurred, and that this is likely to continue over the next 5 years, in order to meet the requirements of forthcoming regulations. Following this period, OPEX due to asbestos is likely to decrease. Overall, Drax Power Station appears to be managed to a reasonably high standard with regard to environmental issues. Gross contamination of soil, groundwater or surface water has not been encountered, and there is ongoing improvement with regard to asbestos materials at the site. The 1999 survey stated that the data collected did not indicate the presence of a significant environmental liability relating to ground contamination at the Drax site. The results of the current survey do not significantly alter that conclusion.
Stone & Webster URS Corporation Ltd
44354-002-734/JDWW/OM/ar 11th September 2003 Rpt01 Final Report
5
FINAL REPORT
SITE ENVIRONMENTAL CONTAMINATION INVESTIGATION DRAX POWER STATION
on behalf of STONE & WEBSTER
INTRODUCTION
GENERAL INTRODUCTION This Final report presents the objectives, scope of work, results and findings of the environmental contamination investigation conducted at the Drax Power Station, North Yorkshire, on behalf Stone & Webster (Figure 1 presents the site location). URS (as Dames & Moore) undertook a ‘contaminated land and water survey’ of the subject facility in support of the due diligence process undertaken by AES Electric Ltd during their acquisition of the site in 2000 (report reference 44354-001-420/JDWW/RC/ct). This report has been prepared to provide an update of that original survey. It is understood that this report will form an appendix to an independent technical due-diligence report being prepared by Stone & Webster on behalf of lenders.
terms of reference This work was performed in general accordance with URS’s proposal (Ref. LDS-152/09734/JDWW/OM, dated 26 June 2003) prepared in response to a written request by Chris Johnson of Stone & Webster Consultants Ltd to Mr Jim Wragg of URS. Written acceptance of the URS proposal was received by URS from Chris Johnson of Stone & Webster on 11 July 2003.
report limitations URS has prepared this report for the sole use of Stone & Webster in accordance with generally accepted consulting practice and for the intended purpose set out in the related contract agreement. No other warranty, expressed or implied, is made as to the professional advice included in this report. To the best of our knowledge, information contained in this report is accurate at the date of issue. However, subsurface conditions including groundwater levels and contaminant concentrations may vary spatially and with time. As with all assessments of this type, emphasis is placed on chemical data that have been collected according to established protocols. It should be noted however, that there might be areas of undetected contamination or environmental media, which if sampled, would be of concern. However, we have used all of our professional judgement in attempting to limit this during the investigation. It is important therefore that these implications be clearly recognised when the findings of this study are being interpreted. This should be borne in mind if this report is used without further confirmatory testing after a significant time period.
Stone & Webster URS Corporation Ltd
44354-002-734/JDWW/OM/ar 11th September 2003 Rpt01 Final Report
6
•
•
•
•
•
report layout The remainder of this report is set out as follows:
Section 2 describes the background to the project and summarises the Conceptual Site Model, as it was understood at the completion of the previous study.
The specific objectives of this current investigation are described in Section 3.0.
The scope of works required is described in Section 4.0.
Sections 5.0 and 6.0 describe in detail the works carried out and the results obtained from each of the work tasks.
The conclusions and recommendations arising from this study are presented in Section 7.0.
Stone & Webster URS Corporation Ltd
44354-002-734/JDWW/OM/ar 11th September 2003 Rpt01 Final Report
7
•
•
•
•
•
•
•
•
•
•
•
•
•
project background This section presents an overview of site operations at Drax and highlights key issues of potential environmental concern targeted by this investigation.
Site Description The Drax Power Station is located at National Grid Reference (NGR) 664 272 approximately 1 km southwest of the River Ouse and 8.5 km west-northwest of Goole Town Centre in North Yorkshire as shown on Figure 1. Figure 2 illustrates the site layout. The site is a large coal-fired power station and consists of six 660 MWe Boiler Turbine Generators giving a nominal capacity of 4,000 MWe. All the power generating plant is contained within the site, the principal elements being:
Boilers and turbine hall;
Flue Gas Desulphurisation (FGD) plant;
12 cooling towers;
pumphouse;
coal store;
Barlow Ash Disposal facility;
Limestone and gypsum stores.
The above elements cover an area of 396ha (980 acres) of the 752ha (1,858 acres) within the site property. The power station was constructed in two phases with the first three boiler turbine generators starting commissioning in December 1973. The second three units were installed by 1986. In the early 1990s the FGD plant was retrofitted to the station in three phases (1993 – 1996).
Raw Materials used On-Site The principal raw materials used by the site include:
coal;
water (abstracted from the River Ouse, Sherwood Sandstone and Yorkshire Water mains);
fuel oils;
diesel oil;
lubricating oils;
water treatment chemicals (cooling water);
Stone & Webster URS Corporation Ltd
44354-002-734/JDWW/OM/ar 11th September 2003 Rpt01 Final Report
8
•
•
•
•
•
•
•
•
•
water treatment chemicals (FGD plant);
limestone.
Coal is imported to the site by rail (although facilities exist for road import) and around 1.3 million tonnes has been typically kept within the coal stockpile. Run-off from the coal stockpile is collected by a surrounding drain and is used for process purposes with the cooling water stream. Around 3 tonnes of water per second is abstracted from the River Ouse for cooling water make-up. This is treated with sulphuric acid (pH control and scale prevention) and sodium hypochlorite (biocide). The cooling water purge comprises approximately 1.5 tonnes per second. The purge water relative to the abstracted water quality is concentrated up by a factor of between 1.5 – 2.0. The purge water is discharged to a point within the tidal range of the River Ouse. The discharge stream also includes:
Effluent from the on-site oil/water separators;
Site drainage (including that from the southern part of the PFA disposal area);
Boiler blowdown;
Water treatment plant effluent;
FGD plant effluent;
Sedimentation plant discharges;
Sewage plant effluent.
Some site drainage was also discharged under consent to Carr Dyke. It is understood that this practice was discontinued prior to the previous URS study. Boiler make-up water is obtained from one of two on-site abstraction boreholes. The location of these is illustrated in Figure 2. Some additional water is understood to be obtained from the Yorkshire Water Plc mains supply. Fuel oil is used at the site for boiler house start-up operations. This is imported to site mainly by rail, although facilities for road and river imports are present. The fuel oil is heavy grade material requiring tank and pipelines to be insulated with trace heating. Lighter fraction oils are also stored to power three gas turbine units used to handle peak demand periods. Fuel oils are stored in bunded bulk storage tanks in two areas of the site. Diesel fuel is used for mobile plant at the site. This is stored in bunded aboveground tanks adjacent to the coal stockpile. Diesel was formerly stored in two underground storage tanks adjacent to the turbine house. It is understood that these tanks were decommissioned in 1990/91 and were filled with concrete. In addition, it is understood that unbunded diesel ASTs were previously located in contractor areas at the site. Lubricating oils are used in relatively large quantities at the site. The principal area of storage for this material is a bunded tank farm southwest of the main plant. Smaller quantities of lubricating bunded oils are stored in drums within maintenance workshop
Stone & Webster URS Corporation Ltd
44354-002-734/JDWW/OM/ar 11th September 2003 Rpt01 Final Report
9
•
•
•
•
•
•
•
•
•
•
•
areas at the site. It is also understood that small quantities (5 litres/year) of chlorinated solvents are also used in these areas. Water treatment chemicals are primarily stored in aboveground bunded bulk storage tanks (e.g. sulphuric acid, sodium hypochlorite, sodium hydroxide). Chemicals used in smaller volumes (e.g. hydrazine) are stored in drums within dedicated, bunded chemical stores. The FGD plant uses limestone, which is stored in a dedicated building adjacent to the FGD plant area.
Wastes generated On-Site The principal wastes generated at the Drax site are as follows:
Pulverised Fuel Ash (PFA);
Furnace Bottom Ash (FBA);
Gypsum;
Water Treatment Plant sludge;
Construction waste;
Waste oil.
Waste water from surface roadway washings.
PFA is conditioned by the addition of water prior to transport by closed conveyor to the disposal facility known as Barlow Mound. A variable proportion of the PFA is also exported from the site for use in the construction industry. Barlow Mound has been developed in three stages, 1, 2a and 2b. A further Stage 3 is proposed which would extend the mound to the north. Barlow Mound is typically constructed as follows:
Topsoil is stripped and stockpiled;
A drainage layer of granular material is placed over the clayey silt soils. This was initially made up of furnace bottom ash but more recently blast furnace slag is imported to site for this purpose;
Up to 35m of PFA is then deposited over the drainage layer;
Subsoil and topsoil are then placed over the PFA. The topsoil is seeded and planted for subsequent grazing (forest areas).
A lateral drainage trench surrounds the mound. Surface water run-off/leachate entering this is either directed towards the main plant effluent (cooling water purge) discharge or to an ‘ecological lagoon’ where evaporation losses balance effluent inputs to the lagoon. Furnace bottom ash is held in ash pits prior to export off-site for use in the construction industry.
Stone & Webster URS Corporation Ltd
44354-002-734/JDWW/OM/ar 11th September 2003 Rpt01 Final Report
10
Water treatment plant sludges are dewatered and transported to the Barlow Mound for disposal within the PFA. Construction rubble at the site is presently disposed of within the Barlow Mound. It is understood that there are four locations within or adjacent to the site that were formerly licensed to receive construction rubble as part of the station development. Documentation reviewed from the site data room indicated that the construction rubble had the potential to include asbestos and hydrocarbon-contaminated soils. Gypsum is a bi-product of the FGD plant process. This is stored within a building adjacent to the FGD Plant, pending its export for use in the manufacture of plasterboard. Waste oil is collected within the oil water separator units and in drums elsewhere. Where possible, this is burnt within the boilers, residual waste oil is transported off-site for disposal.
Other On-Site substances of potential concern The previous study identified that an asbestos survey had been undertaken and a register of suspected asbestos-containing materials (ACMs) was kept on-site. The recent work therefore included an objective to assess the extent of liabilities associated with asbestos presence on the site. Polychlorinated Biphenyls (PCBs) were tested for in all of the 173 transformer units at the site in 1990/91. Seven units were found to contain PCBs at concentrations greater than 20 ppm. The oil in these units was replaced. An ongoing programme is understood to be underway to further reduce PCB content of dielectric oils at the site. Methanol was previously stored at the site for use in the production of hydrogen. However, this plant has subsequently been decommissioned and methanol is no longer stored on site.
Environmental Setting The site is in a flat-lying area within the flood plain of the River Ouse. The site and its environs are characterised by agricultural land drained by a network of ditches and dykes flowing northwards to discharge into the tidal reach of the River Ouse. Carr Dyke and Abbey Dyke pass through or adjacent to the site. Carr Dyke receives water from surface drains that are partly culverted beneath the site. The geological sequence beneath the site can be summarised as follows: • Made Ground : This is not indicated on the geological maps but is present (up to ~5m) in
relation to the sub-base for areas of hardstanding, the surrounds to underground services and for raising site levels prior to development;
• Vale of York Drift : This unit comprises an interbedded sequence (15 – 20m thick) of silts and clays with subordinate sand lenses;
• Sherwood Sandstone: This is a fine to medium-grained and variably cemented unit. It is described as weathered beneath the drift deposits to a red brown sand. Competent bedrock is typically encountered at a depth of 20 – 23m.
Groundwater occurs as follows beneath the site:

Stone & Webster URS Corporation Ltd
44354-002-734/JDWW/OM/ar 11th September 2003 Rpt01 Final Report
11
• As a shallow perched horizon within the made ground above the clay-dominated drift deposits. Groundwater at this level is localised and discontinuous, although the potential exists for at least continuity with, or drainage to, the various surface waters passing through the site;
• As localised water-bearing lenses within sandier beds in the Vale of York Drift;
• Within the Sherwood Sandstone bedrock (a Major Aquifer).
Legislative Framework UK Government Guidance for the assessment and clean-up of contaminated land has been published to support implementation of Section 57 of the Environment Act 1995. This guidance proposes the use of site-specific risk assessment to identify the need for and level of remedial work at a site given consideration to: • Protecting human health under a specific land-use scenario;
• preventing adverse impacts to “controlled waters”, that is both surface and groundwaters; and
• under certain circumstances, protecting ecological receptors.
The set of scenarios (or pollutant linkages) by which contamination at a given site can impact each of these ‘receptor’ groups is called a conceptual site model. This establishes potential sources of contamination, pathways by which the contamination may migrate and site-specific receptors at risk of impact. Presented below are the potential pollutant linkages considered to be of concern at Drax. These were used to develop the investigation strategy for this study.
Conceptual Site Model and Investigation Strategy
Potential Sources
Potential contaminant sources at the site included the following: • Bulk fuel/chemical storage and handling areas;
• A formerly unidentified waste disposal pit at the northern end of the site;
• Water treatment areas;
• Ash handling and disposal;
• Presence on site of Transformers known to have used, and incurred at least localised leakage of, oils containing PCBs; and
• Former on-site construction waste in landfill area with possible asbestos content.
Potential Pathways & Receptors
The environmental setting outlined above indicates the following potential contaminant migration pathways and receptors at the site;
Stone & Webster URS Corporation Ltd
44354-002-734/JDWW/OM/ar 11th September 2003 Rpt01 Final Report
12
• Vertical percolation of contaminants to impact shallow perched groundwater quality.
Lateral migration of perched waters to potentially impact water quality in adjacent surface water courses (drains or dykes);
• Vertical percolation of shallow groundwater through the drift deposits to impact water quality in the Sherwood Sandstone aquifer. Possible short-circuiting of this pathway via perforations of the clay drift by foundation piles;
• Lateral migration of dissolved phase contaminants within the sandstone aquifer towards the regional flow direction (south-west) or as locally-influenced by the on-site abstraction wells.
Given our understanding of the potential contaminant sources and pollutant linkages a sampling strategy (this investigation reported herein) was developed to target the potential pollutant linkages. These included the sampling of: • Surface water bodies in and in the vicinity of the site which could be impacted by
contaminants derived from overland flows, drainage or the inflow of potentially contaminated shallow groundwater;
• Shallow soils in the vicinity of potential sources such as oil/water interceptors, chemical and fuel storage ASTs or transformers known to have leaked oils containing PCBs;
• Impact to deeper groundwater by the downward migration of contaminants through the alluvial drift deposits to impact the aquifer groundwater present in the underlying sandstone bedrock.
The objectives of the investigation presented herein are summarised in the following section.
Stone & Webster URS Corporation Ltd
44354-002-734/JDWW/OM/ar 11th September 2003 Rpt01 Final Report
13
OBJECTIVES The specific objectives of the investigation presented herein were as follows: •
•
•
•
•
Combination and updating of the previous site survey issued by Dames & Moore, background information regarding recent site operations, results of the site walkover /staff interviews and information from proposed intrusive works, to update the conceptual site model (CSM). The CSM defines potential contaminant source, pathway and receptor relationships for the site;
Replication, and where appropriate supplementation, of the previous investigation to enable some comparison to be made against previous site conditions. An intrusive investigation and collection of soil and groundwater samples for subsequent laboratory analysis was therefore required, using as many existing wells as possible, and replacing wells which have been lost or destroyed in areas of concern. The sampling programme seeking to characterise contamination in potential source areas as defined by the CSM;
Assessment of the results of the analytical testing programme through performance of a generic quantitative risk assessment (QRA), comparing observed contaminant concentrations against generic Tier 1 standard concentrations. If the generic QRA suggests potential for significant contamination, then advice and cost estimates for a detailed (site-specific) QRA in line with UK government guidance should be provided;
Review current baseline information, registers, risk assessments and management plans for asbestos containing materials (ACMs) at Drax power station. This was to assess the extent of asbestos liabilities associated with the continued operation of the power station site, with particular reference to the new Regulation 4, Duty to Manage Asbestos included within the Control of Asbestos at Work Regulations (CAWR) 2002. The new Duty comes into force on 21 May 2004; and
An interpretative report summarising the findings of the investigation and risk assessment, identifying outstanding risks and liabilities associated with the site and providing an outline of potential remedial works (and costs) if required.
The scope of works to meet these objectives is described in the following section.
Stone & Webster URS Corporation Ltd
44354-002-734/JDWW/OM/ar 11th September 2003 Rpt01 Final Report
14
SCOPE OF WORKS
INTRODUCTION In order to meet the above objectives the following scope of works was developed: •
•
•
•
•
•
Task 1 - Preparatory Works;
Task 2a - Site works;
Task 2b - Asbestos System Review;
Task 3 - Laboratory Analysis;
Task 4 - Optional Quantitative Risk Assessment (QRA);
Task 5 - Data Assessment and Reporting.
A detailed description of these tasks is presented below.
TASK 1 – PREPARATORY WORKS This task included an initial site walkover to establish the precise location and current condition of existing sampling points, as well as interviewing Drax Power personnel concerning any issues relating to potential soil and groundwater contamination at the site. The URS Project Manager prepared a health and safety plan, including plans showing proposed drilling locations, which was forwarded to Drax to facilitate allocation of a work permit. The precise location of proposed supplementary drilling locations was finalised during a pre-intrusive works site visit, during which power station personnel confirmed the absence of underground services at proposed drilling locations. This task comprised the following key activities: • Issue of a site-specific Health & Safety Plan for the works conforming with Drax’s and
URS’s Health & Safety Policy and the legislative requirements;
• Preparation of Method Statements outlining the site works proposed;
• Site walkover conducted by Mr. Owen Mills of URS prior to mobilisation. This exercise identified proposed borehole locations and a selection of previously installed monitoring wells. Power station staff accompanied Mr. Mills to enable the safe siting of boreholes in relation to underground services or site operational constraints.
Prior to any intrusive excavations each location was assessed by the power station staff using available service plans and then scanned for the presence of underground services through the use of an electronic cable avoidance tool (CATSCAN). The appropriate paperwork/permit to work was then issued. Typically a hand-dug pit (to a depth of up to 1.5m) was required at most intrusive drilling locations as a further “screening” for any buried services.
Stone & Webster URS Corporation Ltd
44354-002-734/JDWW/OM/ar 11th September 2003 Rpt01 Final Report
15
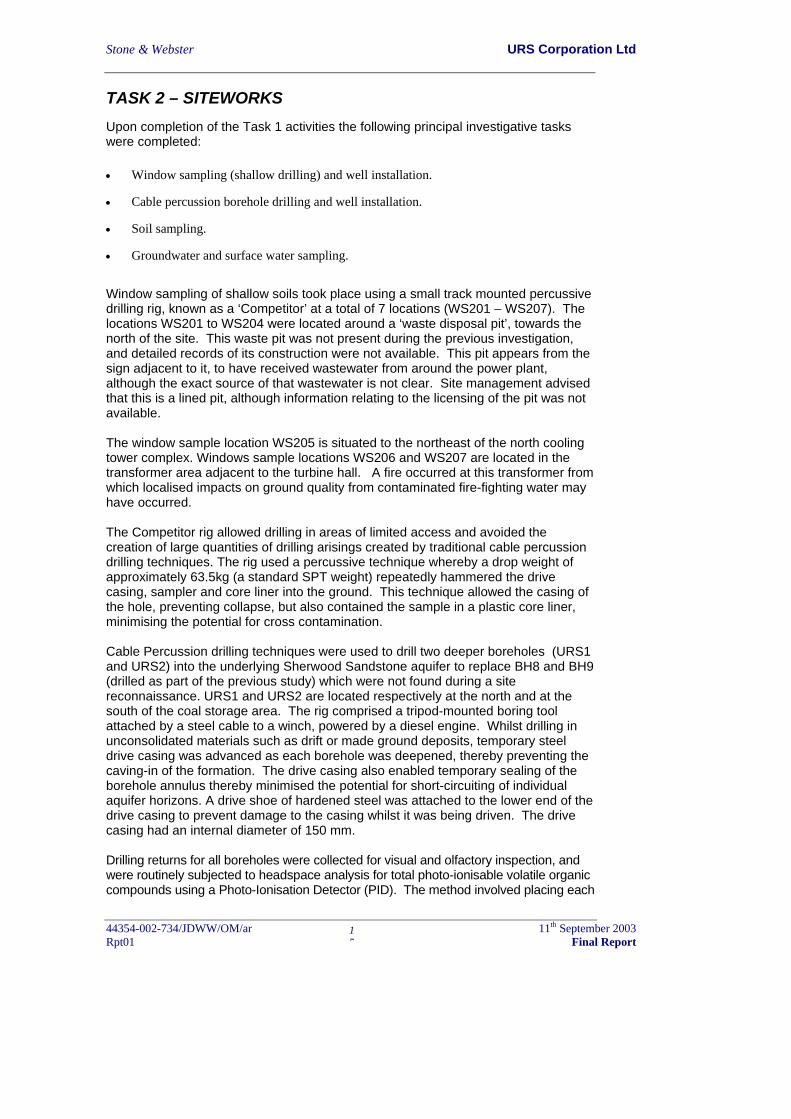
TASK 2 – SITEWORKS Upon completion of the Task 1 activities the following principal investigative tasks were completed: • Window sampling (shallow drilling) and well installation.
• Cable percussion borehole drilling and well installation.
• Soil sampling.
• Groundwater and surface water sampling.
Window sampling of shallow soils took place using a small track mounted percussive drilling rig, known as a ‘Competitor’ at a total of 7 locations (WS201 – WS207). The locations WS201 to WS204 were located around a ‘waste disposal pit’, towards the north of the site. This waste pit was not present during the previous investigation, and detailed records of its construction were not available. This pit appears from the sign adjacent to it, to have received wastewater from around the power plant, although the exact source of that wastewater is not clear. Site management advised that this is a lined pit, although information relating to the licensing of the pit was not available. The window sample location WS205 is situated to the northeast of the north cooling tower complex. Windows sample locations WS206 and WS207 are located in the transformer area adjacent to the turbine hall. A fire occurred at this transformer from which localised impacts on ground quality from contaminated fire-fighting water may have occurred. The Competitor rig allowed drilling in areas of limited access and avoided the creation of large quantities of drilling arisings created by traditional cable percussion drilling techniques. The rig used a percussive technique whereby a drop weight of approximately 63.5kg (a standard SPT weight) repeatedly hammered the drive casing, sampler and core liner into the ground. This technique allowed the casing of the hole, preventing collapse, but also contained the sample in a plastic core liner, minimising the potential for cross contamination. Cable Percussion drilling techniques were used to drill two deeper boreholes (URS1 and URS2) into the underlying Sherwood Sandstone aquifer to replace BH8 and BH9 (drilled as part of the previous study) which were not found during a site reconnaissance. URS1 and URS2 are located respectively at the north and at the south of the coal storage area. The rig comprised a tripod-mounted boring tool attached by a steel cable to a winch, powered by a diesel engine. Whilst drilling in unconsolidated materials such as drift or made ground deposits, temporary steel drive casing was advanced as each borehole was deepened, thereby preventing the caving-in of the formation. The drive casing also enabled temporary sealing of the borehole annulus thereby minimised the potential for short-circuiting of individual aquifer horizons. A drive shoe of hardened steel was attached to the lower end of the drive casing to prevent damage to the casing whilst it was being driven. The drive casing had an internal diameter of 150 mm.
Drilling returns for all boreholes were collected for visual and olfactory inspection, and were routinely subjected to headspace analysis for total photo-ionisable volatile organic compounds using a Photo-Ionisation Detector (PID). The method involved placing each
Stone & Webster URS Corporation Ltd
44354-002-734/JDWW/OM/ar 11th September 2003 Rpt01 Final Report
16
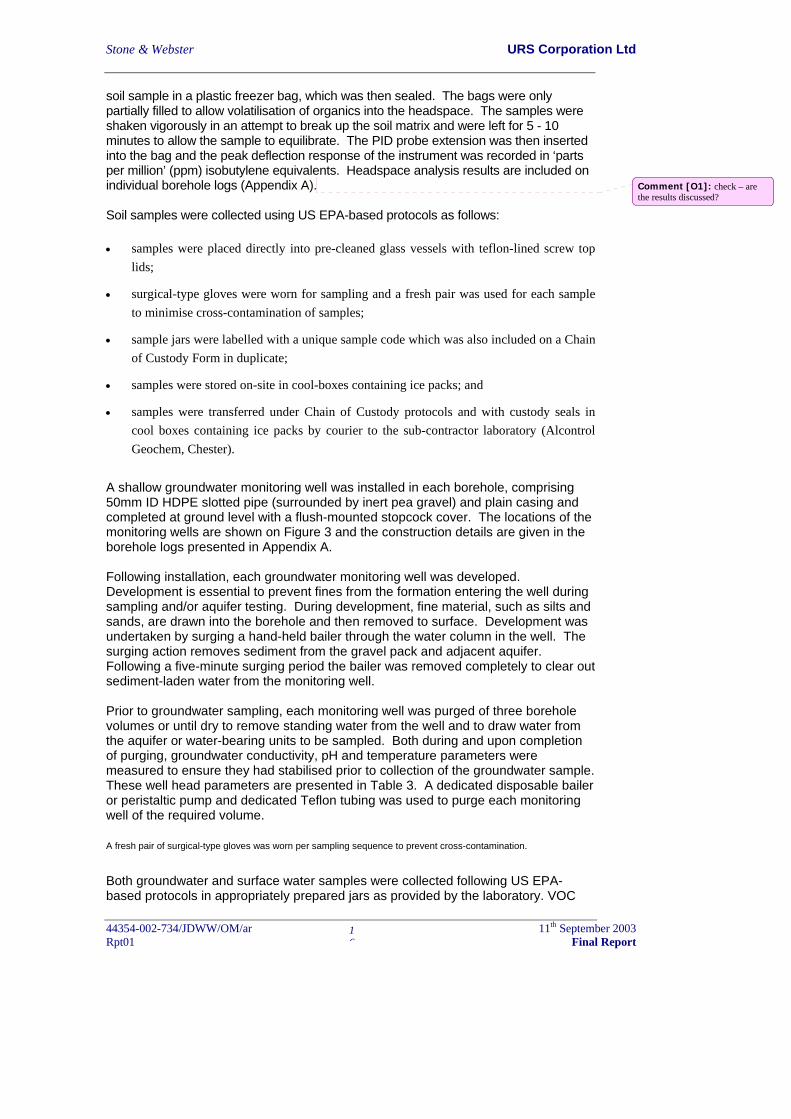
soil sample in a plastic freezer bag, which was then sealed. The bags were only partially filled to allow volatilisation of organics into the headspace. The samples were shaken vigorously in an attempt to break up the soil matrix and were left for 5 - 10 minutes to allow the sample to equilibrate. The PID probe extension was then inserted into the bag and the peak deflection response of the instrument was recorded in ‘parts per million’ (ppm) isobutylene equivalents. Headspace analysis results are included on individual borehole logs (Appendix A). Soil samples were collected using US EPA-based protocols as follows: • samples were placed directly into pre-cleaned glass vessels with teflon-lined screw top
lids;
• surgical-type gloves were worn for sampling and a fresh pair was used for each sample to minimise cross-contamination of samples;
• sample jars were labelled with a unique sample code which was also included on a Chain of Custody Form in duplicate;
• samples were stored on-site in cool-boxes containing ice packs; and
• samples were transferred under Chain of Custody protocols and with custody seals in cool boxes containing ice packs by courier to the sub-contractor laboratory (Alcontrol Geochem, Chester).
A shallow groundwater monitoring well was installed in each borehole, comprising 50mm ID HDPE slotted pipe (surrounded by inert pea gravel) and plain casing and completed at ground level with a flush-mounted stopcock cover. The locations of the monitoring wells are shown on Figure 3 and the construction details are given in the borehole logs presented in Appendix A. Following installation, each groundwater monitoring well was developed. Development is essential to prevent fines from the formation entering the well during sampling and/or aquifer testing. During development, fine material, such as silts and sands, are drawn into the borehole and then removed to surface. Development was undertaken by surging a hand-held bailer through the water column in the well. The surging action removes sediment from the gravel pack and adjacent aquifer. Following a five-minute surging period the bailer was removed completely to clear out sediment-laden water from the monitoring well. Prior to groundwater sampling, each monitoring well was purged of three borehole volumes or until dry to remove standing water from the well and to draw water from the aquifer or water-bearing units to be sampled. Both during and upon completion of purging, groundwater conductivity, pH and temperature parameters were measured to ensure they had stabilised prior to collection of the groundwater sample. These well head parameters are presented in Table 3. A dedicated disposable bailer or peristaltic pump and dedicated Teflon tubing was used to purge each monitoring well of the required volume.
A fresh pair of surgical-type gloves was worn per sampling sequence to prevent cross-contamination.
Both groundwater and surface water samples were collected following US EPA-based protocols in appropriately prepared jars as provided by the laboratory. VOC
Comment [O1]: check – are the results discussed?
Stone & Webster URS Corporation Ltd
44354-002-734/JDWW/OM/ar 11th September 2003 Rpt01 Final Report
17
vials were inverted and tapped to ensure no air bubbles were present. Sample storage and transfer under Chain of Custody conditions was followed as outlined above for the soil samples. The ground level of each of the monitoring wells installed during this investigation was surveyed to allow the relative heights of every borehole installation to be ascertained. In conjunction with measurements of depth to groundwater this was then used to assess the direction of groundwater flow. The well head and water table elevation data is presented in Table 3.
Task 2a – Absestos liability review Andy Johnson, an experienced URS asbestos specialist, undertook a review of the asbestos management system documentation and electronic data management systems developed and maintained by the site. A significant quantity of baseline data on the nature, location and extent of ACMs had been gathered over a number of years, and this information was reviewed using a sampling approach to assess its completeness, and checked by means of representative inspections of existing ACM installations. In addition, the site’s approach to risk assessments and management plans for known, strongly presumed or presumed ACMs was reviewed to assess current standards against the new Regulation 4, Duty to Manage Asbestos within the CAWR 2002, which comes into force on 21 May 2004. URS also took into account relevant Approved Codes of Practice for asbestos, including ‘The management of asbestos in non-domestic premises’, Ref. L127, 2002.
TASK 3 - LABORATORY ANALYSIS The analytical testing of the soil, groundwater and surface water samples was undertaken under sub-contract to Alcontrol Geochem, Chester. Alcontrol Geochem is UKAS accredited and meets the requirements of URS’s Laboratory Quality Management System. The sampling schedules are presented in Tables 1 and 2. Section 5 presents the results of the laboratory analysis.
Tasks 4 & 5 – assessment and reporting The reporting timetable for this work did not include the time required to complete a quantitative risk assessment (Task 4: QRA) and in general, this is not required for the typically low concentrations of contaminants identified at the site. However, Section 8 discusses requirements for QRA in the context of the results recorded from this investigation. Following the completion of the above tasks (with the exception of the QRA), this report presents the methodology, results, conclusions and recommendations arising from this investigation (Task 5).
Stone & Webster URS Corporation Ltd
44354-002-734/JDWW/OM/ar 11th September 2003 Rpt01 Final Report
18
INVESTIGATION RESULTS
INTRODUCTION This section presents the results of the investigation. Specifically, it includes a description of: • Site geology and hydrogeology;
• Site observations and testing; and
• Laboratory results.
A comparison of results against the previous report is made at the end of this section.
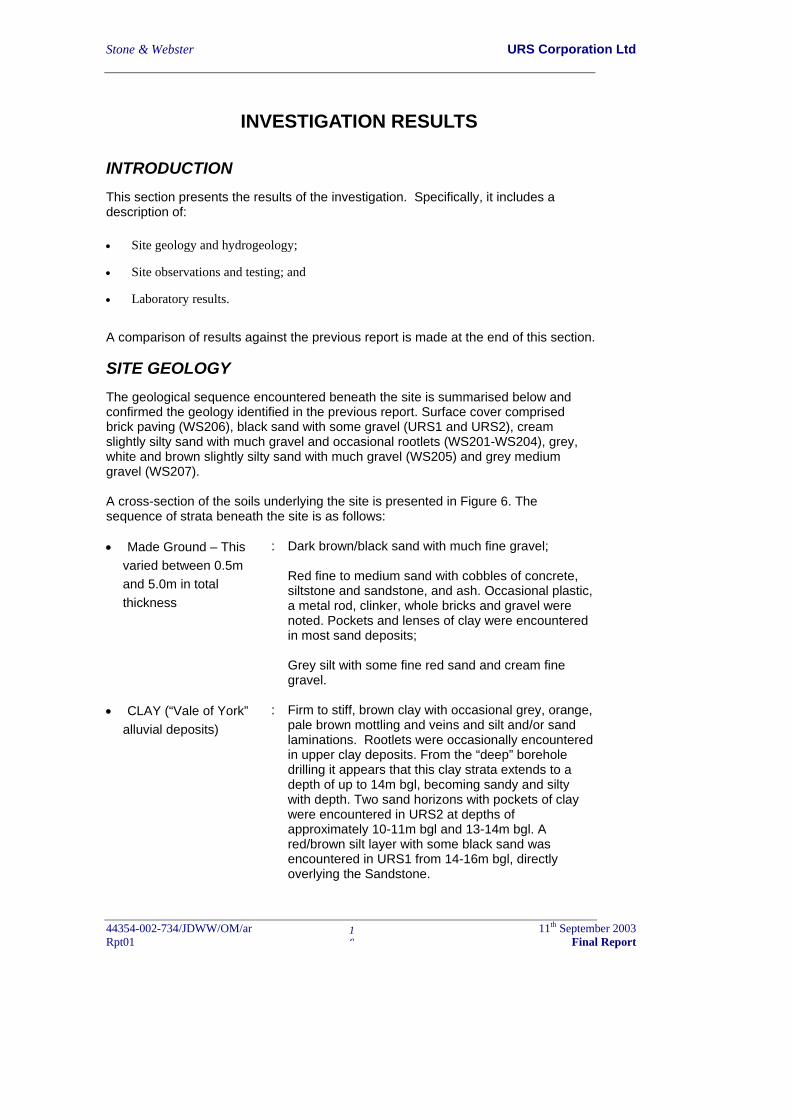
SITE GEOLOGY The geological sequence encountered beneath the site is summarised below and confirmed the geology identified in the previous report. Surface cover comprised brick paving (WS206), black sand with some gravel (URS1 and URS2), cream slightly silty sand with much gravel and occasional rootlets (WS201-WS204), grey, white and brown slightly silty sand with much gravel (WS205) and grey medium gravel (WS207). A cross-section of the soils underlying the site is presented in Figure 6. The sequence of strata beneath the site is as follows: • Made Ground – This
varied between 0.5m and 5.0m in total thickness
: Dark brown/black sand with much fine gravel; Red fine to medium sand with cobbles of concrete, siltstone and sandstone, and ash. Occasional plastic, a metal rod, clinker, whole bricks and gravel were noted. Pockets and lenses of clay were encountered in most sand deposits; Grey silt with some fine red sand and cream fine gravel.
• CLAY (“Vale of York” alluvial deposits)
: Firm to stiff, brown clay with occasional grey, orange, pale brown mottling and veins and silt and/or sand laminations. Rootlets were occasionally encountered in upper clay deposits. From the “deep” borehole drilling it appears that this clay strata extends to a depth of up to 14m bgl, becoming sandy and silty with depth. Two sand horizons with pockets of clay were encountered in URS2 at depths of approximately 10-11m bgl and 13-14m bgl. A red/brown silt layer with some black sand was encountered in URS1 from 14-16m bgl, directly overlying the Sandstone.
Stone & Webster URS Corporation Ltd
44354-002-734/JDWW/OM/ar 11th September 2003 Rpt01 Final Report
19
• Bedrock
- Sherwood Sandstone bedrock is indicated by geology maps for the area as underlying drift deposits at the site. From observations during the “deep” borehole drilling (URS1 & URS2) the top of the Sandstone was encountered between 14.0m bgl (URS2) and 16.0m bgl (URS1).
SITE HYDROGEOLOGY
Shallow Groundwater
Shallow groundwater was encountered within the Made Ground, above the alluvial clay deposit. This water table was encountered in WS205 only. Its presence is understood to be discontinuous across the site, although it may be in hydraulic continuity with shallow groundwater encountered in clay deposits. Water levels were recorded approximately two days following completion of the drill works, allowing the groundwater within the wells to stabilise and reach equilibrium. The water levels measured in shallow monitoring wells relative to Ordnance Datum are given in Table 3 and are illustrated by Figure 4. Water level measurements across the site ranged from 0.600m AOD (metres Above Ordnance Datum) (WS201) to 4.658m AOD (WS131). The groundwater levels measured in the “shallow” (window sample) monitoring wells indicate a “general” flow direction towards the northeast. This would suggest shallow groundwater flow towards the natural discharge via streams that feed the River Ouse. Previous interpretations of the shallow groundwater flow direction were masked by shallow sub-surface features (foundations etc).
Deep Groundwater
Underlying the Made Ground the stiff alluvial clay deposit was typically observed to be dry during drilling. However, some localised and relatively minor inflows of water were observed within this clay unit in WS206 (damp pockets encountered in clay between 4.5-5.0m bgl). ‘Damp’ to ‘wet’ soils are described in the deep borehole, URS2, at depths below 13.5m bgl. Major inflows occurred once the sandstone was encountered beneath ~14m. The deeper boreholes were screened so as to establish water levels and water quality at the top of the sandstone only. These show that the overlying drift confines the Sherwood Sandstone aquifer, which has rest water levels at between 8-13m below ground level (i.e. above the top of the formation). Deeper groundwater level measurements (also presented in Figure 5) ranged from -4.088m AOD (BH6) to -8.649m AOD (URS2). Water levels in the aquifer have fallen by between 1.5 and 2.0m since 1978. This is likely to be due to on-site abstraction boreholes. The Sherwood Sandstone is regarded as a major aquifer of regional significance. Groundwater from this unit is abstracted from two 105m deep on-site boreholes for boiler water make-up. Regionally there are a number of other abstractions from this unit for both industrial and potable supply. Regional groundwater flow in the Sherwood Sandstone is understood to be towards the southwest towards two groups of abstraction wells, some 3 km from the site. The effect of on-site abstractions on the groundwater flow regime beneath the site is discussed below
Stone & Webster URS Corporation Ltd
44354-002-734/JDWW/OM/ar 11th September 2003 Rpt01 Final Report
20
The groundwater levels measured in the “deep” monitoring wells (Figure 5) indicate a flow direction towards the southwest and a “depression” in the groundwater elevation as a result of the impact of the on-site abstraction boreholes located in this part of the site. These inferred groundwater contours suggest ‘capture’ by the on-site abstractions of all deep groundwater passing beneath the site.
SITE OBSERVATIONS AND TESTING During the drilling of the shallow window sample boreholes no visual or olfactory evidence of contamination was observed with the exception of the following: • WS207 adjacent to the transformer (hydrocarbon odour and black staining
noted between 4.8 and 4.9m bgl).
With the exception of a PID response of 70.7 ppm at WS207 (4.85m), no other PID responses were recorded during the regular headspace testing at each shallow drilling location across the site. Slightly elevated PID readings were detected in the deeper boreholes, although no visual or olfactory signs of contamination were noted. A maximum PID reading of 36.9ppm was recorded at 2.0m bgl in URS1 and concentrations generally decreased with depth. Slightly elevated PID responses were also noted in URS2, although they were noted in soils at depths in excess of 6.5m bgl. A maximum reading of 61ppm was recorded at 8.0m bgl.
LABORATORY RESULTS
Introduction
Soil, surface waters and groundwater samples were analysed for the following determinands as detailed in Tables 1 and 2. • Volatile Organic Compounds (VOCs)
• PolyAromatic Hydrocarbons (PAHs)
• Polychlorinated Biphenyls (PCBs)
• Total Petroleum Hydrocarbons – Diesel Range Organics (DRO) & Petroleum Range Organics (PRO)
• Metals (arsenic, boron, copper, chromium, cadmium, lead, mercury, nickel, selenium and zinc)
• Major Ions (sulphate, chloride, ammoniacal nitrogen, iron, manganese, calcium, total oxidised nitrogen (TON), potassium, magnesium and sodium).
In order to carry out a generic Quantitative Risk Assessment (QRA), concentrations of contaminants in soil and groundwater are compared against Tier 1 (generic) screening criteria.
Stone & Webster URS Corporation Ltd
44354-002-734/JDWW/OM/ar 11th September 2003 Rpt01 Final Report
21
Soils Analysis Results
At the time of writing this report, there are only a limited number of generic assessment criteria (Tier 1 levels) for soils for the UK. Tier 1 levels are used to benchmark measured concentrations of contaminants against, to determine whether there is a potential risk of harm to human health and/or the environment. Recent changes to legislation require that generic screening criteria be developed using a specific standard site scenario. Although URS is in the process of developing new Tier 1 screening levels, using the complex algorithms available in the CLEA documentation1, this process is unlikely to be complete until later in 2003. Therefore, in the interim, a combination of existing Soil Guideline Values (SGVs) and Dutch screening values are used. The Dutch criteria designates a level above which in the Netherlands, a fully quantitative site-specific risk assessment is required to decide whether some form of remediation is required. In the absence of a locally designated standards framework, contamination investigations in Europe have commonly used the Dutch guidelines as an initial benchmark. The Dutch criteria are based on the premise of multi-functional land-use. As such, they are considered to be appropriately conservative for an initial appraisal of ground conditions at an industrial site such as Drax. The remedial trigger or ‘Intervention’ criteria are commonly required to be adjusted on a site-specific basis to account for the natural organic carbon and clay mineral content of the soils. Where SGVs or Dutch screening criteria are unavailable for certain contaminants, URS also refers to the USEPA Region 9 screening criteria. These are referenced throughout the following text as appropriate; the screening criteria are also included on the relevant tables at the end of this report.
Volatile Organic Compounds (VOCs)
A total of 10 soil samples were analysed for the suite of 61 target VOC compounds. As illustrated by Table 4, all of the soil results for VOCs were below the laboratory detection limit of 0.001mg/kg.
Polyaromatic Hydrocarbon (PAH)
A total of 10 soil samples were analysed for the suite of 16 target PAH compounds. As illustrated by Table 5, all of the soil results for PAHs were above the laboratory detection limit of 0.001 mg/kg The highest total PAH concentrations were detected in WS206 (0.5-0.6m bgl) and WS207 (0.3-0.4m bgl) at 5.12mg/kg and 3.724mg/kg respectively. The benzo(a)pyrene concentration (0.435mg/kg) detected in WS206 (0.5-0.6m bgl) was the only PAH concentration to exceed available screening criteria. The USEPA Region 9 (Industrial) screening level is 0.211mg/kg.
Total Petroleum Hydrocarbon (TPH)
A total of 12 soil samples were analysed for Diesel Range Organics (DRO) and Petroleum Range Organics (PRO). The results of these analyses are given in Table 6. They can be summarised as follows: • At WS206 (0.5-0.6m bgl) a DRO concentration of 108mg/kg was detected and at
WS106 (1.7-1.8m bgl) a DRO concentration of 166mg/kg was reported;
• At WS207 (0.3-0.4m bgl) a DRO concentration of 8,743mg/kg was reported and at a depth of 4.8-4.9m bgl in WS207 a DRO concentration of 5,947mg/kg was detected. Both
1 Contaminated Land Exposure Assessment model
Stone & Webster URS Corporation Ltd
44354-002-734/JDWW/OM/ar 11th September 2003 Rpt01 Final Report
22
concentrations were above the adjusted Dutch Intervention Value (aDIV) for Total TPH of 1,250mg/kg;
• The rest of the soils results for TPH-DRO were below 100mg/kg;
• At WS207 (0.3-0.4m bgl) a PRO concentration of 21.5mg/kg was detected;
• The rest of the soil results for TPH-PRO were below method detection limits.
Polychlorinated Biphenyl (PCB)
A total of 10 soil samples were analysed for the target Aroclors for PCB compounds. The results of these analyses are presented in Table 7. They can be summarised as follows: • At WS206 (0.5-0.6m bgl) a total PCB concentration of 0.531mg/kg was detected,
exceeding the aDIV of 0.25mg/kg. However, applying the screening criteria (USEPA R9 (Industrial)) for individual PCBs of 0.744mg/kg, the concentration detected in WS206 would be classified below the limit;
• At WS207 (0.3-0.4m bgl) a total PCB concentration of 0.106mg/kg was detected;
• The rest of the soils results for PCBs were below the laboratory detection limit of 0.001mg/kg.
Heavy Metals
A total of 10 soil samples were analysed for a suite of metals. The results of these analyses (Table 8) were as follows: • Mercury was not reported above method detection limits in any soil samples submitted
for analysis;
• Cadmium, selenium and boron were detected at either low concentrations or were below method detection limits;
• Arsenic, copper, chromium, lead, nickel and zinc were reported in the majority of samples at concentrations above method detection limits and below available screening criteria.
Major Ions
A total of eight soil samples were analysed for a suite of major ions (sulphate, chloride, ammoniacal nitrogen, iron, manganese, calcium, total oxidised nitrogen (TON), potassium, magnesium and sodium). Many of these ions do not have Tier 1 screening levels, the purpose of their analysis being primarily to understand soil or groundwater chemistry in the event of plume identification, especially since it is difficult to identify sources of (e.g.) ammoniacal nitrogen or total oxidised nitrogen on the site. The results of these analyses (Table 9) were as follows:
Stone & Webster URS Corporation Ltd
44354-002-734/JDWW/OM/ar 11th September 2003 Rpt01 Final Report
23
• TON was not reported above the method detection limits of 1mg/kg in any soil samples submitted for analysis;
• All other major ions were detected at concentrations greater than method detection limits;
• Calcium concentrations ranged between 855mg/kg (WS201 0.5-0.65m bgl) and 22,940mg/kg (WS203 1.7-1.8m bgl);
• Iron concentrations ranged between 9,221mg/kg (WS201 0.5-0.65m bgl) and >32,000 (WS201 1.4-1.6m bgl, WS202 1.0-1.2m bgl, WS203 0.8-1.0m bgl, WS203 1.7-1.8m bgl and WS204 1.3-1.5m bgl);
• Magnesium concentrations ranged between 984mg/kg (WS202 0.4-0.6m bgl) and 11,855mg/kg (WS201 1.4-1.6m bgl);
• Manganese concentrations ranged between 146mg/kg (WS204 0.5-0.7m bgl) and 724mg/kg (WS204 1.3-1.5m bgl);
• Sulphate concentrations ranged between 179mg/kg (WS201 0.5-0.65m bgl) and 895mg/kg (WS201 1.4-1.6m bgl);
• Chloride concentrations ranged between 25mg/kg (WS203 0.8-1.0m bgl, WS203 1.7-1.8m bgl and WS204 0.5-0.7m bgl) and 85mg/kg (WS201 1.4-1.6m bgl);
• Potassium concentrations ranged between 44mg/kg (WS201 1.4-1.6m bgl) and 1,113mg/kg (WS204 1.3-1.5m bgl);
• Sodium concentrations ranged between 170mg/kg (WS201 0.5-0.65m bgl) and 839mg/kg (WS202 1.0-1.2m bgl);
• Alkalinity concentrations ranged between 18mg/kg (WS203 0.8-1.0m bgl) and 138mg/kg (WS201 1.4-1.6m bgl); and
• Ammoniacal nitrogen concentrations ranged between 2.6mg/kg (WS203 1.7-1.8m bgl) and 29mg/kg (WS204 1.3-1.5m bgl).
Elevated concentrations may not solely be attributable to site processes and activities. Slightly elevated concentrations of some of these species may be partly attributable to site processes, although further investigation would be required to confirm or discount this.
Groundwater and Surface Water Analysis Results
In the following discussion of water analysis results from this investigation, use is made of the UK or WHO Drinking Water Standards (UK DWS or WHO DWS) as well as the Environmental Quality Standards for fresh water for Tier 1 screening criteria. The Tier 1 levels are shown on the appropriate tables at the end of this report.
Volatile Organic Compounds (VOC)
The following water samples were analysed for the VOC compounds; a total of eleven samples from the window sample boreholes (WS), a total of four surface
Stone & Webster URS Corporation Ltd
44354-002-734/JDWW/OM/ar 11th September 2003 Rpt01 Final Report
24
water samples and two “deep” groundwater samples. A duplicate sample was also taken from a window sample location. As illustrated by Table 10, all of the groundwater and surface water results for VOCs were below the laboratory detection limit of 1µg/l.
Polyaromatic Hydrocarbon (PAH)
The following water samples were analysed for the PAH compounds; a total of 18 samples from the window sample boreholes (WS), a total of 4 surface water samples and a further 4 “deep” groundwater samples. A duplicate sample was also taken from a window sample location. As illustrated by Table 11, all of the waters results for PAHs were close to or below the laboratory detection limit of 1 µg/l PAH compounds detected in waters. The maximum concentration reported was 5.753 µg/l Naphthalene in the shallow groundwater from borehole WS201 and 3.01 µg/l Naphthalene in the deep groundwater from borehole BH5. This and the other trace levels detected were below their respective drinking water guidelines.
Total Petroleum Hydrocarbons
The following water samples were analysed for the Diesel Range Organics (DRO) compounds; a total of 19 samples from the window sample boreholes (WS), a total of 7 surface water samples and a further 5 “deep” groundwater samples. The UK drinking water guideline2 for petroleum hydrocarbons is 10 µg/l. This value was based upon the effects of taste and odour rather than toxicological concerns. A drinking water standard calculated to account for toxicological effects through use of World Health Authority methodology would give a value in the order of 100 µg/l. In considering which value to use for screening the Drax data, the industrial nature of the Drax site, the high degradation potential for these compounds in the natural environment and the distance to public water supply boreholes should be accounted for. URS have used the screening value of 100 µg/l to flag potential issues for TPH in groundwater. As illustrated by Table 12 the water results for DRO compounds can be summarised as follows: • At the surface water SW6 (close to the Drax Abbey Farm) DRO concentrations across
the C10 – C16 range were detected at a concentration of 155 µg/l. This is above the screening standard for Mineral Oil compounds in waters which is set at 100 µg/l;
• At “deep” BH5 (located at the north of the ash mound) DRO concentrations across the C10 – C16 range were detected at a total concentration of 292 µg/l. This is above the screening standard for Mineral Oil compounds in waters set at 100 µg/l. This has been identified as Diesel;
• At WS116 (adjacent to the southern oil/water separator) DRO concentrations across the C10 – C16 range were detected at a concentration of 449 µg/l. This is above the screening standard for Mineral Oil compounds in water, which is set at 100 µg/l. This has been identified as Diesel;
2 Water Supply (Water Quality) Regulations 1989 as amended by 2000 Regulations
Stone & Webster URS Corporation Ltd
44354-002-734/JDWW/OM/ar 11th September 2003 Rpt01 Final Report
25
• At WS119 (West of the South cooling tower complex) DRO concentrations across the C10 – C16 range were detected at a concentration of 801 µg/l. This is above the screening standard for Mineral Oil compounds in water, which is set at 100 µg/l. This has been identified as Diesel;
• At WS121 (North of the south cooling tower complex) DRO concentrations across the C10 – C16 range were detected at a concentration of 533 µg/l. This is above the screening standard for Mineral Oil compounds in water, which is set at 100 µg/l. This has been identified as Diesel;
• At WS122 (East of the turbine hall) DRO concentrations across the C10 – C16 range were detected at a concentration of 210 µg/l. This is above the screening standard for Mineral Oil compounds in water, which is set at 100 µg/l. This has been identified as kerosene type residues;
• The rest of the results for TPH - DROs in the surface waters as well as in both “deep” and within shallow groundwater (window sample wells) were either below the laboratory detection limits or below the screening standard for Mineral Oil compounds in waters which is set at 100 µg/l;
The concentrations of TPH - PRO compounds in the surface water samples as well as in both “deep” and within shallow groundwater (window sample wells) were below the laboratory detection limits (or under the screening standard for Mineral Oil compounds in waters).
Polychlorinated Biphenyl (PCB)
The following water samples were analysed for the PCB compounds; a total of 13 samples from the window sample boreholes (WS), a total of 4 surface water samples and a further 4 “deep” groundwater samples. As illustrated by Table 13 the water results for PCB compounds can be summarised as follows: • The results for PCBs in both “deep” and within shallow groundwater (window sample
wells) were below the laboratory detection limits;
• The concentrations of PCB compounds in the surface water samples were similarly below the laboratory detection limits.
Heavy Metals
The following water samples were analysed for metals compounds; a total of 20 samples from the window sample boreholes (WS), a total of 4 surface water samples and a further 5 “deep” groundwater samples. As illustrated by Table 14 the water results for metals compounds can be summarised as follows (the exceedences of UK DWS, in the shallow and deep groundwater and surface water samples, applied to concentrations of Arsenic, Cadmium, Chromium, Nickel, Selenium and Boron):
Stone & Webster URS Corporation Ltd
44354-002-734/JDWW/OM/ar 11th September 2003 Rpt01 Final Report
26
• A concentration of 47 μg/l of Arsenic at WS105, 12 μg/l of Arsenic at WS122 and 12
μg/l of Arsenic at SW3 marginally exceeded the UK DWS of 10 μg/l for this metal.
• A concentration of 12.8 μg/l of Cadmium at WS105, 41.3 μg/l of Cadmium at SW3 and
6.9 μg/l of Cadmium at SW7 marginally exceeded the UK DWS of 5 μg/l for this metal.
• A concentration of 53 μg/l of Chromium at WS131 marginally exceeded the UK DWS of
50 μg/l for this metal.
• A concentration of 107 μg/l of Nickel at WS105, 32 μg/l of Nickel at WS116, 107 μg/l
of Nickel at WS125 and 27 μg/l of Nickel at SW4 marginally exceeded the UK DWS of
20 μg/l for this metal.
• A concentration of 229 μg/l of Selenium at WS105, 10 μg/l of Selenium at WS125 and
14 μg/l of Selenium at SW3 marginally exceeded the UK DWS of 10 μg/l for this metal.
• Similarly, Boron concentrations of 26590 μg/l in WS105, 12620 μg/l in SW3, and 2139
μg/l in SW7 exceed the UK DWS for Boron set at 1000 μg/l;
Elevated metal concentrations may not solely be attributable to site processes and activities. Slightly elevated concentrations of arsenic and localised elevated concentrations of nickel and boron may be partly attributable to site processes, although further investigation would be required to confirm or discount this.
Major Ions
The following water samples were analysed for Major Ions; a total of 13 samples from the window sample boreholes (WS), a total of 4 surface water samples and a further 4 “deep” groundwater samples. As illustrated by Table 15 the major ions detected in waters can be summarised as follows: • The UK DWS for Iron of 200 μg/l was exceeded at WS105 (559 μg/l), at WS203 (320
μg/l), at URS2 (250 μg/l) and SW4 (388 μg/l);
• The UK DWS for Manganese of 50 μg/l was exceeded at WS105 (1067 μg/l), at WS111
(1984 μg/l), at WS113 (4817 μg/l), at WS117 (443 μg/l), at WS201 (499 μg/l) at WS202
(209μg/l), at WS105 (1067 μg/l), at WS203 (155 μg/l), at WS205 (112 μg/l), at WS206
(113 μg/l), at URS2 (839 μg/l), at BH5 (296 μg/l), at BH6 (292 μg/l), at BH7 (346 μg/l),
at SW3 (7320 μg/l) and at SW4 (310μg/l);
• The UK DWS for Chloride of 250,000 μg/l was exceeded at WS105 (15,673,000 μg/l),
at WS131 (505,000 μg/l) and at BH6 (355,000 μg/l);
• The UK DWS for Sodium of 200,000 μg/l was exceeded at WS113 (201,000 μg/l), at
WS201 (237,000 μg/l), at WS202 (252,000 μg/l), at WS203 (282,000 μg/l), at WS206
Stone & Webster URS Corporation Ltd
44354-002-734/JDWW/OM/ar 11th September 2003 Rpt01 Final Report
27
(237,000 μg/l) at WS207 (252,000μg/l), at SW3 (435,000 μg/l) and at SW7 (231,000
μg/l);
• The UK DWS for Ammonium Nitrogen of 500 μg/l was exceeded at WS105 (1100 μg/l),
at WS131 (500 μg/l), at WS201 (700 μg/l), at BH7 (800 μg/l) and at SW7 (500 μg/l);
• Calcium, in the shallow and deep groundwater and surface water samples, have been found in concentrations ranging from 21.6 mg/l (WS122) to 9,226 mg/l (WS105);
• Magnesium, in the shallow and deep groundwater and surface water samples, have been found in concentrations ranging from 4.89 mg/l (WS207) to 309.7 mg/l (WS105);
• Sulphate in the shallow and deep groundwater and surface water samples, have been found in concentrations ranging from 11 mg/l (WS122) to 3862 mg/l (WS105);
• Total Oxidised Nitrogen, in the shallow and deep groundwater and surface water samples, have been found in many samples under the detection limit (<0.3 mg/l) The maximum concentration was found in SW4 at 44.8 mg/l;
• Potassium has been found in concentrations ranging from 0.6 mg/l (URS2) to 487.5 mg/l (SW3);
• Finally, the highest alkalinity rate has been found at 14,000 mg/l in WS111.
Elevated ion concentrations have been detected in surface waters entering the site so that the results may not necessarily reflect the consequences of site processes and operations.
Data Comparison
Laboratory results from groundwater and surface waters samples analysed in 2000 have been compared to the current analytical data. The following sections summarise the main differences noted between the data sets.
VOCs
Several VOCs (including BTEX and chlorinated solvents) were detected slightly above Method Detection Limits (MDLs) in groundwater samples from WS116, WS125 and WS134 analysed in 2000. VOCs were not reported above MDLs in any groundwater or surface water samples analysed in 2003.
PAH
PAH concentrations were not reported above MDLs in surface water samples analysed in 2000. However several compounds were detected at low concentrations in a surface water sample (SW5) analysed in 2003. Analytical results from 2000 identified several PAHs at low concentrations in groundwater from WS111, WS116 and BH7. Analysis undertaken in 2003 reported an increase in the number of compounds detected, an increase in concentrations, and compounds were detected in more samples.
Comment [O2]: check
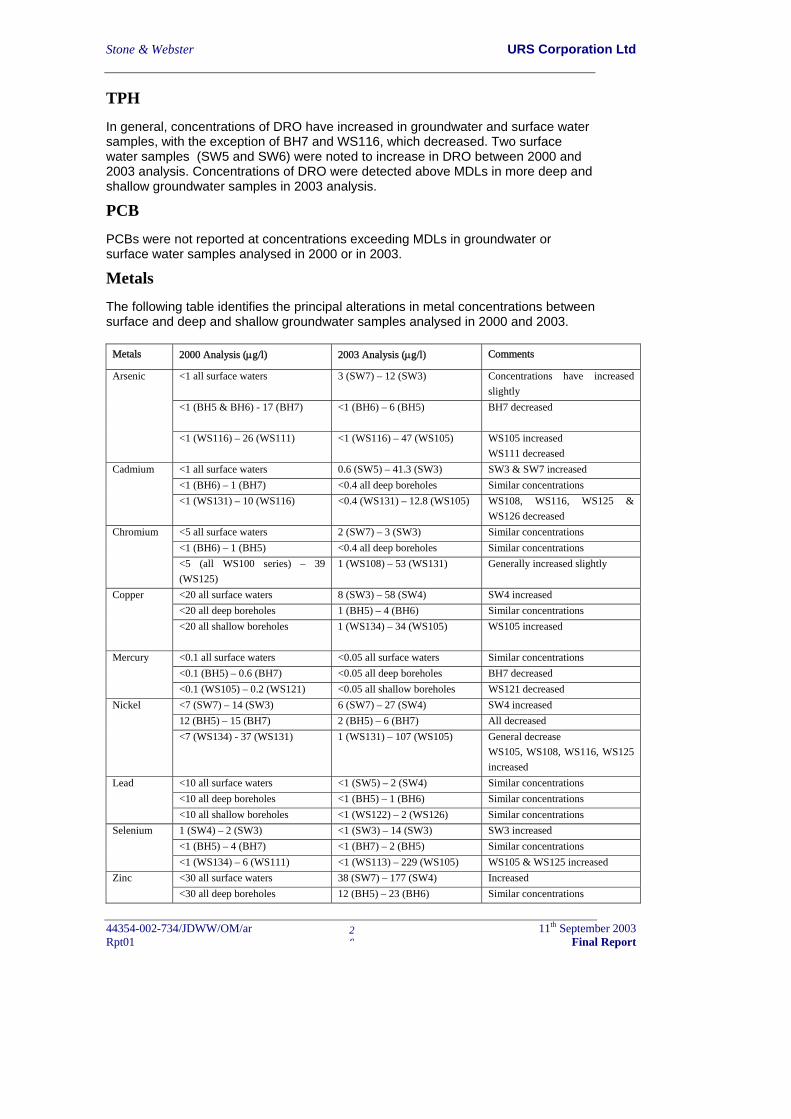
Stone & Webster URS Corporation Ltd
44354-002-734/JDWW/OM/ar 11th September 2003 Rpt01 Final Report
28
TPH
In general, concentrations of DRO have increased in groundwater and surface water samples, with the exception of BH7 and WS116, which decreased. Two surface water samples (SW5 and SW6) were noted to increase in DRO between 2000 and 2003 analysis. Concentrations of DRO were detected above MDLs in more deep and shallow groundwater samples in 2003 analysis.
PCB
PCBs were not reported at concentrations exceeding MDLs in groundwater or surface water samples analysed in 2000 or in 2003.
Metals
The following table identifies the principal alterations in metal concentrations between surface and deep and shallow groundwater samples analysed in 2000 and 2003.
Metals 2000 Analysis (μg/l) 2003 Analysis (μg/l) Comments
<1 all surface waters 3 (SW7) – 12 (SW3) Concentrations have increased slightly
<1 (BH5 & BH6) - 17 (BH7) <1 (BH6) – 6 (BH5) BH7 decreased
Arsenic
<1 (WS116) – 26 (WS111) <1 (WS116) – 47 (WS105) WS105 increased WS111 decreased
<1 all surface waters 0.6 (SW5) – 41.3 (SW3) SW3 & SW7 increased <1 (BH6) – 1 (BH7) <0.4 all deep boreholes Similar concentrations
Cadmium
<1 (WS131) – 10 (WS116) <0.4 (WS131) – 12.8 (WS105) WS108, WS116, WS125 & WS126 decreased
<5 all surface waters 2 (SW7) – 3 (SW3) Similar concentrations <1 (BH6) – 1 (BH5) <0.4 all deep boreholes Similar concentrations
Chromium
<5 (all WS100 series) – 39 (WS125)
1 (WS108) – 53 (WS131) Generally increased slightly
<20 all surface waters 8 (SW3) – 58 (SW4) SW4 increased <20 all deep boreholes 1 (BH5) – 4 (BH6) Similar concentrations
Copper
<20 all shallow boreholes 1 (WS134) – 34 (WS105) WS105 increased
<0.1 all surface waters <0.05 all surface waters Similar concentrations <0.1 (BH5) – 0.6 (BH7) <0.05 all deep boreholes BH7 decreased
Mercury
<0.1 (WS105) – 0.2 (WS121) <0.05 all shallow boreholes WS121 decreased <7 (SW7) – 14 (SW3) 6 (SW7) – 27 (SW4) SW4 increased 12 (BH5) – 15 (BH7) 2 (BH5) – 6 (BH7) All decreased
Nickel
<7 (WS134) - 37 (WS131) 1 (WS131) – 107 (WS105) General decrease WS105, WS108, WS116, WS125 increased
<10 all surface waters <1 (SW5) – 2 (SW4) Similar concentrations <10 all deep boreholes <1 (BH5) – 1 (BH6) Similar concentrations
Lead
<10 all shallow boreholes <1 (WS122) – 2 (WS126) Similar concentrations 1 (SW4) – 2 (SW3) <1 (SW3) – 14 (SW3) SW3 increased <1 (BH5) – 4 (BH7) <1 (BH7) – 2 (BH5) Similar concentrations
Selenium
<1 (WS134) – 6 (WS111) <1 (WS113) – 229 (WS105) WS105 & WS125 increased <30 all surface waters 38 (SW7) – 177 (SW4) Increased Zinc <30 all deep boreholes 12 (BH5) – 23 (BH6) Similar concentrations
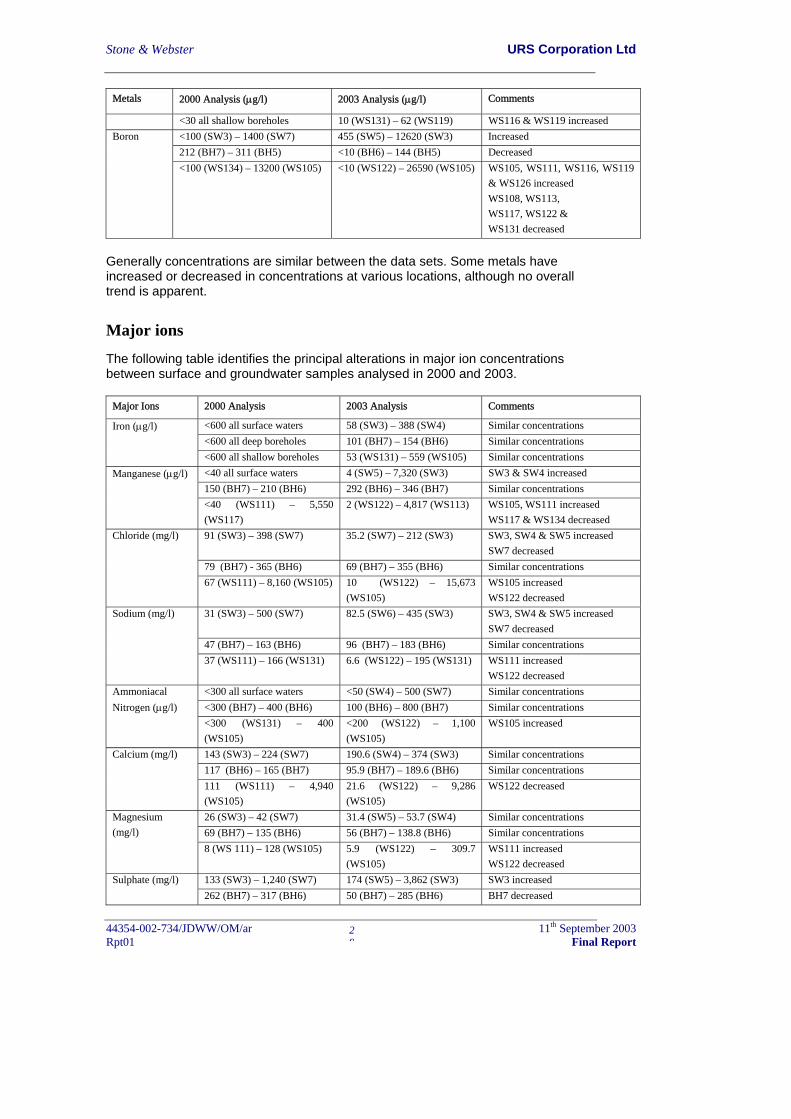
Stone & Webster URS Corporation Ltd
44354-002-734/JDWW/OM/ar 11th September 2003 Rpt01 Final Report
29
Metals 2000 Analysis (μg/l) 2003 Analysis (μg/l) Comments
<30 all shallow boreholes 10 (WS131) – 62 (WS119) WS116 & WS119 increased <100 (SW3) – 1400 (SW7) 455 (SW5) – 12620 (SW3) Increased 212 (BH7) – 311 (BH5) <10 (BH6) – 144 (BH5) Decreased
Boron
<100 (WS134) – 13200 (WS105) <10 (WS122) – 26590 (WS105) WS105, WS111, WS116, WS119 & WS126 increased WS108, WS113, WS117, WS122 & WS131 decreased
Generally concentrations are similar between the data sets. Some metals have increased or decreased in concentrations at various locations, although no overall trend is apparent.
Major ions
The following table identifies the principal alterations in major ion concentrations between surface and groundwater samples analysed in 2000 and 2003.
Major Ions 2000 Analysis 2003 Analysis Comments
<600 all surface waters 58 (SW3) – 388 (SW4) Similar concentrations <600 all deep boreholes 101 (BH7) – 154 (BH6) Similar concentrations
Iron (μg/l)
<600 all shallow boreholes 53 (WS131) – 559 (WS105) Similar concentrations <40 all surface waters 4 (SW5) – 7,320 (SW3) SW3 & SW4 increased 150 (BH7) – 210 (BH6) 292 (BH6) – 346 (BH7) Similar concentrations
Manganese (μg/l)
<40 (WS111) – 5,550 (WS117)
2 (WS122) – 4,817 (WS113) WS105, WS111 increased WS117 & WS134 decreased
91 (SW3) – 398 (SW7) 35.2 (SW7) – 212 (SW3) SW3, SW4 & SW5 increased SW7 decreased
79 (BH7) - 365 (BH6) 69 (BH7) – 355 (BH6) Similar concentrations
Chloride (mg/l)
67 (WS111) – 8,160 (WS105) 10 (WS122) – 15,673 (WS105)
WS105 increased WS122 decreased
31 (SW3) – 500 (SW7) 82.5 (SW6) – 435 (SW3) SW3, SW4 & SW5 increased SW7 decreased
47 (BH7) – 163 (BH6) 96 (BH7) – 183 (BH6) Similar concentrations
Sodium (mg/l)
37 (WS111) – 166 (WS131) 6.6 (WS122) – 195 (WS131) WS111 increased WS122 decreased
<300 all surface waters <50 (SW4) – 500 (SW7) Similar concentrations <300 (BH7) – 400 (BH6) 100 (BH6) – 800 (BH7) Similar concentrations
Ammoniacal Nitrogen (μg/l)
<300 (WS131) – 400 (WS105)
<200 (WS122) – 1,100 (WS105)
WS105 increased
143 (SW3) – 224 (SW7) 190.6 (SW4) – 374 (SW3) Similar concentrations 117 (BH6) – 165 (BH7) 95.9 (BH7) – 189.6 (BH6) Similar concentrations
Calcium (mg/l)
111 (WS111) – 4,940 (WS105)
21.6 (WS122) – 9,286 (WS105)
WS122 decreased
26 (SW3) – 42 (SW7) 31.4 (SW5) – 53.7 (SW4) Similar concentrations 69 (BH7) – 135 (BH6) 56 (BH7) – 138.8 (BH6) Similar concentrations
Magnesium (mg/l)
8 (WS 111) – 128 (WS105) 5.9 (WS122) – 309.7 (WS105)
WS111 increased WS122 decreased
133 (SW3) – 1,240 (SW7) 174 (SW5) – 3,862 (SW3) SW3 increased Sulphate (mg/l) 262 (BH7) – 317 (BH6) 50 (BH7) – 285 (BH6) BH7 decreased
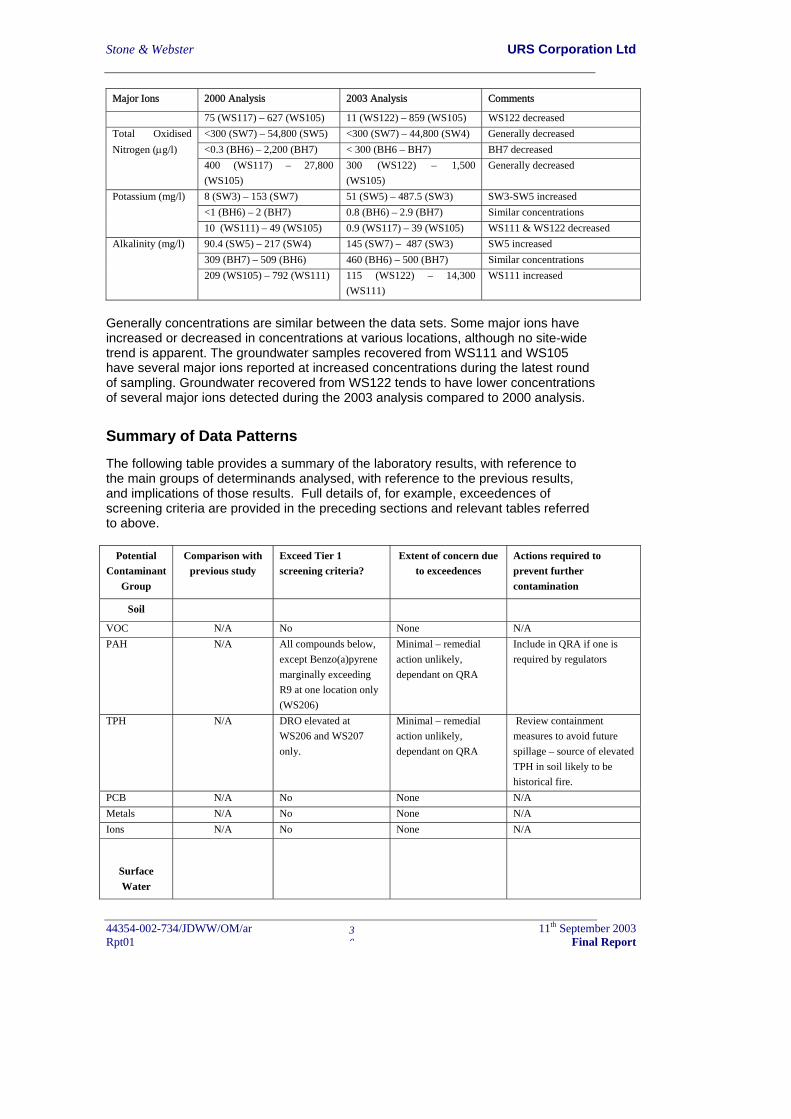
Stone & Webster URS Corporation Ltd
44354-002-734/JDWW/OM/ar 11th September 2003 Rpt01 Final Report
30
Major Ions 2000 Analysis 2003 Analysis Comments
75 (WS117) – 627 (WS105) 11 (WS122) – 859 (WS105) WS122 decreased <300 (SW7) – 54,800 (SW5) <300 (SW7) – 44,800 (SW4) Generally decreased <0.3 (BH6) – 2,200 (BH7) < 300 (BH6 – BH7) BH7 decreased
Total Oxidised Nitrogen (μg/l)
400 (WS117) – 27,800 (WS105)
300 (WS122) – 1,500 (WS105)
Generally decreased
8 (SW3) – 153 (SW7) 51 (SW5) – 487.5 (SW3) SW3-SW5 increased <1 (BH6) – 2 (BH7) 0.8 (BH6) – 2.9 (BH7) Similar concentrations
Potassium (mg/l)
10 (WS111) – 49 (WS105) 0.9 (WS117) – 39 (WS105) WS111 & WS122 decreased 90.4 (SW5) – 217 (SW4) 145 (SW7) – 487 (SW3) SW5 increased 309 (BH7) – 509 (BH6) 460 (BH6) – 500 (BH7) Similar concentrations
Alkalinity (mg/l)
209 (WS105) – 792 (WS111) 115 (WS122) – 14,300 (WS111)
WS111 increased
Generally concentrations are similar between the data sets. Some major ions have increased or decreased in concentrations at various locations, although no site-wide trend is apparent. The groundwater samples recovered from WS111 and WS105 have several major ions reported at increased concentrations during the latest round of sampling. Groundwater recovered from WS122 tends to have lower concentrations of several major ions detected during the 2003 analysis compared to 2000 analysis.
Summary of Data Patterns
The following table provides a summary of the laboratory results, with reference to the main groups of determinands analysed, with reference to the previous results, and implications of those results. Full details of, for example, exceedences of screening criteria are provided in the preceding sections and relevant tables referred to above.
Potential Contaminant
Group
Comparison with previous study
Exceed Tier 1 screening criteria?
Extent of concern due to exceedences
Actions required to prevent further contamination
Soil
VOC N/A No None N/A PAH N/A All compounds below,
except Benzo(a)pyrene marginally exceeding R9 at one location only (WS206)
Minimal – remedial action unlikely, dependant on QRA
Include in QRA if one is required by regulators
TPH N/A DRO elevated at WS206 and WS207 only.
Minimal – remedial action unlikely, dependant on QRA
Review containment measures to avoid future spillage – source of elevated TPH in soil likely to be historical fire.
PCB N/A No None N/A Metals N/A No None N/A Ions N/A No None N/A
Surface Water
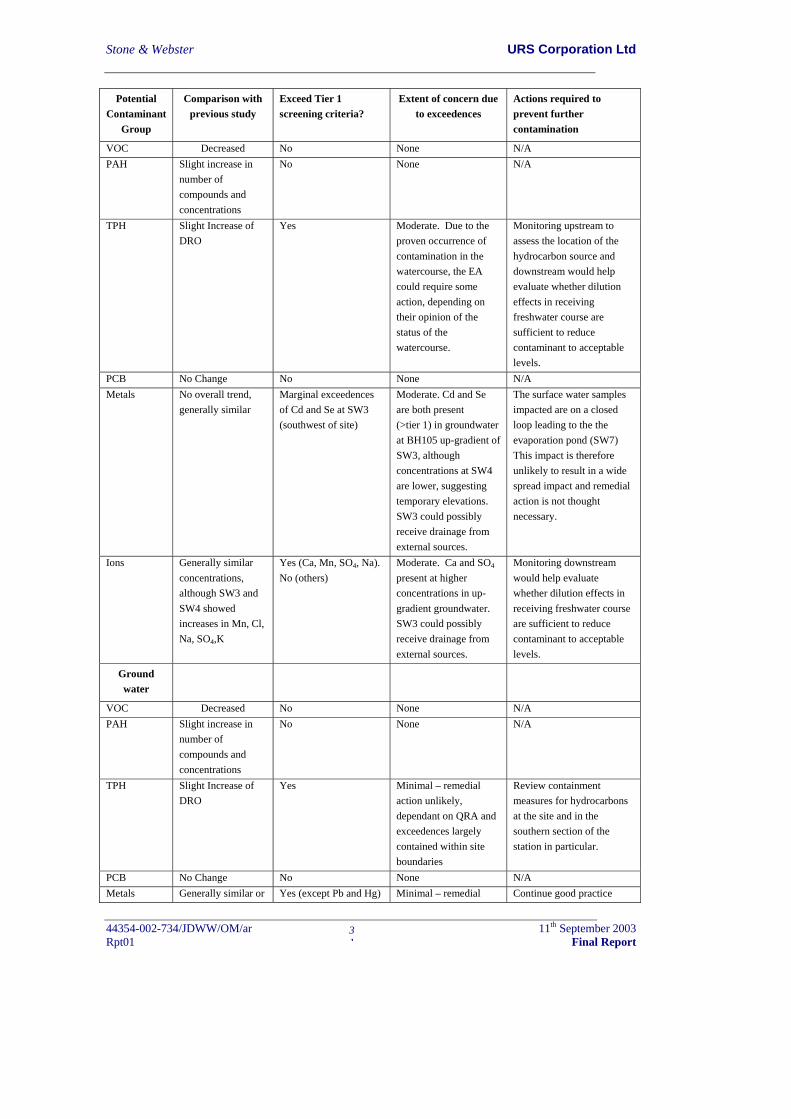
Stone & Webster URS Corporation Ltd
44354-002-734/JDWW/OM/ar 11th September 2003 Rpt01 Final Report
31
Potential Contaminant
Group
Comparison with previous study
Exceed Tier 1 screening criteria?
Extent of concern due to exceedences
Actions required to prevent further contamination
VOC Decreased No None N/A PAH Slight increase in
number of compounds and concentrations
No None N/A
TPH Slight Increase of DRO
Yes Moderate. Due to the proven occurrence of contamination in the watercourse, the EA could require some action, depending on their opinion of the status of the watercourse.
Monitoring upstream to assess the location of the hydrocarbon source and downstream would help evaluate whether dilution effects in receiving freshwater course are sufficient to reduce contaminant to acceptable levels.
PCB No Change No None N/A Metals No overall trend,
generally similar Marginal exceedences of Cd and Se at SW3 (southwest of site)
Moderate. Cd and Se are both present (>tier 1) in groundwater at BH105 up-gradient of SW3, although concentrations at SW4 are lower, suggesting temporary elevations. SW3 could possibly receive drainage from external sources.
The surface water samples impacted are on a closed loop leading to the the evaporation pond (SW7) This impact is therefore unlikely to result in a wide spread impact and remedial action is not thought necessary.
Ions Generally similar concentrations, although SW3 and SW4 showed increases in Mn, Cl, Na, SO4,K
Yes (Ca, Mn, SO4, Na). No (others)
Moderate. Ca and SO4 present at higher concentrations in up-gradient groundwater. SW3 could possibly receive drainage from external sources.
Monitoring downstream would help evaluate whether dilution effects in receiving freshwater course are sufficient to reduce contaminant to acceptable levels.
Ground water
VOC Decreased No None N/A PAH Slight increase in
number of compounds and concentrations
No None N/A
TPH Slight Increase of DRO
Yes Minimal – remedial action unlikely, dependant on QRA and exceedences largely contained within site boundaries
Review containment measures for hydrocarbons at the site and in the southern section of the station in particular.
PCB No Change No None N/A Metals Generally similar or Yes (except Pb and Hg) Minimal – remedial Continue good practice

Stone & Webster URS Corporation Ltd
44354-002-734/JDWW/OM/ar 11th September 2003 Rpt01 Final Report
32
Potential Contaminant
Group
Comparison with previous study
Exceed Tier 1 screening criteria?
Extent of concern due to exceedences
Actions required to prevent further contamination
slight decrease, except Se and Zn, slightly increased
action unlikely, dependant on QRA
regarding waste and materials storage.
Ions Generally similar, although WS111 increased for Mn, Na, Mg, K, SO4
Yes (generally) Minimal – exceedences largely contained within site boundaries
Continue good practice regarding waste and materials storage.
Stone & Webster URS Corporation Ltd
44354-002-734/JDWW/OM/ar 11th September 2003 Rpt01 Final Report
33
Abestos LIability review
REVIEW FINDINGS & RECOMMENDATIONS The URS findings and recommendations resulting from the asbestos liability assessment are outlined below.
Description of Current Management System
The site was originally built in 1968/1969s, with additional major plant installation in 1982/1983. Site buildings were subject to a programme of asbestos surveys during the 1980’s. These were followed by works to remove asbestos ceiling tiles and other ACMs in certain areas using licensed asbestos contractors in compliance with the Control of Asbestos at Work Regulations (CAWR) 1987 as amended (now superseded by CAWR 2002) and Asbestos (Licensing) Regulations (AsLicR) 1983. These historical asbestos removal works will have reduced the overall asbestos inventory for the site buildings as compared to the original baseline for ACMs. The site was until recently believed to be free of asbestos-containing thermal insulation to the major plant, reportedly because CEGB banned asbestos-containing thermal insulation prior to construction. Site management implemented a proactive asbestos management system in early 2001, which has been under continual development to the present day. The system was implemented in anticipation of the new legal Duty to Manage Asbestos [Regulation 4 of CAWR 2002], which comes into force in May 2004. As part of the management system, Drax have recently prepared a Final Control of Asbestos Policy, which includes a wide range of provisions relating to asbestos identification, assessment, management, control and abatement. A major focus of the management system has been to undertake desk study reviews of historical information, and where necessary, to instruct the resident licensed asbestos contractor, Cape Industrial Services Ltd (Cape), to undertake Type 2 asbestos surveys of the thermal insulation prior to major outages. This work has identified that the site is not free of asbestos-containing thermal insulation; composite asbestos pipework and vessel insulation has been identified in a limited number of locations prior to major outages, and has been the subject of appropriate abatement works. This approach is to be applied for all outages in the future, including for the units installed in 1982/1983. In addition, Cape have undertaken Type 2 asbestos surveys of site buildings outside the main plant building to update the baseline information. The asbestos survey activities by Cape since early 2001 have generated in the region of 1,000 bulk material samples, which have been analysed by the Institute of Occupational Medicine (IOM) in Chesterfield for asbestos content. Hard copy asbestos register information relating to the site, including information that is somewhat historical in nature, is held in a central location in the Engineering offices. Cape have since 2001 developed their own asbestos register and asbestos action register for the site, designed to help Cape with the day-to-day management and tracking of survey findings and abatement actions recommended and undertaken by Cape. The Cape system includes an assessment of material condition, categorised as 'Good', 'Fair' or 'Poor'. Cape also produces a photo log of
Stone & Webster URS Corporation Ltd
44354-002-734/JDWW/OM/ar 11th September 2003 Rpt01 Final Report
34
all sampling locations for their surveys, which is supplied to site management for reference. Site management has developed an electronic asbestos data management system (based on the Prism System used by Engineering) which includes a material assessment algorithm in line with the UK Standard for asbestos surveying and assessment, MDHS 100 (HSE, 2001). The system is still under development, and certain survey data has yet to be installed onto the system. Site management in conjunction with Cape is committed to entering all existing, current survey and assessment information onto the system, which will then act as the main asbestos register for the site. The system has been designed to be readily updateable by authorised Drax and Cape personnel. Site management operates a contractor management system to ensure compliance with the current legal requirements of the CAWR 2002 and AsLicR 1983, which requires that all reasonable checks be made by the contract supervisor to establish whether asbestos materials are present that could be affected by the works. These checks include inspection of the desk review information and hard copy asbestos register information, and default to an assumption that asbestos may be present unless it can be shown not to be by previous investigations and/or sampling. Where this is the case, Drax instruct Cape to undertake survey and sampling works to identify whether or not asbestos is present within the proposed area of the contract works. Where asbestos abatement works are required these are only undertaken by Cape, the resident licensed asbestos contractor. The site has a system of checks and supervision of asbestos abatement works, which includes review of HSE 14-day Notifications, Asbestos License, Plans of Work and Assessments, plant and equipment certification, medical certification and fit-test certification.
Issues Identified and Areas for Improvement
A number of specific issues and areas for improvement were identified by URS based on the review of the current asbestos management system and observations made on site on 25 July 2003. The text below summarises the issues identified, and also provides specific recommendations designed to provide some focus to improving key elements of the overall management system. 6.1.2.1 Issues Relating Primarily to Current Provisions of CAWR 2002 a. Labelled screw fixed AIB ceiling tiles identified within the corridor opposite 2B
Transformer appeared to have been recently disturbed and were in poor condition, with a number of tiles missing and an open ceiling void. These tiles were assessed as in ‘fair’ condition by the survey contractor in February 2002, despite damage being evident, and minor works were undertaken to remove damaged tiles during October 2002. The corridor area was noted to be in frequent use. URS recommends that a formal Risk Assessment be undertaken for the AIB ceiling tiles in this location to determine additional asbestos abatement works are required.
Stone & Webster URS Corporation Ltd
44354-002-734/JDWW/OM/ar 11th September 2003 Rpt01 Final Report
35
b.
Cape undertakes 'minor works' (defined as < 1 sq m area by Cape) to remove damaged AIB ceiling tiles under the 'one hour rule', and that this work is done without the construction of asbestos enclosures under a 'blanket' notification of the HSE. This is a possible mis-interpretation of the Asbestos (Licensing) Regulations 1983, which allow such 'minor works' to be undertaken without the need for an asbestos license (although the CAWR 2002 still applies). URS considers that even 'minor works' to remove AIB ceiling tiles without an enclosure is not good practice, as in the event of an unforeseen major release of asbestos it is not possible to prevent the spread of asbestos contamination. Any proposals to undertake removal of AIB without enclosures must be justified by a detailed risk assessment, with appropriate controls that demonstrate that measures employed reduce the risks to the lowest level reasonably practicable.
URS recommends that Cape Plans of Work and risk assessments for non-enclosure asbestos insulation removal be reviewed to determine whether proposed work methods and controls are acceptable to Drax.
6.1.2.2 Issues Relating Primarily to Regulation 4 Provisions of CAWR 2002 a. Cape undertakes asbestos material assessments on the basis of a 'Good', 'Fair'
or 'Poor' condition rating. The system of material assessments is being 'upgraded' via the Prism-based asbestos register system, which complies with the UK Standard for asbestos surveying and assessment, MDHS 100 (which scores Product Type, Extent of Damage, Surface Treatment and Asbestos Type). However, formal Risk Assessments3 (for asbestos materials identified on the basis of factors such as Location, Extent, Use, Occupancy, Work Activities, and Likelihood that Maintenance will take place) are not undertaken by Drax or on their behalf by Cape. Informal risk assessments are reportedly undertaken in consultation with Cape, resulting in abatement actions being undertaken based on consideration of such risk factors. Formalisation of asbestos risk assessments would be required to meet Regulation 4. URS recommends that Drax develops a formal system of risk assessment for known, presumed or strongly presumed ACMs as an improvement to the existing asbestos management system, and to ensure compliance with Regulation 4 which comes into force in May 2004. This may be achieved through development of the Prism-based asbestos data management system. This work should allow effective prioritisation of asbestos abatement works based on risk.
b. The already well-progressed Prism-based asbestos register being developed by
the site was found to have a number of deficiencies. These included problems searching for specific locations or rooms within buildings, difficulties in identifying
3 as required under Regulation 4 of the CAWR 2002
Stone & Webster URS Corporation Ltd
44354-002-734/JDWW/OM/ar 11th September 2003 Rpt01 Final Report
36
priority ACMs on-site with high material assessment scores and the lack of a management report capability to generate hard copy reports. Site management, in conjunction with other parties, should continue with development of the Prism-based asbestos register system to ensure that the system provides an effective and user friendly management tool.
c.
d.
e.
Observations on-site indicate that there is a potential for ACMs to be present that have not been identified by asbestos surveys undertaken on site since January 2001. Specifically, suspected AIB bulkhead panelling was identified inside a stairwell inside the Workshop Block which was not labelled with a sample number and ‘warning asbestos’ label, and was not recorded in the asbestos register. URS recommends that Drax give consideration to appointing a suitably skilled, experienced and competent third-party to review the current Cape asbestos survey quality procedures and the standard of surveys undertaken on site since 2001.
Cape, the licensed asbestos contractor resident on site, has been undertaking asbestos surveys at the site since January 2001, and employs a number of very experienced asbestos removal operatives on site. However, the company does not at present have asbestos surveyors on site with BIOH (FBOHS) P402 certification demonstrating competence.
URS recommends that site management reviews its minimum training and competency criteria for those authorised to undertake asbestos surveys and assessments at the Drax site, and implements any changes deemed necessary to the current standards.
Cape have collected samples of 30cm x 30cm typically non-asbestos fibreboard ceiling tiles in a number of buildings on site that have been reported by IOM as containing 'trace' quantities of amosite (brown) asbestos. These ceiling tiles are now labelled as containing asbestos, and other similar tiles have also been labelled as they are also presumed to contain asbestos. These typically non-asbestos materials, containing a 'trace' of asbestos, represent a lesser hazard than other AIB tiles on-site with a 'significant' amosite content. However, they represent an additional asbestos cost liability, and impact significantly on the ability of Engineering to undertake routine maintenance activities. URS recommends that a programme of additional sampling of 30cm x 30cm fibreboard tiles is undertaken across the site, with particular emphasis on sampling controls to ensure that cross contamination does not occur between samples. Based on the findings of the sampling exercise, a more accurate assessment of the prevalence of such materials can be established.
f. IOM report all bulk asbestos analysis results to Cape on the basis that one or
more of the three asbestos types have been 'Detected', or that asbestos is 'None
Stone & Webster URS Corporation Ltd
44354-002-734/JDWW/OM/ar 11th September 2003 Rpt01 Final Report
37
Detected'. No analyst’s judgement is included on the certificates of analysis on the percentage proportion of asbestos present in a sample by volume, thus limiting the extent to which the analytical information can be used to assess risks. For example, in estimating likely fibre levels during asbestos abatement works for materials containing 'trace' amounts of asbestos, versus 'high' proportions of asbestos. URS recommends that IOM be consulted by Cape in relation to whether estimates of the percentage proportion of asbestos by volume can be provided on the analytical certificates.
Current and Future Asbestos OPEX Requirements
Drax reported that planned operational expenditure (OPEX) for asbestos was set at £50,000 for the period 01 January to 31 December 2003. However, the actual OPEX expenditure for this period was reported to be currently projected by management to approximately £100,000, a 100% increase. The increase being largely as a result of asbestos discoveries during the major outages, requiring asbestos abatement to be undertaken by Cape. Site management reported that they expected OPEX for asbestos to begin to reduce over the next few years, as much of the preliminary work towards compliance with the Regulation 4 Duty of the CAWR 2002 had now been undertaken. However, URS consider that OPEX could potentially reach or potentially exceed £100,000 per annum over the next 5 years. This could be as a result of improvements to the asbestos management system, asbestos discoveries during the outage programme, and the new Duty requirement for a more formal approach to Risk Assessment (which is likely to drive forward asbestos abatement works once implemented). Beyond 5 years, URS considers that the OPEX requirements for asbestos should begin to reduce as a result of improved and more effective management of ACMs, and a reduction in the overall inventory of asbestos to be managed during outages, building-related works and maintenance.
KEY LIMITATIONS OF THE ASBESTOS LIABILITY REVIEW The URS evaluation of cost liabilities is based on brief observations made on site on 25 July 2003 and a limited review of information provided by Drax management, including verbal information on current OPEX. URS has relied upon the accuracy of information provided by Drax and Cape Industrial Services Ltd. URS has assumed that Drax will continue its current policy of undertaking asbestos abatement works where necessary based on risk, and that there are no current plans to undertake major re-development, refurbishment or demolition of major plant or buildings. OPEX costs would be significantly increased in the event that the company adopted a policy of removing asbestos materials over time irrespective of any risks that they might pose to site workers. URS has not included any assessment of potential liabilities for asbestos claims from current or former site workers.
Stone & Webster URS Corporation Ltd
44354-002-734/JDWW/OM/ar 11th September 2003 Rpt01 Final Report
38
CONCLUSIONS AND RECOMMENDATIONS
Conclusions Overall, Drax Power Station appears to be managed to a reasonably high standard with regard to environmental issues. Gross contamination of soil, groundwater or surface water has not been encountered, and there is ongoing improvement with regard to asbestos materials at the site.
Soil Contamination
In general, soil contamination is absent from most of the areas of the site investigated. A small number of isolated elevated concentrations were identified as follows: • A single elevated PAH (benzo(a)pyrene) concentration at WS206 (0.5-0.6m bgl) This
elevated soil concentration was not reflected by the groundwater results from this borehole.
• Diesel Range Organics (DRO) were in excess of 8000mg/kg (0.3-0.4m bgl) decreasing to less than 6000mg/kg (4.8 – 4.9m bgl) in WS207, adjacent to the transformer fire area. These elevated soil concentrations were not reflected by the groundwater results from this borehole.
No other soil contamination was identified.
Groundwater / Surface Water Contamination
The majority of the groundwater and surface water samples analyses were not contaminated in excess of Tier 1 screening criteria, with the following small number of exceptions: • SW6 contained 155ug/l DRO, identified as biodegraded diesel.
• BH5 contained 292ug/l DRO, identified as diesel.
• At the southern end of the site, DRO was present in WS116, WS119, WS121 and WS122 in an area of fuel storage.
• Marginal exceedences of arsenic, cadmium and chromium in WS105, WS122, WS131 and SW3.
• Localized exceedences of nickel, selenium and boron in WS105, WS125, SW3, SW4 and SW7.
• WS105 contained high concentrations of dissolved ions. Elsewhere across the site, ions were generally slightly elevated, with manganese particularly high in SW4, and alkalinity high in WS111.
Stone & Webster URS Corporation Ltd
44354-002-734/JDWW/OM/ar 11th September 2003 Rpt01 Final Report
39
Marginal and localized exceedences of screening criteria suggest contamination present may be at relatively low levels and restricted to comparatively small areas of the site. Elevated metal and major ion concentrations in isolated locations may not solely be attributable to site processes and activities. Off-site sources may exist and natural conditions may result in elevated concentrations.
Data Comparison
In general, the groundwater results are similar to the previous investigation results, with the exception of a general increase in concentrations of diesel range organics (DRO) across the site. Volatile Organic Compounds (VOCs) were not reported above method detection limits during the current round of sampling. Given that the highest concentration of DRO (801ug/l) was encountered in BH119, it would appear that the source of the recently observed contamination is more likely to be in the vicinity of fuel or other hydrocarbon storage in the south of the site. Decreases in concentration were observed hydraulically down gradient to the northeast. The elevated DRO concentrations remain largely contained within the site boundary, and although exceeding Tier 1 screening criteria, may prove to present no significant risk of harm t o human health or the environment on completion of quantitative risk assessment (QRA) studies. It is therefore considered unlikely that Regulators would enforce remedial action of this potential contamination.
Potential liabilities With regard to asbestos management, the extent of potential liability at the site is discussed in detail in section 6, and is limited principally to control of OPEX for this issue (within the limitations stated). The recommendations listed in this report would be included in the anticipated annual OPEX level of c£100,000 for the next 5 years, decreasing thereafter. With regard to potentially contaminated land, this investigation has identified substances under the ground in soil and groundwater, and also in surface water, which have the potential to cause harm to human health and/or the environment. At the present time the extent of impact and the concentrations observed are thought unlikely to warrant remedial action whilst the land remains in it’s currant use. A quantitative risk assessment would be required to confirm this in the event that the situation came to the attention of regulators. Additional monitoring and a review of hydrocarbon containment is recommended to reduce the potential for further impacts to soil and groundwater quality in the southern section of the station..
Recommendations With regard to asbestos liability management, the following specific recommendations (as detailed in section 6) are made:
Stone & Webster URS Corporation Ltd
44354-002-734/JDWW/OM/ar 11th September 2003 Rpt01 Final Report
40
• Develop formal risk assessment to comply with Regulation 4 (including AIB tiles in corridor opposite 2B transformer.
• Continue to develop the Prism-based system.
• Consider 3rd party review of Cape procedures and surveys.
• Review training and competency criteria for asbestos contractors.
• Carry out additional sampling of 30cm x 30cm fibreboard tiles across the site.
• Consider improvements to quantification of asbestos analysis reporting.
• Review Cape Plans of Work and risk assessments for non-enclosure asbestos insulation removal.
With regard to Contaminated Land issues, it is recommended that additional assessment of the source of contamination in the southern section of the site is undertaken with a view to preventing it exacerbating. This should be combined with a review of hydrocarbon containment measures in the area. In the event that regulators become aware of the present situation they are likely to require a Quantitative Risk Assessment (QRA) to be completed to ‘prove’ our opinion that a ‘pollutant linkage’ is unlikely to be present.
oo OO oo
URS would like to thank Stone & Webster Consultants for the opportunity to undertake this investigation. We look forward to discussing the findings of this study with you. Yours faithfully for URS CORPORATION LTD Jim Wragg Owen Mills Project Director Project Manager
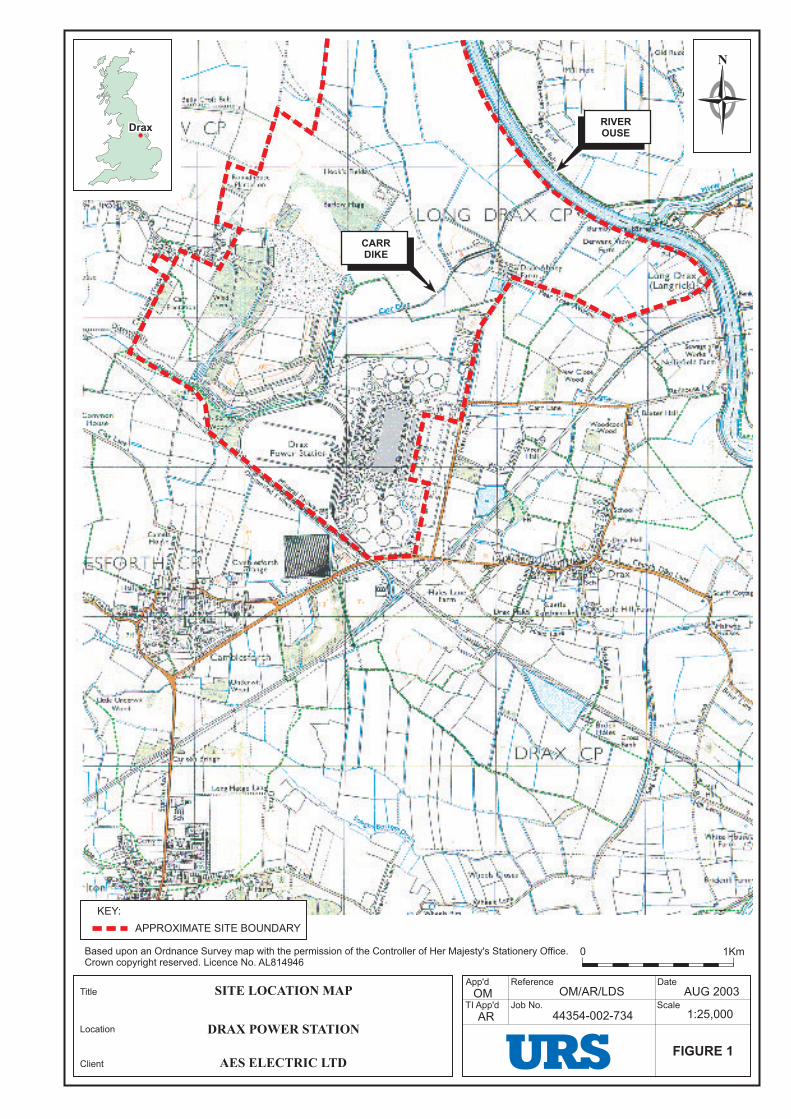
SITE LOCATION MAPTitle
Location
ClientFIGURE 1
App'd Date
TI App'd ScaleJob No.
ReferenceAUG 2003
44354-002-734
OM/AR/LDS
AR 1:25,000 DRAX POWER STATION
AES ELECTRIC LTD
N
1Km0Based upon an Ordnance Survey map with the permission of the Controller of Her Majesty's Stationery Office.Crown copyright reserved. Licence No. AL814946
DraxDrax RIVEROUSE
KEY:APPROXIMATE SITE BOUNDARY
CARRDIKE
OM

FORMERCONSTRUCTION
WASTE DISPOSALAREA
FORMERCONSTRUCTION
WASTE DISPOSALAREA
ON SITEABSTRACTIONBOREHOLES
ON SITEABSTRACTIONBOREHOLES
N
FIGURE 2
TI App'dAUG 2003
App'd
Title
Location
Client
Date
Scale Job No.
Reference
SITE LAYOUT
DRAX POWER STATION
AES ELECTRIC LTD
44354-002-734
OM/AR/LDS
AS SHOWNAR
0 100 200 300 400 500m
APPROXIMATE SCALE
OM
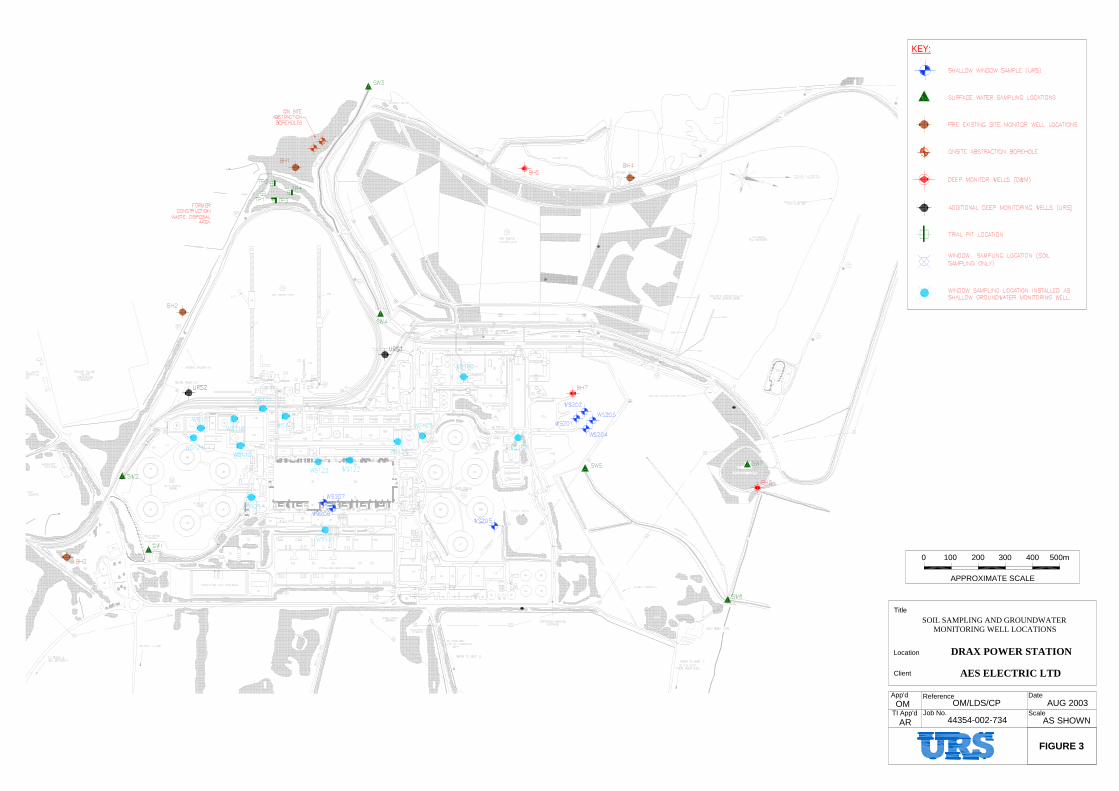
FIGURE 3
TI App'dAUG 2003
App'd
Title
Location
Client
Date
Scale Job No.
Reference
DRAX POWER STATION
AES ELECTRIC LTD
44354-002-734
OM/LDS/CP
AS SHOWNAR
0 100 200 300 400 500m
APPROXIMATE SCALE
OM
SOIL SAMPLING AND GROUNDWATER MONITORING WELL LOCATIONS
KEY:
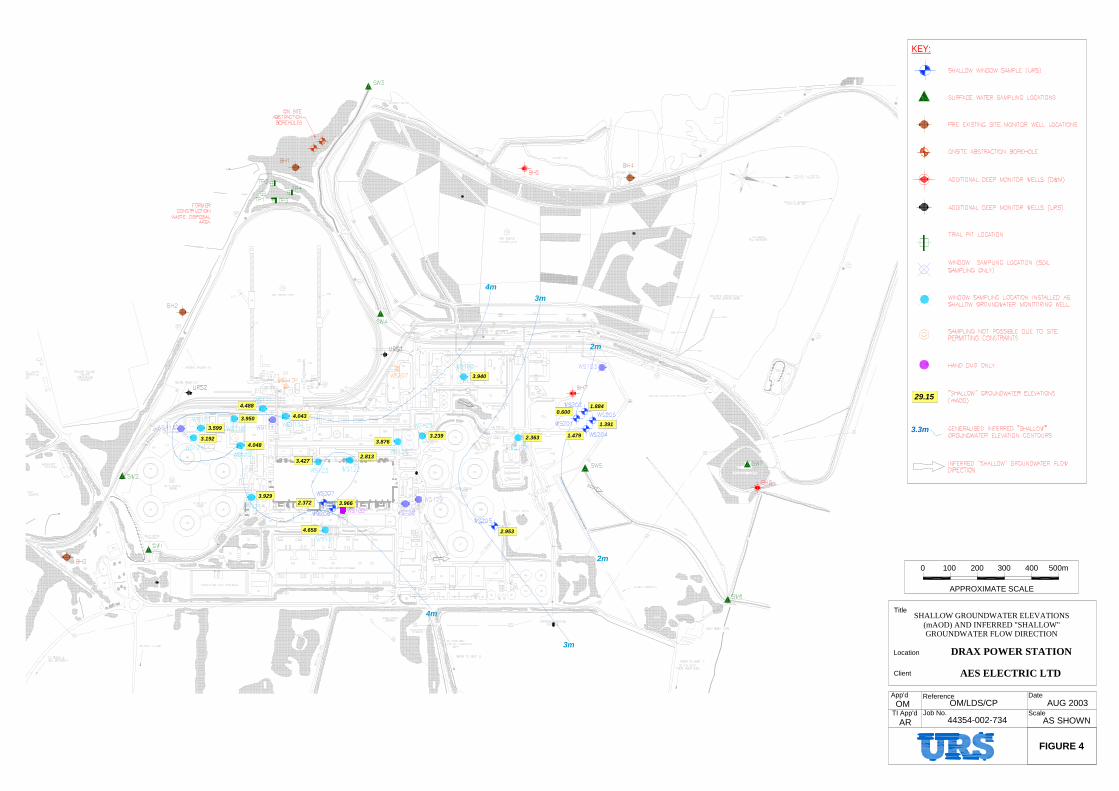
FIGURE 4
TI App'dAUG 2003
App'd
Title
Location
Client
Date
Scale Job No.
Reference
DRAX POWER STATION
AES ELECTRIC LTD
44354-002-734
OM/LDS/CP
AS SHOWN
0 100 200 300 400 500m
APPROXIMATE SCALE
AR
OM
3.3m
SHALLOW GROUNDWATER ELEVATIONS(mAOD) AND INFERRED "SHALLOW" GROUNDWATER FLOW DIRECTION
KEY:
29.15
3m4m
2m
2m
3m
4m
3.940
2.363
2.953
3.2393.876
3.427
2.372 3.966
4.658
2.813
3.929
4.048
3.599
3.192
3.950
4.488 1.884
1.391
1.479
0.6004.043
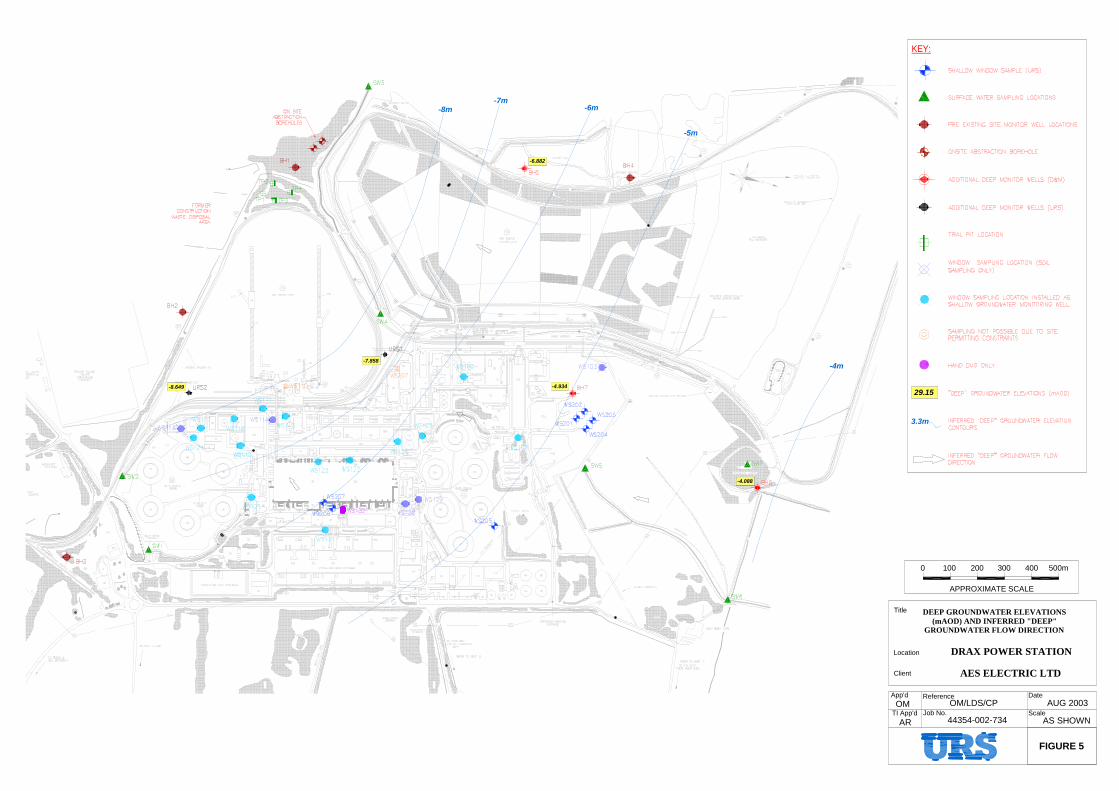
0 100 200 300 400 500m
APPROXIMATE SCALE
FIGURE 5
TI App'dAUG 2003
App'd
Title
Location
Client
Date
Scale Job No.
Reference
DEEP GROUNDWATER ELEVATIONS(mAOD) AND INFERRED "DEEP"
GROUNDWATER FLOW DIRECTION
DRAX POWER STATION
AES ELECTRIC LTD
44354-002-734
OM/LDS/CP
AS SHOWNAR
OM
3.3m
KEY:
29.15
-6m-7m
-8m
-5m
-4m-7.858
-8.649 -4.934
-4.088
-6.882
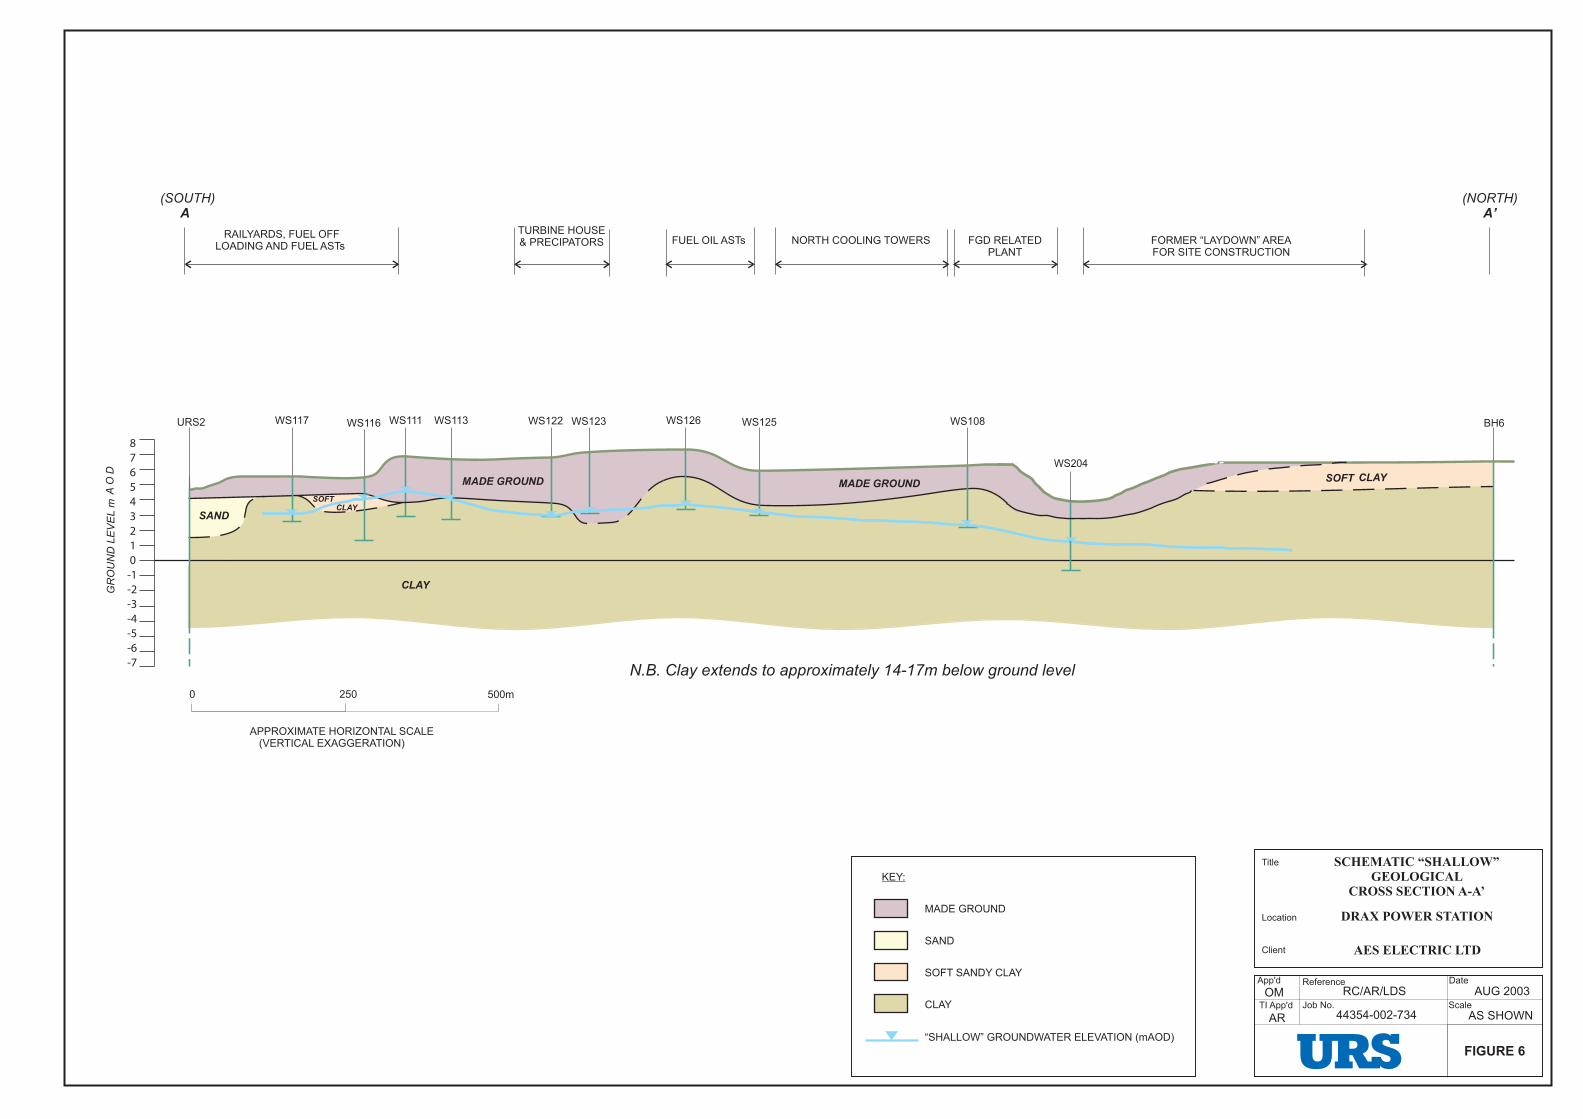
A A’(SOUTH) (NORTH)
SANDSOFT
CLAY
MADE GROUND
GR
OU
ND
LEV
EL m
AO
D
500m0 250
APPROXIMATE HORIZONTAL SCALE (VERTICAL EXAGGERATION)
WS111
CLAY
WS113WS116
SOFT CLAY
WS117 WS122 WS123 WS126 WS125 WS108 BH6
RAILYARDS, FUEL OFFLOADING AND FUEL ASTs
TURBINE HOUSE& PRECIPATORS FUEL OIL ASTs NORTH COOLING TOWERS FGD RELATED
PLANTFORMER “LAYDOWN” AREAFOR SITE CONSTRUCTION
MADE GROUND
URS2
N.B. Clay extends to approximately 14-17m below ground level
8 7 6 5 4 3 2 1 0-1-2-3-4-5-6-7
WS204
“SHALLOW” GROUNDWATER ELEVATION (mAOD)
CLAY
SOFT SANDY CLAY
SAND
MADE GROUND
KEY:
FIGURE 6
TI App'dAUG 2003
App'd
Title
Location
Client
Date
Scale Job No.
Reference
SCHEMATIC “SHALLOW”GEOLOGICAL
CROSS SECTION A-A’
DRAX POWER STATION
AES ELECTRIC LTD
44354-002-734
RC/AR/LDS
AS SHOWNAR
OM