q1e00 master quartalsbericht€¦ · january – march 2012 interim report. 1 updated information 7...
TRANSCRIPT

j a n u a r y – M a r c h 2 0 1 2
Interim Report
1 U PDATED I N FORMATION 7 VOLKSWAGEN SHAR ES 8 MANAGEMENT R EPORT 20 B RAN DS AN D BUSI N ESS F I ELDS
25 I NTER IM FI NANC IAL STATEMENTS (CON DENSED)
1 Key Facts
2 Key Events 8 Business Development
15 Results of Operations, Finan- cial Position and Net Assets
19 Outlook
25 Income Statement 26 Statement of Comprehensive
Income 27 Balance Sheet 28 Statement of Changes in
Equity 30 Cash Flow Statement 31 Notes to the Financial
Statements 44 Review Report
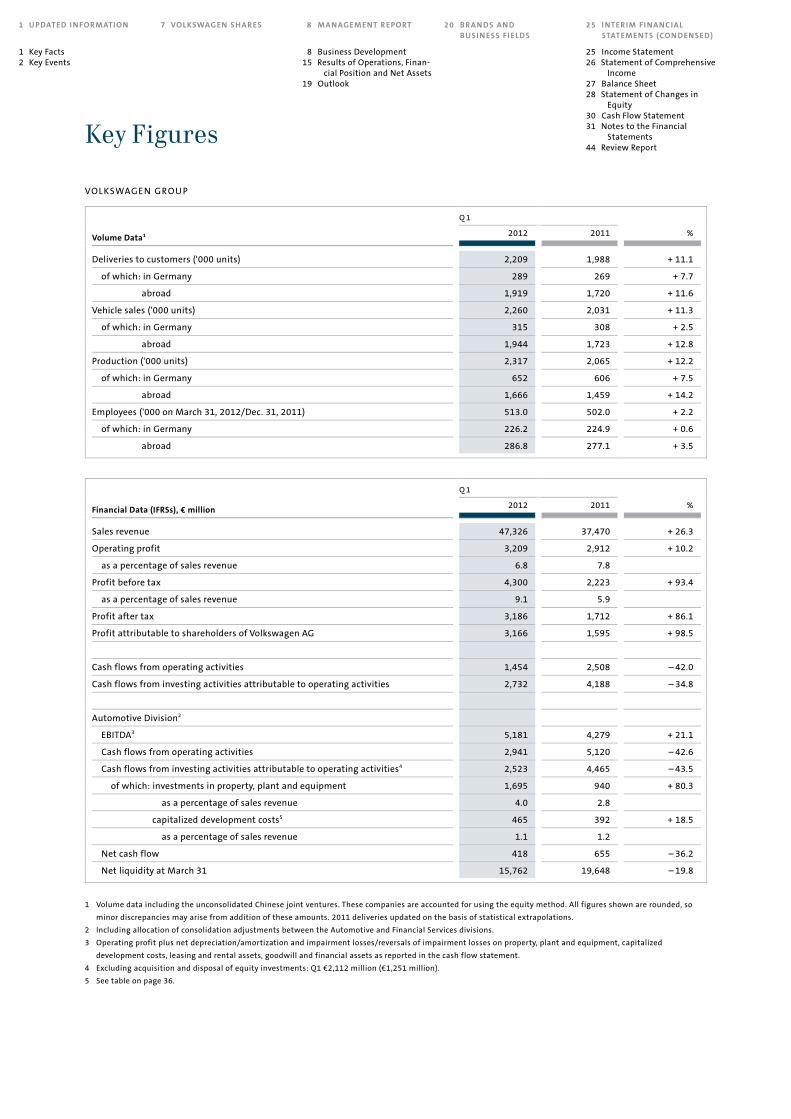
VOLKSWAGEN GROU P
Q 1
Volume Data1 2012 2011 %
Deliveries to customers ('000 units) 2,209 1,988 + 11.1
of which: in Germany 289 269 + 7.7
abroad 1,919 1,720 + 11.6
Vehicle sales ('000 units) 2,260 2,031 + 11.3
of which: in Germany 315 308 + 2.5
abroad 1,944 1,723 + 12.8
Production ('000 units) 2,317 2,065 + 12.2
of which: in Germany 652 606 + 7.5
abroad 1,666 1,459 + 14.2
Employees ('000 on March 31, 2012/Dec. 31, 2011) 513.0 502.0 + 2.2
of which: in Germany 226.2 224.9 + 0.6
abroad 286.8 277.1 + 3.5
Q 1
Financial Data (IFRSs), € million 2012 2011 %
Sales revenue 47,326 37,470 + 26.3
Operating profit 3,209 2,912 + 10.2
as a percentage of sales revenue 6.8 7.8
Profit before tax 4,300 2,223 + 93.4
as a percentage of sales revenue 9.1 5.9
Profit after tax 3,186 1,712 + 86.1
Profit attributable to shareholders of Volkswagen AG 3,166 1,595 + 98.5
Cash flows from operating activities 1,454 2,508 – 42.0
Cash flows from investing activities attributable to operating activities 2,732 4,188 – 34.8
Automotive Division2
EBITDA3 5,181 4,279 + 21.1
Cash flows from operating activities 2,941 5,120 – 42.6
Cash flows from investing activities attributable to operating activities4 2,523 4,465 – 43.5
of which: investments in property, plant and equipment 1,695 940 + 80.3
as a percentage of sales revenue 4.0 2.8
capitalized development costs5 465 392 + 18.5
as a percentage of sales revenue 1.1 1.2
Net cash flow 418 655 – 36.2
Net liquidity at March 31 15,762 19,648 – 19.8
1 Volume data including the unconsolidated Chinese joint ventures. These companies are accounted for using the equity method. All figures shown are rounded, so
minor discrepancies may arise from addition of these amounts. 2011 deliveries updated on the basis of statistical extrapolations.
2 Including allocation of consolidation adjustments between the Automotive and Financial Services divisions.
3 Operating profit plus net depreciation/amortization and impairment losses/reversals of impairment losses on property, plant and equipment, capitalized
development costs, leasing and rental assets, goodwill and financial assets as reported in the cash flow statement.
4 Excluding acquisition and disposal of equity investments: Q1 €2,112 million (€1,251 million).
5 See table on page 36.
Key Figures

1
Key Facts Key Events
U PDATED I N FORMATION
> Volkswagen Group makes successful start to fiscal year 2012
> Operating profit up €0.3 billion year-on-year to €3.2 billion
> Profit before tax improves to €4.3 billion (€2.2 billion); positive effects from equity-accounted investments
> Group sales revenue up 26.3% to €47.3 billion
> Cash flows from operating activities in the Automotive Division at €2.9 billion (€5.1 billion) due to growth factors; ratio of investments in property, plant and equipment (capex) to sales revenue amounts to 4.0% (2.8%)
> Automotive Division net liquidity at €15.8 billion; this includes the liquidity outflow of €1.4 billion for the increase in the stake in MAN SE to 70.89% of the voting rigths
> Strong demand for Group models worldwide:
- Deliveries to customers up 11.1% year-on-year to 2.2 million vehicles
- Group outperforms the market in all regions; global share of passenger car market rises to 12.2% (11.9%)
- Volkswagen Passenger Cars adds two more models – the eco up! and the four-door version – to the up! family; Jetta Hybrid and Polo Blue GT make their debut
- Audi presents the third generation of a bestseller: the new A3; RS4 makes its debut
- ŠKODA showcases the four-door version of the Citigo for the first time at a motor show
- SEAT ushers in the next phase of its model rollout with the new Ibiza, the close-to-production Toledo concept study and the four-door Mii
- Bentley unveils the EXP 9 F SUV study; Lamborghini and Bugatti present compelling Aventador J and Veyron 16.4 Grand Sport Vitesse
- Volkswagen Commercial Vehicles attracts attention with the Amarok Canyon concept car
- First Scania Euro 6 trucks registered
- NEOPLAN Skyliner from MAN wins the red dot design award
Key Facts

2
N EW VOLKSWAGEN GROU P MODELS
The Volkswagen Group opened the 2012 automotive year
at the Detroit and Geneva motor shows, where it presented
a large number of impressive new models.
North American International Auto Show in Detroit
Volkswagen Passenger Cars kicked off the new automotive
year in Detroit with the world premiere of the Jetta Hybrid
and the E-Bugster concept car. After the Touareg, the Jetta
Hybrid is the second Volkswagen to have a drivetrain
module with both a petrol engine and an electric motor
under its bonnet. The module combines a four-cylinder
1.4 TSI engine (110 kW/150 PS), 7-speed DSG and an
electric motor (20 kW). At the push of a button, it can even
be driven at speeds of up to 70 km/h for a distance of up to
two kilometers purely in electric mode. The E-Bugster
features unique dynamics from every angle. Powered by a
lithium ion battery and 85 kW electric motor that weighs
only 80 kg, it has a range of at least 180 km. This is
extended by a regenerative braking system.
Bentley unveiled two new Continental V8 models in
Detroit – the Continental GT and the Continental GTC. The
new 4.0 l V8 motor sets remarkable performance and
emissions standards in the luxury sports car segment and
offers a completely new driving experience.
International Motor Show in Geneva
The Volkswagen Group premiered ten fascinating models
at the International Motor Show in Geneva.
Volkswagen Passenger Cars unveiled the new Golf GTI
Cabriolet to great acclaim at the motor show. The series
version of the most powerful Golf Cabriolet of all time
features a 155 kW (210 PS) engine and can accelerate
from 0 to 100 km/h in 7.3 seconds. It has an average fuel
consumption of only 7.6 l per 100 km and CO2 emissions
of 177 g/km. Visually, the convertible boasts classic GTI
design cues. The new Polo Blue GT also celebrated its
world premiere, fittingly described as sporty, efficient,
smooth and dynamic. At the heart of the fuel-efficient
model is ACT cylinder deactivation – the first time this
technology has been used in a Volkswagen. Active cylinder
management noticeably reduces fuel consumption by
temporarily deactivating the second and third cylinders
under light and medium load conditions. The Polo Blue
GT’s 1.4 l TSI engine uses an average of 4.7 l of fuel per
100 km and produces 105 g/km of CO2 per kilometer.
Volkswagen Passenger Cars also showcased its progress on
the forward-looking Cross Coupé concept car, which is
even more fuel efficient than the version unveiled at the
end of 2011. Powered by a TDI engine and two electric
motors, the Cross Coupé has an average fuel consumption
of 1.8 l/100 km, which corresponds to CO2 emissions of
only 46 g/km. Alongside further up! concept cars,
Volkswagen presented the four-door version of the series
model (available from May 2012) and the eco up!, which
consumes an average of 2.9 kg of natural gas per 100 km
and emits only 79 g CO2/km – the lowest in its class.
Audi celebrated the world premiere of the third-
generation Audi A3 in Geneva, which is up to 80 kg lighter
than its predecessor. The driver assistance system of the
new Audi A3 sets new standards in the premium compact
class. For instance, Audi’s adaptive cruise control main-
tains a preset distance between the car and the vehicle in
front up to a speed of 150 km/h by autonomously
accelerating and decelerating. The system also warns the
driver of an imminent rear-end collision and applies
partial braking to reduce the impact speed. The new Audi
RS4 Avant combines outstanding performance with
everyday practicality. Its 450 PS V8 engine can accelerate
from 0 to 100 km/h in 4.7 seconds. Audi also introduced
the final member of the current A6 family – the third
generation of the new Audi A6 allroad quattro. With a body
that is over 20% aluminum, it is a good example of the
Audi ultra lightweight construction principle. Audi also
presented the new Audi TT RS plus, a compact sports car
featuring a high-performance engine.
Key Events

3
Key Facts Key Events
U PDATED I N FORMATION
ŠKODA premiered the four-door Citigo in Geneva, offering
all of the features ŠKODA is famous for in the smallest
possible space. The Citigo is the first model with the new
ŠKODA logo.
The SEAT brand also used the Geneva motor show to
unveil three important new models to the public. The new
SEAT Ibiza is the first of the next generation of the brand’s
flagship model. Stylistically, it is inspired by SEAT’s new
design language already seen in the IBE, IBX and IBL
concept vehicles. SEAT also presented the four-door
version of the Mii for the first time. Another highlight was
the SEAT Toledo Concept. This close-to-production concept
car marries the proportions of a classic saloon with first-
class, sporty design that is reminiscent of a coupé.
Bentley presented the EXP 9 F concept car at its stand
in Geneva. This luxurious high-performance SUV could
pave the way for a third Bentley series alongside the
Continental models and the Mulsanne.
Lamborghini unveiled probably the most extraor-
dinary open-top super sports car in its history, the
Aventador J, to the public in Geneva. Its split, extremely
flat windscreen makes it the lowest vehicle Lamborghini
has ever made.
Bugatti offered a first glimpse of the most powerful
roadster of all time – the Veyron 16.4 Grand Sport Vitesse.
A 1,200 PS engine takes the Grand Sport Vitesse from 0 to
100 km/h in 2.6 seconds. This vehicle proves once again
that the Bugatti brand is continually redefining the limits
of what is technically possible.
Volkswagen Commercial Vehicles showcased an
extreme version of the Amarok, the Amarok Canyon. This
concept car is significantly taller and wider than the series
model and is powered by a high-torque 2.0 TDI biturbo
engine with 132 kW/180 PS for maximum offroad
performance. The 4MOTION four-wheel drive can be
engaged for offroad use.
FU N DAMENTAL ECOLOGICAL REORGANIZATION OF THE
VOLKSWAGEN GROUP
Volkswagen launched a fundamental ecological reor-
ganization of the Group at the International Motor Show
in Geneva. Volkswagen is raising the bar for
environmental protection and has set itself ambitious new
sustainability targets. The Volkswagen Group also aims to
become the leading automobile manufacturer from an
ecological perspective. By 2016, the Group will have
invested €62.4 billion worldwide, plus a further €14.0
billion in China. Over two-thirds of this investment
program will flow directly and indirectly into increasingly
efficient vehicles, drives and technologies, as well as
environmentally friendly production at its plants. The
European new vehicle fleet is expected to cut CO2
emissions by 30% from 2006 to 2015 and produce less
than 120 g CO2/km for the first time in 2015. Each new
model generation will be around 10 – 15% more efficient
than the last one. By 2018, Volkswagen aims to reduce its
energy and water consumption, waste and emissions in
production by 25%. Greenhouse gas emissions in energy
supply for production are to be cut by 40% by 2020.
Around €600 million from the investment package will go
towards expanding solar, wind and hydroelectric energy.
This is the context in which test fleets of the Golf blue-
e-motion, which is powered solely by electricity, are being
launched in Belgium, France, Austria and the USA to
examine the technical and administrative aspects of e-
mobility in detail.

4
PRIZES AND AWARDS FOR THE VOLKSWAGEN GROU P
Volkswagen Group models, technologies and brands
collected a number of top prizes and awards in the first
three months of 2012.
In January, an expert jury and the readers of “ADAC
Motorwelt” awarded the Volkswagen Group the 2012
“Golden Angel” in three out of five categories. The experts
recognized the development of the multicollision brake in
the “Innovation and Environment” category. This is
considered a significant innovation in the field of
integrated safety. The “Car of the Future” went to the
Passat TSI EcoFuel, which won over the jury as the most
advanced car with regard to everyday practicality,
economy, environmental responsibility and safety. The
third win for the Volkswagen Group was secured by Audi:
the readers of “ADAC Motorwelt” voted the Audi Q3 as
their favorite from over 40 new vehicles in the “Car”
category.
In the same month, the Volkswagen Group was the
most successful company at the “What Car? Awards 2011”,
winning seven out of the 13 categories including the
overall Car of the Year title, which went to the up!. The
awards were held for the 35th time this year. The up! was
also named the best city car and received the “Safety
Award” for its five stars in the Euro NCAP crash test. The
Golf repeated its 2011 success in the small family car
segment. Audi won the coupé category for the sixth time in
a row with the Audi TT, while the Audi TT Roadster took
the open top category. The “Best Supermini” went to the
Audi A1 for the second year running. SEAT took top honors
in the “Best MPV” category with the Alhambra.
After awarding the up! five stars for its comprehensive
safety concept, the Euro NCAP consumer protection
organization also recognized its city emergency braking
function with the “Advanced Award 2011” in January
2012.
The Volkswagen Group was once again the most successful
automobile manufacturer in the “Best Cars of 2012”
reader poll conducted by the “auto motor und sport”
magazine at the end of January, receiving a total of six first
placings. Each of the ten categories were divided into an
overall and an import car ranking. The up! was the clear
winner in the “Mini Cars” category and the Audi A1
finished ahead of the Polo in the small cars segment. The
Audi A4 and Audi A5 topped the overall ranking in the mid-
range class and the ŠKODA Superb was voted the best
import car in the same category. Top honors in the “MPV”
category went to the Multivan, Sharan and Touran, while
the SEAT Alhambra took first place in the corresponding
import rankings.
The up! was awarded gold in the prestigious “iF
product design award 2012” in February for its innovative
design. The expert jury was particularly impressed by its
minimalist lines, which give the up! its sporty, compact
look.
The readers of “Auto Bild” recognized several
Volkswagen Group brands for their quality, design and
value for money in the “Best brands across all classes”
award, which was presented for the first time in March
2012. The Volkswagen Passenger Cars brand was ranked
first in terms of quality in four categories – minicars,
compact cars, compact vans and large vans – and the
winner of the design award in the compact vans and large
vans categories. Its attractive value proposition was
recognized with first place in the luxury class. Audi shone
in the quality stakes with wins in the small car, mid-range,
upper mid-range, luxury class and compact SUV categories.
80,000 readers voted the brand into first place for its
design in the mid-range, compact cars and compact SUV
segments. ŠKODA picked up four wins for its value for
money in small cars, compact cars, compact vans and mid-
range cars.

5
Key Facts Key Events
U PDATED I N FORMATION
Volkswagen Group brands won 12 categories at the “Fleet
Awards 2012”, which were also held in March. The most
prizes went to Audi, which was voted into first place five
times by around 6,000 readers of motoring magazine
“Autoflotte”. The overall award in the small car category
went to the Audi A1, the Audi A4 was selected as the best
mid-range car and the Audi A6 won the upper mid-range
category. Top honors in the luxury class went to the Audi
A8. Audi completed its haul with the award for the best
customer care in the German fleet market. The
Volkswagen Passenger Cars brand claimed victory in the
minicar segment with the up!, while Volkswagen
Commercial Vehicles secured a double win with the
Amarok in the pickups category and the Caddy in compact
delivery vehicles. The clear success of the ŠKODA Octavia
in the import rankings of the compact class category
underlined the outstanding quality of the brand. The SEAT
Alhambra was named the best import vehicle in the vans
category. Finally, Volkswagen Leasing received the “Best
Leasing Provider” award for the seventh time in a row.
The Volkswagen Group was awarded first place in five
categories by British magazine “Fleet News” in the “Fleet
News Awards 2012”. The jury, which included editors and
fleet customers, ranked the vehicles in terms of quality,
maintenance costs – including residual values – and CO2
emissions. The Passat was named the “Best Upper
Medium Car” and the “New Company Car of the Year”.
ŠKODA celebrated a double win, receiving “Best Estate
Car” for the Superb estate and “Most Improved Fleet
Manufacturer Car of the Year”. The Volkswagen Group’s
successful showing was crowned by a win in the “Best
People Carrier” category, which went to the SEAT Alhambra.
Over 120,000 “Auto Bild Allrad” readers voted six
Volkswagen Group models in various categories as the
“Four-Wheel Drive Car of the Year 2012” awards. The
Passat Alltrack won the crossover category, while the
Touareg Hybrid took first place in the hybrid section. Audi
also secured two first places. The Audi A4 quattro was
crowned the best four-wheel drive passenger car under
€40,000 and the Audi A6 quattro the best four-wheel drive
passenger car over €40,000. The ŠKODA Superb topped
the import rankings in the under-€40,000 passenger car
category. Volkswagen Commercial Vehicles also picked up
an award for the Multivan 4MOTION in the four-wheel
drive vans and buses category.
The NEOPLAN Skyliner from MAN was awarded the
prestigious “red dot award: product design 2012” in
March 2012. The international jury of experts was
particularly impressed by the exclusive “sharp cut” design
and the bright interior concept of the double-decker. The
model marries clean lines and sharp, angular glass and
metal edges with uncompromising aerodynamics to set
new standards in the premium coach segment.
VOLKSWAGEN ACTIVE IN GLOBAL COMPACT FOR TEN YEARS
The Volkswagen Group celebrated ten years of member-
ship in the United Nations Global Compact initiative in
January this year. The sustainability network aims to
shape the globalization process in a socially and environ-
mentally responsible manner by implementing human
rights, labor and environmental standards around the
world. The Volkswagen Group has been a particularly
active member of the program since joining in 2002. We
make extensive use of this alliance as a forum for learning
and discussion and are involved in the Global Compact
Advisory Council at a global level, as well as the Deutsches
Global Compact Netzwerk in Germany. Volkswagen was
the first automobile manufacturer to establish binding
standards for working conditions at all Group locations
worldwide. In Germany, the Group cooperates closely with
the German Nature and Biodiversity Conservation Union
(NABU) through projects and dialog.
6
I NTERNATIONAL FRAMEWORK AGREEMENT SIGNED
The Executive Board and Works Council of MAN SE and the
International Metalworkers’ Federation (IMF) signed a
Joint Declaration on Human Rights and Working
Conditions in the MAN Group. The agreement outlines
MAN’s commitment to basic human and employee rights
and aims to create an authoritative minimum standard
that all employees around the world can refer to, as well as
ethical principles to guide the actions of companies and
employees.
OFFICIAL START TO VEHICLE PRODUCTION IN MALAYSIA
The Volkswagen Group continued to expand its activities in
the ASEAN region. Together with its partner DRB-HICOM,
the Volkswagen Group Malaysia officially started
production of the Passat on a semi knocked-down basis in
Pekan, Malaysia, in mid-March 2012. The company also
laid the foundation stone for the next step – a new
production facility where the Jetta and Polo will be
produced for the Malaysian market on a CKD basis.
Volkswagen and DRB-HICOM plan to progressively expand
local production in Malaysia.
40 MI LLION VEHICLES PRODUCED I N WOLFSBU RG
The forty-millionth vehicle to be produced in Wolfsburg
left the factory on March 23, 2012. The Wolfsburg plant
currently produces the Golf, Golf Plus, Touran and Tiguan
models and has a daily manufacturing capacity of over
3,800 units.
AN NUAL GENERAL MEETI NG
The 52nd Annual General Meeting and the 11th Special
Meeting of Preferred Shareholders of Volkswagen AG were
held at the Congress Center Hamburg on April 19, 2012.
With 91.9% of the voting capital present, the ordinary
shareholders of Volkswagen AG formally approved the
actions of the Board of Management and the Supervisory
Board, the creation of authorized capital and the
corresponding amendment to the Articles of Association,
and the authorization to acquire and use treasury shares.
They also elected PricewaterhouseCoopers AG Wirtschafts-
prüfungsgesellschaft as the auditors of the financial
statements for fiscal year 2012 and as the auditors to
review the condensed consolidated financial statements
and interim management report for the first six months of
2012. The scheduled terms of office of Prof. Dr. Ferdinand
K. Piëch and Dr. Michael Frenzel as members of
Volkswagen AG’s Supervisory Board members expired at
the end of the Annual General Meeting. The Annual
General Meeting elected Ms. Ursula M. Piëch to the
Supervisory Board for a full term of office as a shareholder
representative. Prof. Dr. Ferdinand K. Piëch was reelected
to the Supervisory Board, likewise for a full term of office.
The Annual General Meeting also resolved to distribute a
dividend of €3.00 per ordinary share and €3.06 per
preferred share for fiscal year 2011.
36.5% of the preferred share capital was represented
at the Special Meeting of Preferred Shareholders. A
proposal had been made to this meeting to approve the
authorizing resolution by the Annual General Meeting on
the same day on the creation of authorized capital and the
corresponding amendment to the Articles of Association.
This was approved by a majority of 87.3%.
The results of the votes of the shareholders’ meetings
can be accessed on the Internet at www.volks-
wagenag.com/ir.
SUPERVISORY BOARD MATTERS
Following the shareholders’ meetings, the Supervisory
Board of Volkswagen AG elected Prof. Dr. Ferdinand K.
Piëch as Chairman of the Supervisory Board for a full term
of office and Berthold Huber as Deputy Chairman at its
constituent meeting on April 19, 2012.
Following the election of employee representatives on
the Supervisory Board by over 800 Volkswagen Group
delegates on March 22, 2012, Mr. Uwe Fritsch, Chairman
of the Works Council at the Braunschweig plant, was
elected as a member of the Supervisory Board of
Volkswagen AG for the first time to succeed Mr. Peter
Jacobs. The other employee representatives on the
Supervisory Board remain as members of this governing
body.

7
VOLKSWAGEN SHAR ES
2012 started significantly better on the capital markets
than had been expected at the end of 2011. The threat of
the crisis in Greece spreading to further members of the
eurozone had caused uncertainty among market partic-
ipants at the start of the reporting period. However, the
European Central Bank’s additional liquidity injection
calmed the global financial markets which, together with
positive economic indicators, led to share prices increas-
ing. Doubts emerging about the recovery package for
Greece only slowed the recovery on the equity markets
temporarily at the beginning of March 2012. Good
corporate news and the agreement reached on a haircut
for Greek debt caused share prices to increase again, and
the DAX almost made good on the previous summer’s
slump in prices.
On March 31, 2012, the DAX closed at 6,947 points, up
17.8% compared with the end of 2011. At the end of the
reporting period, the DJ Euro STOXX Automobile stood at
320 points, 28.1% higher than at the end of 2011.
In the first quarter of 2012, Volkswagen AG’s preferred
share and ordinary share prices were able to participate in
the upturn on the equity markets and initially recorded
significant increases. The share prices then moved side-
ways amid substantial volatility from the beginning of
February to the middle of March. After the announcement
of the results for fiscal year 2011, which were largely in
line with the market expectations, both share classes lost
ground for a short while, before trending upwards slightly
for several days. However, reports of demand weakening
in the Chinese passenger car market as well as the
smoldering nuclear dispute with Iran and the associated
rises in oil prices unsettled investors, causing automotive
share prices to retreat towards the end of March 2012.
Volkswagen AG’s ordinary share price registered a slightly
more positive performance than the preferred shares in
the first quarter.
Volkswagen’s preferred shares recorded their highest
daily closing price for the reporting period (€144.75) on
February 21, 2012. The shares traded at their low of
€119.80 on the first trading day of 2012. At the end of
March 2012, the ordinary shares closed at €131.85,
13.9% higher than the 2011 closing price. Volkswagen
AG’s ordinary shares reached their highest daily closing
price of €130.95 on March 15, 2012. They also recorded
their low of €106.20 at the same time as the preferred
shares on January 2, 2012. At the end of March 2012, the
ordinary shares closed at €120.90, up 16.6% compared
with the end of 2011.
Information and explanations on earnings per
share can be found in the notes to the consolidated
interim financial statements. Additional Volkswagen share
data, plus corporate news, reports and presentations can
be downloaded from our website at www.volks-
wagenag.com/ir.
SHARE PRICE DEVELOPMENT FROM DECEMBER 2010 TO MARCH 2012
Index based on month- end pr ices: December 31, 2010 = 100
80
70
90
110
100
60
Volkswagen ordinary shares
Volkswagen preferred shares
DAX
DJ Euro STOXX Automobile
120
130
D J F M A M J J A S O N D J F M
Volkswagen Shares

8
GEN ERAL ECONOMIC DEVELOPMENT
The global economy continued to grow in the first quarter
of 2012, albeit at a slower pace than in 2011 as a whole.
While most emerging markets continued to see strong
growth, the industrialized economies remained muted.
Economic activity in Western Europe slowed even
more during the reporting period. Many countries,
particularly in Southern Europe, increasingly showed
signs of recession. Economic uncertainty remained high
against the backdrop of the ongoing sovereign debt crises
and rising energy prices.
The German economy performed better than expected
from January to March 2012. Domestic demand proved to
be an important economic driver as export growth slowed.
The labor market continued to develop positively.
The economic upturn in Central and Eastern Europe
has also slowed in recent months.
In South Africa, the effects of weaker global economic
growth were partially offset by strong domestic demand.
The US economy continued to expand at a moderate
pace in the reporting period, supported by the ongoing
highly expansionary monetary policy and the improved
situation on the labor market. The robust growth in
Mexico continued.
Economic expansion in Brazil and Argentina lagged
well behind the prior-year period in the first three months
of 2012. While inflation fell in Brazil over the past few
months, substantial inflationary pressure continued in
Argentina.
GDP growth slowed slightly in China and India despite
ongoing strong economic growth in the reporting period.
The Japanese economy continued to recover over the past
months. However, growth there was curbed by the slower
global economy and the strong yen.
EXCHANGE RATE MOVEMENTS FROM DECEMBER 2010 TO MARCH 2012
Index based on month- end pr ices: December 31, 2010 = 100
110
105
100
96
90
85
EUR to USD
EUR to JPY
EUR to GBP
115
D J F M A M J J A S O N D J F M
Business Development

9
Business Development Results of Operations, Financial Position and Net Assets Outlook
MANAGEMENT REPORT
DEVELOPMENT OF THE MARKETS FOR PASSENGER CARS AN D LIGHT COMMERCIAL VEHICLES
Worldwide new passenger car and light commercial
vehicle registrations rose year-on-year in the first quarter
of 2012. Growth was recorded in all regions except
Western Europe, with double-digit increases registered in
the Central and Eastern Europe, North America and Asia-
Pacific regions.
As expected, demand in Western Europe was down on
the prior-year quarter, when some consumers were still
able to take advantage of government economic stimulus
programs. Sales figures declined sharply in France and
Southern Europe in particular as a result of the weak
economy, among other factors.
In Germany, the number of new registrations was up
slightly on the previous year. This was driven solely by
sales to business customers.
Demand in Central and Eastern Europe continued to
increase in the first three months of 2012. Russia
recorded by far the highest absolute increase; however,
growth there slowed slightly as against the previous year.
The positive trend in the South African market
continued in the period from January to March 2012,
albeit at a somewhat slower pace.
North America again recorded healthy automobile
sales following on from the positive performance in 2011.
The US market continued to rebound appreciably, mainly
as a result of higher consumer confidence and increased
replacement demand. The Canadian and Mexican
markets also grew overall in the first three months of
2012.
In South America, new passenger car and light
commercial vehicle registrations rose slightly in the
reporting period on the strong prior-year quarter. The
Brazilian market fell just short of last year’s record volume
due to a drop in consumer confidence, among other
things. By contrast, demand in Argentina was significantly
above the already very high prior-year period, despite the
economic slowdown. High inflation prompted consumers
to invest in tangible assets such as cars to protect
themselves against a loss of purchasing power.
Global demand for passenger cars in the period from
January to March 2012 was primarily driven by the Asia-
Pacific region. China’s positive market trend continued to
slow in the reporting period, mainly as a result of weaker
global growth and rising fuel prices. The Japanese
automotive
market saw extremely strong growth following the
dramatic slump in the wake of the natural disasters in the
prior-year period. The industry also benefited there from
government incentive programs for fuel-efficient vehicles.
The Indian market recorded significant growth in the first
quarter of 2012. Sales by domestic manufacturers were
positively influenced by the launch of a large number of
new models.
DEVELOPMENT OF THE MARKETS FOR TRUCKS AND BUSES
From January to March 2012, global demand for mid-
sized and heavy trucks with a gross weight of more than six
tonnes declined year-on-year.
New registrations were noticeably below the prior-year
level in Western Europe, mainly as a result of the
uncertainty caused by the European sovereign debt crisis.
Russia recorded a sharp increase in unit sales
compared with the prior-year period, continuing its
recovery following heavy declines during the financial
crisis.
The USA and the other NAFTA countries recorded very
positive market growth in the reporting period on the back
of the positive trend in the economic sectors concerned.
The number of new registrations in the South
American market did not match the prior-year level in the
first quarter of 2012. The continent’s largest market,
Brazil, was also down considerably year-on-year due to the
introduction of new emissions standards.
China, by far the world’s largest market, fell well short
of the previous year’s figures as a result of the slowdown in
the heavy trucks segment.
India came close to repeating its high prior-year level.
Global demand for buses developed positively from
January to March 2012 compared with the prior-year
period.
DEMAN D FOR FI NANCIAL SERVICES
The markets for automotive financial services continued
to record strong demand in the first three months of 2012.
The European markets experienced higher demand for
automotive-related financial services from business
customers in particular. The leasing sector in Germany
continued to expand in both the commercial vehicle and
passenger car segments. The markets in North and South
America were also up year-on-year in the reporting period
and the Asia-Pacific region recorded significant growth.

10
VOLKSWAGEN GROU P DELIVERI ES
The Volkswagen Group delivered 2,208,622 vehicles to
customers worldwide in the period from January to March
2012, 220,424 or 11.1% more than in the prior-year
period. The chart on page 12 shows that the delivery
figures were higher in all three months of the reporting
period than in the same months of the previous year.
Separate details of deliveries of passenger cars and light
commercial vehicles and of trucks and buses are provided
in the following.
VOLKSWAGEN GROU P DELIVERI ES
FROM JAN UARY 1 TO MARCH 31 2012 2011 %
Passenger cars and
light commercial
vehicles 2,157,382 1,969,133 + 9.6
Trucks and buses 51,240 19,065 x
Total 2,208,622 1,988,198 + 11.1
PASSENGER CAR AN D LIGHT COMMERCIAL VEHICLE DELIVERI ES WORLDWI DE
In the first quarter of 2012, Volkswagen Group deliveries
were at an all-time high, with 2,157,382 passenger cars
and light commercial vehicles sold, an increase of 9.6%
on the prior-year figure. As the global automotive market
only grew by 6.8%, we expanded our market position and
gained additional market share in the same period.
Virtually all Group brands contributed to this success.
Volkswagen Passenger Cars (+10.5%), Audi (+10.8%),
ŠKODA (+11.8%) and Volkswagen Commercial Vehicles
(+7.9%) recorded the best first quarter in their history.
The Group recorded the highest growth rates in Central
and Eastern Europe, North America and Asia-Pacific.
The table on the next page gives an overview of
passenger car and light commercial vehicle deliveries to
customers by market and of the respective passenger car
market shares in the reporting period.
Sales trends in the individual markets are as follows.
Deliveries in Europe/Remaining markets
In the period from January to March 2012, the
Volkswagen Group delivered 1.2% fewer vehicles to
customers in Western Europe than in the previous year but
outperformed the market as a whole, which declined by
8.3% in the same period. Vehicles sold in Western Europe
accounted for 36.6% (40.6%) of the Group’s global
deliveries of passenger cars and light commercial
vehicles. Our sales figures were down on the previous year
in virtually all major markets in this region, apart from
Germany and the United Kingdom. Demand for ŠKODA,
Volkswagen Commercial Vehicles, Bentley and Lamborghini
models developed positively, with all these brands
exceeding the prior-year figures. In the first three months
of 2012, the Tiguan, Passat estate, Audi A6, ŠKODA Octavia
estate, ŠKODA Yeti, SEAT Alhambra and Multivan/
Transporter models recorded the strongest demand in
Western Europe. The new up!, Beetle saloon, Golf Cabriolet
and Audi Q3 models were also very popular with customers.
The Volkswagen Group in Western Europe increased its
share of the passenger car market to 23.5% (21.6%).
Demand for Volkswagen Group models in Germany
continued to rise in the first quarter of 2012. The number
of vehicles sold was up 5.7% on the prior-year figure. The
Tiguan, Polo, Golf estate, Audi A1, Audi A6, ŠKODA Fabia
estate, ŠKODA Yeti, ŠKODA Octavia estate, ŠKODA Superb
estate, SEAT Ibiza, SEAT Alhambra and Multivan/
Transporter models recorded the highest growth rates.
The Volkswagen Group’s share of the passenger car
market in Germany climbed to 36.5% (35.8%) in the first
three months of 2012.
From January to March 2012, the Volkswagen Group
delivered 35.1% more vehicles to customers in Central
and Eastern Europe than in the corresponding period of
the previous year. This is primarily attributable to the
ongoing high demand for Group models in the Russian
market, where we sold 77.3% more vehicles year-on-year.
Demand for Group vehicles was also higher in the other
relevant markets of Central and Eastern Europe. Almost
all Volkswagen Passenger Cars models, the Audi A3, Audi
A6, all ŠKODA models, the SEAT Altea, SEAT Alhambra, the
Multivan/Transporter and the Caddy models were
particularly popular.
The high demand for Volkswagen Group models also
continued in the local South African passenger car market
in the first three months of 2012. Deliveries to customers
were up 12.8% year-on-year, while the share of the
passenger car market held by the Group in South Africa
increased to 22.6% (22.2%).

11
Business Development Results of Operations, Financial Position and Net Assets Outlook
MANAGEMENT REPORT
PASSENGER CAR AN D LIGHT COMMERCIAL VEH ICLE DELIVERI ES TO CUSTOMERS BY MARKET FROM JAN UARY 1 TO MARCH 31 1
D E L I V E R I E S ( U N I T S ) C H A N G E
S H A R E O F PA S S E N G E R C A R
M A R K E T ( % )
2012 2011 (%) 2012 2011
Europe/Remaining markets 1,022,808 982,607 + 4.1
Western Europe 789,512 799,149 – 1.2 23.5 21.6
of which: Germany 282,413 267,295 + 5.7 36.5 35.8
United Kingdom 120,469 114,984 + 4.8 19.5 18.2
France 74,831 81,472 – 8.2 14.1 11.2
Italy 57,331 69,313 – 17.3 13.7 13.1
Spain 52,003 57,132 – 9.0 24.3 24.3
Central and Eastern Europe 147,440 109,107 + 35.1 15.8 13.2
of which: Russia 65,994 37,214 + 77.3 10.8 7.2
Czech Republic 20,172 19,921 + 1.3 43.3 45.3
Poland 19,520 16,251 + 20.1 23.3 19.9
Remaining markets 85,856 74,351 + 15.5
of which: South Africa 28,057 24,863 + 12.8 22.6 22.2
Turkey 21,492 25,181 – 14.6 18.0 14.7
North America2 179,082 143,859 + 24.5 4.4 3.9
of which: USA 124,427 92,829 + 34.0 3.6 3.0
Mexico 38,114 36,480 + 4.5 16.3 17.3
Canada 16,541 14,550 + 13.7 4.6 4.4
South America 229,397 220,883 + 3.9 19.3 19.0
of which: Brazil 164,543 166,649 – 1.3 22.4 23.3
Argentina 51,294 42,960 + 19.4 25.5 22.3
Asia-Pacific 726,095 621,784 + 16.8 11.0 10.6
of which: China 633,861 548,461 + 15.6 19.7 17.9
India 34,132 28,075 + 21.6 4.5 4.3
Japan 23,169 16,776 + 38.1 1.6 1.8
Worldwide 2,157,382 1,969,133 + 9.6 12.2 11.9
Volkswagen Passenger Cars 1,355,392 1,226,151 + 10.5
Audi 346,137 312,532 + 10.8
ŠKODA 242,732 217,124 + 11.8
SEAT 80,119 90,652 – 11.6
Bentley 1,759 1,200 + 46.6
Lamborghini 505 293 + 72.4
Volkswagen Commercial Vehicles 130,731 121,175 + 7.9
Bugatti 7 6 + 16.7
1 Deliveries and market shares for 2011 have been updated to reflect subsequent statistical trends.
2 Overall markets in the USA, Mexico and Canada include passenger cars and light trucks.

12
VOLKSWAGEN GROU P DELIVERI ES BY MONTH
Vehicles in thousands
800
700
600
500
J F M A M J J A S O N D
900
400
2012
2011
Deliveries in North America
Volkswagen Group sales in the US market for passenger
cars and light commercial vehicles were up 34.0% year-
on-year in the first quarter of 2012, outperforming the
positive trend in the overall market. Particularly strong
demand was recorded for the new Passat along with the
Golf, Tiguan, Eos, Audi A6 and Audi Q5 models.
In the reporting period, we delivered 13.7% more
vehicles to customers in Canada than in the previous year.
The Golf, Tiguan, Audi A4 and Audi Q5 models recorded
the highest growth rates. The new Passat also saw strong
demand in Canada.
In the Mexican passenger car market, the Volkswagen
Group sold 4.5% more vehicles year-on-year. Models that
were very popular among customers included the Gol, the
Voyage and the SEAT Ibiza.
Deliveries in South America
In the first three months of this year, the Volkswagen
Group delivered 3.9% more vehicles to customers in the
South American passenger car market than in the same
period of the previous year.
The decline in Brazil that started at the end of 2011
due to increased customer uncertainty continued. Sales
were down 1.3% year-on-year in this market in the
reporting period. Demand for the SpaceFox, Voyage and
new Jetta models was strong. The total delivery figures also
include the Amarok, Saveiro and T2 light commercial
vehicles. We sold 0.4% more of these models in Brazil
than in the previous year. The Group’s passenger car
market share in Brazil was 22.4% (23.3%).
In Argentina, the Volkswagen Group increased
deliveries to customers in the period from January to
March 2012 by 19.4% year-on-year, clearly out-
performing the passenger car market as a whole. High
demand for the Fox, SpaceFox and Gol models was the
main driver. The Volkswagen Group’s share of the
passenger car market in Argentina increased to 25.5%
(22.3%).
Deliveries in the Asia-Pacific region
Passenger car markets in the Asia-Pacific region grew by
12.6% during the reporting period, up on the final
quarter of 2011. The Volkswagen Group increased sales in
this region by 16.8% compared with the prior-year figure,
outperforming the market as a whole. This can be
attributed above all to continuing strong demand for
Group models in the Chinese passenger car market. We
sold 15.6% more vehicles there as against the previous
year. Virtually all models experienced stronger demand
than in the same period of 2011. With a market share of
19.7% (17.9%), we expanded our leadership of the highly
competitive Chinese passenger car market.
The Volkswagen Group also benefited from the
Japanese market’s recovery and its deliveries to customers
increased by 38.1% year-on-year in the period from
January to March 2012. There was increased demand
here for the Polo, Passat estate, Sharan, Audi A1, Audi A3
Sportback and Audi A6 models.
The Volkswagen Group also sold more vehicles in the
remaining passenger car markets of the Asia-Pacific
region than in the previous year. In India, demand for
Group models was up 21.6% year-on-year. The Polo
models, the new Jetta and the ŠKODA Rapid were
particularly popular.

13
Business Development Results of Operations, Financial Position and Net Assets Outlook
MANAGEMENT REPORT
DELIVERI ES OF TRUC KS AN D BUSES
From January to March 2012, the Volkswagen Group
delivered 51,240 trucks and buses to customers world-
wide, with trucks accounting for 46,166 units. Sales
figures for the MAN brand are not included for the prior-
year period, because MAN was only consolidated on
November 9, 2011. The Scania brand delivered 16,238
units to customers, a decline of 14.8% on the previous year.
In Western Europe, we sold 17,203 vehicles in the first
quarter of 2012, of which 16,386 were trucks. The
economic upturn slowed significantly in the reporting
period, due to the uncertainties on the financial markets
and the ongoing European sovereign debt crisis. By
contrast, we sold a total of 5,787 vehicles in the markets of
Central and Eastern Europe. Trucks accounted for 5,680
units. In the remaining European markets, we delivered
4,228 vehicles to customers, 3,628 of which were trucks.
We sold 483 units in the North American markets
(including 128 trucks) in the reporting period. In this
market, the Group benefited above all from the positive
trend in the relevant economic sectors and the improved
situation on the labor market.
In South America, demand for Volkswagen Group
trucks and buses amounted to 21,023 vehicles, 18,138 of
which were trucks. We delivered 16,011 trucks and 2,470
buses in the Brazilian market. As expected, the intro-
duction of the Euro 5 emission standard weakened demand
for trucks in the first quarter of 2012.
Sales to customers in the markets of the Asia-Pacific
region comprised 2,516 units, 2,206 of which were trucks.
We delivered 734 trucks and 15 buses in China.
GROU P FI NANCIAL SERVICES
Products and services from Volkswagen Financial Services
continued to enjoy strong demand in the reporting period.
From January to March 2012, 848 thousand new
financing, leasing, service and insurance contracts were
signed worldwide, a 17.9% increase on the previous year.
The total number of contracts as of March 31, 2011 was
8.6 million, up 10.7% on the prior-year period.
In Europe, 583 thousand new contracts were signed
between January and March 2012 (+10.1%). The total
number of contracts there rose to 6.3 million, up 7.9%
year-on-year. The number of financing and leasing
contracts was 3.7 million (+5.6%).
As of March 31, 2012, the number of contracts in
North America grew by 10.7% to 1.3 million, 1.2 million
of which were attributable to the customer finance/leasing
area. The number of new contracts signed amounted to
144 thousand (+32.7%).
In South America, the total number of contracts
during the reporting period grew by 13.5% compared
with the previous year to 625 thousand; almost all of these
were attributable to the customer finance/leasing area.
At the end of March 2012, the total number of contracts
in the Asia-Pacific region was 360 thousand, of which 291
thousand related to customer finance/leasing.
TRUCK AN D BUS DELIVERIES TO CUSTOMERS BY MARKET FROM JANUARY 1 TO MARCH 31*
D E L I V E R I E S ( U N I T S ) C H A N G E
2012 2011 (%)
Europe/Remaining markets 27,218 13,306 x
Western Europe 17,203 7,278 x
Central and Eastern Europe 5,787 2,596 x
Remaining markets 4,228 3,432 + 23.2
North America 483 89 x
South America 21,023 4,339 x
of which: Brazil 18,481 3,351 x
Asia-Pacific 2,516 1,331 + 89.0
of which: China 749 329 x
Worldwide 51,240 19,065 x
Scania 16,238 19,065 – 14.8
MAN 35,002 – x
* The MAN brand’s deliveries are included as from November 9, 2011.

14
WORLDWI DE DEVELOPMENT OF I NVENTORI ES
Global inventories held by Group companies and the
dealer organization at the end of the first quarter of 2012
were up compared with the levels recorded at the end of
2011 and as of March 31, 2011.
U N IT SALES, PRODUCTION AN D EMPLOYEES
In the first three months of 2012, the Volkswagen Group
delivered 2,259,542 vehicles to the dealer organization
worldwide, surpassing the prior-year figure by 11.3%.
The sharp increase in demand for Group models in the
USA, Russia and in the Chinese passenger car market
caused sales outside Germany to increase by 12.8%.
Domestic sales increased by 2.5% compared with the
prior-year figure. Vehicles sold in Germany accounted for
14.0% (15.1%) of the Group’s overall sales.
The Volkswagen Group produced 2,317,497 vehicles
in the reporting period, 12.2% more than in the same
period of 2011. 651,642 vehicles were produced in
Germany, 7.5% more than in the previous year; domestic
sales accounted for 28.1% of the total (29.4%).
The Volkswagen Group had 494,907 active employees on
March 31, 2012. In addition, 4,959 employees were in the
passive phase of their early retirement and 13,157 young
people were in apprenticeships. At the end of the
reporting period, a total of 513,023 people were employed
at the Volkswagen Group worldwide, an increase of 2.2%
compared with year-end 2011. This rise is mainly due to
the establishment of new production facilities and
expanded production volumes in Germany and abroad.
226,195 people were employed in Germany (+0.6%),
accounting for 44.1% of the total headcount.
OPPORTU N ITY AN D RISK REPORT
There were no significant changes to the Volkswagen
Group’s opportunity and risk position compared with the
information contained in the Risk Report and Report on
Expected Developments chapters of the 2011 Annual
Report.
15
Business Development Results of Operations, Financial Position and Net Assets Outlook
MANAGEMENT REPORT
Following the completion of the mandatory offer on
November 9, 2011, we increased our stake in MAN SE at
the end of 2011 and increased it further to 68.94% of the
share capital as of the end of the first quarter of 2012.
RESU LTS OF OPERATIONS OF THE GROU P
At €47.3 billion, the Volkswagen Group’s sales revenue for
the first quarter exceeded the prior-year figure by 26.3%,
primarily due to volume-related factors and the consol-
idation of Porsche Holding Salzburg and MAN SE as of
March 1, 2011 and November 9, 2011 respectively. The
proportion of the Group’s sales revenue generated outside
Germany was 77.4% (77.6%).
The Volkswagen Group’s gross profit improved by
25.2% in the first three months of 2012 to €8.9 billion.
The positive effects of higher volumes and improved
product costs were partly offset by high write-downs
relating to the purchase price allocation for MAN in the
period shortly following its acquisition. The cost of sales
grew slightly faster than sales revenue, giving a gross
margin of 18.9% (19.1%).
The Volkswagen Group generated an operating profit
of €3.2 billion in the first quarter of 2012, which
represents an increase of 10.2%. At 6.8%, the operating
return on sales was down year-on-year, primarily due to
negative effects from the write-downs relating to the
purchase price allocation for MAN and Porsche Holding
Salzburg (7.8%).
At €4.3 billion, the Volkswagen Group’s profit before
tax in the reporting period was €2.1 billion higher than in
the previous year. Profit after tax improved by €1.5 billion
to €3.2 billion. Effects from the remeasurement of options
relating to Porsche Zwischenholding GmbH in the amount
of €0.6 billion did not have any impact on the tax expense.
RESU LTS OF OPERATIONS IN THE AUTOMOTIVE DIVISION
The Automotive Division generated sales revenue of €42.6
billion, 27.1% higher than in the same period last year. In
addition to increased volumes, model and country mix
improvements in particular also had a positive impact. In
the comparison with the previous year’s figures, it should
be noted that Porsche Holding Salzburg and MAN SE were
first consolidated from March 1, 2011 and November 9,
2011 respectively. As our Chinese joint ventures are
accounted for using the equity method, the Group’s
positive business growth in the Chinese passenger car
market is mainly reflected in the Group’s sales revenue
only by deliveries of vehicles and vehicle parts. The
Financial Services Division generated gross profit of €7.8
billion (€6.2 billion).
The Automotive Division’s distribution expenses
increased by 31.7%. The ratio of distribution expenses to
sales revenue was slightly higher than in the first quarter
of 2011. Administrative expenses rose by 47.3% to €1.1
billion. The ratio of administrative expenses to sales
revenue was also up slightly on the previous year. In
addition to increased volumes, the automobile trading
business of Porsche Holding Salzburg, MAN Commercial
Vehicles and Power Engineering had a significant effect on
the prior-year comparison. Other operating income fell to
€1 million (€85 million), mainly as a result of negative
exchange rate effects.
In the first three months of 2012, the Automotive
Division generated an operating profit of €2.9 billion,
exceeding the prior-year figure by €0.3 billion. Higher
volumes had a particularly positive effect on earnings. The
extremely strong business performance of our Chinese
joint ventures is not reflected in the Group’s operating
profit, as these are accounted for using the equity method.
Negative effects from write-downs required for purchase
Results of Operations, Financial Position and Net Assets

16
price allocation in the Trucks and Buses, Power
Engineering Business Area increased significantly year-
on-year; these are included in the operating profit.
At €1.1 billion (€–0.7 billion), the financial result
significantly exceeded the previous year’s figure. It was
lifted by the measurement of derivative financial
instruments used for currency hedging at the reporting
date and improved income from equity-accounted
investments included in the consolidated financial
statements, especially the Chinese joint ventures and
Porsche Zwischenholding GmbH. The updating of the
underlying assumptions used in the valuation models for
measuring the put/call rights relating to Porsche
Zwischenholding GmbH also had a positive effect on the
financial result. Income from interests held in Suzuki and
MAN included in the prior-year period are not included in
the first quarter of 2012 due to the switch from the equity
method to fair value in the measurement of Suzuki shares,
and from the equity method to consolidation for MAN SE.
Results of operations in the Passenger Cars and Light
Commercial Vehicles Business Area and the Trucks and Buses,
Power Engineering Business Area from January 1 to March 31
RESU LTS OF OPERATIONS IN THE FI NANCIAL SERVICES DIVISION
Sales revenue in the Financial Services Division amounted
to €4.7 billion (€3.9 billion) in the first quarter of 2012.
The increase is primarily attributable to the inclusion of
Porsche Holding Salzburg’s financial services business as
from March 1, 2011.
Gross profit rose by 18.3% to €1.1 billion.
Higher distribution and administrative costs as a
result of increased volumes saw operating profit improve
by a slower 12.8% to €0.3 billion.
FI NANCIAL POSITION OF THE GROU P
The Volkswagen Group’s gross cash flow in the first three
months of 2012 amounted to €5.8 billion, €1.5 billion
more than in the previous year. Funds tied up in working
capital increased by €2.5 billion to €4.4 billion. As a result,
cash flows from operating activities declined to €1.5
billion (€2.5 billion).
In the first quarter of 2012, investing activities
attributable to the Volkswagen Group’s operating activities
declined by 34.8% to €2.7 billion despite a year-on-year
increase in investments in property, plant and equipment.
This was due to cash outflows for the acquisition of
Porsche Holding Salzburg included in the prior-year
figure. The increase in the equity interest in MAN SE of
approximately €1.4 billion is reported in financing
activities as a capital transaction with noncontrolling
interests.
Cash and cash equivalents in the Volkswagen Group as
reported in the cash flow statement amounted to €19.1
billion (€20.4 billion) as of March 31, 2012.
The Group’s net liquidity was €– 68.4 billion, €3.6
billion lower than on December 31, 2011.
FI NANCIAL POSITION IN THE AUTOMOTIVE DIVISION
Gross cash flow in the Automotive Division totaled €4.8
billion in the first three months of 2012, an increase of
€1.3 billion year-on-year. Growth factors, among other
things, led to funds tied up in working capital of €1.9
billion; cash inflows of €1.5 billion were recorded in the
prior-year period. As a result, cash flows from operating
activities decreased to €2.9 billion (€5.1 billion).
Cash outflows totaling €2.5 billion (€4.5 billion) arose
from investing activities attributable to operating
activities. At €1.7 billion, investments in property, plant
and equipment in the Automotive Division in the first
quarter of 2012 exceeded the prior-year figure by €0.8
billion. The ratio of investments in property, plant and
equipment (capex) to sales revenue was 4.0% (2.8%) in
the reporting period, significantly higher than in the
previous year. We invested primarily in our production
facilities, the switch to the Modular Transverse Toolkit, in
models to be launched in 2012 and 2013, and in the
ecological focus of our model range. By contrast, investing
activities in the first quarter of 2011 were dominated by
the acquisition of Porsche Holding Salzburg and the
investment in SGL Carbon SE.
The Automotive Division’s net cash flow in the
reporting period declined by €0.2 billion compared with
the previous year to €0.4 billion due to higher investment
in property, plant and equipment and an increase in funds
tied up in working capital.
€ million 2012 2011
Passenger Cars and Light
Commercial Vehicles Business Area
Sales revenue 36,497 31,208
Gross profit 6,949 5,697
Operating profit 2,818 2,315
Trucks and Buses, Power Engineering
Business Area
Sales revenue 6,133 2,345
Gross profit 883 510
Operating profit 48 292

17
Business Development Results of Operations, Financial Position and Net Assets Outlook
MANAGEMENT REPORT
OPERATI NG PROFIT BY QUARTERS
Volkswagen Group in € mil l ion
1,500
1,000
500
2,000
Q2 Q3Q1 Q4
0
2012
2011
2,500
3,000
3,500
Since the consolidation of MAN, further increases in
Volkswagen AG’s stake have been reported in financing
activities as capital transactions with noncontrolling
interests. Further interests in MAN SE totaling approx-
imately €1.4 billion were acquired in the first quarter of
2012.
Net liquidity in the Automotive Division amounted to
€15.8 billion as of March 31, 2012, €1.2 billion lower than
at year-end 2011.
Financial position in the Passenger Cars and Light Commercial
Vehicles Business Area and the Trucks and Buses, Power
Engineering Business Area from January 1 to March 31 € million 2012 2011
Passenger Cars and Light
Commercial Vehicles Business Area
Gross cash flow 4,285 3,307
Change in working capital – 1,277 1,590
Cash flows from operating activities 3,008 4,897
Cash flows from investing activities
attributable to operating activities – 2,153 – 4,452
Net cash flow 855 446
Trucks and Buses, Power Engineering
Business Area
Gross cash flow 548 276
Change in working capital – 615 – 53
Cash flows from operating activities – 67 223
Cash flows from investing activities
attributable to operating activities – 370 – 13
Net cash flow – 437 209
FI NANCIAL POSITION IN THE FI NANCIAL SERVICES DIVISION
Gross cash flow in the Financial Services Division was €1.0
billion at the end of the first quarter of 2012, 25.8% up on
the prior-year figure due to earnings-related factors.
Funds tied up in working capital increased by €2.5 billion
(€3.4 billion) due to volume-related factors. Investing
activities attributable to operating activities amounted to
€209 million.
The Financial Services Division’s negative net liquidity,
which is common in the industry, widened to €–84.2
billion (€–81.8 billion) as against year-end 2011. This is
mainly attributable to business expansion.
CONSOLI DATED BALANCE SHEET STRUCTURE
At €264.9 billion, the Volkswagen Group’s total assets as of
March 31, 2012 were 4.5% higher as against year-end
2011. This was mainly driven by organic growth in the
Automotive Division, among other factors. The Volkswagen
Group’s equity ratio declined slightly to 24.7% (25.0%).
AUTOMOTIVE DIVISION BALANCE SHEET STRUCTURE
Purchase price allocation for the assets acquired and
liabilities assumed of the MAN Commercial Vehicles and
Power Engineering subgroups is provisional as of the date
of these interim financial statements.
At the end of the first quarter of 2012, the Automotive
Division’s noncurrent assets were 0.7% higher than at the
end of 2011. The carrying amount of property, plant and
equipment rose by 1.2%. Current assets were 10.7%
higher than at December 31, 2011. Within the current

18
assets item, the increase in business led to a rise in
inventories and receivables. At €16.9 billion, cash and
cash equivalents exceeded the prior-year figure (€14.5
billion).
The Automotive Division’s equity attributable to
shareholders of Volkswagen AG amounted to €49.2 billion
as of March 31, 2012; this represents an increase of 4.8%
as against year-end 2011. In particular, the good earnings
growth had a positive effect here. Actuarial losses were
offset by positive effects of roughly the same amount from
the measurement of derivatives. Noncontrolling interests,
which chiefly relate to noncontrolling interests in Scania
and MAN, decreased due to the increase in the stake in
MAN SE. Equity amounted to €53.8 billion (€52.5 billion)
at the end of the reporting period. Noncurrent liabilities
were up 11.9% as against December 31, 2011. Current
liabilities were down slightly (–0.3%). The figures for the
Automotive Division also contain the elimination of
intragroup transactions between the Automotive and
Financial Services divisions. As the current financial
liabilities for the primary Automotive Division were lower
than the loans granted to the Financial Services Division, a
negative amount was disclosed for the reporting period.
At €153.0 billion, the Automotive Division’s total assets
were 4.8% higher than at December 31, 2011.
Balance sheet structure in the Passenger Cars and Light
Commercial Vehicles Business Area and the Trucks and Buses,
Power Engineering Business Area
FI NANCIAL SERVICES DIVISION BALANCE SHEET STRUCTU RE
At €111.9 billion, the Financial Services Division’s total
assets at the end of March 2012 were 4.0% higher than at
the end of 2011.
Noncurrent assets increased by 4.0%, mainly due to
higher financial services receivables. Higher receivables
as a result of volume-related factors led to a 4.0% increase
in current assets compared with December 31, 2011. The
Financial Services Division accounted for approximately
42.2% of the Volkswagen Group’s assets as of March 31,
2012.
At the end of the reporting period, the Financial
Services Division’s equity amounted to €11.8 billion,
exceeding the figure at the end of 2011 by 8.6%. This
increase was due in particular to the earnings position and
a capital increase by Volkswagen AG. The division’s equity
ratio was 10.5% (10.1%). Noncurrent liabilities were
8.1% higher than at year-end 2011 due to an increase in
financial liabilities to refinance volume growth. Current
liabilities were up 0.2% compared with December 31,
2011.
Deposits from direct banking business amounted to
€22.1 billion (€22.2 billion), of which €21.3 billion was
attributable to Volkswagen Bank direct.
€ million
March 31, 2012
Dec. 31, 2011
Passenger Cars and Light
Commercial Vehicles Business Area
Noncurrent assets 60,539 60,505
Current assets 51,579 45,597
Total assets 112,119 106,102
Equity 33,680 32,411
Noncurrent liabilities 45,295 41,030
Current liabilities 33,143 32,661
Trucks and Buses, Power Engineering
Business Area
Noncurrent assets 26,331 25,774
Current assets 14,577 14,157
Total assets 40,908 39,931
Equity 20,092 20,078
Noncurrent liabilities 9,610 8,044
Current liabilities 11,206 11,810

19
Business Development Results of Operations, Financial Position and Net Assets Outlook
MANAGEMENT REPORT
Global economic growth continued in the reporting
period, but lost further momentum compared with full-
year 2011. We expect the global economy to stabilize at
this level over the course of the year. The performance of
the individual regions will differ. While the rapid
momentum seen in the emerging markets of Asia and
Latin America will ease only slightly, the major
industrialized nations will continue to see merely
moderate growth. A recession is expected in some
eurozone countries. Increasing inflationary trends may
cloud the prospects for growth in the emerging markets.
Global demand for passenger cars and light
commercial vehicles rose rather more strongly between
January and March 2012 than in full-year 2011. The
strongest absolute growth was recorded by the Japanese,
US, Chinese, Indian and Russian markets. We expect the
global markets for passenger cars and light commercial
vehicles to grow further in 2012, although the pace is
likely to slacken slightly compared with the first quarter.
We are forecasting an overall decline in the market volume
in Western Europe, with the German market staying at the
same level as in the previous year. Growth in Central and
Eastern Europe will slow tangibly. The growth rates in our
strategically important markets of China and India are
expected to remain above average, while demand in North
and South America also looks set to rise further.
The pace of growth in the markets for trucks and buses
is expected to slow in 2012; the global market will remain
roughly on a level with 2011.
We also expect the markets for automotive financial
services to continue gaining in significance in 2012.
The Volkswagen Group’s main competitive advantages
are its multibrand strategy, a range of vehicles that covers
almost all segments from subcompact cars to heavy trucks
and its growing presence in all major regions of the world,
together with its wide range of financial services. Thanks
to our expertise in technology and design, we have a
diverse, attractive and environmentally friendly portfolio
of products that meets all customer desires and needs. In
2012, the Volkswagen Group’s brands will again launch a
large number of fascinating new models and so help
further expand our strong position in the global markets.
As a result, we expect to increase deliveries to customers
year-on-year. 2012 will be dominated by the start of
production for new, high-volume models as part of the
renewal of our product range and the need to convert our
plant and equipment for use with the Modular Transverse
Toolkit. The modular toolkit system, which is being
continuously updated, will have an increasingly positive
effect on the Group’s cost structure in the future.
The Volkswagen Group’s 2012 sales revenue will
exceed the prior-year figure. This will also be a result of
the consolidation of MAN SE as of November 9, 2011; the
earnings contribution will be limited because of the write-
downs that will be required for purchase price allocation.
Our goal for operating profit is to match the 2011 level.
Positive effects from our attractive model range and strong
market position will be offset in part by increasingly stiff
competition in a challenging market environment,
especially in certain European countries. Disciplined cost
and investment management and the continuous
optimization of our processes remain core components of
our Strategy 2018.
Outlook
This report contains forward-looking statements on the business development of
the Volkswagen Group. These statements are based on assumptions relating to
the development of the economic and legal environment in individual countries
and economic regions, and in particular for the automotive industry, which we
have made on the basis of the information available to us and which we consider
to be realistic at the time of going to press. The estimates given entail a degree of
risk, and the actual developments may differ from those forecast. Consequently,
any unexpected fall in demand or economic stagnation in our key sales markets,
such as Western Europe (and especially Germany) or in the USA, Brazil, China, or
Russia will have a corresponding impact on the development of our business.
The same applies in the event of a significant shift in current exchange rates
relative in particular to sterling, the US dollar, Chinese renminbi, the Swiss franc,
Japanese yen, Swedish krona, Russian ruble and Australian dollar. In addition,
expected business development may vary if the assessments of value-enhancing
factors and risks presented in the 2011 Annual Report develop in a way other
than we are currently expecting, or additional risks or other factors emerge that
adversely affect the development of our business.

20
SALES REVEN U E AN D OPERATI NG PROFIT BY B RAN D AN D BUSI N ESS FI ELD
The Volkswagen Group’s sales revenue for the period from
January to March 2012 was up 26.3% year-on-year to
€47.3 billion, mainly due to volume-related factors and
the consolidation of Porsche Holding Salzburg and MAN
SE as of March 1, 2011 and November 9, 2011 respectively.
At €3.2 billion, operating profit exceeded the prior-year
figure by 10.2%.
At 1.2 million vehicles, the Volkswagen Passenger Cars
brand sold 9.3% more units in the first three months of
2012 than in the prior-year period. There was increased
demand for the Tiguan, Passat, Touareg and Sharan
models. The new up!, Beetle and CC models were also
highly popular. The higher volumes lifted sales revenue by
13.4% to €26.1 billion. Operating profit improved slightly
by 5.3% to €1.1 billion, although upfront expenditures on
the Modular Transverse Toolkit were a drag on earnings.
The Audi brand sold 340 thousand vehicles in the first
quarter of this year. Chinese joint venture FAW-
Volkswagen sold a further 77 thousand Audi vehicles.
Worldwide, the Audi A6, Audi A7 Sportback and Audi A8
models recorded the highest growth rates. Growth in
demand for the new Audi A1 Sportback and Audi Q3
models was also extremely positive. At €12.4 billion, sales
revenue was 17.8% higher than in the corresponding
period in 2011. Operating profit rose by 26.6% to €1.4
billion. This positive performance was primarily
attributable to increased volumes (vehicles and vehicle
parts), mix improvements and the continuous
optimization of productivity and processes. The figures for
the Lamborghini brand are already included in the key
figures for the Audi brand.
Unit sales by the ŠKODA brand were up 13.9%
year-on-year to 206 thousand vehicles in the period from
January to March 2012. Demand for the Fabia, Yeti and
Octavia models as well as for the Rapid in India was
encouraging. At €2.9 billion, sales revenue was 8.3%
higher than in the previous year. Volume-related factors
and improved product costs saw operating profit grow by
11.8% to €209 million.
Unit sales of the SEAT brand increased by 6.7% year-
on-year to 99 thousand vehicles worldwide, while demand
for vehicles in the still declining Spanish passenger car
market was again lower in the reporting period than in the
previous year. The SEAT Alhambra was increasingly
popular and the SEAT Mii was well received by the market.
At €1.6 billion, sales revenue was 14.2% higher than in
the same period in 2011. The operating loss widened by
€17 million to €29 million due to increased fixed costs and
sales support.
VOLKSWAGEN GROU P
Division A U T O M O T I V E D I V I S I O N F I N A N C IA L S ERV I C E S
Brand/
Business Field
Volkswagen
Passenger
Cars
Audi ŠKODA SEAT Bentley Volkswagen
Commercial
Vehicles
Scania MAN Other Dealer and customer
financing
Leasing
Direct bank
Insurance
Fleet business
Brands and Business Fields

21B RAN DS AN D BUSI N ESS F I ELDS
The Bentley brand sold around two thousand vehicles in
the reporting period (+88.0%). At €357 million, sales
revenue was 81.3% higher than in 2011. Operating profit
rose by €40 million to €15 million, primarily as a result of
higher volumes.
In the first three months of 2012, Volkswagen
Commercial Vehicles sold 119 thousand vehicles, 9.8%
more than in the prior-year period. Demand increased for
the Crafter and Amarok models. Sales revenue improved
by 15.9% year–on–year to €2.5 billion. Positive volume
and mix effects saw operating profit increase by €32
million year-on-year to €124 million.
The Scania brand sold 16 thousand vehicles in the first
three months of the year. The 14.8% decline is primarily
attributable to reduced demand in Europe/Remaining
markets. By contrast, demand for service offerings and
genuine parts recorded growth. As a result, sales revenue
declined by €50 million to €2.4 billion. At €262 million,
operating profit was €115 million lower than in the first
quarter of 2011.
The MAN brand sold 35 thousand vehicles in the
reporting period. Sales revenue amounted to €3.9 billion;
operating profit was €223 million.
Volkswagen Financial Services generated an operating
profit of €311 million in the first quarter of 2012,
exceeding the prior-year figure by €25 million due to
volume and currency-related factors.
KEY FIGU RES BY BRAN D AN D BUSI N ESS F I ELD FROM JAN UARY 1 TO MARCH 31 1 S A L E S T O
V E H I C L E S A L E S S A L E S R E V E N U E T H I R D PA R T I E S O P E R AT I N G R E S U LT
thousand vehicles/€ million 2012 2011 2012 2011 2012 2011 2012 2011
Volkswagen Passenger Cars 1,177 1,077 26,137 23,042 19,982 18,077 1,116 1,060
Audi 340 374 12,389 10,514 8,534 7,167 1,412 1,115
ŠKODA 206 181 2,916 2,691 1,617 1,739 209 187
SEAT 99 93 1,579 1,382 723 927 – 29 – 12
Bentley 2 1 357 197 341 189 15 – 25
Volkswagen Commercial
Vehicles 119 108 2,486 2,145 1,340 1,361 124 92
Scania2 16 19 2,363 2,414 2,363 2,414 262 376
MAN2 35 – 3,896 – 3,881 – 223 –
VW China3 588 512 – – – – – –
Other4 – 323 – 335 – 9,118 – 8,589 4,601 2,165 – 4345 – 1695
Volkswagen Financial Services 4,320 3,674 3,944 3,430 311 287
Volkswagen Group 2,260 2,031 47,326 37,470 47,326 37,470 3,209 2,912
Automotive Division 2,260 2,031 42,630 33,552 43,027 33,797 2,866 2,608
of which: Passenger Cars and
Light Commercial
Vehicles Business Area 2,208 2,012 36,497 31,208 36,960 31,501 2,818 2,315
Trucks and Buses,
Power Engineering
Business Area 51 19 6,133 2,345 6,067 2,295 48 292
Financial Services Division – – 4,695 3,918 4,298 3,673 343 304
1 All figures shown are rounded, so minor discrepancies may arise from addition of these amounts.
2 Including financial services; MAN as from November 9, 2011.
3 The sales revenue and operating profit of the joint venture companies in China are not included in the figures for the Group. The Chinese companies are accounted
for using the equity method and recorded an operating profit (proportionate) of €848 million (€557 million).
4 Including Porsche Holding Salzburg from March 1, 2011.
5 Mainly intragroup items recognized in profit or loss, in particular from the elimination of intercompany profits; the figure includes depreciation and amortization of
identifiable assets as part of the purchase price allocation for Scania, Porsche Holding Salzburg and MAN.

22
U N IT SALES AN D SALES REVEN U E BY MARKET
In the Europe/Remaining markets region, the Volkswagen
Group sold a total of 1.1 million vehicles in the first
quarter of 2012, 6.1% more than in the prior-year period.
Sales revenue increased by 19.7% to €30.0 billion due to
volume- and mix-related factors.
The Group’s unit sales in the North America region
rose by 29.8% year-on-year to 195 thousand vehicles, with
demand for Group models growing faster than the market
as a whole. As a result, sales revenue was up by €1.3 billion
to €5.3 billion.
In South America, the Volkswagen Group increased its
sales by 1.1% to a total of 231 thousand vehicles. Higher
volumes and in particular positive exchange rate effects
saw sales revenue improve by €1.0 billion to €4.5 billion.
Including the Chinese joint ventures, we sold a total of
740 thousand vehicles in the Asia-Pacific region in the
first three months of 2012, which represents an increase
of 19.1% compared with the prior-year period. At €7.6
billion, sales revenue reflected the strong market growth
and substantially exceeded the previous year, increasing
53.5%. This figure does not include the sales revenue of
our Chinese joint ventures, as these are accounted for
using the equity method.
KEY FIGU RES BY MARKET FROM JAN UARY 1 TO MARCH 31 1
V E H I C L E S A L E S S A L E S R E V E N U E
thousand vehicles/€ million 2012 2011 2012 2011
Europe/Remaining markets 1,093 1,030 30,016 25,068
North America 195 150 5,265 3,976
South America 231 228 4,454 3,480
Asia-Pacific2 740 622 7,590 4,946
Volkswagen Group2 2,260 2,031 47,326 37,470
1 All figures shown are rounded, so minor discrepancies may arise from addition of these amounts.
2 The sales revenue of the joint venture companies in China is not included in the figures for the Group and the Asia-Pacific market.

23B RAN DS AN D BUSI N ESS F I ELDS
VOLKSWAGEN FI NANCIAL SERVICES
With its innovative products along the automotive value
chain, Volkswagen Financial Services once again
contributed to the Volkswagen Group’s strong sales and
earnings performance in the first quarter of 2012.
In Germany, we continued to drive forward mobility
with the “Audi Privatkunden-Programm” for the Audi
brand. This offering allows financing/leasing, insurance,
vehicle roadworthiness tests and the Audi extended
warranty to be individually combined. A new module is
purchase price insurance, which insures customers
against write-off and theft. This reimburses the difference
between the replacement cost, which is covered by fully
comprehensive insurance, and the purchase price.
Volkswagen Bank GmbH was the clear winner in a
survey conducted by “Auto Bild” magazine, taking top
honors in the “automotive bank” category. Readers of
“auto motor und sport” voted Volkswagen Bank GmbH the
best bank for the sixth time in a row, awarding it the title
“Best Brand”. Both reader surveys primarily addressed
the quality of the financial services offered.
Volkswagen Leasing GmbH acquired rental company
Euromobil on January 1, 2012. The acquisition
strengthened Volkswagen Financial Services AG’s own
rental business and closed a gap in its mobility concept.
The goal is to pool the strengths of the Group dealer
organization and Volkswagen Leasing GmbH, and to offer
customers comprehensive mobility solutions. At the same
time, a new product was launched in the shape of
“PartnerMiete”, in which Euromobil partners themselves
rent vehicles and rent these on directly to their customers
as required. Alongside the vehicle and insurance, the
product also includes a “maintenance & wear and tear”
service and covers vehicle tax, registration and GEZ
broadcast license fees.
Volkswagen Leasing GmbH was recognized for its
sustainable fleet management program in the Germany-
wide “365 Orte im Land der Ideen” competition. Together
with the German Nature and Biodiversity Conservation
Union (NABU), Volkswagen encourages fleet management
to make their fleets “greener”. In addition, every time an
environmentally friendly car is registered, Volkswagen
Leasing GmbH makes a contribution to a NABU project.
The company also provides its customers with information
on how to save the most fuel and cut the most emissions
through the optimum use of a “green fleet”. In this way,
Volkswagen Leasing GmbH makes an important
contribution to the creation of greener fleets and
promotes the use of environmentally friendly fleet vehicles
from the Volkswagen Group.
In Korea, Volkswagen Financial Services Korea Co.,
Ltd. has offered dealer financing for the Volkswagen and
Audi brands since February.
In March, the Volkswagen Car Lease 15 (VCL 15)
securitization transaction, backed by German lease
receivables in the amount of approximately €1.0 billion,
was successfully placed with a broad investor base. VCL 15
is the first German benchmark ABS transaction in 2012
for Volkswagen Financial Services AG and bears the “TSI –
DEUTSCHER VERBRIEFUNGSSTANDARD” quality label
from True Sale International GmbH.
Volkswagen Financial Services AG marketed Japanese
loan receivables totaling JPY 25.0 billion for the first time
with the Driver Japan One securitization transaction. This
was the first public securitization of a European
automobile manufacturer in Japan and allows Volkswagen
Financial Services AG to tap an additional local
refinancing source and expand its investor base.
A total of 0.8 million new finance, leasing, service and
insurance contracts were signed in the reporting period,
17.9% more than in the first three months of 2011. The
total number of contracts as of March 31, 2012 exceeded
the 2011 year-end figure by 4.5%. The number of
contracts in the Customer Financing/Leasing area was up
4.4% as against December 31, 2011 to 5.8 million and the
number of contracts in the Service/Insurance area was
4.6% higher. Leased or financed vehicles accounted for
26.0% (33.9%) of total Group deliveries worldwide based
on unchanged credit eligibility criteria. The decrease is
attributable to the Chinese market, which was included
for the first time. The share of leased or financed vehicles
in China is significantly below the average of other
automotive markets. Compared with December 31, 2011,
receivables relating to dealer financing were 5.5% higher.
As of March 31, 2012, Volkswagen Bank direct
managed 1.4 million accounts, slightly fewer than at year-
end 2011 (–1.6%). Volkswagen Financial Services
employed 9,019 people at the end of the reporting period.
The number of contracts in our fleet management
business at the end of the first quarter of 2012 was down
0.6% on year-end 2011. Our LeasePlan joint venture
managed around 1.3 million vehicles on March 31, 2012.

24

25
Income Statement Statement of Comprehensive Income Balance Sheet Statement of Changes in Equity Cash Flow Statement Notes to the Financial Statements Review Report
I NTER IM FI NANC IAL STATEMENTS (CON DENSED)
Income Statement for the Period January 1 to March 31
V O L K S WA G E N G R O U P D I V I S I O N S
A U T O M O T I V E1
F I N A N C I A L S E RV I C E S
€ million 2012 2011 2012 2011 2012 2011
Sales revenue 47,326 37,470 42,630 33,552 4,695 3,918
Cost of sales – 38,389 – 30,330 – 34,798 – 27,346 – 3,591 – 2,985
Gross profit 8,936 7,140 7,833 6,207 1,104 933
Distribution expenses – 4,098 – 3,108 – 3,872 – 2,941 – 226 – 167
Administrative expenses – 1,379 – 919 – 1,095 – 744 – 283 – 175
Other operating income/expense – 251 – 201 1 85 – 251 – 286
Operating profit 3,209 2,912 2,866 2,608 343 304
Share of profits and losses of equity-accounted
investments 952 585 905 545 47 39
Other financial result 138 – 1,273 170 – 1,263 – 32 – 10
Financial result 1,090 – 688 1,075 – 717 15 29
Profit before tax 4,300 2,223 3,941 1,890 358 333
Income tax expense – 1,114 – 511 – 1,043 – 431 – 71 – 80
Profit after tax 3,186 1,712 2,898 1,459 288 253
Noncontrolling interests 20 117 15 112 5 5
Profit attributable to shareholders of Volkswagen AG 3,166 1,595 2,883 1,347 283 248
Basic earnings per ordinary share (€)2 6.78 3.41
Diluted earnings per ordinary share (€)2 6.78 3.41
Basic earnings per preferred share (€)2 6.84 3.47
Diluted earnings per preferred share (€)2 6.84 3.47
1 Including allocation of consolidation adjustments between the Automotive and Financial Services divisions.
2 Explanatory notes on earnings per share are presented in note 4.
Interim Financial Statements (Condensed)
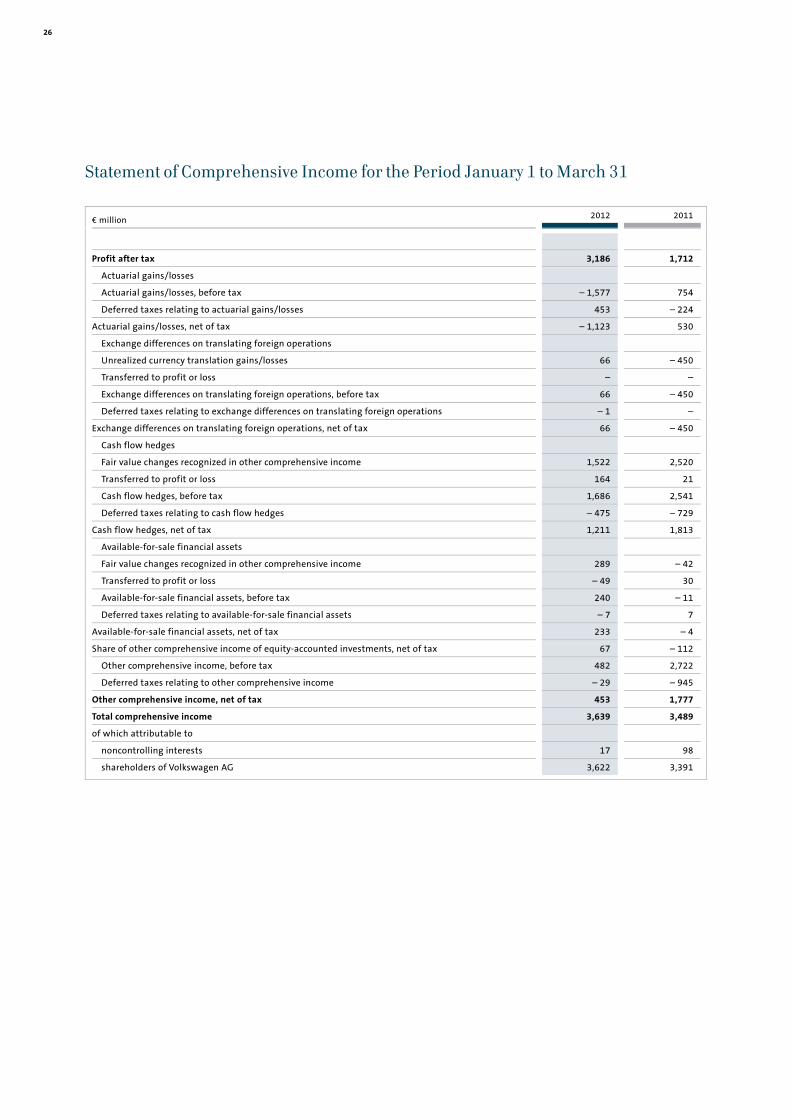
26
Statement of Comprehensive Income for the Period January 1 to March 31
€ million 2012 2011
Profit after tax 3,186 1,712
Actuarial gains/losses
Actuarial gains/losses, before tax – 1,577 754
Deferred taxes relating to actuarial gains/losses 453 – 224
Actuarial gains/losses, net of tax – 1,123 530
Exchange differences on translating foreign operations
Unrealized currency translation gains/losses 66 – 450
Transferred to profit or loss – –
Exchange differences on translating foreign operations, before tax 66 – 450
Deferred taxes relating to exchange differences on translating foreign operations – 1 –
Exchange differences on translating foreign operations, net of tax 66 – 450
Cash flow hedges
Fair value changes recognized in other comprehensive income 1,522 2,520
Transferred to profit or loss 164 21
Cash flow hedges, before tax 1,686 2,541
Deferred taxes relating to cash flow hedges – 475 – 729
Cash flow hedges, net of tax 1,211 1,813
Available-for-sale financial assets
Fair value changes recognized in other comprehensive income 289 – 42
Transferred to profit or loss – 49 30
Available-for-sale financial assets, before tax 240 – 11
Deferred taxes relating to available-for-sale financial assets – 7 7
Available-for-sale financial assets, net of tax 233 – 4
Share of other comprehensive income of equity-accounted investments, net of tax 67 – 112
Other comprehensive income, before tax 482 2,722
Deferred taxes relating to other comprehensive income – 29 – 945
Other comprehensive income, net of tax 453 1,777
Total comprehensive income 3,639 3,489
of which attributable to
noncontrolling interests 17 98
shareholders of Volkswagen AG 3,622 3,391

27
Income Statement Statement of Comprehensive Income Balance Sheet Statement of Changes in Equity Cash Flow Statement Notes to the Financial Statements Review Report
I NTER IM FI NANC IAL STATEMENTS (CON DENSED)
Balance Sheet as of March 31, 2012 and December 31, 2011
V O L K S WA G E N G R O U P D I V I S I O N S
A U T O M O T I V E * FINANCIAL SERVICES
€ million 2012 2011 2012 2011 2012 2011
Assets
Noncurrent assets 151,044 147,986 86,870 86,278 64,173 61,708
Intangible assets 22,061 21,992 21,930 21,861 131 131
Property, plant and equipment 32,307 31,916 31,832 31,454 475 462
Leasing and rental assets 16,873 16,626 3,214 3,278 13,659 13,348
Financial services receivables 43,962 42,450 – 601 – 600 44,563 43,050
Noncurrent investments, equity-accounted
investments and other equity investments, other
receivables and financial assets 35,841 35,002 30,496 30,286 5,345 4,717
Current assets 113,875 105,640 66,156 59,755 47,718 45,885
Inventories 28,888 27,551 26,597 25,378 2,291 2,173
Financial services receivables 34,877 33,754 – 840 – 816 35,717 34,570
Other receivables and financial assets 23,434 19,897 18,493 15,494 4,941 4,404
Marketable securities 6,094 6,146 5,014 5,235 1,079 911
Cash, cash equivalents and time deposits 20,581 18,291 16,892 14,464 3,689 3,827
Total assets 264,919 253,626 153,027 146,033 111,892 107,593
Equity and Liabilities
Equity 65,567 63,354 53,772 52,488 11,795 10,865
Equity attributable to shareholders of Volkswagen AG 60,738 57,539 49,159 46,891 11,579 10,647
Noncontrolling interests 4,829 5,815 4,614 5,597 216 218
Noncurrent liabilities 98,294 89,216 54,905 49,074 43,389 40,142
Noncurrent financial liabilities 52,374 44,443 12,672 7,663 39,702 36,780
Provisions for pensions 18,358 16,787 18,140 16,592 218 194
Other noncurrent liabilities 27,562 27,986 24,094 24,819 3,468 3,167
Current liabilities 101,058 101,057 44,349 44,471 56,708 56,586
Current financial liabilities 47,699 49,090 – 4,575 – 2,979 52,273 52,069
Trade payables 17,200 16,325 15,812 15,245 1,388 1,081
Other current liabilities 36,158 35,642 33,111 32,205 3,047 3,436
Total equity and liabilities 264,919 253,626 153,027 146,033 111,892 107,593
* Including allocation of consolidation adjustments between the Automotive and Financial Services divisions, primarily intragroup loans.
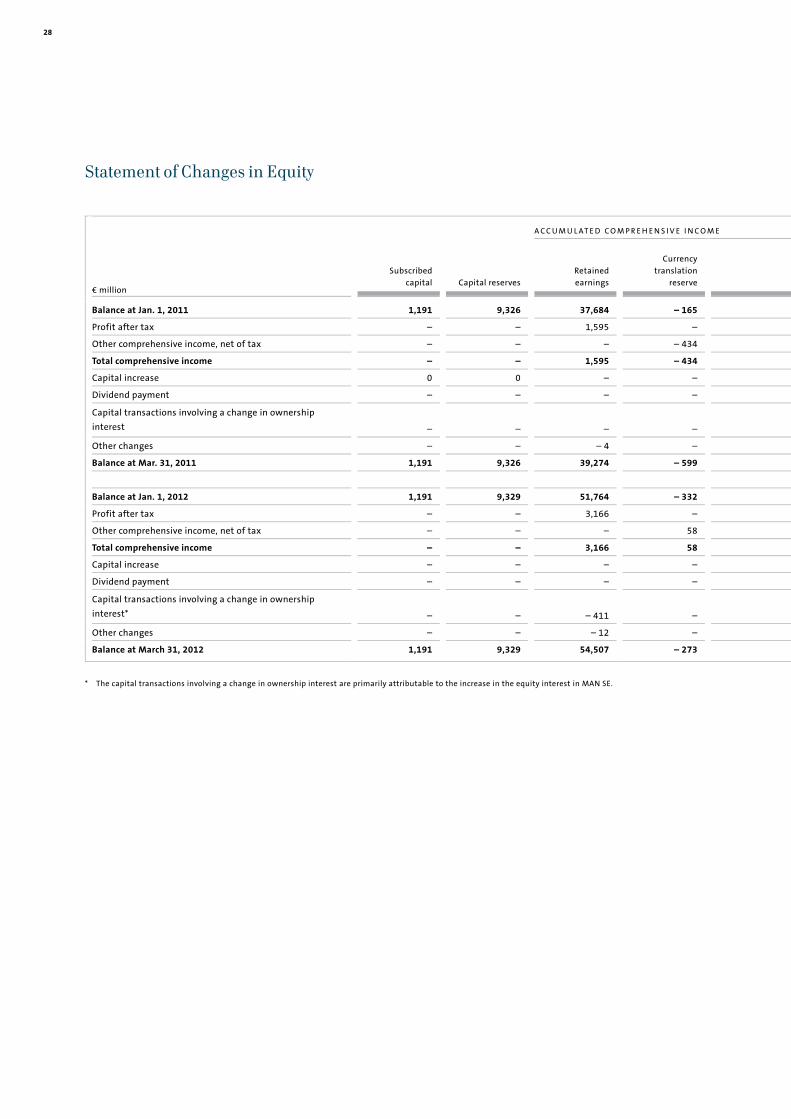
28
Statement of Changes in Equity
A C C U M U L AT E D C O M P R E H E N S I V E I N C O M E
€ million
Subscribedcapital Capital reserves
Retained earnings
Currency translation
reserve
Balance at Jan. 1, 2011 1,191 9,326 37,684 – 165
Profit after tax – – 1,595 –
Other comprehensive income, net of tax – – – – 434
Total comprehensive income – – 1,595 – 434
Capital increase 0 0 – –
Dividend payment – – – –
Capital transactions involving a change in ownership
interest – – – –
Other changes – – – 4 –
Balance at Mar. 31, 2011 1,191 9,326 39,274 – 599
Balance at Jan. 1, 2012 1,191 9,329 51,764 – 332
Profit after tax – – 3,166 –
Other comprehensive income, net of tax – – – 58
Total comprehensive income – – 3,166 58
Capital increase – – – –
Dividend payment – – – –
Capital transactions involving a change in ownership
interest* – – – 411 –
Other changes – – – 12 –
Balance at March 31, 2012 1,191 9,329 54,507 – 273
* The capital transactions involving a change in ownership interest are primarily attributable to the increase in the equity interest in MAN SE.

29
Income Statement Statement of Comprehensive Income Balance Sheet Statement of Changes in Equity Cash Flow Statement Notes to the Financial Statements Review Report
I NTER IM FI NANC IAL STATEMENTS (CON DENSED)
Reserve for actuarial
gains/losses Cash flow
hedge reserve Available-for-sale
financial assets
Equity-accounted
investments
Equity attributable to
shareholders of VW AG
Noncontrolling interests Total equity
– 2,201 61 – 25 107 45,978 2,734 48,712
– – – – 1,595 117 1,712
530 1,812 – 4 – 108 1,796 – 19 1,777
530 1,812 – 4 – 108 3,391 98 3,489
– – – – 0 – 0
– – – – – – –
– – – – – – –
– – – – – 4 3 – 2
– 1,671 1,873 – 29 – 1 49,364 2,835 52,199
– 2,866 – 1,437 176 – 286 57,539 5,815 63,354
– – – – 3,166 20 3,186
– 1,110 1,207 233 68 456 – 3 453
– 1,110 1,207 233 68 3,622 17 3,639
– – – – – – –
– – – – – – –
– – – – – 411 – 1,015 – 1,427
– – – – – 12 13 1
– 3,976 – 229 408 – 219 60,738 4,829 65,567

30
Cash Flow Statement for the Period January 1 to March 31
V O L K S WA G E N G R O U P D I V I S I O N S
A U T O M O T I V E1
F I NANCIAL SERVICES
€ million 2012 2011 2012 2011 2012 2011
Cash and cash equivalents at beginning of period 16,495 18,228 12,668 17,002 3,827 1,226
Profit before tax 4,300 2,223 3,941 1,890 358 333
Income taxes paid – 1,198 – 783 – 1,108 – 556 – 90 – 227
Depreciation and amortization expense 3,006 2,254 2,315 1,672 691 583
Change in pension provisions – 5 11 – 6 9 1 2
Other noncash income/expense and
reclassifications2 – 268 673 – 309 567 41 106
Gross cash flow 5,835 4,379 4,833 3,583 1,002 796
Change in working capital – 4,381 – 1,871 – 1,892 1,538 – 2,489 – 3,409
Change in inventories – 1,348 – 1,655 – 1,228 – 1,383 – 121 – 273
Change in receivables – 3,006 – 1,655 – 3,017 – 574 11 – 1,081
Change in liabilities 2,036 2,397 1,711 2,179 325 219
Change in other provisions 863 1,362 728 1,272 134 89
Change in leasing and rental assets
(excluding depreciation) – 1,235 – 876 – 113 – 56 – 1,122 – 820
Change in financial services receivables – 1,690 – 1,444 26 99 – 1,717 – 1,544
Cash flows from operating activities 1,454 2,508 2,941 5,120 – 1,487 – 2,612
Cash flows from investing activities attributable
to operating activities – 2,732 – 4,188 – 2,523 – 4,465 – 209 277
of which: acquisition of property, plant and
equipment – 1,727 – 963 – 1,695 – 940 – 32 – 23
capitalized development costs – 465 – 392 – 465 – 392 – –
acquisition and disposal of equity
investments3 – 590 – 2,919 – 411 – 3,215 – 179 296
Net cash flow4 – 1,278 – 1,680 418 655 – 1,696 – 2,335
Change in investments in securities and loans – 357 – 668 598 – 608 – 955 – 60
Cash flows from investing activities – 3,089 – 4,856 – 1,925 – 5,073 – 1,164 218
Cash flows from financing activities 4,272 4,644 1,756 1,789 2,516 2,855
of which: capital transactions with
noncontrolling interests – 1,427 – – 1,427 – – –
Changes in cash and cash equivalents due to
exchange rate changes – 70 – 160 – 52 – 143 – 17 – 17
Net change in cash and cash equivalents 2,567 2,137 2,720 1,693 – 153 444
Cash and cash equivalents at March 31 19,063 20,365 15,388 18,695 3,674 1,669
Securities, loans and time deposits 12,577 10,029 8,471 7,990 4,106 2,039
Gross liquidity 31,640 30,394 23,859 26,686 7,780 3,708
Total third-party borrowings – 100,073 – 83,197 – 8,097 – 7,037 – 91,975 – 76,160
Net liquidity at March 31 – 68,433 – 52,803 15,762 19,648 – 84,195 – 72,452
For information purposes: at January 1 – 64,875 – 49,347 16,951 18,639 – 81,826 – 67,986
1 Including allocation of consolidation adjustments between the Automotive and Financial Services divisions.
2 These relate mainly to the fair value measurement of financial instruments, application of the equity method and reclassification of gains/losses on disposal of
noncurrent assets to investing activities.
3 These relate mainly to the acquisition of shares in KPI Polska Sp.z.o.o., Poznan/Poland, and related financial services companies for a total of €254 million and in
MAN FORCE TRUCKS Private Limited, Akurdi/India, for €150 million.
4 Net cash flow: cash flows from operating activities, net of cash flows from investing activities attributable to operating activities.
.

31
Income Statement Statement of Comprehensive Income Balance Sheet Statement of Changes in Equity Cash Flow Statement Notes to the Financial Statements Review Report
I NTER IM FI NANC IAL STATEMENTS (CON DENSED)
Accounting in accordance with International Financial Reporting Standards (IFRSs)
In accordance with Regulation No. 1606/2002 of the European Parliament and of the Council,
Volkswagen AG prepared its consolidated financial statements for 2011 in compliance with the
International Financial Reporting Standards (IFRSs), as adopted by the European Union. These
interim consolidated financial statements for the period ended March 31, 2012 were therefore
also prepared in accordance with IAS 34 and are condensed in scope compared with the
consolidated financial statements.
All figures shown are rounded, so minor discrepancies may arise from addition of these
amounts.
In addition to the reportable segments, the Automotive and Financial Services divisions are
presented in the condensed interim consolidated financial statements for explanatory purposes
alongside the income statement, balance sheet and cash flow statement for the Volkswagen
Group. These are not required disclosures under IFRSs. Eliminations of intragroup
transactions between the Automotive and Financial Services divisions are allocated to the
Automotive Division.
Accounting policies
Volkswagen AG has complied with all accounting pronouncements adopted by the EU and
effective for periods beginning on or after January 1, 2012.
The accounting pronouncements required to be applied for the first time in fiscal year 2012
are insignificant for the presentation of the Volkswagen Group's net assets, financial position
and results of operations in its interim consolidated financial statements. A detailed breakdown
of these accounting pronouncements is provided in the notes to the consolidated financial
statements in the 2011 Annual Report.
A discount rate of 4.0% (December 31, 2011: 4.6%) was applied to German pension
provisions in the accompanying interim financial statements. The decrease in the discount rate
increased the actuarial losses for pension provisions that are recognized in other
comprehensive income.
The income tax expense for the interim reporting period was calculated on the basis of the
average annual tax rate that is expected for the entire fiscal year, in accordance with IAS 34,
Interim Financial Reporting.
In other respects, the same accounting policies and consolidation methods that were used
for the 2011 consolidated financial statements are generally applied to the preparation of the
Interim Report and the measurement of the prior-year comparatives. A detailed description of
the methods applied is published in the notes to the consolidated financial statements in the
2011 Annual Report. This can also be accessed on the Internet at www.volkswagenag.com/ir.
Notes to the Consolidated Financial Statements

32
Basis of consolidation
In addition to Volkswagen AG, which is domiciled in Wolfsburg and entered in the commercial
register at the Braunschweig Local Court under no. HRB 100484, the consolidated financial
statements comprise all significant companies at which Volkswagen AG is able, directly or
indirectly, to govern the financial and operating policies in such a way that the companies of the
Group obtain benefits from the activities of these companies (subsidiaries).
CONSOLI DATED SU BSI DIARI ES
After receipt of all official approvals, on November 9, 2011, Volkswagen acquired 25.4% of the
voting rights and 2.7% of the preferred shares of MAN SE, Munich, against payment of a total of
€3,416 million and, after completion of the mandatory offer, held 55.90% of the voting rights
and 53.71% of the share capital of MAN SE. The measurement basis for the goodwill is
calculated as follows: € million 2011
Purchase price for shares acquired on November 9 3,416
of which: attributable to termination of existing contractual arrangements – 43
Adjusted purchase price for shares acquired on November 9 3,373
Existing shares measured at quoted market price on November 9 2,694
Shares held by noncontrolling interests measured at quoted market price on November 9 4,267
Measurement basis for goodwill 10,334
On December 31, 2011, following the acquisition of additional shares, Volkswagen held
59.58% of the voting rights and 57.33% of the share capital of MAN SE. In fiscal year 2012,
Volkswagen acquired further shares in MAN SE for €1,413 million and as of March 31, 2012
held 70.89% of the voting rights and 68.94% of the share capital of MAN SE. The difference of
€–351 million arising from the acquisition of further shares was recognized directly in equity.
The shares of Scania AB held by MAN SE increase the interest in the capital of Scania
attributable to Volkswagen AG shareholders to 58.49% (December 31, 2011: 56.94%). The
resulting difference of €–52 million was recognized directly in equity.
The analysis of the assets acquired and liabilities assumed was not completed by the date of
issue of the interim consolidated financial statements for reasons of time. An adjustment based
on better knowledge indicates that the business combination generated goodwill of €605
million. The goodwill is not tax-deductible.

33
Income Statement Statement of Comprehensive Income Balance Sheet Statement of Changes in Equity Cash Flow Statement Notes to the Financial Statements Review Report
I NTER IM FI NANC IAL STATEMENTS (CON DENSED)
The following table shows the preliminary allocation of the purchase price to the assets and
liabilities:
€ million
IFRS carrying amounts at the
acquisition date Purchase price
allocation Adjustment in the
measurement period Fair values at the acquisition date
Brand names 53 1,574 – 1,628
Technology 545 1,852 – 2,397
Customer and dealer relationships 470 2,689 – 3,160
Other intangible assets* 779 – 351 – 428
Property, plant and equipment 2,034 880 – 41 2,872
Investments 1,965 – 234 – 1,731
Leasing and rental assets 2,232 – – 2,232
Other noncurrent assets 2,377 – – 2,377
Inventories 3,745 185 – 3,930
Trade receivables 2,319 – – 2,319
Cash and cash equivalents 607 – – 607
Other current assets 1,405 – 63 – 1,342
Total assets 18,531 6,532 – 41 25,022
Noncurrent financial liabilities 1,824 150 – 1 1,973
Other noncurrent liabilities and provisions 2,797 2,126 – 10 4,913
Current financial liabilities 1,334 – – 1,334
Trade payables 2,137 – – 2,137
Current provisions 1,364 398 13 1,774
Other current liabilities 3,175 – – 13 3,162
Total liabilities 12,631 2,674 – 11 15,293
* Excluding goodwill of Volkswagen AG.
€402 million of the goodwill and €1,158 million of the brand names are allocated to the MAN
Commercial Vehicles operating segment, which is part of the Trucks and Buses reporting
segment; the remaining goodwill of €203 million and the remaining brand names of €470
million are allocated to the Power Engineering segment.
The fair values of the assets and liabilities described above were determined as far as
possible using observable market prices. If market prices could not be determined, recognized
valuation techniques were used to measure the assets acquired and liabilities assumed.

34
In order to strengthen its sales activities, Volkswagen acquired all shares of KPI Polska Sp.z.o.o.,
Poznan, effective January 1, 2012. KPI Polska is the exclusive importer and distributor of
various Volkswagen Group brands in Poland. At the same time, Volkswagen acquired from the
previous owners of KPI Polska the outstanding shares of two Polish financial services companies
that until then had been jointly controlled. The purchase price paid amounted to €254 million
in total. The measurement of the existing shares in the financial services companies at a fair
value of €66 million resulted in a noncash book gain of €21 million, which was recognized in
the financial result.
In addition, on March 28, 2012, the Volkswagen Group acquired through MAN Truck & Bus
AG, Munich, the remaining shares (apart from one share) of MAN FORCE TRUCKS Private
Limited (in future: MAN Trucks India Private Limited), Akurdi/India, which until then had been
a joint venture, against payment of €150 million. The company has been consolidated since that
date. This strategic decision by MAN Truck & Bus underscores the significance of the Indian
market for the company. The interest originally held in the joint venture had already been
recognized at its fair value as part of the purchase price allocation on acquisition of MAN SE.
The measurement basis for the goodwill from the two transactions is calculated as follows: € million 2012
Purchase price for shares acquired 404
Preliminary fair value of existing shares 177
Measurement basis for goodwill 581
The following main groups of assets and liabilities were acquired and assumed for KPI Polska
and MAN FORCE TRUCKS:
€ million
IFRS carrying amounts at the acquisition date
Noncurrent assets 207
Cash and cash equivalents 94
Other current assets 728
Total assets 1,029
Noncurrent financial liabilities 190
Current financial liabilities 657
Total liabilities 847
The purchase price allocation for the above-mentioned business combinations, including the
calculation of the fair value of the existing shares, was not completed by the date of issue of the
interim consolidated financial statements for reasons of time. The difference between the
consideration and the acquired equity of €399 million has therefore not yet been allocated in
any greater detail. Significant hidden reserves or liabilities are not expected to be realized. Any
goodwill will not be tax-deductible.

35
Income Statement Statement of Comprehensive Income Balance Sheet Statement of Changes in Equity Cash Flow Statement Notes to the Financial Statements Review Report
I NTER IM FI NANC IAL STATEMENTS (CON DENSED)
I NTERESTS I N JOI NT VENTU RES
The Volkswagen Group holds a 50% indirect interest in the joint venture LeasePlan
Corporation N.V., Amsterdam, the Netherlands, via its 50% stake in the joint venture Global
Mobility Holding B.V., Amsterdam, the Netherlands. Volkswagen agreed with Fleet Investments
B.V., Amsterdam, the Netherlands, an investment company belonging to the von Metzler family,
that Fleet Investments would become the new co-investor in Global Mobility Holding in 2010 for
an initial period of two years. The agreement was prolonged by a further two years in fiscal year
2011. Volkswagen AG granted the new co-investor a put option on its shares. If this option is
exercised, Volkswagen must pay the original purchase price of €1.4 billion plus accumulated pro
rata preferred dividends or the higher fair value. The put option is accounted for at fair value.
In addition, Volkswagen pledged claims under certificates of deposit with Bankhaus Metzler
in the amount of €1.4 billion to secure a loan granted to Fleet Investments B.V. by Bankhaus
Metzler. This pledge does not increase the Volkswagen Group’s risk arising from the above-
mentioned short position.
I NVESTMENTS I N ASSOCIATES
The acquisition of the majority interest in MAN SE in fiscal year 2011 meant that MAN's 30%
interest in Ferrostaal GmbH (formerly: Ferrostaal AG), Essen, was attributable to Volkswagen.
There was already an intention to sell the investment in the near term at the time it was
acquired, so the shares were classified as held for sale and not accounted for using the equity
method. The investment had already been written down in full as of December 31, 2011. On
March 7, 2012, the settlement agreement between MAN SE and the International Petroleum
Investment Company (IPIC), Abu Dhabi, regarding the repurchase of the 70% interest in
Ferrostaal held by IPIC was completed (settlement with IPIC). This resulted in a cash outflow of
€350 million, which is reported as part of the cash flows from operating activities. At the same
time, the agreement between MAN and MPC Industries GmbH, Hamburg, regarding the transfer
of 100% of the shares in Ferrostaal to MPC and a co-investor was implemented (sale of MPC).
The sale of MPC provides for MAN to pay Ferrostaal an amount equal to the claims in connection
with the profit and loss transfer agreements in existence at that time. MPC pays the same
amount to MAN. The completion of the settlement with IPIC and the sale of MPC did not result in
any earnings effects for Volkswagen because the earnings effects attributable to the transaction
had already been included in purchase price allocation for the MAN Group as a contingent
liability.

36
Disclosures on the consolidated financial statements
1 | Sales revenue
STRUCTU RE OF GROU P SALES REVEN U E
Q 1
€ million 2012 2011
Vehicles 33,967 28,017
Genuine parts 2,665 2,514
Used vehicles and third-party products* 1,798 918
Engines, powertrains and parts deliveries* 2,219 1,234
Power Engineering 954 –
Rental and leasing business 2,755 2,308
Interest and similar income 1,554 1,363
Other sales revenue* 1,414 1,116
47,326 37,470
* The prior-year figure was adjusted accordingly due to the more detailed breakdown of other sales revenue.
2 | Cost of sales
Cost of sales includes interest expenses of €676 million (previous year: €560 million)
attributable to the financial services business.
In addition to depreciation and amortization expenses, cost of sales also includes
impairment losses on intangible assets, items of property, plant and equipment, and leasing and
rental assets. The impairment losses identified on the basis of updated impairment tests
amount to a total of €65 million (previous year: €46 million).
3 | Research and development costs in the Automotive Division
Q 1
€ million 2012 2011 %
Total research and development costs 2,136 1,920 11.3
of which: capitalized development costs 465 392 18.5
Capitalization ratio in % 21.8 20.4
Amortization of capitalized development costs 432 373 16.1
Research and development costs recognized in the
income statement 2,104 1,900 10.7

37
Income Statement Statement of Comprehensive Income Balance Sheet Statement of Changes in Equity Cash Flow Statement Notes to the Financial Statements Review Report
I NTER IM FI NANC IAL STATEMENTS (CON DENSED)
4 | Earnings per share
Basic earnings per share are calculated by dividing profit attributable to shareholders of
Volkswagen AG by the weighted average number of ordinary and preferred shares outstanding
during the reporting period. Earnings per share are diluted by potential shares. These include
stock options, although these are only dilutive if they result in the issuance of shares at a value
below the average market price of the shares.
Q 1
2012 2011
Weighted average number of shares outstanding
Ordinary shares: basic million 295.1 295.0
diluted million 295.1 295.1
Preferred shares: basic million 170.1 170.1
diluted million 170.1 170.1
Profit after tax € million 3,186 1,712
Noncontrolling interests € million 20 117
Profit attributable to shareholders of Volkswagen AG € million 3,166 1,595
Earnings per share
Ordinary shares: basic € 6.78 3.41
diluted € 6.78 3.41
Preferred shares: basic € 6.84 3.47
diluted € 6.84 3.47
5 | Noncurrent assets
C HANGES I N SELECTED NONCU RR ENT ASSETS BETWEEN JAN UARY 1 AN D MARCH 31, 2012
€ million
Carrying amount at Jan. 1, 2012
Additions/ Changes in
consolidated Group
Disposals/ Other changes
Depreciation and amortization
Carrying amount at Mar. 31, 2012
Intangible assets 21,992 814 – 43 789 22,061
Property, plant and equipment 31,916 1,763 9 1,363 32,307
Leasing and rental assets 16,626 2,266 1,164 855 16,873

38
6 | Inventories
€ million Mar. 31, 2012 Dec. 31, 2011
Raw materials, consumables and supplies 3,643 3,429
Work in progress 3,244 3,324
Finished goods and purchased merchandise 18,008 17,383
Current leased assets 3,673 3,204
Payments on account 320 210
28,888 27,551
7 | Current other receivables and financial assets
€ million Mar. 31, 2012 Dec. 31, 2011
Trade receivables 12,525 10,479
Miscellaneous other receivables and financial assets 10,909 9,419
23,434 19,897
In the period January 1, 2012 to March 31, 2012, impairment losses and reversals of
impairment losses on financial assets reduced operating profit by €123 million (previous year:
€247 million).
8 | Equity
The subscribed capital is composed of 295,089,817 no-par value ordinary shares and
170,142,778 preferred shares, and amounts to €1,191 million (December 31, 2011: €1,191
million).
9 | Noncurrent financial liabilities
€ million Mar. 31, 2012 Dec. 31, 2011
Bonds, commercial paper and notes 37,329 31,567
Liabilities to banks 11,206 8,561
Deposit business 2,580 3,093
Other financial liabilities 1,259 1,222
52,374 44,443
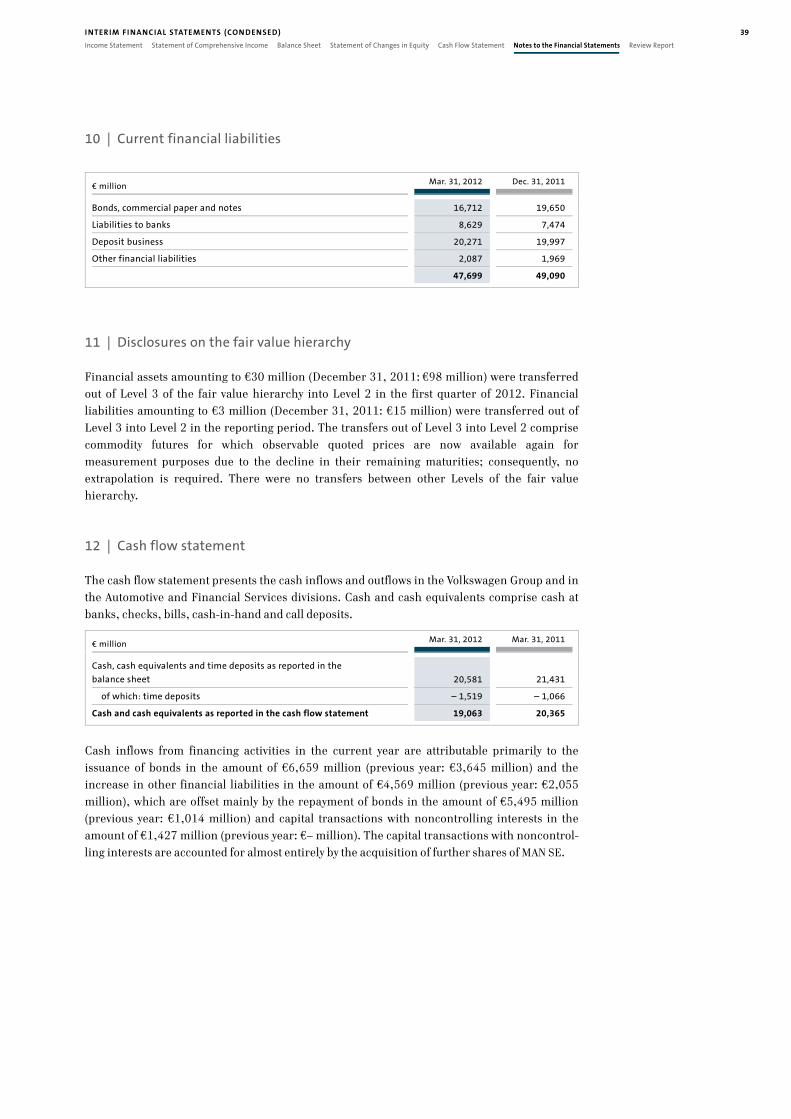
39
Income Statement Statement of Comprehensive Income Balance Sheet Statement of Changes in Equity Cash Flow Statement Notes to the Financial Statements Review Report
I NTER IM FI NANC IAL STATEMENTS (CON DENSED)
10 | Current financial liabilities
€ million Mar. 31, 2012 Dec. 31, 2011
Bonds, commercial paper and notes 16,712 19,650
Liabilities to banks 8,629 7,474
Deposit business 20,271 19,997
Other financial liabilities 2,087 1,969
47,699 49,090
11 | Disclosures on the fair value hierarchy
Financial assets amounting to €30 million (December 31, 2011: €98 million) were transferred
out of Level 3 of the fair value hierarchy into Level 2 in the first quarter of 2012. Financial
liabilities amounting to €3 million (December 31, 2011: €15 million) were transferred out of
Level 3 into Level 2 in the reporting period. The transfers out of Level 3 into Level 2 comprise
commodity futures for which observable quoted prices are now available again for
measurement purposes due to the decline in their remaining maturities; consequently, no
extrapolation is required. There were no transfers between other Levels of the fair value
hierarchy.
12 | Cash flow statement
The cash flow statement presents the cash inflows and outflows in the Volkswagen Group and in
the Automotive and Financial Services divisions. Cash and cash equivalents comprise cash at
banks, checks, bills, cash-in-hand and call deposits. € million Mar. 31, 2012 Mar. 31, 2011
Cash, cash equivalents and time deposits as reported in the
balance sheet 20,581 21,431
of which: time deposits – 1,519 – 1,066
Cash and cash equivalents as reported in the cash flow statement 19,063 20,365
Cash inflows from financing activities in the current year are attributable primarily to the
issuance of bonds in the amount of €6,659 million (previous year: €3,645 million) and the
increase in other financial liabilities in the amount of €4,569 million (previous year: €2,055
million), which are offset mainly by the repayment of bonds in the amount of €5,495 million
(previous year: €1,014 million) and capital transactions with noncontrolling interests in the
amount of €1,427 million (previous year: €– million). The capital transactions with noncontrol-
ling interests are accounted for almost entirely by the acquisition of further shares of MAN SE.
40
13 | Segment reporting
Segments are identified on the basis of the Volkswagen Group’s internal management and
reporting. In line with its multibrand strategy, each of the Group’s brands is managed by its own
board of management. The Group targets and requirements laid down by the Board of
Management of Volkswagen AG or the Group Board of Management must be complied with to
the extent permitted by law. Starting with fiscal year 2011, the segment reporting comprises the
four reportable segments of Passenger Cars and Light Commercial Vehicles, Trucks and Buses,
Power Engineering and Financial Services.
The activities of the Passenger Cars and Light Commercial Vehicles segment cover the
development of vehicles and engines, the production and sale of passenger cars and light
commercial vehicles, and the corresponding genuine parts business. The individual passenger
car brands and light commercial vehicles of the Volkswagen Group are combined on a
consolidated basis into a single reportable segment.
Due to the initial consolidation of the MAN Group and the associated addition of MAN’s
commercial vehicles business, the Scania Vehicles and Services segment was renamed “Trucks
and Buses” in fiscal year 2011. This primarily comprises the development, production and sale
of heavy commercial vehicles and buses, the corresponding genuine parts business and related
services.
The activities of the new “Power Engineering” segment that was created by the initial
consolidation of the MAN Group in fiscal year 2011 consist of the development and production
of large-bore diesel engines, turbo compressors, industrial turbines and chemical reactor
systems, as well as the production of gear units, propulsion components and testing systems.
The activities of the Financial Services segment comprise dealer and customer financing,
leasing, banking and insurance activities, as well as fleet management.
In the expanded segment structure, purchase price allocation for companies acquired is
now allocated directly to the corresponding segments. The prior-year figures were adjusted
accordingly.
At Volkswagen, segment profit or loss is measured on the basis of operating profit or loss.
The reconciliation contains activities and other operations that do not by definition
constitute segments. It also includes the unallocated Group financing activities. Consolidation
adjustments between the segments are also contained in the reconciliation.
As a matter of principle, business relationships between the companies within the segments
of the Volkswagen Group are transacted at arm’s length prices.

41
Income Statement Statement of Comprehensive Income Balance Sheet Statement of Changes in Equity Cash Flow Statement Notes to the Financial Statements Review Report
I NTER IM FI NANC IAL STATEMENTS (CON DENSED)
R EPORTI NG SEGMENTS: Q1 2011*
€ million
Passenger Cars
and Light Commercial
Vehicles Trucks and
Buses Power
Engineering Financial
Services Total
segments Recon-ciliation
Volkswagen Group
Sales revenue from
external customers 31,239 2,295 – 3,658 37,193 277 37,470
Intersegment sales revenue 1,885 49 – 260 2,194 – 2,194 –
Total sales revenue 33,124 2,345 – 3,918 39,386 – 1,916 37,470
Segment profit or loss (operating
profit or loss) 2,384 292 – 304 2,980 – 69 2,912
* The prior-year figures were adjusted.
R EPORTI NG SEGMENTS: Q1 2012
€ million
Passenger Cars
and Light Commercial
Vehicles Trucks and
Buses Power
Engineering Financial
Services Total
segments Recon-ciliation
Volkswagen Group
Sales revenue from
external customers 36,657 5,113 954 4,298 47,022 303 47,326
Intersegment sales revenue 2,240 66 – 397 2,702 – 2,702 –
Total sales revenue 38,897 5,179 954 4,695 49,725 – 2,399 47,326
Segment profit or loss (operating
profit or loss) 2,982 65 – 17 343 3,374 – 164 3,209
R ECONC I LIATION*
Q 1
€ million 2012 2011
Segment profit or loss (operating profit or loss) 3,374 2,980
Unallocated activities 50 62
Group financing – 18 3
Consolidation adjustments – 197 – 134
Operating profit 3,209 2,912
Financial result 1,090 – 688
Consolidated profit before tax 4,300 2,223
* The prior-year figures were adjusted.

42
14 | Related party disclosures
At 50.73%, Porsche Automobil Holding SE holds the majority of the voting rights in
Volkswagen AG.
The creation of rights of appointment for the State of Lower Saxony was resolved at the
Extraordinary General Meeting of Volkswagen AG on December 3, 2009. As a result, Porsche
Automobil Holding SE can no longer appoint the majority of the members of Volkswagen AG's
Supervisory Board for as long as the State of Lower Saxony holds at least 15% of Volkswagen
AG’s ordinary shares. However, Porsche Automobil Holding SE continues to have the power to
participate in the operating policy decisions of the Volkswagen Group.
S U P P L I E S A N D S E R V I C E S
R E N D E R E D
S U P P L I E S A N D S E R V I C E S
R E C E I V E D
Q 1 Q 1
€ million 2012 2011 2012 2011
Porsche Automobil Holding SE 0 0 – –
Supervisory Board members 0 0 0 0
Unconsolidated subsidiaries 399 302 191 186
Joint ventures 3,679 2,517 479 328
Associates1 71 15 133 34
Porsche Holding Salzburg, its majority interests and joint
ventures2 – 744 – 27
State of Lower Saxony, its majority interests and joint ventures 4 4 0 0
1 Suzuki Motor Corporation until September 13, 2011 and MAN SE until November 9, 2011.
2 Until February 28, 2011.
Based on the updated assumptions underlying the valuation, the call option on the shares of
Porsche Zwischenholding GmbH agreed in the Comprehensive Agreement with Porsche
Automobil Holding SE has a positive fair value of €8,990 million at the date of the interim
financial statements (December 31, 2011: €8,409 million) and the corresponding put option
has a negative fair value of €59 million (December 31, 2011: €87 million). The difference
attributable to the updated fair value was recognized in the other financial result.

43
Income Statement Statement of Comprehensive Income Balance Sheet Statement of Changes in Equity Cash Flow Statement Notes to the Financial Statements Review Report
I NTER IM FI NANC IAL STATEMENTS (CON DENSED)
Factoring-related financing of €0.2 billion (December 31, 2011: €0.2 billion) granted to a
subsidiary of Porsche Zwischenholding GmbH at standard market terms collateral was
outstanding as of March 31, 2012; €23 million of this amount (December 31, 2011: €103
million) was granted in the reporting period.
15 | Contingent assets and liabilities
There were no significant changes as of March 31, 2012 in the contingent assets and liabilities
described in the 2011 consolidated financial statements.
German Corporate Governance Code
The current declarations in accordance with section 161 of the Aktiengesetz (AktG – German
Stock Corporation Act) on the German Corporate Governance Code by the Board of
Management and Supervisory Board of Volkswagen AG, AUDI AG, MAN SE and Renk AG are
permanently available on the Internet at www.volkswagenag.com/ir, www.audi.com,
www.man.eu and www.renk.biz respectively.
Significant events after the balance sheet date
On April 18, 2012, AUDI AG signed an agreement to acquire 100% of the shares of Ducati Motor
Holding S.p.A. Bologna, Italy, an internationally renowned motorcycle manufacturer in the
premium segment. The agreement is subject to approval by the responsible antitrust
authorities.
Wolfsburg, April 26, 2012
Volkswagen Aktiengesellschaft
The Board of Management

44
This report was originally prepared in German. In case of ambiguities the German version shall
prevail:
Review Report
To VOLKSWAGEN AKTIENGESELLSCHAFT, Wolfsburg
We have reviewed the condensed consolidated interim financial statements – comprising the
condensed income statement and condensed statement of comprehensive income, condensed
balance sheet, condensed statement of changes in equity, condensed statement of cash flows
and selected explanatory notes – and the interim group management report of VOLKSWAGEN
AKTIENGESELLSCHAFT, Wolfsburg, for the period from January 1 to March 31, 2012, which
are part of the quarterly financial report pursuant to § (Article) 37x Abs. (paragraph) 3 WpHG
("Wertpapierhandelsgesetz": German Securities Trading Act). The preparation of the condensed
consolidated interim financial statements in accordance with the IFRSs applicable to interim
financial reporting, as adopted by the EU, and of the interim group management report in
accordance with the provisions of the German Securities Trading Act applicable to interim
group management reports is the responsibility of the parent Company’s Board of Management.
Our responsibility is to issue a review report on the condensed consolidated interim financial
statements and on the interim group management report based on our review.
We conducted our review of the condensed consolidated interim financial statements and
the interim group management report in accordance with German generally accepted
standards for the review of financial statements promulgated by the Institut der
Wirtschaftsprüfer (Institute of Public Auditors in Germany) (IDW). Those standards require that
we plan and perform the review so that we can preclude through critical evaluation, with
moderate assurance, that the condensed consolidated interim financial statements have not
been prepared, in all material respects, in accordance with the IFRSs applicable to interim
financial reporting, as adopted by the EU, and that the interim group management report has
not been prepared, in all material respects, in accordance with the provisions of the German
Securities Trading Act applicable to interim group management reports. A review is limited
primarily to inquiries of company personnel and analytical procedures and therefore does not
provide the assurance attainable in a financial statement audit. Since, in accordance with our
engagement, we have not performed a financial statement audit, we cannot express an audit
opinion.
Based on our review, no matters have come to our attention that cause us to presume that the
condensed consolidated interim financial statements have not been prepared, in all material
respects, in accordance with the IFRSs applicable to interim financial reporting, as adopted by
the EU, nor that the interim group management report has not been prepared, in all material
respects, in accordance with the provisions of the German Securities Trading Act applicable to
interim group management reports.
Hanover, April 26, 2012
PricewaterhouseCoopers
Aktiengesellschaft
Wirtschaftsprüfungsgesellschaft
Harald Kayser Martin Schröder
Wirtschaftsprüfer Wirtschaftsprüfer
(German Public Auditor) (German Public Auditor)
Review Report

Contact Information
PU BLISHED BY
Volkswagen AG
Finanzpublizität
Brieffach 1848-2
38436 Wolfsburg
Germany
Phone +49 5361 9-0
Fax +49 5361 9-28282
I NVESTOR REL ATIONS
Volkswagen AG
Investor Relations
Brieffach 1849
38436 Wolfsburg
Germany
Phone +49 5361 9-86622 IR Hotline
Fax +49 5361 9-30411
E-mail [email protected]
Internet www.volkswagenag.com/ir
Volkswagen AG
Investor Relations
17C Curzon Street
London W1J 5HU
United Kingdom
Phone +44 20 7290 7820
Volkswagen Group China
No. 3A, Xi Liu Jie, Sanlitun Road
Chaoyang District
Beijing 100027, P.R. China
Phone +86 10 6531 3000
Volkswagen Group of America, Inc.
Investor Relations Liaison Office
(Questions relating to American
Depositary Receipts)
2200 Ferdinand Porsche Drive
Herndon, Virginia 20171
USA
Phone +1 703 364 7000
This Interim Report is also available on the
Internet, in German and English, at: www.volkswagenag.com/ir
Printed in Germany
258.809.538.20
Financial Calendar
July 26, 2012
Half-Yearly Financial Report 2012
October 24, 2012
Interim Report January – September 2012

j a n u a r y – M a r c h 2 0 1 2
Interim Report