q2 2014 transformation update & financial results · ... inventory management ... retail...
TRANSCRIPT

Q2 2014Transformation Update & Financial Results
August 2014

2August 2014
Cautionary Statement Regarding Forward-Looking Information
This presentation contains forward-looking statements, including statements about our transformation through our integrated retail strategy, the opportunities, some of which are quantified, presented by a framework for profit, our plans to redeploy and reconfigure our assets, our liquidity and ability to exercise financial flexibility as we meet our obligations and possible strategic transactions. Forward-looking statements, including these, are based on the current beliefs and expectations of our management and are subject to significant risks, assumptions and uncertainties that may cause our actual results, performance or achievements to be materially different from any future results, performance or achievements expressed or implied by these forward-looking statements. In addition, the framework for profit is not intended to provide guidance or predict results; instead, it is intended to provide dimensional context for the potential opportunities for increasing profitability if we are successful in achieving the potential results outlined, which is subject to significant assumptions, uncertainties and risks, including those identified in the presentation relating to maintaining, reversing or otherwise improving or achieving certain performance metrics, including member penetration, level of member engagement and retention rates. There can be no assurance that any of these efforts will be successful. The statements concerning our evaluation of strategic alternatives for our interest in Sears Canada and our Sears Auto Centers business and the potential impact of the completion of such transactions also are subject to risks, assumptions and uncertainties, including our ability to enter into or complete either or both of such transactions on acceptable terms, on intended timetables or at all, the form or terms and conditions of any such transaction, and the impact of the evaluation and/or completion of any such transaction on our other businesses. The following additional factors, among others, could cause actual results to differ from those set forth in the forward-looking statements: our ability to offer merchandise and services that our customers want, including our proprietary brand products; our ability to successfully implement our integrated retail strategy; our ability to successfully implement initiatives to improve our liquidity through inventory management and other actions; our ability to successfully implement initiatives to redeploy and reconfigure our assets; our ability to retain actively engaged members while optimizing our store network; our ability to increase the number of highly active members; our ability to reduce and optimize costs and expenses and implement business initiatives, including those relating to the apparel business; competitive conditions in the retail and related services industries; worldwide economic conditions and business uncertainty, including the availability of consumer and commercial credit, changes in consumer confidence and spending, the impact of rising fuel prices and utility costs, and changes in vendor relationships; our ability to successfully achieve our plans to generate liquidity, reduce inventory and reduce fixed costs; conditions and possible limits, including borrowing base limits, on our access to capital markets and other financing sources, including additional second lien financings, with respect to which we do not have commitments from lenders; vendors’ lack of willingness to provide acceptable payment terms or otherwise restricting financing to purchase inventory or services; the impact of seasonal buying patterns, including seasonal fluctuations due to weather conditions, which are difficult to forecast with certainty; our dependence on sources outside the United States for significant amounts of our merchandise; our extensive reliance on computer systems, including legacy systems, to implement our integrated retail strategy, process transactions, summarize results and manage our business, which may be subject to disruptions or security breaches; our reliance on third parties to provide us with services in connection with the administration of certain aspects of our business and the transfer of significant internal historical knowledge of such parties; impairment charges for goodwill and intangible assets or fixed-asset impairments for long-lived assets; our ability to attract, motivate and retain key executives and other associates; our ability to protect or preserve the image of our brands; the outcome of pending and/or future legal proceedings, including product liability claims and proceedings with respect to which the parties have reached a preliminary settlement; the timing and amount of required pension plan funding which is dependent upon many factors, including returns on invested assets, the discount rates used to determine pension obligations, and/or changes in regulations or other regulatory action; the impact of fluctuations in interest rates on our pension liabilities as well as the amounts required to meet obligations in connection with our borrowings; and other risks, uncertainties and factors discussed in our most recent Annual Report on Form 10-K and other filings with the Securities and Exchange Commission. We intend the forward-looking statements to speak only as of the time made and do not undertake to update or revise them as more information becomes available.

3August 2014
Non-GAAP Financial Measures
For purposes of evaluating operating performance, we use an Adjusted Earnings Before Interest, Taxes,
Depreciation and Amortization ("Adjusted EBITDA") measurement. Adjusted EBITDA is computed as net loss
attributable to Sears Holdings Corporation appearing on the statements of operations excluding (income) loss
attributable to noncontrolling interests, income tax expense, interest expense, interest and investment income, other
income loss, depreciation and amortization and gain on sales of assets. In addition, it is adjusted to exclude certain
significant items as set forth below. Our management uses Adjusted EBITDA to evaluate the operating performance
of our businesses, as well as executive compensation metrics, for comparable periods. Adjusted EBITDA should not
be used by investors or other third parties as the sole basis for formulating investment decisions as it excludes a
number of important cash and non-cash recurring items. While Adjusted EBITDA is a non-GAAP measurement,
management believes that it is an important indicator of ongoing operating performance and useful to investors
because:
• EBITDA excludes the effects of financing and investing activities by eliminating the effects of interest and
depreciation costs;
• Management considers gains/(losses) on the sale of assets to result from investing decisions rather than ongoing
operations; and
• Other significant items, while periodically affecting our results, may vary significantly from period to period and
have a disproportionate effect in a given period, which affects the comparability of results, including the results of
Lands’ End that were included in our results of operations prior to the separation. We have adjusted our results for
these items to make our statements more comparable and therefore more useful to investors as the items are not
representative of our ongoing operations and reflect past investment decisions.
See appendix for reconciliations of the differences between the non-GAAP financial measures used in this
presentation with the most comparable financial measures calculated in accordance with GAAP.

4August 2014
Topics
� Progress on Our Transformation & Second Quarter Updates
� Second Quarter Results & Financial Position
� Update on Asset Redeployment and Reconfiguration Activities
� A Framework For Profit Update

5August 2014
Progress On Our Transformation

6August 2014
Our Transformation
� Product Centric
� Transactions with Customers
� Store Focus
� Mass Marketing
� Uniform Pricing
� High Fixed Cost Infrastructure
� Asset Intensive
Traditional Store Network Model
� Member Centric
� Relationships with Members
� Integrated Retail Alternatives
� Personalization
� Dynamic Pricing
� Greater Proportion of Costs Variable
� Less Asset Intensive
Member-Centric Integrated Retail Model
7August 2014
Executive Summary
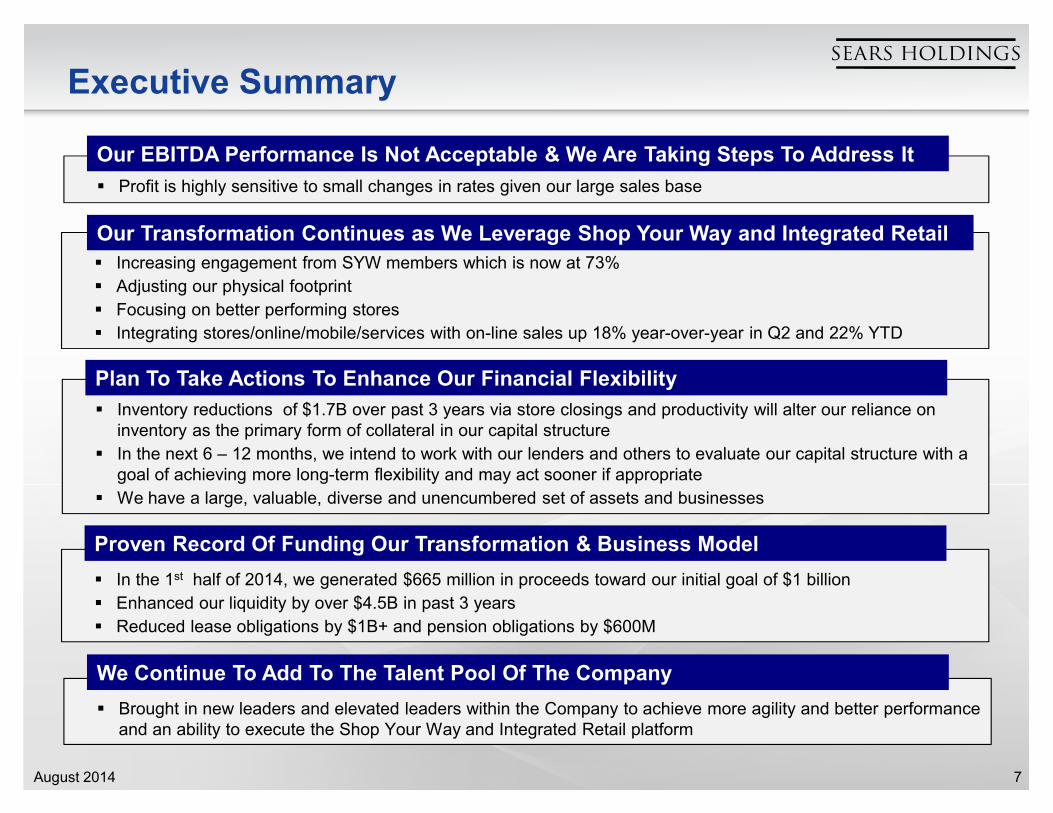
� Profit is highly sensitive to small changes in rates given our large sales base
Our EBITDA Performance Is Not Acceptable & We Are Taking Steps To Address It
� Increasing engagement from SYW members which is now at 73%
� Adjusting our physical footprint
� Focusing on better performing stores
� Integrating stores/online/mobile/services with on-line sales up 18% year-over-year in Q2 and 22% YTD
Our Transformation Continues as We Leverage Shop Your Way and Integrated Retail
� Inventory reductions of $1.7B over past 3 years via store closings and productivity will alter our reliance on inventory as the primary form of collateral in our capital structure
� In the next 6 – 12 months, we intend to work with our lenders and others to evaluate our capital structure with a goal of achieving more long-term flexibility and may act sooner if appropriate
� We have a large, valuable, diverse and unencumbered set of assets and businesses
Plan To Take Actions To Enhance Our Financial Flexibility
� In the 1st half of 2014, we generated $665 million in proceeds toward our initial goal of $1 billion
� Enhanced our liquidity by over $4.5B in past 3 years
� Reduced lease obligations by $1B+ and pension obligations by $600M
Proven Record Of Funding Our Transformation & Business Model
� Brought in new leaders and elevated leaders within the Company to achieve more agility and better performance and an ability to execute the Shop Your Way and Integrated Retail platform
We Continue To Add To The Talent Pool Of The Company
8August 2014
Second Quarter Results & Financial Position

9August 2014
Sears Holdings Consolidated Results1
Amounts in millions, except per share amounts 2014 2013 2014 2013
Revenues 8,013$ 8,871$ 15,892$ 17,323$
Gross margin dollars 1,742$ 2,186$ 3,570$ 4,342$
Gross margin rate 21.7% 24.6% 22.5% 25.1%
Selling and administrative expense 2,118$ 2,291$ 4,207$ 4,509$
Selling and administrative rate 26.4% 25.8% 26.5% 26.0%
Net Loss attributable to Holdings' Shareholders (573)$ (194)$ (975)$ (473)$
EPS (5.39)$ (1.83)$ (9.17)$ (4.46)$
Adjusted net loss2
(305)$ (166)$ (541)$ (309)$
Adjusted EPS2 (2.87)$ (1.56)$ (5.09)$ (2.91)$
Adjusted EBITDA2 (313)$ (78)$ (534)$ (104)$
Adjusted EBITDA By Segment2
Sears Domestic (178)$ (43)$ (269)$ (58)$
Kmart (120) (30) (207) (30)
Sears Canada (15) (5) (58) (16)
Total (313)$ (78)$ (534)$ (104)$
Second Quarter Year-to-date
We Have Substantial Revenue Scale Which Allows For Small Changes In Margin Rates To Have Large Effects On Profitability
(1) See slides 47 and 48 in appendix for a more detailed breakout by segment.
(2) Reconciliations to the most directly comparable GAAP financial measures can be found in the appendix on slides 49, 50 and 51.
For each 100 basis point
improvement in margin rate,
we would see a $80 million
improvement in EBITDA
Every 2% reduction in selling and
administrative expense, or 50 basis point rate improvement,
would result in a $40 million
improvement in EBITDA

10August 2014
Second QuarterYear-Over-Year Revenue Change
Q2 2013 DomesticClosed Stores
Lands' End Comp Sales Other Sears Canada Q2 2014
(1) Consists primarily of the impact of declines in home services revenue and the impact of free delivery promotions in home appliances.
$ %
Domestic Closed Stores (256)$ 29.8%
Lands' End (330) 38.5%
Comp Sales (47) 5.5%
Other (85) 9.9%
Sears Canada (140) 16.3%
Total (858)$ 100.0%
Summary of Year-Over-Year Revenue Change
Amounts in millions
$8,871
($330)($85) $8,013($47)
($140)
($256)
(1)
See slide 40 in appendix for year-to-date analysis

11August 2014
Second Quarter Updates
71%
73%
Q2 2013 Q2 2014
Continued Growth of Shop Your Way Member Sales Penetration1
Q2 2009 Q2 2010 Q2 2011 Q2 2012 Q2 2013 Q2 2014
Traditional Online Cross Channel
18% Year-Over-Year Growth in Online & Multichannel Sales
Comparable Store Sales Trends
-0.8%
0.1%
Q2 2013 Q2 2014
Sears Domestic Comp Store Sales
-2.1% -1.7%
Q2 2013 Q2 2014
Kmart Comp Store Sales
(1) Member sales penetration is defined as the percentage of eligible sales that are made to Shop Your Way members

12August 2014
Second QuarterDomestic Comparable Store Sales
Comp Store Sales Performance
Format Q2 2014 Drivers
Sears Domestic 0.1%
Appliances
Mattresses
Electronics
Lawn & Garden
Auto
Kmart -1.7%Grocery & Household
Appliances
Apparel
Total Domestic -0.8%
See slide 41 in appendix for year-to-date analysis
Excluding the impact of consumer electronics, Sears Domestic comp store sales would have
been +1.6%
Excluding the impact of grocery & household
and consumer electronics, Kmart
comp store sales would have been -1.0%
Excluding the impact of consumer electronics
and grocery & household, Total SHC Domestic comp store
sales would have been +0.4%

13August 2014
Second QuarterYear-Over-Year Margin Changes
Amounts in millions
$ %
Domestic Closed Stores (54)$ 12.1%
Lands' End (126) 28.4%
Comp Sales (1) 0.2%
Rate (166) 37.4%
SYW Points (43) 9.7%
Sears Canada (54) 12.2%
Total (444)$ 100%
Summary of Year over Year Margin Change
Q2 2013 DomesticClosed Stores
Lands' End Comp Sales Rate SYW Points Sears Canada Q2 2014
$2,186
($126)
($166)
($54)($43)
$1,742
• Currently carrying costs of two promotional programs: Points and Promotional Markdowns (“PMDs”)
• As model evolves, expect points to be substitute for PMDs, resulting in improved margin rate
($1)
($54)
DomesticOperating Performance
($167)
SYW Investment
• Higher points cost is result of higher member engagement
• Points expense recognized when points are issued
• Expect to see margin benefit from points issued in Q2 throughout 2014 as these points are redeemed
See slide 42 in appendix for year-to-date analysis
14August 2014
Financial Position & Liquid Assets
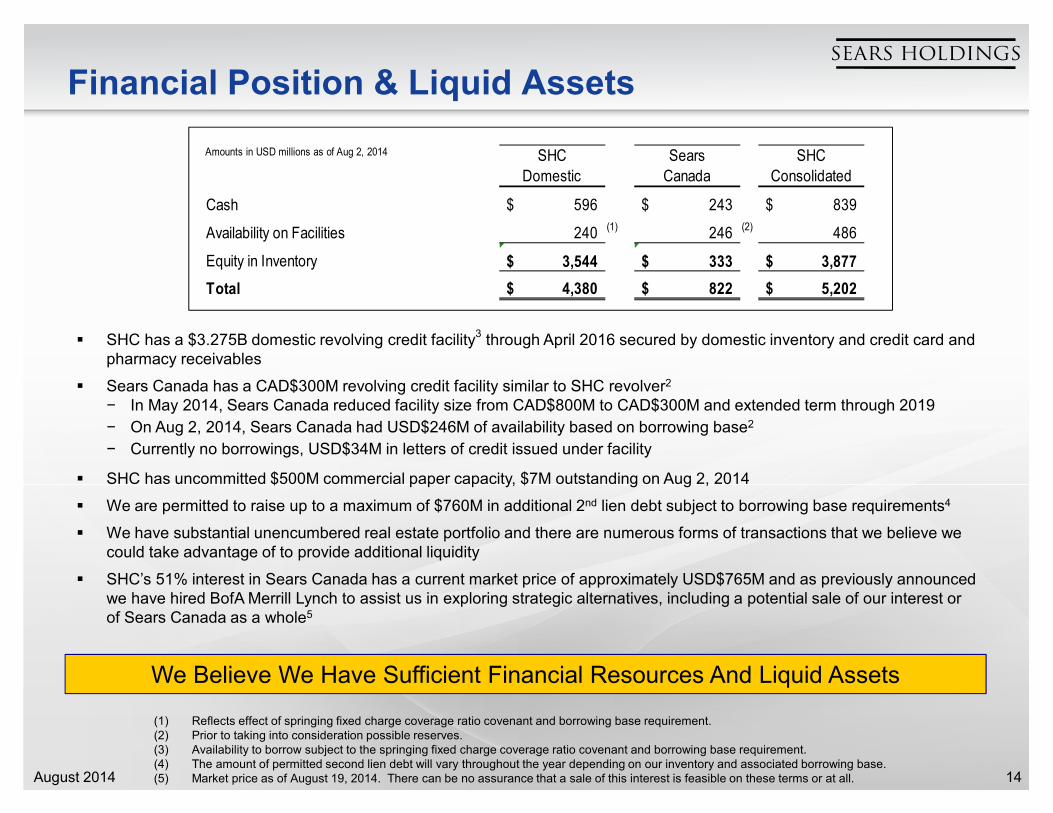
� SHC has a $3.275B domestic revolving credit facility3
through April 2016 secured by domestic inventory and credit card and pharmacy receivables
� Sears Canada has a CAD$300M revolving credit facility similar to SHC revolver2
− In May 2014, Sears Canada reduced facility size from CAD$800M to CAD$300M and extended term through 2019
− On Aug 2, 2014, Sears Canada had USD$246M of availability based on borrowing base2
− Currently no borrowings, USD$34M in letters of credit issued under facility
� SHC has uncommitted $500M commercial paper capacity, $7M outstanding on Aug 2, 2014
� We are permitted to raise up to a maximum of $760M in additional 2nd lien debt subject to borrowing base requirements4
� We have substantial unencumbered real estate portfolio and there are numerous forms of transactions that we believe we could take advantage of to provide additional liquidity
� SHC’s 51% interest in Sears Canada has a current market price of approximately USD$765M and as previously announced we have hired BofA Merrill Lynch to assist us in exploring strategic alternatives, including a potential sale of our interest or of Sears Canada as a whole5
We Believe We Have Sufficient Financial Resources And Liquid Assets
(1) Reflects effect of springing fixed charge coverage ratio covenant and borrowing base requirement.(2) Prior to taking into consideration possible reserves.(3) Availability to borrow subject to the springing fixed charge coverage ratio covenant and borrowing base requirement.(4) The amount of permitted second lien debt will vary throughout the year depending on our inventory and associated borrowing base.(5) Market price as of August 19, 2014. There can be no assurance that a sale of this interest is feasible on these terms or at all.
*
*
Amounts in USD millions as of Aug 2, 2014 SHC
Domestic
Sears
Canada
SHC
Consolidated
Cash 596$ 243$ 839$
Availability on Facilities 240 (1) 246 (2) 486
Equity in Inventory 3,544$ 333$ 3,877$
Total 4,380$ 822$ 5,202$

15August 2014
De-risking the Business ModelSecond Quarter Consolidated Net Inventory
$8,653
$7,708
$6,383
$3,088 $2,903 $2,506
$5,565 $4,805
$3,877
2012 2013 2014 2012 2013 2014 2012 2013 2014
Inventory Payables Net Inventory(1)
~$800M of ~$2.3B Inventory Reduction Due to 2012 SHO
& 2014 LE Separations
By Reducing Our Net Inventory Investment And Our Payables We Have Decreased The Level Of Vendor Support Needed To Run Our Business, Potentially De-risking
Our Business Model In A Way That Benefits Us And Our Vendor-partners
Reduced Net Inventory Investment By ~$1.7B
Amounts in USD millions
Payable Reduction of $582M Further De-Risks Our
Business Model
We Are Running Our Business With Less Inventory On An Absolute And Seasonal Basis
(1) Net Inventory at Sears Canada was $392M, $438M, and $333M at the end of the second quarter in fiscal 2012, 2013, and 2014, respectively.
16August 2014
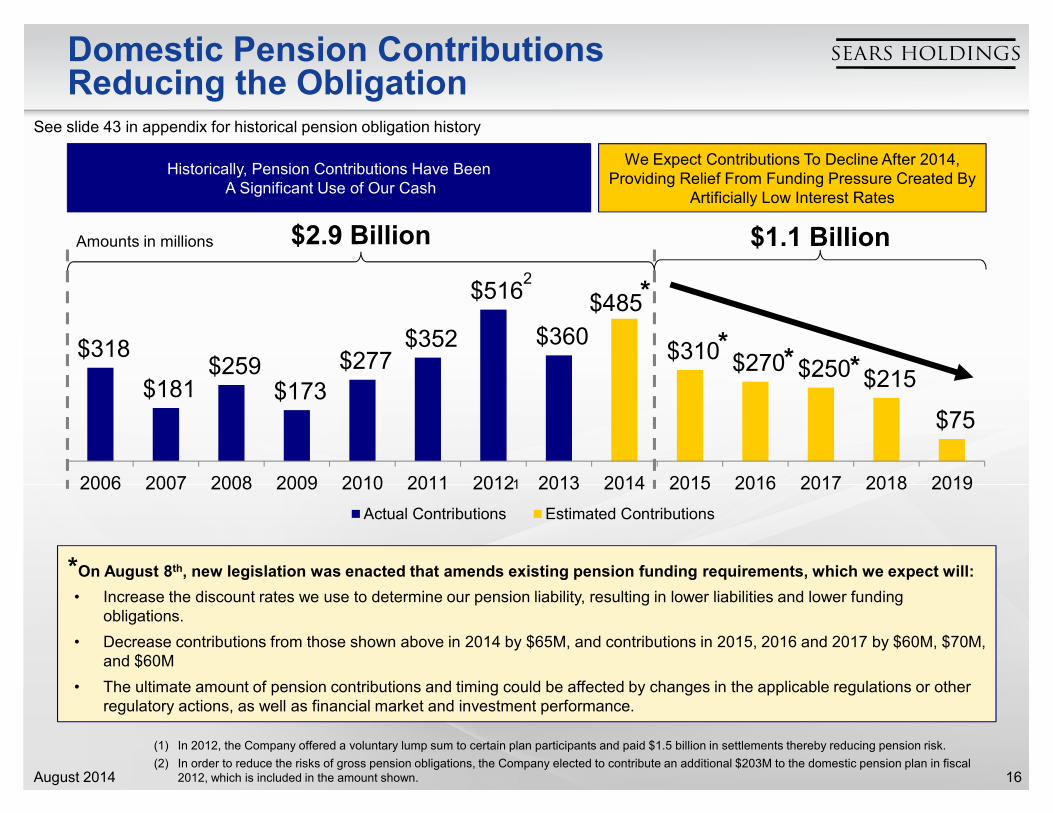
Domestic Pension ContributionsReducing the Obligation
$318
$181 $259
$173
$277 $352
$516
$360
$485
$310 $270 $250 $215
$75
2006 2007 2008 2009 2010 2011 2012 2013 2014 2015 2016 2017 2018 2019
Actual Contributions Estimated Contributions
Amounts in millions $2.9 Billion
(1) In 2012, the Company offered a voluntary lump sum to certain plan participants and paid $1.5 billion in settlements thereby reducing pension risk.
(2) In order to reduce the risks of gross pension obligations, the Company elected to contribute an additional $203M to the domestic pension plan in fiscal 2012, which is included in the amount shown.
1
2
$1.1 Billion
*On August 8th, new legislation was enacted that amends existing pension funding requirements, which we expect will:
• Increase the discount rates we use to determine our pension liability, resulting in lower liabilities and lower funding obligations.
• Decrease contributions from those shown above in 2014 by $65M, and contributions in 2015, 2016 and 2017 by $60M, $70M, and $60M
• The ultimate amount of pension contributions and timing could be affected by changes in the applicable regulations or other regulatory actions, as well as financial market and investment performance.
Historically, Pension Contributions Have BeenA Significant Use of Our Cash
We Expect Contributions To Decline After 2014, Providing Relief From Funding Pressure Created By
Artificially Low Interest Rates
See slide 43 in appendix for historical pension obligation history
*
** *

17August 2014
De-risking the Balance SheetDomestic Net Debt PositionAmounts in millions
August 2, 2014 August 3, 2013
Unsecured Commercial Paper 7$ 247$
Secured Borrowings 1,397 1,509
Total Short-Term Borrowings 1,404 1,756
Senior Secured Notes 1,238$ 1,237$
SRAC Notes 327 327
Term Loan 987 -
Other Notes/Mortgages 14 18
SHC Borrowings 2,566 1,582
Domestic Capital Lease Obligations 291 331
Total Domestic Long-Term Debt 2,857$ 1,913$
Total Domestic Debt 4,261$ 3,669$
Adjustments
Less: Cash - Domestic 596$ 383$
Add: Unfunded Pension - Domestic(1) 1,491$ 2,090$
"Adjusted" Domestic Net Debt Position(2) 5,156$ 5,376$
Q2 Pension Contributions - Domestic 84$ 74$
Q2 End
Revolver Borrowings Decline (112)$
Commercial Paper Decline (240)
Change in Short-Term Borrowings (352)
(213)
Change in Net Short-Term Borrowings (565)$
Year-Over-Year Decline in Net Short-Term Borrowings
Cash Increase - Domestic
SHC is using one form of debt, i.e. the Revolver, to fund another form of debt, the legacy pension obligation. Of the Q2 2014 Revolver balance of $1,397M, $393M was driven over the past twelve months by pension contributions, as distinguished from funding operating results
Reduced Net Short-Term Borrowings And Continued To De-Risk Pension Liability
Q2 2013 Revolver Borrowings 1,509$
Less: Pension Contributions (Prior 6 Qtrs.) (665)
Pro Forma Q2 2013 Revolver Borrowings 844$
Less: Decrease in Revolver Q2 2013 to Q2 2014 (112)
(393)
Pro Forma Q2 2014 Revolver Borrowings 339$
Impact of Pension Contributions on Revolver Usage
Less: LTM Pension Contributions
(1) As of fiscal year end.(2) “Adjusted” Consolidated Net Debt Position is $5,027M for Q2 2014 and $5,327M for Q2 2013.(3) Market price as of August 19, 2014. There can be no assurance that a sale of this interest is feasible on these terms or at all.
SHC’s 51% interest in Sears Canada has a current market prices of approximately USD$765M3. If we are successful in monetizing this stake, and any of the proceeds are applied to the domestic revolver, the Q2 2014 domestic revolver and Adjusted Domestic Net Debt would decline accordingly.
18August 2014
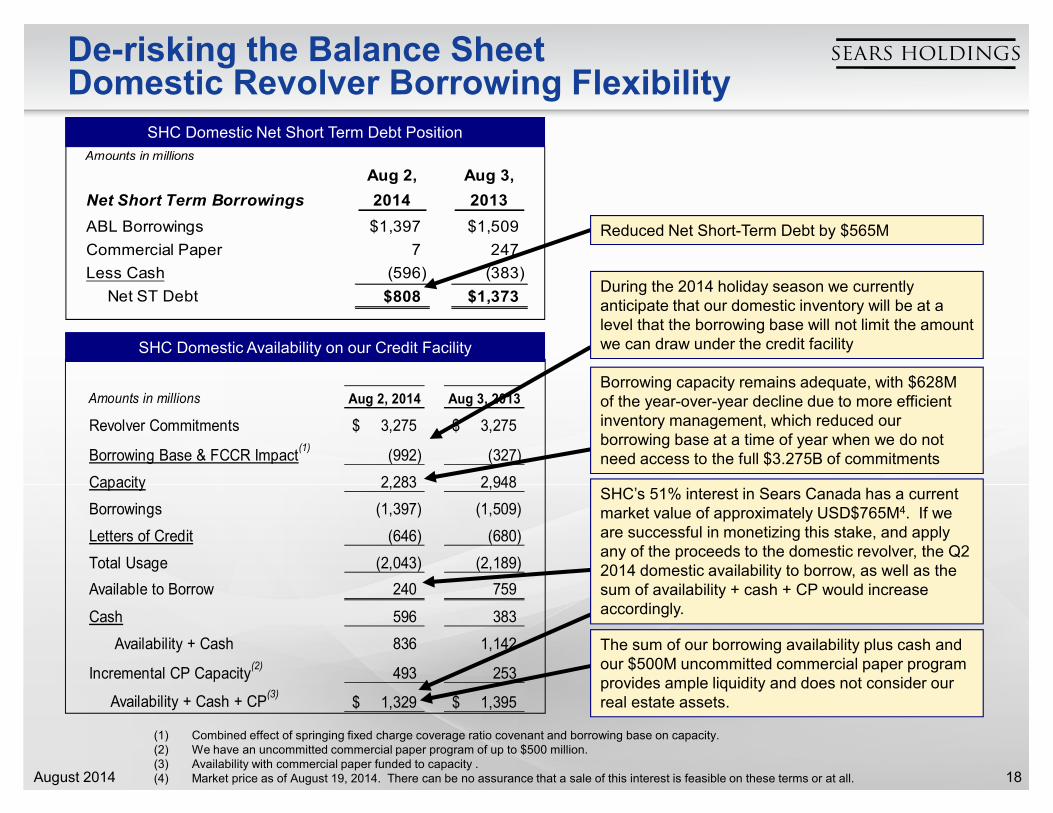
De-risking the Balance SheetDomestic Revolver Borrowing Flexibility
Amounts in millions Aug 2, 2014 Aug 3, 2013
Revolver Commitments 3,275$ 3,275$
Borrowing Base & FCCR Impact(1)
(992) (327)
Capacity 2,283 2,948
Borrowings (1,397) (1,509)
Letters of Credit (646) (680)
Total Usage (2,043) (2,189)
Available to Borrow 240 759
Cash 596 383
Availability + Cash 836 1,142
Incremental CP Capacity(2)
493 253
Availability + Cash + CP(3)
1,329$ 1,395$
Amounts in millions
Net Short Term Borrowings
Aug 2,
2014
Aug 3,
2013
ABL Borrowings $1,397 $1,509
Commercial Paper 7 247
Less Cash (596) (383)
Net ST Debt $808 $1,373
SHC Domestic Net Short Term Debt Position
SHC Domestic Availability on our Credit Facility
(1) Combined effect of springing fixed charge coverage ratio covenant and borrowing base on capacity.(2) We have an uncommitted commercial paper program of up to $500 million.(3) Availability with commercial paper funded to capacity .(4) Market price as of August 19, 2014. There can be no assurance that a sale of this interest is feasible on these terms or at all.
Reduced Net Short-Term Debt by $565M
Borrowing capacity remains adequate, with $628M of the year-over-year decline due to more efficient inventory management, which reduced our borrowing base at a time of year when we do not need access to the full $3.275B of commitments
During the 2014 holiday season we currently anticipate that our domestic inventory will be at a level that the borrowing base will not limit the amount we can draw under the credit facility
The sum of our borrowing availability plus cash and our $500M uncommitted commercial paper program provides ample liquidity and does not consider our real estate assets.
SHC’s 51% interest in Sears Canada has a current market value of approximately USD$765M4. If we are successful in monetizing this stake, and apply any of the proceeds to the domestic revolver, the Q2 2014 domestic availability to borrow, as well as the sum of availability + cash + CP would increase accordingly.

19August 2014
De-risking Our ObligationsConsistently Reduced Lessee Obligation
$6,617 $6,259
$5,514 $5,060
$4,729 $4,343
$3,646 $3,460
2007 2008 2009 2010 2011 2012 2013 2014Est.
$883 $864 $864 $813 $826 $794 $721Annual Rent
Expense
Amounts in millions
Reducing Net Minimum Lease Payments Decreases Corporate Obligations And Further De-Risks Our Business Model
As We Continue To Adjust Our Store Footprint We Expect To Further Reduce Lease Obligations
1
(1) Estimated as of the end of the second quarter 2014.

20August 2014
Term Debt Maturities
$6 $13 $13 $60
$2,190
$284
2014 2015 2016 2017 2018 Thereafter
As of August 2, 2014Amounts in millions
Minimal Long-Term Debt Maturities Until 2018
21August 2014
Asset Redeployment & Reconfiguration
22August 2014
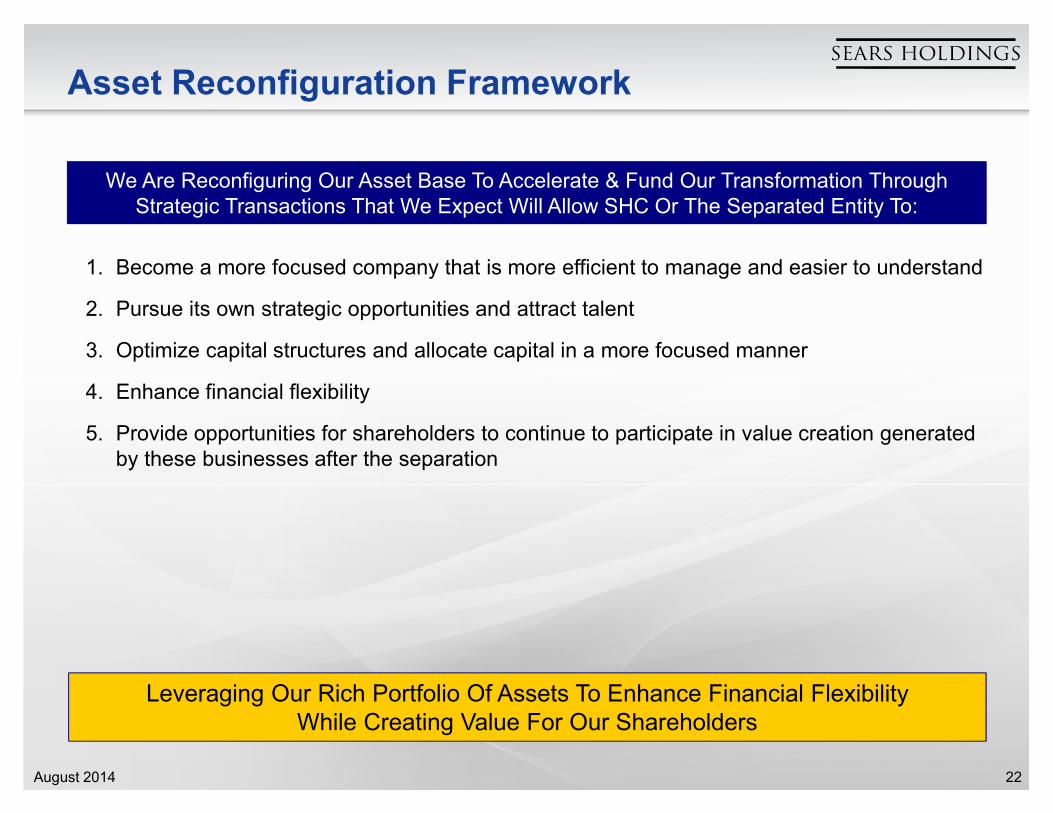
Asset Reconfiguration Framework
1. Become a more focused company that is more efficient to manage and easier to understand
2. Pursue its own strategic opportunities and attract talent
3. Optimize capital structures and allocate capital in a more focused manner
4. Enhance financial flexibility
5. Provide opportunities for shareholders to continue to participate in value creation generated by these businesses after the separation
Leveraging Our Rich Portfolio Of Assets To Enhance Financial Flexibility While Creating Value For Our Shareholders
We Are Reconfiguring Our Asset Base To Accelerate & Fund Our Transformation Through Strategic Transactions That We Expect Will Allow SHC Or The Separated Entity To:
23August 2014
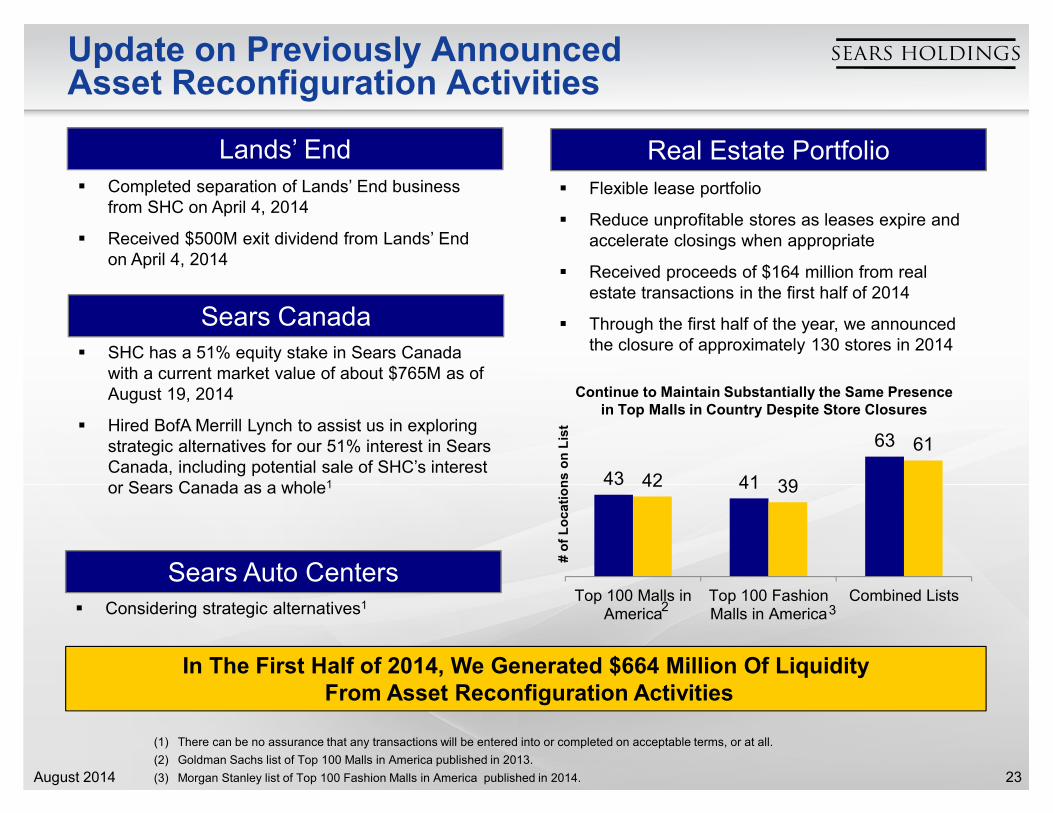
Update on Previously AnnouncedAsset Reconfiguration Activities
In The First Half of 2014, We Generated $664 Million Of LiquidityFrom Asset Reconfiguration Activities
Lands’ End
Sears Canada
Sears Auto Centers
Real Estate Portfolio� Completed separation of Lands’ End business
from SHC on April 4, 2014
� Received $500M exit dividend from Lands’ End on April 4, 2014
� SHC has a 51% equity stake in Sears Canada with a current market value of about $765M as of August 19, 2014
� Hired BofA Merrill Lynch to assist us in exploring strategic alternatives for our 51% interest in Sears Canada, including potential sale of SHC’s interest or Sears Canada as a whole1
� Considering strategic alternatives1
� Flexible lease portfolio
� Reduce unprofitable stores as leases expire and accelerate closings when appropriate
� Received proceeds of $164 million from real estate transactions in the first half of 2014
� Through the first half of the year, we announced the closure of approximately 130 stores in 2014
(1) There can be no assurance that any transactions will be entered into or completed on acceptable terms, or at all.
(2) Goldman Sachs list of Top 100 Malls in America published in 2013.
(3) Morgan Stanley list of Top 100 Fashion Malls in America published in 2014.
43 41
63
42 39
61
Top 100 Malls inAmerica
Top 100 FashionMalls in America
Combined Lists
# o
f Locations o
n L
ist
Continue to Maintain Substantially the Same Presence in Top Malls in Country Despite Store Closures
2 3

24August 2014
A Framework For Profit

25August 2014
Commitment to Our Shareholders
Throughout our transformation, we will remain committed to:
� Serving Our Members Better
� Driving Sustainable and Profitable Growth
� Maintaining Disciplined Stewardship of Capital
Creating Value For Our Shareholders

26August 2014
Framework Summary
Components of the plan intend to leverage our scale, and include:
• Optimizing store network and square footage
• Accelerating Shop Your Way & Integrated Retail as the foundation of our business model
• Transforming select business models
• Reducing expenses
A Framework For Profit Centered Around Our Two Strategic PlatformsShop Your Way & Integrated Retail

27August 2014
Store OptimizationImpact of Annual Member Retention for 2014 Store Closings
Potential Impact If Successful In Optimizing Store Network While Retaining Portion Of Actively Engaged Members Is $300-$400 Million Annual Incremental EBITDA1,3,5
(1) Note that potential impact of initiatives are for SHC Domestic.(2) Assumes historical experience associated with engaged member penetration rates as well as active engagement member retention rates (the latter of
which are based on stores closed from June of 2013 until the present) continues in future store closings, for which no assurance can be given. (3) EBITDA assumes gross margin rates that are currently realized at the Sears and Kmart format levels.(4) Based on 128 announced closings through first half of 2014.(5) Assumes our ability to retain members will improve as we continue to invest in Shop Your Way and Integrated Retail capabilities
By closing negative EBITDA stores and retaining a relationship with our members we expect toimprove profitability and reduce working capital while optimizing our store network
Stage 1Optimize Store Network Size
Stage 2Migrate Members to Other Channels
$983
$(26)Sales EBITDA
FY 2013 Performance of Stores Announced for Closure in 2014
$184 $47
Sales EBITDA
Potential Annualized Impact of Retaining Members Who Shopped These Stores
• Should generate $26M of incremental annualized EBITDA by avoiding losses from these underperforming locations
• Expected to reduce working capital requirements by $(156)M
• Shop Your Way & Integrated Retail enables us to maintain relationships and retain sales with members after store closures
$73M Annualized Profit Improvement1,2,3,4

28August 2014
Integrated RetailIn-Store Initiatives Underway
iPad 9:24 PMiPad 9:24 PM
Shop Sears# Stores
Digital Signs# Stores
RFIDs# Stores
Currently Implemented 571 60 12
2014 Approved / Plan 647 / 671 252 / 252 221 / 221
Potential Future State Format Wide
Continue to see financial benefit from Integrated Retail Initiatives such as Digital Signs and RFID
Potential Impact If Successful With Integrated Retail Initiatives Underway Is$500 million Annual Incremental Revenue and
$150-$200 million of Annual Incremental EBITDA1,4
3.7%
10.2%
2.1%
11.1%
Digital Signs (HA) RFID (Apparel)
Revenue Gross Margin
Investments in ShopSears application provide the foundation for integrated retail capabilities
Benefits for Members:� Access product information
and in-store availability
� Access product reviews
� Side-by-side product comparison
� Mobile checkout
� Shopper Recap
2 3
(1) Note that potential impact of initiatives are for SHC Domestic.(2) Digital signs impact is actuals based on testing in home appliances category in select stores.(3) RFIDs impact is actuals based on testing in apparel category in select stores.(4) Assumes results achieved in the currently implemented store population for revenue and margin improvement, as shown in the table above, are
achieved format wide, including potential impacts from store optimization actions, for which no assurance can be given.
We are on track with the roll-out of Integrated Retail initiatives
29August 2014
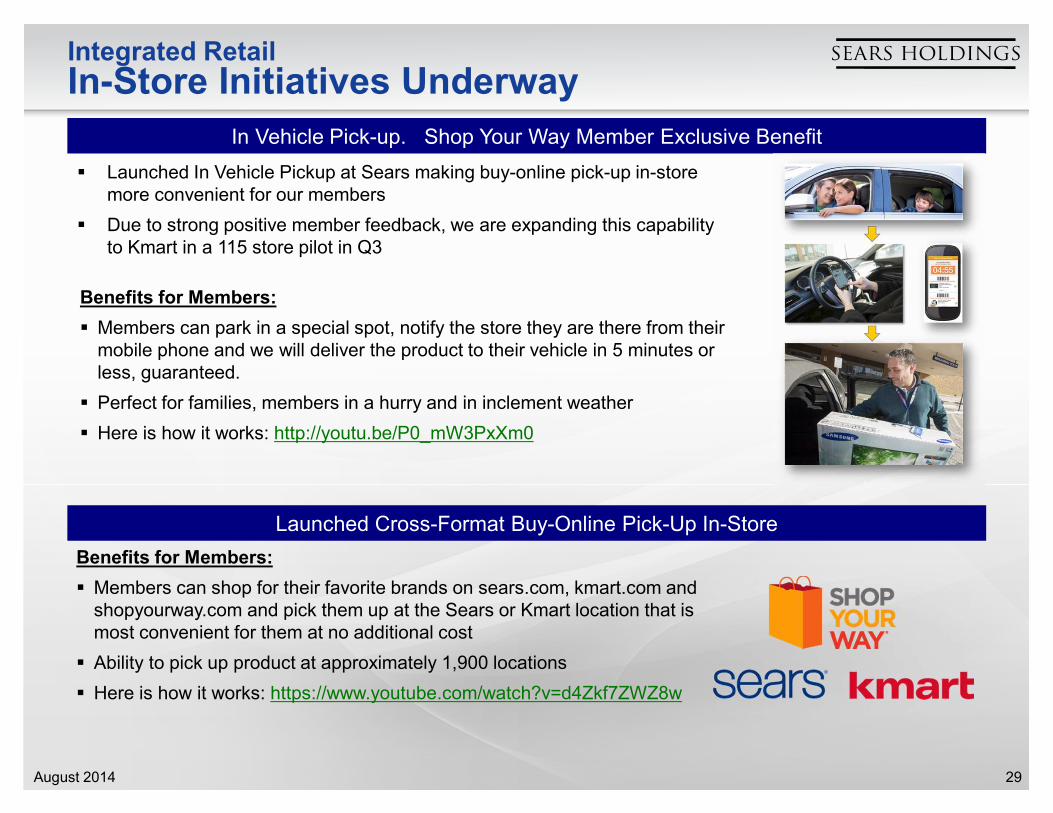
In Vehicle Pick-up. Shop Your Way Member Exclusive Benefit
� Launched In Vehicle Pickup at Sears making buy-online pick-up in-store more convenient for our members
� Due to strong positive member feedback, we are expanding this capability to Kmart in a 115 store pilot in Q3
Integrated Retail
In-Store Initiatives Underway
Benefits for Members:
� Members can park in a special spot, notify the store they are there from their mobile phone and we will deliver the product to their vehicle in 5 minutes or less, guaranteed.
� Perfect for families, members in a hurry and in inclement weather
� Here is how it works: http://youtu.be/P0_mW3PxXm0
Launched Cross-Format Buy-Online Pick-Up In-Store
Benefits for Members:
� Members can shop for their favorite brands on sears.com, kmart.com and shopyourway.com and pick them up at the Sears or Kmart location that is most convenient for them at no additional cost
� Ability to pick up product at approximately 1,900 locations
� Here is how it works: https://www.youtube.com/watch?v=d4Zkf7ZWZ8w

30August 2014
Shop Your Way Member Engagement
Total Active Member Population Most Highly Active Member
Annual Average Spend Per Member
75%
Potential Impact If Successful In Shifting 1 Million Active Members To Most Active Status is $50 Million in Annual Incremental EBITDA1,2
3 4
We continue to see signs of increased member engagement:
� Number of members redeeming points in the last 12 months has increased
� Number of active emailable members has increased
Actively Engaged Members Continue To Spend 75% More Than The Average Active Member
(1) Note that potential impact of initiatives are for SHC Domestic.(2) Assumes we are able to effectively use member data to provide more relevant personalized marketing content that will drive higher member
engagement. (3) An Active Member is defined as a member that has transacted at least one time in the last 12 months.(4) Assumes the average annual spend for a highly active member, defined as an active member that transacts across both Sears and Kmart formats,
does not decline, for which no assurances can be given.

31August 2014
Enhance MarginsOptimize Cost of Goods Sold
Opportunities To Optimize Cost Of Goods Sold
� Strategic Sourcing
� Increase Private Label Penetration
� Surgical Pricing
� Move from PMDs to Points for more efficient promotional model
� Improved flow of merchandise
� Aged Inventory Reduction
� Supply chain optimization
� In-store leasing (rental income)
Potential Impact If Successful In A 1% Reduction In Cost Of Goods Sold Is $230 Million Of Annual Incremental EBITDA1, 2, 3
$7.9
$23.6
$31.5
Cost ofGoods Sold
Selling &Administrative Expense
TotalExpense
FY 2013 Actuals1
($ in billions)
(1) Note that FY 2013 actuals shown and the potential impact of initiatives are for SHC Domestic and exclude Lands’ End.(2) Assumes we are able to execute, or continue to execute, in additional product categories, the cost reduction initiatives that we have already
implemented in certain product categories.(3) Assumes we are able to execute on the cost reduction initiatives that we have identified but not yet implemented.
Strategic Sourcing Update: Second Quarter Initiatives Expected to Create Savings
• Year-to-Date, we have executed a number of strategic sourcing initiatives that we believe may improve improve profitability by up to $80M on an annualized basis
• We are continuing to utilize the strategic sourcing framework to identify additional savings across both merchandise and non-merchandise sourcing
32August 2014
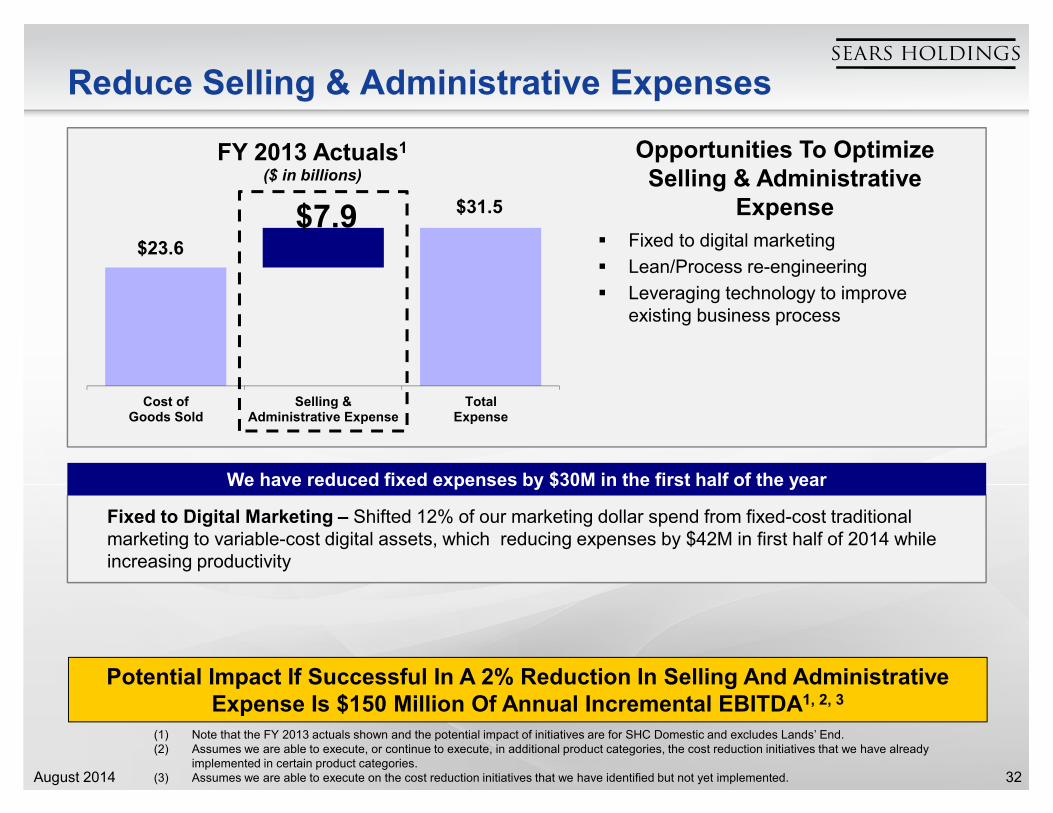
Reduce Selling & Administrative Expenses
Opportunities To Optimize Selling & Administrative
Expense
� Fixed to digital marketing
� Lean/Process re-engineering
� Leveraging technology to improve existing business process
Potential Impact If Successful In A 2% Reduction In Selling And Administrative Expense Is $150 Million Of Annual Incremental EBITDA1, 2, 3
$7.9 $23.6
$31.5
Cost ofGoods Sold
Selling &Administrative Expense
TotalExpense
FY 2013 Actuals1
($ in billions)
(1) Note that the FY 2013 actuals shown and the potential impact of initiatives are for SHC Domestic and excludes Lands’ End.(2) Assumes we are able to execute, or continue to execute, in additional product categories, the cost reduction initiatives that we have already
implemented in certain product categories.(3) Assumes we are able to execute on the cost reduction initiatives that we have identified but not yet implemented.
Fixed to Digital Marketing – Shifted 12% of our marketing dollar spend from fixed-cost traditional marketing to variable-cost digital assets, which reducing expenses by $42M in first half of 2014 while increasing productivity
We have reduced fixed expenses by $30M in the first half of the year

33August 2014
Business InitiativesApparel Productivity
SHC Apparel productivity is 1/3 the industry average
Opportunities� Increase inventory turn by improving current
assortments and brand propositions
� Introduce innovations in fabrics and unique styles and designs
� Reduce current lead times to react faster to member needs and trends, and reduce risks by smaller and more seasonal buys
� Improve member experience by having refreshed brands and merchandise presentations
Potential Impact If Successful With A $10 Improvement In Revenue Per Square Foot For Apparel Is About $100 Million Annual Incremental EBITDA2
(1) Revenue Per Sq. Ft. is defined as total revenue (including online revenue) divided by total selling square footage.(2) Note that potential impact of initiatives are for SHC Domestic business. The impact to EBITDA includes an adjustment to reflect the potential impact of
store optimization actions and assumes we are able to maintain current margin rates, which have been subject to significant fluctuation historically.
Upgraded Product & Brands – Added Attention, Everlast, Impact by Jillian Michaels (new brand launch this fall), Metaphor, Northwest Territory, Structure, Toughskins
Upgraded Visual Merchandising – Shifted to a more “Life-Styled” merchandising presentation
Elevate Fabric & Technology – Elevating essential fabrics with textures, upgrading contemporary fabrics by capturing trends, and incorporating new fabric technologies
Reduced Lead Times – Over 30% reduction in over 25 brands enabling faster reactions to changing trends
Reduced SKU’s – Shrunk SKU base by about 30% creating a more curated assortment
We have taken actions that we believe will improve Apparel Productivity in the back half of the year

34August 2014
Business Initiatives
Connected Solutions
Kitchen
GarageLaundry
HomeEnvironment
HomeEntertainment
Fitness
ANNUAL HOME VISITS
15M+
WEEKLY IN HOME SHC BRAND EXPERIENCES
BILLION+2ANNUAL VEHICLE
INTERACTIONS
8M+
SYW MEMBERSONE OF THE LARGESTMEMBERSHIP PROGRAMSIN RETAIL
CHANNEL EXPERIENCES
AT 2500+ STORESAND 25+ ONLINE STOREBRANDS
1.4BILLION+
ANNUAL SUPPORT &
SALES CALLS
70M+
SHC’s capabilities and
breadth can provide
Shop Your Way members
seamless experiences
across connected
Home, Car & Fitness

35August 2014
Evaluating overall store portfolio to identify stores for future roll out
Connected Life
Expansion of Connected Solutions Centers
FlagshipExperience
OptimizedExperience
SmallFormat
Opened May 2014 –3 Chicago Stores
September/October – 4 Chicago Stores
October – 3 Chicago Stores
• Diversified Product Offerings with Hands on Displays
• Complete Remodel w/ New Fixtures
• 1,800 to 2,200 sq. ft.
• Diversified Product Offerings with Hands on Displays
• Complete Remodel w/ New Fixtures
• 1,000 sq. ft.
• Rationalized assortment
• Floorplan and fixtures cost optimized to support model and leverage existing assets
• 500 sq. ft.
Phase 2
Complete
CURRENT ASSORTMENT:
• AT&T • Verizon• Craftsman Garage Door• Fitbit• Consumer Cellular• iGrill mini• Sphero• Samsung Gear watches
Phase 3

36August 2014
SHC Domestic Working Capital Improvement
Improvement Net Working Capital Impact1,2
Inventory Turns 1 Turn $400M
Key Initiatives
� Unproductive Inventory
� Reduced Total Aggregate Aged inventory by $106M or 7% Y/Y
� Reduced Total Inventory by over 10% via assortment rationalization, seasonal inventory buys, aged inventory, merchandise flow, consignment inventory, etc.
� Assortment Rationalization
� Removing poor performing items from assortments in many different merchandise categories including Apparel, Jewelry, Electronics, Beauty Care, and Tools, for example. Currently achieving between 10% and 30% reductions in various apparel categories, for example.
� Merchandise Flow
� Flowing merchandise closer to sales in various businesses (e.g. Toys and Camping)
� Carrying lower weeks of supply in various businesses (e.g. Household, Auto Batteries and Lawn & Garden)
� Continuing to meet demand by maintaining in-stock rates
� Apparel Fast Fashion
� Holding back seasonal Open-To-Buy in order to accommodate fast-turning apparel items with the ability to respond quickly to changing trends or poor selling items reducing markdowns
� In & Out Programs
� Special one-time buys to drive additional margin with no long-term inventory investment based on a selling window of 30 days after which items marked out of stock
(1) Note that potential impact of initiatives are for SHC Domestic and excludes Lands’ End.(2) Amount of reduction in net working capital if successful in improving inventory by one turn.

37August 2014
Potential Incremental EBITDA Impact
CategorySHC Domestic Potential
Incremental Annual EBITDA Impact
Optimize Store Network $300M - $400M
In-Store Integrated Retail InitiativesUnderway
$150M - $200M
Shop Your Way Member EngagementPer 1M Members Per 10M Members
$50M $500M
Optimize Cost Of Goods SoldEach 1% Reduction Each 2% Reduction
$230M $460M
Selling & Administrative ExpensesEach 2% Reduction Each 4% Reduction
$150M $300M
Apparel Sales Productivity$10 Improvement Per Sq. Ft. $50 Improvement Per Sq. Ft.
$100M $500M
Total Potential Incremental Annual EBITDA If Initiatives Are Successful Is~$1.0 Billion To ~$2.4 Billion1
(1) Note that potential impact of initiatives are for SHC Domestic and excludes Lands’ End. Indication of possible EBITDA impact assuming achievement of various assumptions underlying each initiative for which no assurances can be given.

38August 2014
Positioning Ourselves For Success
1. Transforming Our Business Model Through Shop Your Way & Integrated Retail
2. Reducing Our Legacy Pension Obligation
3. Managing Our Expenses
4. De-risking Our Balance Sheet & Enhancing Financial Flexibility
5. Implementing the Framework For Profit
We Are Playing Offense In Creating A Platform Positioned To SucceedIn The Changing Retail Landscape

39August 2014
Appendix

40August 2014
First Half 2014Year-Over-Year Revenue Change
Q2 YTD 2013 DomesticClosed Stores
Lands' End Comp Sales Other Sears Canada Q2 YTD 2014
(1) Consists primarily of the impact of declines in home services revenue and the impact of free delivery promotions in home appliances.
$ %
Domestic Closed Stores (444)$ 31.0%
Lands' End (427) 29.8%
Comp Sales (103) 7.2%
Other (172) 12.1%
Sears Canada (285) 19.9%
Total (1,431)$ 100.0%
Summary of Year-Over-Year Revenue Change
Amounts in millions
$17,323
($427)
($172) $15,892
($103)
($285)
($444)
(1)

41August 2014
First Half 2014Domestic Comparable Store Sales
Comp Store Sales Performance
Format Q2 YTD 2014 Drivers
Sears Domestic 0.2%
Appliances
Mattress
Electronics
Lawn & Garden
Auto
Kmart -1.9%Electronics
Grocery & Household
Total Domestic -0.9%

42August 2014
First Half 2014Year-Over-Year Margin Changes
Amounts in millions
$ %
Domestic Closed Stores (91)$ 11.8%
Lands' End (171) 22.2%
Comp Sales (18) 2.3%
Rate (284) 36.8%
SYW Points (81) 10.5%
Sears Canada (127) 22.2%
Total (772)$ 105.8%
Summary of Year over Year Margin Change
Q2 YTD 2013 DomesticClosed Stores
Lands' End Comp Sales Rate SYW Points Sears Canada Q2 YTD 2014
$4,342
($171)
($284)
($127)($81) $3,570
• Currently carrying costs of two promotional programs: Points and Promotional Markdowns (“PMDs”)
• As model evolves, expect points to be substitute for PMDs, resulting in improved margin rate
($18)
($91)
DomesticOperating Performance
($302)
SYW Investment
• Higher points cost is result of higher member engagement
• Points expense recognized when points are issued
• Expect to see margin benefit from points issued in first half throughout 2014 as these points are redeemed

43August 2014
De-risking Our Domestic PensionLegacy Obligation History
Sears Holdings has a frozen pension plan which provides benefits for past services
The pension obligation declined in 2013 due to an increase in the discount rate, contributions and improved investment performance
� Note that a 100 basis point increase in the discount rate would reduce the pension liability by approximately $460 million
2013 2012 2011 2010 2009
Assets $3,490 $3,221 $4,051 $4,054 $3,633
Liability 4,981 5,311 6,109 5,623 5,435
Unfunded ($1,491) ($2,090) ($2,058) ($1,569) ($1,802)
Discount Rate 4.60% 4.25% 4.90% 5.75% 6.00%
Amounts in millions Year End Balances
(1)
Continue To Honor Our Legacy Pension Obligations While De-Risking This Liability
� We currently estimate the 2014 unfunded pension obligation to be $980 million, assuming contributions of about $485 million at a discount rate of 4.60%
(1) In 2012, the Company offered a voluntary lump sum to certain plan participants and paid $1.5 billion in settlements thereby reducing pension risk.(2) The ultimate amount of pension contributions and timing could be affected by changes in the applicable regulations as well as financial market and
investment performance.
(1)

44August 2014
Sears Holdings Consolidated Results
Amounts in millions, except per share amounts
2014 2013 2014 2013
Revenues $ 8,013 $ 8,871 $15,892 $ 17,323
Net loss attributable to Holdings'
shareholders $ (573) $ (194) $ (975) $ (473)
EPS $ (5.39) $ (1.83) $ (9.17) $ (4.46)
Adjusted net loss (1) $ (305) $ (166) $ (541) $ (309)
Adjusted EPS (1)
$ (2.87) $ (1.56) $ (5.09) $ (2.91)
(1) Adjusted to reflect the results of the Lands' End business that were included in our results prior to the separation.
Second Quarter Q2 YTD

45August 2014
Significant Items
Amounts in millions
2014 2013 2014 2013
Net loss as reported $ (573) $ (194) $ (975) $ (473)
Domestic pension expense 14 25 28 51
Closed store/store impairments/severance 32 7 48 19
Gain on sales of assets (6) (58) (14) (58)
Gain on sale of Canadian joint venture (9) — (9) —
Tax matters 237 65 385 170
Lands' End separation — (11) (4) (18)
Adjusted net loss (1)(305)$ (166)$ (541)$ (309)$
(1) Adjusted to reflect the results of the Lands' End business that were included in our results prior to the separation.
Second Quarter Q2 YTD

46August 2014
Adjusted EBITDA
Amounts in millions
2014 2013 2014 2013
Revenues $ 8,013 $ 8,541 $ 15,670 $ 16,674
Margin 1,753 2,067 3,501 4,099
Margin rate 21.9% 24.2% 22.3% 24.6%
Expenses 2,066 2,145 4,035 4,203
Adjusted EBITDA (1)(313)$ (78)$ (534)$ (104)$
By Segment:
Sears (178)$ (43)$ (269)$ (58)$
Kmart (120) (30) (207) (30)
Sears Canada (15) (5) (58) (16)
(313)$ (78)$ (534)$ (104)$
(1) Adjusted to reflect the results of the Lands' End business that were included in our results prior to the separation.
Second Quarter Q2 YTD

47August 2014
Second QuarterAdjusted Segment Results
millions
2014 2013 2014 2013 2014 2013 2014 2013
Revenue $ 2,923 $ 3,168 $ 4,310 $ 4,453 $ 780 $ 920 $ 8,013 $ 8,541
Gross margin dollars 592 713 976 1,116 185 238 1,753 2,067
Gross margin rate 20.3% 22.5% 22.6% 25.1% 23.7% 25.9% 21.9% 24.2%
Selling and administrative 712 743 1,154 1,159 200 243 2,066 2,145
Selling and administrative expense as a
percentage of total revenues 24.4% 23.5% 26.8% 26.0% 25.6% 26.4% 25.8% 25.1%
Adjusted EBITDA (1)
(120) (30) (178) (43) (15) (5) (313) (78)
Depreciation and amortization (24) (33) (110) (129) (18) (25) (152) (187)
Gain on sales of assets 31 15 3 45 - 181 34 241
Special items:
Domestic pension expense - - (23) (40) - - (23) (40)
Closed store reserve and severance (27) (8) (7) (2) (6) - (40) (10)
Impairment charges (2) - (3) - (15) - (20) -
Lands' End separation - - - 23 - - - 23
Operating income (loss) $ (142) $ (56) $ (318) $ (146) $ (54) $ 151 $ (514) $ (51)
(1) Adjusted to reflect the results of the Lands' End business that were included in our results prior to the separation.
Kmart Sears Domestic Sears Canada Sears Holdings
Quarter Ended

48August 2014
Year-To-Date
Adjusted Segment Results
millions
2014 2013 2014 2013 2014 2013 2014 2013
Revenue $5,820 $ 6,271 $ 8,373 $ 8,641 $ 1,477 $ 1,762 $ 15,670 $ 16,674
Gross margin dollars 1,192 1,423 1,960 2,201 349 475 3,501 4,099
Gross margin rate 20.5% 22.7% 23.4% 25.5% 23.6% 27.0% 22.3% 24.6%
Selling and administrative 1,399 1,453 2,229 2,259 407 491 4,035 4,203
Selling and administrative expense as a
percentage of total revenues 24.0% 23.2% 26.6% 26.1% 27.6% 27.9% 25.7% 25.2%
Adjusted EBITDA (1) (207) (30) (269) (58) (58) (16) (534) (104)
Depreciation and amortization (47) (66) (224) (262) (36) (50) (307) (378)
Gain (loss) on sales of assets 52 28 29 46 (1) 181 80 255
Special items:
Domestic pension expense - - (45) (81) - - (45) (81)
Closed store reserve and severance (36) (16) (7) (5) (25) (2) (68) (23)
Impairment charges (2) - (8) (8) (15) - (25) (8)
Lands' End separation - - 10 41 - - 10 41
Operating income (loss) $ (240) $ (84) $ (514) $ (327) $ (135) $ 113 $ (889) $ (298)
(1) Adjusted to reflect the results of the Lands' End business that were included in our results prior to the separation.
Kmart Sears Domestic Sears Canada Sears Holdings
Q2 YTD

49August 2014
Reconciliation to GAAP
millions, except per share data GAAP
Domestic
Pension
Expense
Closed Store
Reserve,
Store
Impairments
and
Severance
Gain on
Sales of
Assets
Gain on Sale
of Canadian
Joint
Venture Tax Matters
As
Adjusted
Gross margin impact 1,742$ —$ 11$ —$ —$ —$ 1,753$
Selling and administrative impact 2,118 (23) (29) — — — 2,066
Depreciation and amortization impact 152 — (1) — — — 151
Impairment charges impact 20 — (20) — — — —
Gain on sales of assets impact (34) — — 10 — — (24)
Operating loss impact (514) 23 61 (10) — — (440)
Interest and investment income impact 32 — — — (23) — 9
Income tax expense impact (32) (9) (22) 4 6 236 183
Loss attributable to noncontrolling interest impact 8 — (7) — 8 1 10
After tax and noncontrolling interest impact (573) 14 32 (6) (9) 237 (305)
Diluted loss per share impact (5.39)$ 0.13$ 0.30$ (0.06)$ (0.08)$ 2.23$ (2.87)$
millions, except per share data GAAP
Domestic
Pension
Expense
Closed Store
Reserve,
Store
Impairments
and
Severance
Gain on
Sales of
Assets Tax Matters
As
Adjusted-
Reported
Lands' End
Separation
As
Adjusted(1)
Gross margin impact 2,186$ —$ 7$ —$ —$ 2,193$ (126)$ 2,067$
Selling and administrative impact 2,291 (40) (3) — — 2,248 (103) 2,145
Depreciation and amortization impact 187 — (1) — — 186 (5) 181
Gain on sales of assets impact (241) — — 235 — (6) — (6)
Operating loss impact (51) 40 11 (235) — (235) (18) (253)
Income tax expense impact (30) (15) (4) 89 65 105 7 112
Income attributable to noncontrolling interest impact (67) — — 88 — 21 — 21
After tax and noncontrolling interest impact (194) 25 7 (58) 65 (155) (11) (166)
Diluted loss per share impact (1.83)$ 0.24$ 0.07$ (0.55)$ 0.61$ (1.46)$ (0.10)$ (1.56)$
(1) Adjusted to reflect the results of the Lands' End business that were included in our results prior to the separation.
13 Weeks Ended August 3, 2013
Adjustments
13 Weeks Ended August 2, 2014
Adjustments

50August 2014
Reconciliation to GAAP
millions, except per share data GAAP
Domestic
Pension
Expense
Closed Store
Reserve,
Store
Impairments
and
Severance
Gain on
Sales of
Assets
Gain on Sale
of Canadian
Joint
Venture Tax Matters
Lands' End
Separation
As
Adjusted
Gross margin impact 3,570$ —$ 18$ —$ —$ —$ (87)$ 3,501$
Selling and administrative impact 4,207 (45) (50) — — — (77) 4,035
Depreciation and amortization impact 307 — (1) — — — (3) 303
Impairment charges impact 25 — (25) — — — — —
Gain on sales of assets impact (80) — — 23 — — — (57)
Operating loss impact (889) 45 94 (23) — — (7) (780)
Interest and investment income impact 36 — — — (23) — — 13
Income tax expense impact (29) (17) (32) 9 6 394 3 334
Loss attributable to noncontrolling interest impact 48 — (14) — 8 (9) — 33
After tax and noncontrolling interest impact (975) 28 48 (14) (9) 385 (4) (541)
Diluted loss per share impact (9.17)$ 0.26$ 0.45$ (0.13)$ (0.08)$ 3.62$ (0.04)$ (5.09)$
millions, except per share data GAAP
Domestic
Pension
Expense
Closed Store
Reserve,
Store
Impairments
and
Severance
Gain on
Sales of
Assets Tax Matters
As
Adjusted-
Reported
Lands' End
Separation
As
Adjusted(1)
Gross margin impact 4,342$ —$ 15$ —$ —$ 4,357$ (258)$ 4,099$
Selling and administrative impact 4,509 (81) (8) — — 4,420 (217) 4,203
Depreciation and amortization impact 378 — (2) — — 376 (11) 365
Impairment charges impact 8 — (8) — — — — —
Gain on sales of assets impact (255) — — 235 — (20) — (20)
Operating loss impact (298) 81 33 (235) — (419) (30) (449)
Income tax expense impact (21) (30) (13) 89 170 195 12 207
Income attributable to noncontrolling interest impact (54) — (1) 88 — 33 — 33
After tax and noncontrolling interest impact (473) 51 19 (58) 170 (291) (18) (309)
Diluted loss per share impact (4.46)$ 0.49$ 0.18$ (0.55)$ 1.60$ (2.74)$ (0.17)$ (2.91)$
(1) Adjusted to reflect the results of the Lands' End business that were included in our results prior to the separation.
Adjustments
26 Weeks Ended August 2, 2014
Adjustments
26 Weeks Ended August 3, 2013

51August 2014
Reconciliation to GAAPAmounts in millions
2014 2013 2014 2013
Net loss attributable to SHC per statement of operations $ (573) $ (194) $ (975) $ (473)
Income (loss) attributable to noncontrolling interests (8) 67 (48) 54
Income tax expense 32 30 29 21
Interest expense 72 59 143 120
Interest and investment income (32) (14) (36) (21)
Other (income) loss (5) 1 (2) 1
Operating loss (514) (51) (889) (298)
Depreciation and amortization 152 187 307 378
Gain on sales of assets (34) (241) (80) (255)
Before excluded items (396) (105) (662) (175)
Closed store reserve and severance 40 10 68 23
Domestic pension expense 23 40 45 81
Impairment charges 20 — 25 8
Adjusted EBITDA (313) (55) (524) (63)
Lands' End separation — (23) (10) (41)
Adjusted EBITDA as defined(1) $ (313) $ (78) $ (534) $ (104)
% to revenues (2)-3.9% -0.9% -3.4% -0.6%
(1) Adjusted to reflect the results of the Lands' End business that were included in our results prior to the separation.(2) Excludes revenues of the Lands' End business that were included in our results of operations prior to the separation.
Second Quarter Q2 YTD
