q2 2020 results - home - ten square games
TRANSCRIPT

Q2 2020 ResultsAugust 2020

Q2 2020 highlights
Revenues 50→170 M PLN +240% yoy
Net profit 13→34 M PLN*
+166% yoy
TOP 50 Global TestingFishing Clash
48th top grossinggame in Google
Play** store
Solitales and HuntingClash available
worldwide
2* Net profit of Q2 2020 adjusted by non cash cost of 6 M PLN** Source: App Annie, top grossing games ranking in Google Play in June 2020

Q2 2020 Results
3

Fishing Clash – a leap forward in performance
28,8 34,8 37,5 43,157,9
67,984,7
158,0
3Q 2018 4Q 2018 1Q 2019 2Q 2019 3Q 2019 4Q 2019 1Q 2020 2Q 2020
Average MAU (M) and monthly ARPU (PLN)
Payments (M PLN)• 88% growth of payments qoq in Q2 2020
• Continuous development of the game - new fisheries, fish, improvement of the key buff system
• Constant live-ops and mechanics improvements
• ARPU decrease naturally correlated with MAU growth (huge organic traffic, record marketing)
4
1,9 1,5 2,0 1,4 2,0 1,9 2,9 6,9
5,2
7,76,3
10,0 9,7
11,9
9,8
7,6
3Q 2018 4Q 2018 1Q 2019 2Q 2019 3Q 2019 4Q 2019 1Q 2020 2Q 2020
Average MAU ARPU
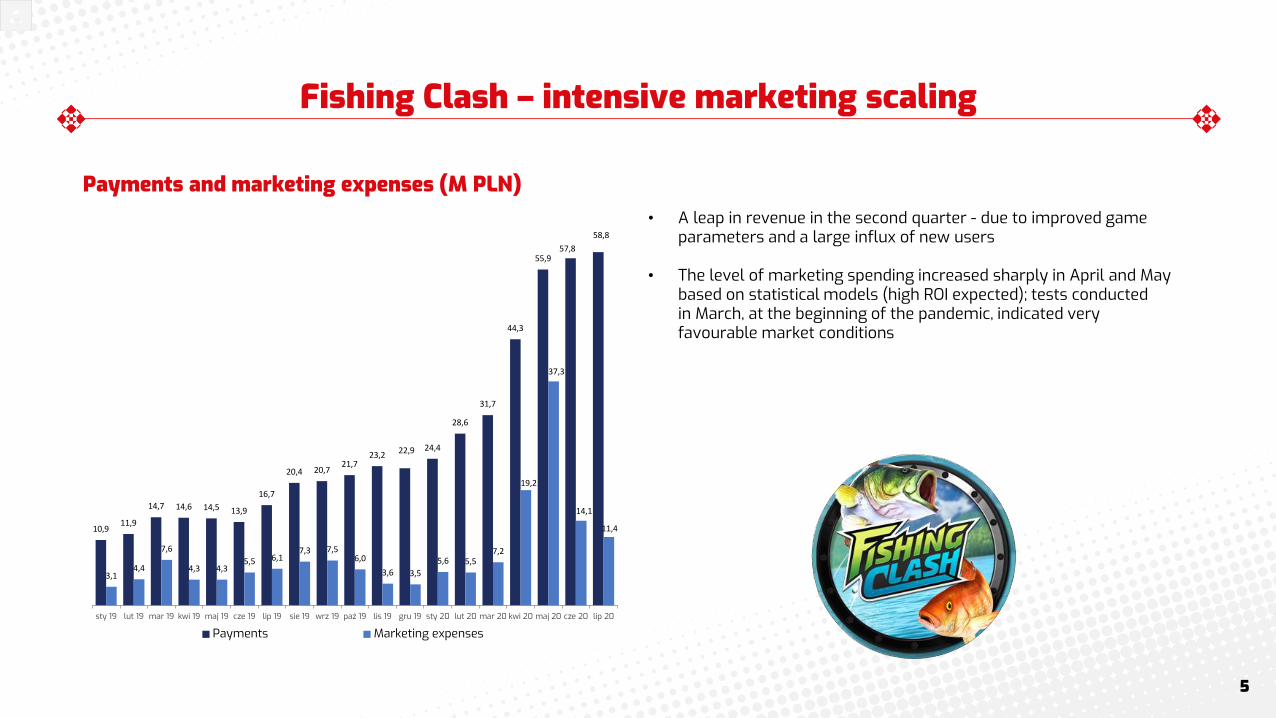
Fishing Clash – intensive marketing scaling
Payments and marketing expenses (M PLN)• A leap in revenue in the second quarter - due to improved game
parameters and a large influx of new users
• The level of marketing spending increased sharply in April and May based on statistical models (high ROI expected); tests conducted in March, at the beginning of the pandemic, indicated very favourable market conditions
10,911,9
14,7 14,6 14,5 13,9
16,7
20,4 20,721,7
23,2 22,9 24,4
28,6
31,7
44,3
55,957,8
58,8
3,14,4
7,6
4,3 4,35,5 6,1
7,3 7,56,0
3,6 3,5
5,6 5,57,2
19,2
37,3
14,1
11,4
sty 19 lut 19 mar 19 kwi 19 maj 19 cze 19 lip 19 sie 19 wrz 19 paź 19 lis 19 gru 19 sty 20 lut 20 mar 20 kwi 20 maj 20 cze 20 lip 20
Payments Marketing expenses
5
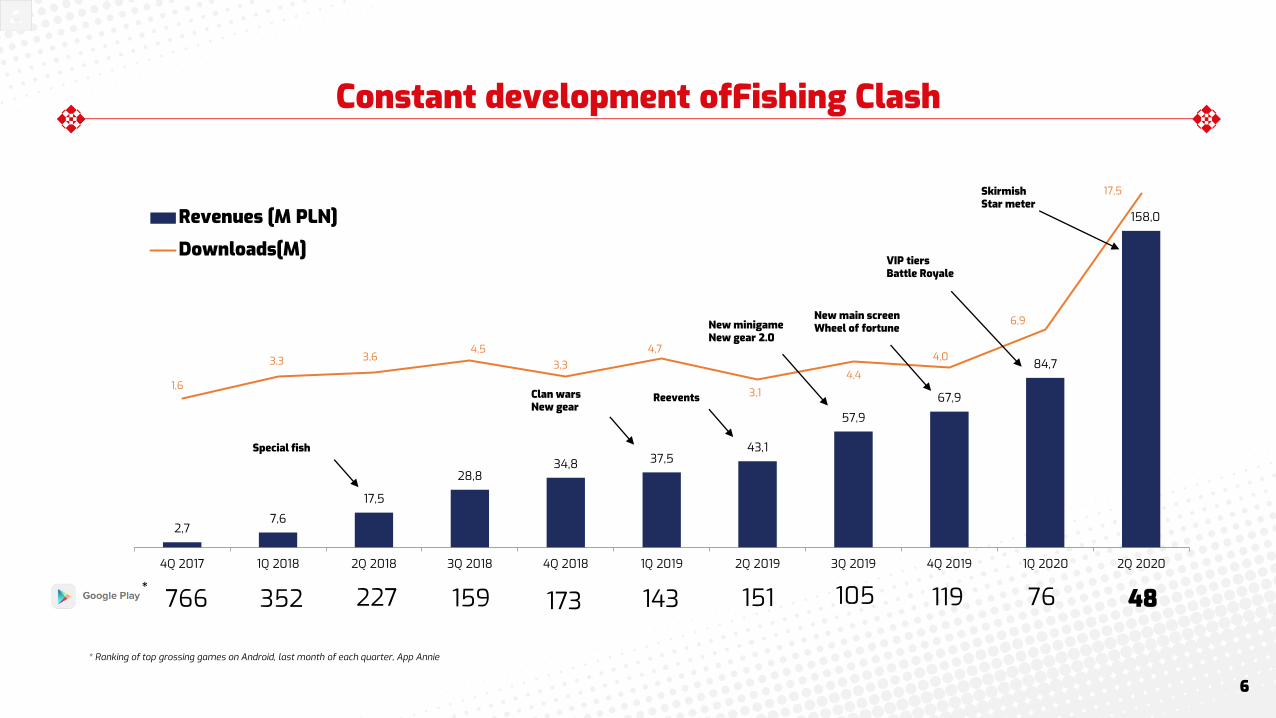
Constant development ofFishing Clash
6
* Ranking of top grossing games on Android, last month of each quarter, App Annie
2,77,6
17,5
28,834,8 37,5
43,1
57,9
67,9
84,7
158,0
1,6
3,3 3,64,5
3,34,7
3,14,4
4,0
6,9
17,5
4Q 2017 1Q 2018 2Q 2018 3Q 2018 4Q 2018 1Q 2019 2Q 2019 3Q 2019 4Q 2019 1Q 2020 2Q 2020
Revenues [M PLN]
Downloads[M]
Clan warsNew gear
Reevents
New minigameNew gear 2.0
New main screenWheel of fortune
VIP tiersBattle Royale
SkirmishStar meter
105 119 76
Special fish
48352 151227 159 173 143766*

Improving monetisation of Fishing Clash
7
Source: App Annie Insights Generator, User Monetisation – Fishing Clash, all phones, worldwide

Let’s Fish – stable revenue level
Average MAU (M) and monthly ARPU (PLN)
Payments (M PLN)• 4,5M PLN revenues in Q2 2020 in comparison to 3,9M PLN in
Q1 2020 – growth by 15% qoq
• Further product development - new fisheries, fish, equipment, continuous development of Live Ops activities (mainly working on full event globalization)
4,34,7
4,1
3,33,6
4,23,9
4,5
3Q 2018 4Q 2018 1Q 2019 2Q 2019 3Q 2019 4Q 2019 1Q 2020 2Q 2020
0,6 0,5 0,5 0,5 0,4 0,4 0,4 0,4
2,3
2,92,7 2,4
2,8
3,63,4 3,5
3Q 2018 4Q 2018 1Q 2019 2Q 2019 3Q 2019 4Q 2019 1Q 2020 2Q 2020
Average MAU ARPU
8

Wild Hunt – record quarterly turnover
Average MAU (M) and monthly ARPU (PLN)
Payments (M PLN)
• 26 % revenue growth in Q2 2020 qoq, +109% yoy
• Continuous delivery of new content: locations, animals, weapons; improvement of analytical and testing infrastructure and live ops operations
• Higher ARPU thanks to constant game improvement
1,3
2,02,4
2,12,3
2,7
3,5
4,4
3Q 2018 4Q 2018 1Q 2019 2Q 2019 3Q 2019 4Q 2019 1Q 2020 2Q 2020
1,41,2
0,80,7 0,7
0,8
1,31,2
0,30,5
1,0 1,0
1,2 1,1
0,9
1,2
3Q 2018 4Q 2018 1Q 2019 2Q 2019 3Q 2019 4Q 2019 1Q 2020 2Q 2020
Average MAU
ARPU
9

High revenue dynamics
Sales revenues (M PLN)
35 436 41 55145 304
49 878
67 650
78 301
95 037
169 622
3Q'18 4Q'18 1Q'19 2Q'19 3Q'19 4Q'19 1Q'20 2Q'20
Fishing Clash
Others
x 3,38 r/r
Geographic and product breakdown of revenues
42%
39%
14%
5%
Q2 2020
North America
Europe
Asia
Others
Fishing Clash
Let’s Fish
Wild Hunt
Q2 2020
Others92%
3%3% 3%
10

Temporarily increased operating costs
Operating costs ex selling costs*
2,0 1,9 1,92,7 2,9
3,7
4,85,6
1,0 1,2 1,4
1,61,8
2,3
3,4
4,1
2,9%
2,8%
3,2%
3,1%
2,7%
2,9%
3,6%
2,4%
3Q'18 4Q'18 1Q'19 2Q'19 3Q'19 4Q'19 1Q'20 2Q'20
mln
zł
General andadministrative costsCosts of services sold
GA as % of revenues
9,7 11,3 12,5 14,0 18,3 21,627,0
49,3
8,7 8,6 15,414,3
21,2 13,7
19,1
72,8
55%
51%
65%
59%
60%
46%
49%
73%
3Q'18 4Q'18 1Q'19 2Q'19 3Q'19 4Q'19 1Q'20 2Q'20
mln
zł
MarketingRevenue shareCommissionsOthersSelling costs (% of payments)
Selling costs• Increase in operating costs due to
gradual increase in employment (project teams, general departments)
• Costs of services sold increase with the strengthening of game teams in the soft launch and live phases
• Commissions directly proportional to growing revenues
• Largest ever marketing budgets in Q2 2020 due to the unique situation on the User Acquisition market
• Reported results include non-cash cost of share-based payment in accordance with IFRS
11
* Results standardized by deducting non-cash expense of PLN 6 million included in general and administrative costs in Q2 2020

Standardized operating results *
EBITDA standardized* Standardized net profit*
• Accounting results in Q2 2020 reduced by non-cash cost of share-based payments of PLN 6 million
• Increase in standardized EBITDA* by 120% y/y
• Increase in standardized net profit* by 166% y/y
• Standardized results* flat quarter-on-quarter despite nearly fourfold increase in marketing expenses13,0
16,7
12,5
16,4
22,1
34,7
38,2
36,2
36,8%
40,2%
27,6%
32,9%
32,7%
44,3%
40,3%
21,3%
3Q'18 4Q'18 1Q'19 2Q'19 3Q'19 4Q'19 1Q'20 2Q'20
mln
zł
5,0
7,5
10,2
13,7
10,4
13,1
18,0
34,935,3 34,9
1Q'18 2Q'18 3Q'18 4Q'18 1Q'19 2Q'19 3Q'19 4Q'19 1Q'20 2Q'20
mln
zł
IPBOX Q4:+2,9M PLN
IPBOX Q1-Q3: +4,4M PLN
12
* Results standardized by deducting non-cash expense of PLN 6 million included in general and administrative costs in Q2 2020

Quick cash recovery after dividend payment
Cash flow Balance sheet structure
• Operating cash flow in Q2 2020 loweredby a leap in marketing expenses
• Very good capital situation - more than half of the balance sheet total is cash
• In Q2 2020, a dividend of PLN 27 million was paid out.
11,8
17,6
12,0
6,2
14,6
33,629,8
13,9
-1,2
-27,3 -27,6
3Q'18 4Q'18 1Q'19 2Q'19 3Q'19 4Q'19 1Q'20 2Q'20
mln
zł
CF operations
CF investment
CF finance
22,339,8
50,928,7
42,4
75,2
105,089,6
13,5
12,0
19,5
19,1
28,6
25,9
39,9 69,2
7,811,7
10,418,0
28,3
42,1
52,5 133,6
2,1
2,9
9,7
7,3
10,5
12,4
21,636,8
3Q'18 4Q'18 1Q'19 2Q'19 3Q'19 4Q'19 1Q'20 2Q'20
mln
zł
fixed assetscashother current assetsequityliabilities
13

Q2 2020 Summary
• Fishing Clash growth acceleration in Q2 2020
• The highest ever sales of Fishing Clash in history in the next quarter in a row, supported by record-breaking expenditure on User Acquisition
• PLN 158 million of sales revenue in Q2 2020 - an increase of 266% y/y and 86% q/q• Game ready for years of further development and monetization
• 8 parallel projects, 4 in live phase, 3 in soft launch (two of them already available globally, one in the near future), 1 inproduction
14
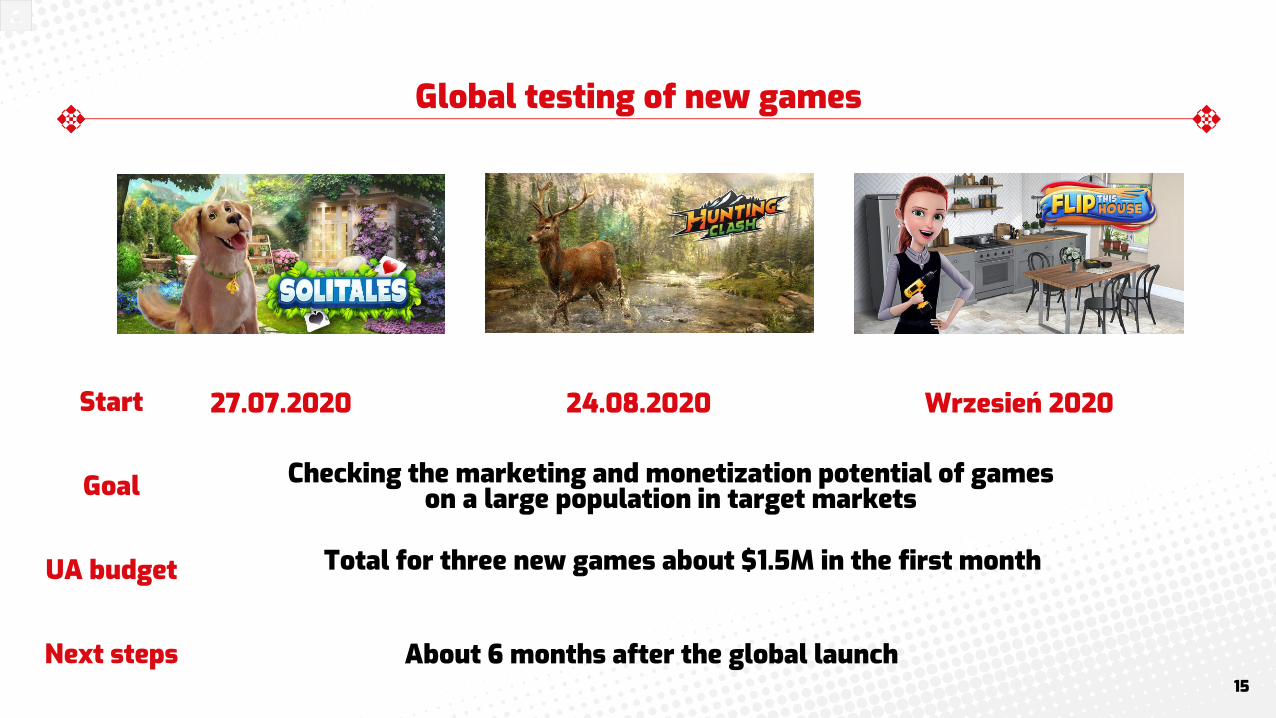
Global testing of new games
15
Start
Goal
UA budget
Next steps
Checking the marketing and monetization potential of games on a large population in target markets
27.07.2020 24.08.2020 Wrzesień 2020
Total for three new games about $1.5M in the first month
About 6 months after the global launch

Strategy update – three growth pillars
16
Wrocław - Hub M&A„Spokes”
Warsaw
Potential newprojects
Small studios / teams<$10M
Mid size studios$10M-100M
TransformationalM&A
$100M+
Central infrastructure
(BI, Growth, HR, IT, Finance)
Talenddevelopment
and acquisition
Inhousedevelopment

Investor’s calendar – coming soon
• Erste Group Innovation Conference – Virtual – 03.09.2020
• IPOPEMA Gaming Days – Virtual – 15-16.09.2020
• PKO Innovation Day – Virtual – 22-23.09.2020
• Erste Group The Finest CEElection – Virtual – 06-07.10.2020
• TRIGON Conference – Virtual – 12-14.10.2020
• Auerbach Grayson Emerging & Frontier Markets Conference – Virtual – 26-27.10.2020
• Q3 2020 Sales Report – early October 2020
• Q3 2020 Financial Report – 23.11.2020 (conference or video conference on 24.11.2020)
17

Q&A SESSION

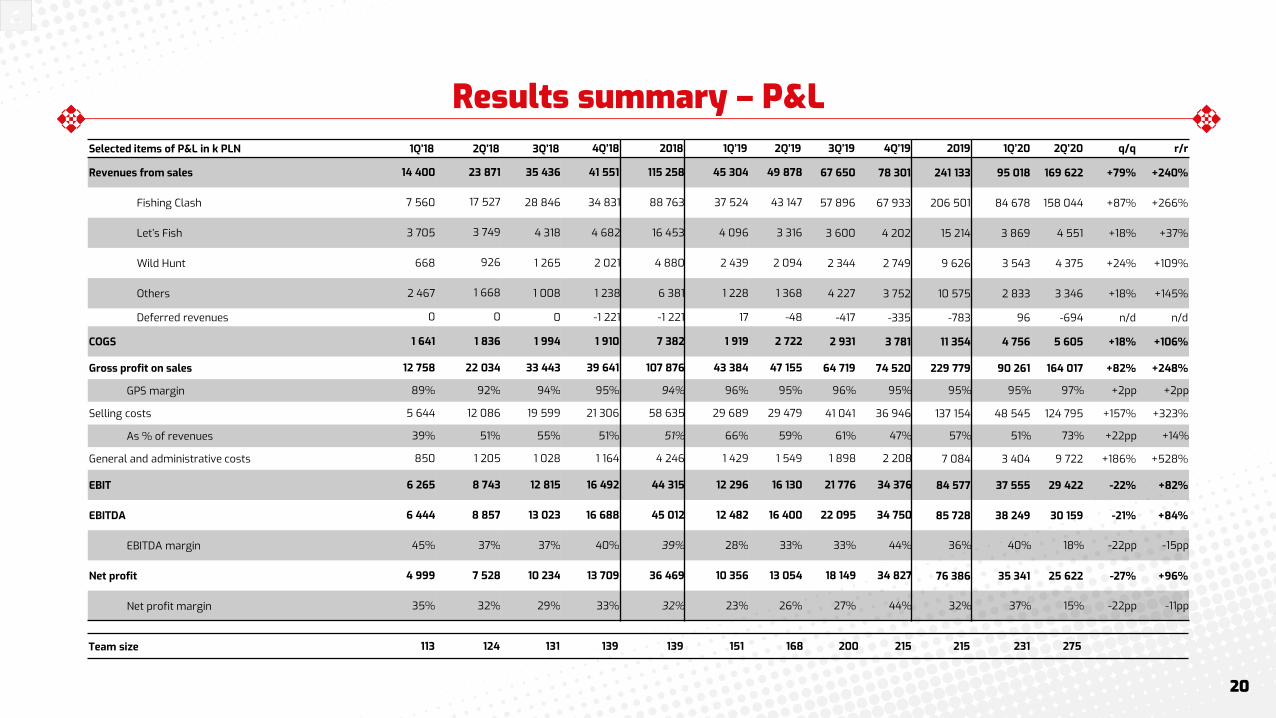
Results summary – P&LSelected items of P&L in k PLN 1Q’18 2Q’18 3Q’18 4Q’18 2018 1Q’19 2Q’19 3Q’19 4Q’19 2019 1Q’20 2Q’20 q/q r/r
Revenues from sales 14 400 23 871 35 436 41 551 115 258 45 304 49 878 67 650 78 301 241 133 95 018 169 622 +79% +240%
Fishing Clash 7 560 17 527 28 846 34 831 88 763 37 524 43 147 57 896 67 933 206 501 84 678 158 044 +87% +266%
Let’s Fish 3 705 3 749 4 318 4 682 16 453 4 096 3 316 3 600 4 202 15 214 3 869 4 551 +18% +37%
Wild Hunt 668 926 1 265 2 021 4 880 2 439 2 094 2 344 2 749 9 626 3 543 4 375 +24% +109%
Others 2 467 1 668 1 008 1 238 6 381 1 228 1 368 4 227 3 752 10 575 2 833 3 346 +18% +145%
Deferred revenues 0 0 0 -1 221 -1 221 17 -48 -417 -335 -783 96 -694 n/d n/d
COGS 1 641 1 836 1 994 1 910 7 382 1 919 2 722 2 931 3 781 11 354 4 756 5 605 +18% +106%
Gross profit on sales 12 758 22 034 33 443 39 641 107 876 43 384 47 155 64 719 74 520 229 779 90 261 164 017 +82% +248%
GPS margin 89% 92% 94% 95% 94% 96% 95% 96% 95% 95% 95% 97% +2pp +2pp
Selling costs 5 644 12 086 19 599 21 306 58 635 29 689 29 479 41 041 36 946 137 154 48 545 124 795 +157% +323%
As % of revenues 39% 51% 55% 51% 51% 66% 59% 61% 47% 57% 51% 73% +22pp +14%
General and administrative costs 850 1 205 1 028 1 164 4 246 1 429 1 549 1 898 2 208 7 084 3 404 9 722 +186% +528%
EBIT 6 265 8 743 12 815 16 492 44 315 12 296 16 130 21 776 34 376 84 577 37 555 29 422 -22% +82%
EBITDA 6 444 8 857 13 023 16 688 45 012 12 482 16 400 22 095 34 750 85 728 38 249 30 159 -21% +84%
EBITDA margin 45% 37% 37% 40% 39% 28% 33% 33% 44% 36% 40% 18% -22pp -15pp
Net profit 4 999 7 528 10 234 13 709 36 469 10 356 13 054 18 149 34 827 76 386 35 341 25 622 -27% +96%
Net profit margin 35% 32% 29% 33% 32% 23% 26% 27% 44% 32% 37% 15% -22pp -11pp
Team size 113 124 131 139 139 151 168 200 215 215 231 275
20
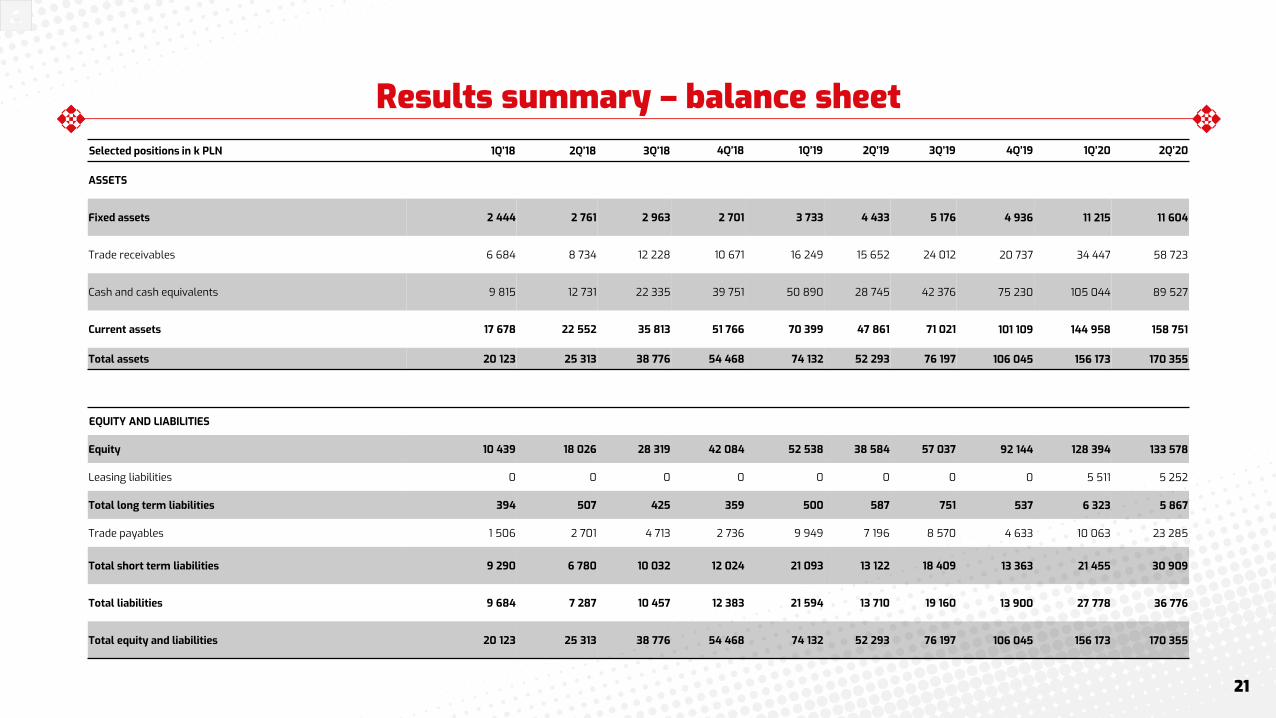
Results summary – balance sheetSelected positions in k PLN 1Q’18 2Q’18 3Q’18 4Q’18 1Q’19 2Q’19 3Q’19 4Q’19 1Q’20 2Q’20
ASSETS
Fixed assets 2 444 2 761 2 963 2 701 3 733 4 433 5 176 4 936 11 215 11 604
Trade receivables 6 684 8 734 12 228 10 671 16 249 15 652 24 012 20 737 34 447 58 723
Cash and cash equivalents 9 815 12 731 22 335 39 751 50 890 28 745 42 376 75 230 105 044 89 527
Current assets 17 678 22 552 35 813 51 766 70 399 47 861 71 021 101 109 144 958 158 751
Total assets 20 123 25 313 38 776 54 468 74 132 52 293 76 197 106 045 156 173 170 355
EQUITY AND LIABILITIES
Equity 10 439 18 026 28 319 42 084 52 538 38 584 57 037 92 144 128 394 133 578
Leasing liabilities 0 0 0 0 0 0 0 0 5 511 5 252
Total long term liabilities 394 507 425 359 500 587 751 537 6 323 5 867
Trade payables 1 506 2 701 4 713 2 736 9 949 7 196 8 570 4 633 10 063 23 285
Total short term liabilities 9 290 6 780 10 032 12 024 21 093 13 122 18 409 13 363 21 455 30 909
Total liabilities 9 684 7 287 10 457 12 383 21 594 13 710 19 160 13 900 27 778 36 776
Total equity and liabilities 20 123 25 313 38 776 54 468 74 132 52 293 76 197 106 045 156 173 170 355
21

Results summary – cash flowsSelected positions in k PLN 1Q’18 2Q’18 3Q’18 4Q’18 1Q’19 2Q’19 3Q’19 4Q’19 1Q’20 2Q’20
OPERATING ACTIVITIES
Profit before tax 6 229 9 302 12 633 16 685 12 674 15 944 22 316 33 691 39 192 28 814
Total adjustments -1 505 -743 -642 1 100 -299 -1 589 -7 197 671 -7 735 -6 675
Amortisation 179 114 208 196 186 270 320 374 694 737
Cash from operations 4 724 8 560 11 992 17 785 12 375 14 356 15 119 34 362 31 457 22 139
Income tax paid -1 225 -209 -198 -189 -370 -8 124 -541 -738 -1 673 -8 230
Net cash flows from operating activities 3 500 8 351 11 794 17 596 12 005 6 232 14 579 33 623 29 784 13 909
INVESTMENT ACTIVITIES
Inflows 0 0 0 0 0 0 0 0 0 20
Outflows -353 -498 -420 -495 -1 002 -890 -1 097 -554 -960 -868
Net cash flows from investing activities -353 -498 -420 -495 -1 002 -890 -1 097 -554 960 848
FINANCIAL ACTIVITIES
Inflows 0 0 0 0 0 0 2 0 20 0
Outflows 0 -5 110 -1 199 0 0 -27 311 0 0 -194 -27 568
Dividends 0 -5 110 -1 199 0 0 -27 311 0 0 0 -27 371
Net cash flows from financing activities 0 -5 110 -1 199 0 0 -27 311 2 0 -174 -27 588
Net cash flows total 3 146 2 743 10 175 17 101 11 003 -21 968 13 483 33 069 28 650 -14 526
22

Geographic breakdown of revenuesIn k PLN 1Q’18 2Q’18 3Q’18 4Q’18 1Q’19 2Q’19 3Q’19 4Q’19 1Q’20 2Q’20
North America 4 822 10 938 15 732 16 254 18 841 21 646 28 718 31 965 38 250 72 716
Europe 6 404 8 818 14 597 19 344 19 059 19 790 26 551 31 026 39 269 64 966
Poland 1 556 1 762 2 534 3 598 3 367 3 170 3 918 4 807 5 696 8 139
Others 4 848 7 056 12 063 15 746 15 691 16 620 22 634 26 219 33 573 56 827
Asia 2 195 2 635 3 191 4 670 5 191 6 134 9 690 11 930 12 875 23 830
South America 422 615 786 1 055 922 975 1420 1 843 2 416 4 831
Australia and Oceania 389 579 685 762 860 957 1115 1 149 1 410 2 744
Africa 169 286 447 686 415 423 573 723 702 1 228
% share of revenues 1Q’18 2Q’18 3Q’18 4Q’18 1Q’19 2Q’19 3Q’19 4Q’19 1Q’20 2Q’20
North America 33,5% 45,8% 44,4% 39,1% 41,6% 43,4% 42,2% 40,6% 40,3% 42,7%
Europe 44,5% 36,9% 41,2% 46,6% 42,1% 39,7% 39% 39,5% 41,4% 38,1%
Poland 10,8% 7,4% 7,2% 8,7% 7,4% 6,4% 5,8% 6,1% 6,0% 4,8%
Others 33,7% 29,6% 34,0% 37,9% 34,6% 33,3% 33,2% 33,3% 35,4% 33,3%
Asia 15,2% 11,0% 9,0% 11,2% 11,5% 12,3% 14,2% 15,2% 13,6% 14%
South America 2,9% 2,6% 2,2% 2,5% 2,0% 2,0% 2,1% 2,3% 2,5% 2,8%
Australia and Oceania 2,7% 2,4% 1,9% 1,8% 1,9% 1,9% 1,6% 1,5% 1,5% 1,6%
Africa 1,2% 1,2% 1,3% 1,7% 0,9% 0,8% 0,8% 0,9% 0,7% 0,8%
23

Accounting principles for revenues
Changes in booking revenues according to IFRS 15„Revenue is recognized when the customers has received all the benefits associated with the performance obligation”
Payment Sales revenue
Deferred revenue/Unearned revenue
• Revenue -> the player uses the virtual currency to purchase a virtual goods (e.g. rods, lure packs)
• Deferred revenue -> unused balance of virtual currency booked as „Unearned revenue” on the balance sheet
• Payment -> a player purchases virtual currency
+ / -
24

Marketing expenses policy
Marketing expenses model
cumulative approach
• The Group invests in marketing at point „0”. Cohort acquired in this period analyzed throughout user lifetime (period „0” to „n”)
• The Group monitors the current performance of acquired user cohorts
• Decision regarding marketing expenses based on several basic variables (user profitability, user acquisition cost, user life cycle)
Marketing expenses„We invest in marketing provided we get positive returns throughout user lifetime”
0 1 2 3 4 5 n
Cumulativepayments
Marketing expenses
25
Legal disclaimer• Neither this presentation (the “Presentation”, references to which shall be deemed to include any information which has been or may be supplied in writing or orally in connection herewith or in connection with any further
enquiries) nor any copy of it nor the information contained herein is being issued and may be distributed directly or indirectly to or into the United States, Canada, Australia or Japan, except as stated below. By attending this meeting where this Presentation is being made, or by reading the Presentation slides, you agree to be bound by the following limitations.
• This Presentation has been prepared by Ten Square Games S.A. with its registered seat in Wrocław, Poland (the “Company”) solely for investor relations purposes for use at the meetings with selected potential investors in theUnited States that classify as Qualified Institutional Buyers as defined in Rule 144A under the U.S. Securities Act of 1933, as amended, to provide such investors with general information on the Company and its group and an overview of its operations and historical financial results.
• This Presentation is confidential. Neither this Presentation or any part hereof nor the information contained herein may be reproduced or redistributed, passed on, or the contents otherwise divulged, directly or indirectly, to any other person or published, in whole or in part.
• If you gain access to this Presentation by mistake, or you are not an addressee of this Presentation or a person authorised to use this Presentation, please bear in mind the confidential nature of this Presentation and immediately contact the Company.
• Due to its nature, this Presentation is not a promotional campaign material in the meaning of the applicable Polish securities law regulations, does not constitute any prospectus or other offering document, and does not constitute or form part of and should not be construed as an offer, solicitation or invitation to sell or issue, or an offer, solicitation or invitation to, subscribe for, underwrite, buy or otherwise acquire, securities of the Company or any of its subsidiaries in any jurisdiction, or an inducement to enter into investment activity in any jurisdiction. Neither this Presentation nor any part hereof, nor the fact of its distribution, shall form the basis of, or be relied on in connection with, any contract, commitment or investment decision whatsoever.
• This Presentation does not constitute a investment recommendation and/or inducement regarding the securities of the Company and/or its subsidiaries. • The information contained in the Presentation has not been independently verified. No representation, warranty or undertaking, expressed or implied, is made as to, and no reliance should be placed on, the fairness, accuracy,
completeness or correctness of the information or the opinions contained herein. • This Presentation contains certain statistical, economic and market information relating to, inter alia, Poland and the industry in which the Company operates, market trends and some economic forecasts. Unless attributed
exclusively to another source, such market information has been calculated based on data provided by the third-party sources identified herein and includes estimates, assessments, adjustments and judgments that are based on the Company’s experience and familiarity with the sector in which the Company operates. Because such market information has been prepared in part based upon estimates, assessments, adjustments and judgments and not verified by an independent third party, such market information is, unless otherwise attributed to a third-party source, to a certain degree subjective. While it is believed that such estimates, assessments, adjustments and judgments are reasonable and that the market information which has been prepared is appropriately reflective of the sector and the markets in which the Company operates, there can be no assurance that such estimates, assessments and judgments are the most appropriate for making determinations relating to market information or that market information prepared by other sources will not differ materially from the market information included herein.
• Matters discussed in this Presentation may constitute forward-looking statements. Forward-looking statements constitute statements that are other than statements of historical fact. Statements which include the words “expects”, “intends”, “plans”, “believes”, “projects”, “anticipates”, “will”, “targets”, “aims”, “may”, “would”, “could”, “continue” and similar statements of a future or forward-looking nature identify such forward-looking statements. Forward-looking statements include statements regarding the business strategy, plans and objectives of the Company for future operations. All forward-looking statements included in this Presentation address matters that involve known and unknown risks, uncertainties and other factors which could cause the Company’s actual results, performance or achievements to differ materially from those indicated in such forward-looking statements and from past results, performance or achievements of the Company. Such forward-looking statements are based upon various assumptions regarding future events, including numerous assumptions regarding the Company’s present and future business strategies and future operating environment. Although the Company believes that these estimates and assumptions are reasonable, they may prove to be incorrect.
• The information, opinions and forward-looking statements contained in this Presentation speak only as at the date of this Presentation and are subject to change without notice. The Company and its respective agents, employees and advisors do not intend to, and expressly disclaim any duty, undertaking or obligation to, make or disseminate any supplement, amendment, update or revision to any of the information, opinions or forward-looking statements contained in this Presentation to reflect any change in events, conditions or circumstances. To the extent permitted under the applicable provisions of law, neither the Company, nor any of its respective affiliates, advisers or representatives shall have any liability whatsoever (in negligence or otherwise) for any loss however arising from any use of this Presentation or its contents or otherwise arising in connection with this Presentation.
• This Presentation is not for distribution or use by any person or entity in any jurisdiction where such distribution or use would be contrary to local law or regulation or which would subject the Company or any of its affiliates to authorisation, licensing or other registration requirements under applicable laws. Neither this Presentation nor any part or copy of it may be taken or transmitted into the United States, or distributed directly or indirectly in the United States, except too the extent expressely provided herein. Any failure to comply with this restriction may constitute a violation of United States securities laws. Persons into whose possession this Presentation comes should observe all such restrictions. Any securities referred to herein have not been, and will not be, registered under the US Securities Act of 1933, as amended. Any such securities may not be offered or sold in the United States except pursuant to an exemption from, or in a transaction not subject to, the registration requirements of such Act.
• By attending the meeting at which this Presentation is made you represent that you meet all criteria and classify as “Qualified Institutional Buyers” as defined in Rule 144A under the U.S. Securities Act of 1933, as amended.•
26
