q2 & h1 financial results - · pdf filethis presentation may include forward ......
TRANSCRIPT

July 29 2015
Q2 & H1 FINANCIAL RESULTS

Forward Looking Statements
2
This Presentation may include forward-looking statements. Forward-looking statements are statements regarding or based
upon our management’s current intentions, beliefs or expectations relating to, among other things, Ontex’s future results
of operations, financial condition, liquidity, prospects, growth, strategies or developments in the industry in which we
operate. By their nature, forward-looking statements are subject to risks, uncertainties and assumptions that could cause
actual results or future events to differ materially from those expressed or implied thereby. These risks, uncertainties and
assumptions could adversely affect the outcome and financial effects of the plans and events described herein.
Forward-looking statements contained in this Presentation regarding trends or current activities should not be taken as a
representation that such trends or activities will continue in the future. We undertake no obligation to update or revise
any forward-looking statements, whether as a result of new information, future events or otherwise. You should not place
undue reliance on any such forward-looking statements, which speak only as of the date of this Presentation.

Table of Contents
Ontex Highlights
Financial Review
Outlook
Q&A
Appendix
3
1
2
4
3
4
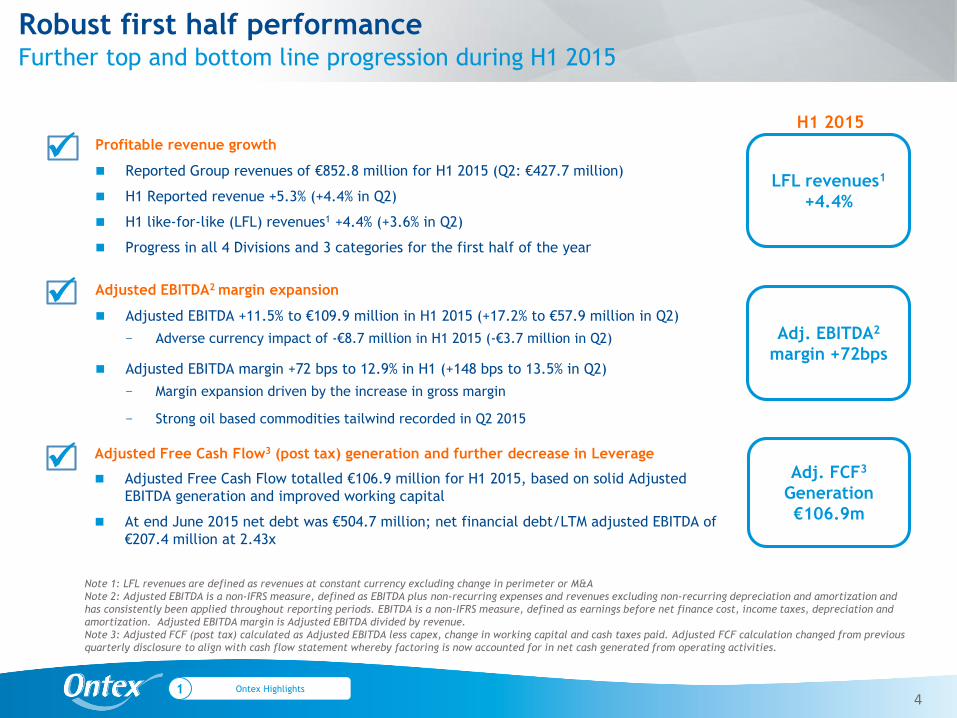
Profitable revenue growth
Reported Group revenues of €852.8 million for H1 2015 (Q2: €427.7 million)
H1 Reported revenue +5.3% (+4.4% in Q2)
H1 like-for-like (LFL) revenues1 +4.4% (+3.6% in Q2)
Progress in all 4 Divisions and 3 categories for the first half of the year
Adjusted EBITDA2 margin expansion
Adjusted EBITDA +11.5% to €109.9 million in H1 2015 (+17.2% to €57.9 million in Q2)
− Adverse currency impact of -€8.7 million in H1 2015 (-€3.7 million in Q2)
Adjusted EBITDA margin +72 bps to 12.9% in H1 (+148 bps to 13.5% in Q2)
− Margin expansion driven by the increase in gross margin
− Strong oil based commodities tailwind recorded in Q2 2015
Adjusted Free Cash Flow3 (post tax) generation and further decrease in Leverage
Adjusted Free Cash Flow totalled €106.9 million for H1 2015, based on solid Adjusted
EBITDA generation and improved working capital
At end June 2015 net debt was €504.7 million; net financial debt/LTM adjusted EBITDA of
€207.4 million at 2.43x
Robust first half performanceFurther top and bottom line progression during H1 2015
Note 1: LFL revenues are defined as revenues at constant currency excluding change in perimeter or M&A
Note 2: Adjusted EBITDA is a non-IFRS measure, defined as EBITDA plus non-recurring expenses and revenues excluding non-recurring depreciation and amortization and
has consistently been applied throughout reporting periods. EBITDA is a non-IFRS measure, defined as earnings before net finance cost, income taxes, depreciation and
amortization. Adjusted EBITDA margin is Adjusted EBITDA divided by revenue.
Note 3: Adjusted FCF (post tax) calculated as Adjusted EBITDA less capex, change in working capital and cash taxes paid. Adjusted FCF calculation changed from previous
quarterly disclosure to align with cash flow statement whereby factoring is now accounted for in net cash generated from operating activities.
Ontex Highlights1
Adj. FCF3
Generation
€106.9m
Adj. EBITDA2
margin +72bps
LFL revenues1
+4.4%
H1 2015

Our markets have continued to grow:
Western European markets have grown at a slower rate in the first half of 2015
Developing markets continued to grow as the result of:
− Increasing volumes
− Higher prices implemented to offset the impact of devaluating currencies
Retailer brands in our categories continued to outgrow markets in both Western and Eastern Europe
Competitive pressures remained high:
Price competition remains intense in both retail and institutional channels in Western Europe
Heightened competitive environment in some of our North African markets
Overall costs of our major raw materials were lower in H1 2015 than a year ago, but with varied impacts:
Lower oil based raw material costs were partially offset by higher fluff pulp
− Fluff pulp costs remained near record high levels (purchased in US Dollars) throughout the first half of 2015
− Strong oil-based commodities tailwind recorded in Q2 2015
Indices for oil-based commodities started rising already in March, and have continued to increase further despite much
lower crude oil pricing
Currencies: tailwind on the top line, headwinds on Adjusted EBITDA:
Revenue: largest positive currency impacts related mainly to the British Pound and to a lesser extend to Turkish Lira,
while the Russian Rouble had a negative impact
Main negative impact on Adjusted EBITDA was attributable to the US Dollar
5
Operating against a challenging market backdrop in H1 2015Heightened competitive pressures & more volatile macro environment
Ontex Highlights1
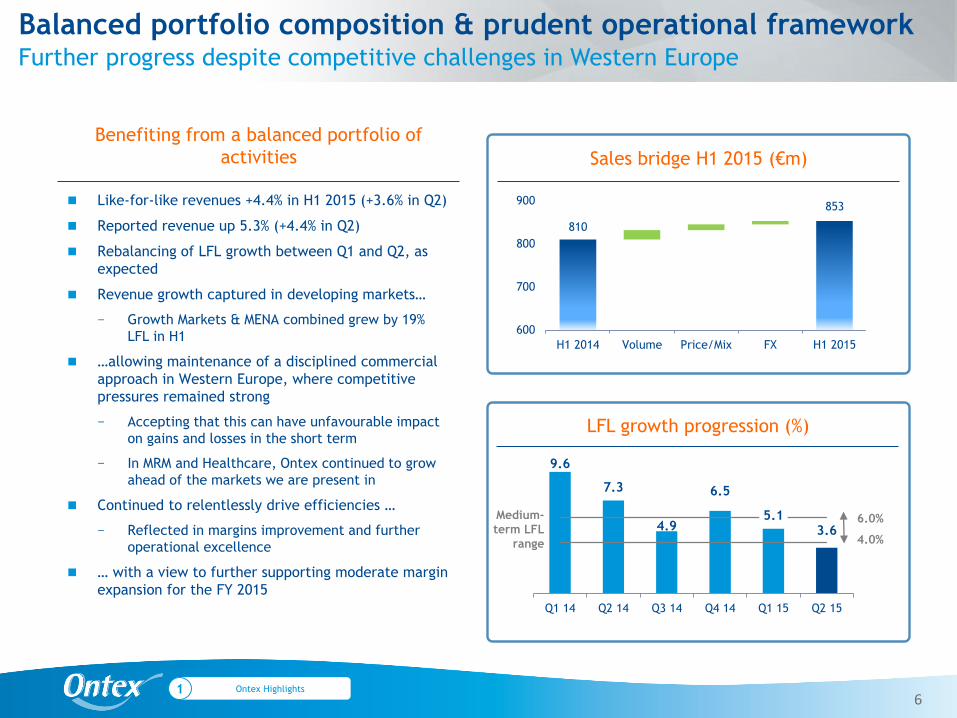
Like-for-like revenues +4.4% in H1 2015 (+3.6% in Q2)
Reported revenue up 5.3% (+4.4% in Q2)
Rebalancing of LFL growth between Q1 and Q2, as
expected
Revenue growth captured in developing markets…
− Growth Markets & MENA combined grew by 19%
LFL in H1
…allowing maintenance of a disciplined commercial
approach in Western Europe, where competitive
pressures remained strong
− Accepting that this can have unfavourable impact
on gains and losses in the short term
− In MRM and Healthcare, Ontex continued to grow
ahead of the markets we are present in
Continued to relentlessly drive efficiencies …
− Reflected in margins improvement and further
operational excellence
… with a view to further supporting moderate margin
expansion for the FY 2015
9.6
7.3
4.9
6.5
5.13.6
Q1 14 Q2 14 Q3 14 Q4 14 Q1 15 Q2 15
6
Benefiting from a balanced portfolio of
activities Sales bridge H1 2015 (€m)
Ontex Highlights1
LFL growth progression (%)
Balanced portfolio composition & prudent operational frameworkFurther progress despite competitive challenges in Western Europe
853
810
600
700
800
900
H1 2014 Volume Price/Mix FX H1 2015
6.0%Medium-
term LFL
range 4.0%

229 227
446 450
Q2 14 Q2 15 H1 14 H1 15
+1.0% LFL growth in H1 2015 in challenging market
conditions, and against a strong comparable result in
the same period last year
Slower market growth and intensified competitive
environment
Maintained commercial discipline and focused on
sustainable, profitable growth
− Accepting consequences of unfavourable impact
on gains and losses in the short term
H1 2015 Revenue was higher year on year in
Australia, Poland and Southern Europe
Revenue in the UK and Germany was lower in H1
2015
Positive currency impact largely due to the British
Pound; reported revenue growth +3.4%
7
Divisional Review LFL Revenue (€m) and sales growth
Mature Market Retail: 54% of H1 Reported Group SalesDisciplined commercial approach amid stronger competitive pressures
-1.0%
+1.0%
Ontex Highlights1

32
47
60
85
Q2 14 Q2 15 H1 14 H1 15
Growth Markets are an essential part of our balanced
portfolio, providing access to favourable
demographics, rising adoption rates
H1 2015 driven mainly by Russia:
− Reported growth continued despite very
dynamic currency environment
− Volumes continued to grow, including small but
growing retailer brand category
− Industry-wide prices have risen to compensate
for a negative FX impact
Volume-led growth also captured in Central Eastern
Europe
Negative currency impact mostly due to the Russian
Rouble; reported revenue growth +23.8%
8
Divisional Review LFL Revenue (€m) and sales growth
Growth Markets: 9% of H1 Reported Group SalesStrong volume growth complemented by specific pricing actions
+49.2%
+42.8%
Ontex Highlights1
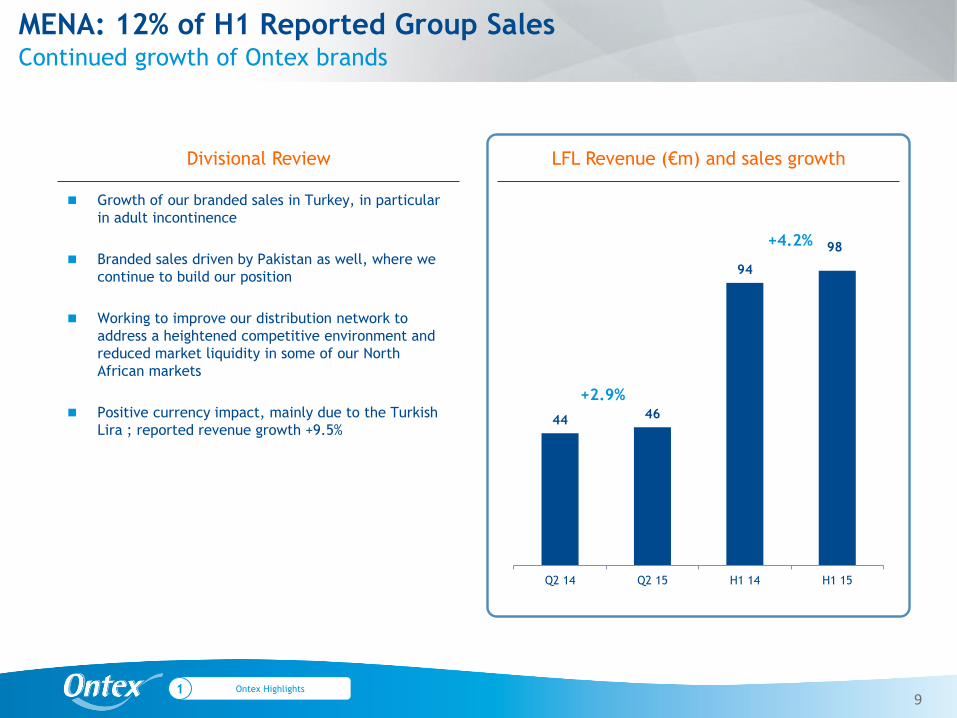
Growth of our branded sales in Turkey, in particular
in adult incontinence
Branded sales driven by Pakistan as well, where we
continue to build our position
Working to improve our distribution network to
address a heightened competitive environment and
reduced market liquidity in some of our North
African markets
Positive currency impact, mainly due to the Turkish
Lira ; reported revenue growth +9.5%
9
Divisional Review LFL Revenue (€m) and sales growth
MENA: 12% of H1 Reported Group SalesContinued growth of Ontex brands
+2.9%
+4.2%
Ontex Highlights1
44 46
94
98
Q2 14 Q2 15 H1 14 H1 15
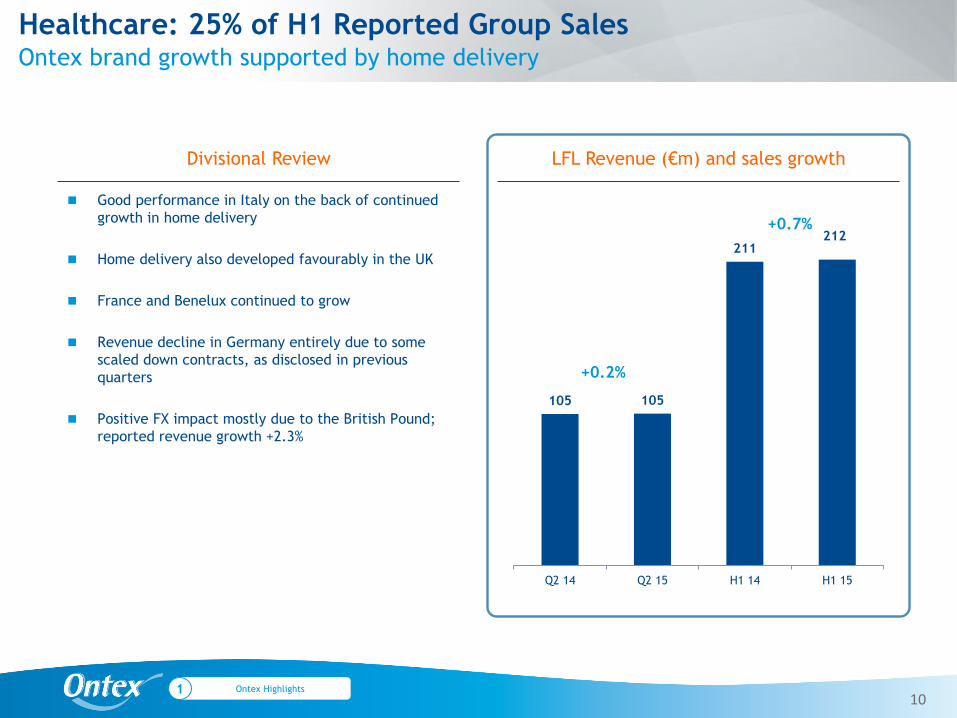
105 105
211212
Q2 14 Q2 15 H1 14 H1 15
Good performance in Italy on the back of continued
growth in home delivery
Home delivery also developed favourably in the UK
France and Benelux continued to grow
Revenue decline in Germany entirely due to some
scaled down contracts, as disclosed in previous
quarters
Positive FX impact mostly due to the British Pound;
reported revenue growth +2.3%
10
Divisional Review LFL Revenue (€m) and sales growth
Healthcare: 25% of H1 Reported Group SalesOntex brand growth supported by home delivery
+0.2%
+0.7%
Ontex Highlights1

4.3%
5.2%
4.0%
4.5%
-1.0%
0.5%
Q2 H1 Q2 H1 Q2 H1
Adult Inco FemcareBabycare
Q2
Babycare sales showed continued LFL growth in H1
against an exceptionally high comparable period last
year, which was due to the exit of a competitor
− Growth achieved with retailer brands in both
developed and developing markets
− Ontex brands supported growth in developing
markets
Adult Inco category growth was driven by sales in
pull-ups performing well
− Institutional channels revenue higher
− Retail revenue increased by 14% on a LFL basis
Femcare reported moderate H1 LFL revenue growth
− In line with Western European retailer brands
market performance where most of our sales
take place
11
Category Review LFL sales growth
Our CategoriesProgress in all three categories in H1 2015
54% 33% 12%% H1
reported
group
sales1
Ontex Highlights1
Note 1: Category split excludes 1% of “Other”
Table of Contents
Ontex Highlights
Financial Review
Outlook
Q&A
Appendix
12
1
2
4
3

Revenues 852.8 809.9 5.3%
Like-for-like (LFL) revenues1 845.2 809.9 4.4%
Gross margin 240.0 222.3 8.0%
Gross margin as % of sales 28.1% 27.4% 69 bps
Adjusted EBITDA2 109.9 98.6 11.5%
Adjusted EBITDA margin 12.9% 12.2% 72 bps
Adjusted EBITDA at constant currency 118.6 98.6 20.3%
Operating profit excl. non-recurring costs 93.6 82.6 13.3%
Operating profit 91.3 60.6 50.7%
Net finance cost (17.4) (39.1) (55.5%)
Income tax expense (17.0) (9.6) 77.1%
Net profit / (loss) 56.9 11.9 N.M.
Basic EPS 0.84 0.17 N.M.
13
Income Statement ReviewStrong profit growth driven by operating performance, IPO & refinancing
Note 1: LFL revenues are defined as revenues at constant currency excluding change in perimeter or M&A
Note 2: Adjusted EBITDA is a non-IFRS measure, defined as EBITDA plus non-recurring expenses and revenues excluding non-recurring depreciation and amortization and
has consistently been applied throughout reporting periods. EBITDA is a non-IFRS measure, defined as earnings before net finance cost, income taxes, depreciation and
amortization. Adjusted EBITDA margin is Adjusted EBITDA divided by revenue.
Financial Review2
In millions of Euro %H1 2014H1 2015

14
Adjusted EBITDA margin +72 bps in H1 to 12.9%; +148 bps in Q2 to 13.5%
− Driven by higher gross margin
− Continued investment in sales & marketing, as well as in support functions
Gross margin expansion of +69 bps to 28.1% for H1 2015:
− Ongoing focus on capturing efficiencies
− In addition, gross margin expansion driven by price increases and strong commodities tailwinds in Q2 2015
− In spite of negative FX impact linked to raw material purchases in US Dollars
Negative foreign exchange impact on EBITDA in H1 and Q2 2015:
− H1 2015: -€8.7 (Q2 2015: -€3.7 million) mainly due to the Russian Rouble and the US Dollar, partly offset by the
British Pound
Key margin drivers
Adjusted EBITDA MarginFurther margin expansion in H1 2015, mainly delivered by efficiencies
Financial Review2

Material increase driven by strong operating performance and WC management
15
Strong Adjusted EBITDA growth for the first half of the year, especially driven by a strong Q2 2015 contribution
H1 2015 working capital represented 9.5% of sales
− This performance was mainly due to a focus on receivables collection, and also benefited from the sale of €16.1
million of Italian VAT built up during 2014
Capital expenditures for H1 2015 were €15.3 million, full year capex expected to be slightly above 3% of sales
Financial Review2
In millions of Euro %H1 2014H1 2015
Adjusted Free Cash Flow
Note 1: Includes cash received from non-recourse factoring of receivables
Adjusted EBITDA 109.9 98.6 11.5%
Changes in working capital 19.0 (29.6) N.M.
Inventories (3.0) (17.4) (82.8%)
Trade and other receivables1 3.9 (38.1) N.M.
Trade and other payables 18.1 25.9 (30.1%)
Cash taxes paid (6.7) (4.1) 63.4%
Capex (15.3) (18.7) (18.7%)
Adj. Free Cash Flow (post tax) 106.9 46.2 131.4%
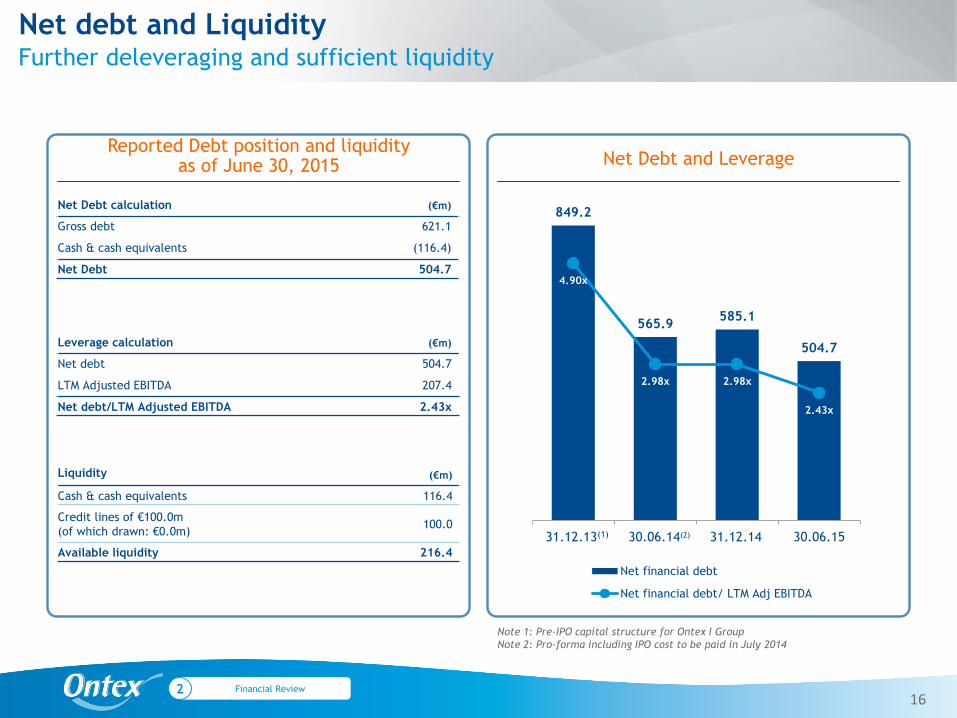
Reported Debt position and liquidityas of June 30, 2015 Net Debt and Leverage
Further deleveraging and sufficient liquidity
Net debt and Liquidity
Financial Review216
849.2
565.9585.1
504.7
4.90x
2.98x 2.98x
2.43x
0.00
1.00
2.00
3.00
4.00
5.00
6.00
100
200
300
400
500
600
700
800
900
FY 2013 H1 2014 FY 2014 H1 2015
Net financial debt
Net financial debt/ LTM Adj EBITDA
31.12.13(1) 30.06.14(2) 31.12.14 30.06.15
Liquidity (€m)
Cash & cash equivalents 116.4
Credit lines of €100.0m
(of which drawn: €0.0m)100.0
Available liquidity 216.4
Net Debt calculation (€m)
Gross debt 621.1
Cash & cash equivalents (116.4)
Net Debt 504.7
Leverage calculation (€m)
Net debt 504.7
LTM Adjusted EBITDA 207.4
Net debt/LTM Adjusted EBITDA 2.43x
Note 1: Pre-IPO capital structure for Ontex I Group
Note 2: Pro-forma including IPO cost to be paid in July 2014
Ontex Highlights
Financial Review
Outlook
Q&A
Appendix
Table of Contents
17
1
2
4
3

We remain committed to delivering sustainable, profitable growth.
While the growth in our key developed markets is slower than last year and overall at the low
end of the range of 3% to 4%, we continue to aim to outperform by helping retailers grow their
brands and increasing Ontex brand share.
Accessing faster growth in our developing markets allows us to maintain commercial discipline in
competitive developed markets.
Given the outlook for commodities and at current rates of foreign exchange, for full year 2015
we confirm our aim to deliver about 30bps of Adjusted EBITDA margin expansion.
Outlook318
OutlookStrategic progress and priorities

Ontex Highlights
Financial Review
Outlook
Q&A
Appendix
Table of Contents
19
1
2
4
3

Ontex Highlights
Financial Review
Outlook
Q&A
Appendix
Table of Contents
20
1
2
4
3
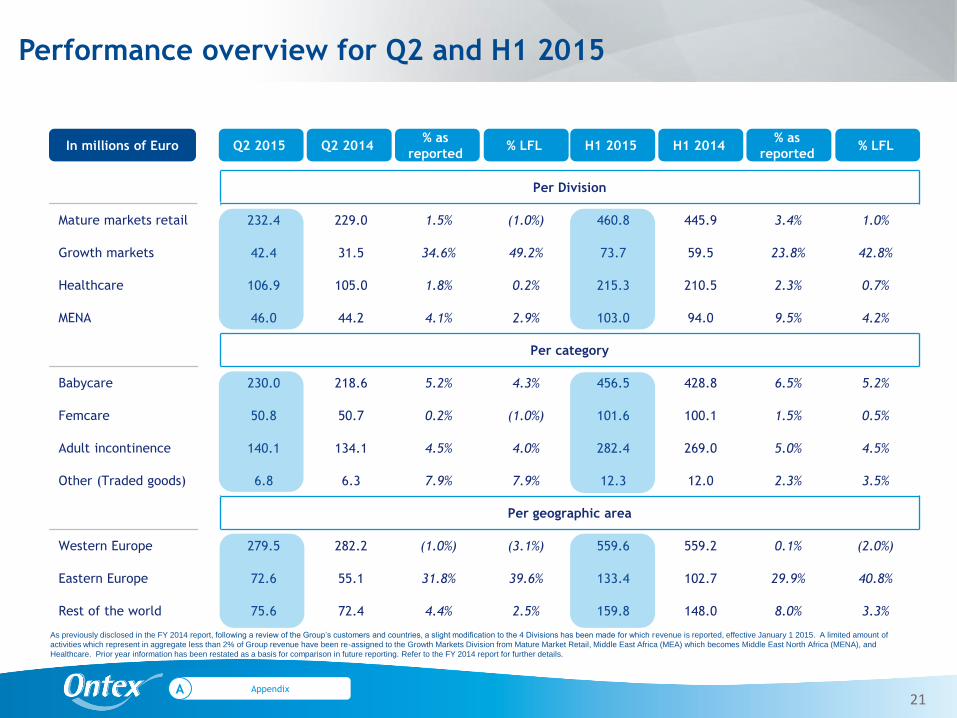
Performance overview for Q2 and H1 2015
21
Per Division
Mature markets retail 232.4 229.0 1.5% (1.0%) 460.8 445.9 3.4% 1.0%
Growth markets 42.4 31.5 34.6% 49.2% 73.7 59.5 23.8% 42.8%
Healthcare 106.9 105.0 1.8% 0.2% 215.3 210.5 2.3% 0.7%
MENA 46.0 44.2 4.1% 2.9% 103.0 94.0 9.5% 4.2%
Per category
Babycare 230.0 218.6 5.2% 4.3% 456.5 428.8 6.5% 5.2%
Femcare 50.8 50.7 0.2% (1.0%) 101.6 100.1 1.5% 0.5%
Adult incontinence 140.1 134.1 4.5% 4.0% 282.4 269.0 5.0% 4.5%
Other (Traded goods) 6.8 6.3 7.9% 7.9% 12.3 12.0 2.3% 3.5%
Per geographic area
Western Europe 279.5 282.2 (1.0%) (3.1%) 559.6 559.2 0.1% (2.0%)
Eastern Europe 72.6 55.1 31.8% 39.6% 133.4 102.7 29.9% 40.8%
Rest of the world 75.6 72.4 4.4% 2.5% 159.8 148.0 8.0% 3.3%
AppendixA
In millions of Euro% as
reportedQ2 2014Q2 2015 % LFL
% as
reportedH1 2014H1 2015 % LFL
As previously disclosed in the FY 2014 report, following a review of the Group’s customers and countries, a slight modification to the 4 Divisions has been made for which revenue is reported, effective January 1 2015. A limited amount of
activities which represent in aggregate less than 2% of Group revenue have been re-assigned to the Growth Markets Division from Mature Market Retail, Middle East Africa (MEA) which becomes Middle East North Africa (MENA), and
Healthcare. Prior year information has been restated as a basis for comparison in future reporting. Refer to the FY 2014 report for further details.

Non-recurring expenses (2.3) (22.0)
Factory closure (0.1) (0.9)
Business restructuring (0.7) (0.4)
Acquisition related expenses (0.4) (0.5)
Asset impairment - (0.1)
IPO costs - (21.1)
Refinancing costs (0.1) -
Other (1.0) 1.0
22
In millions of Euro H1 2014H1 2015
Non-recurring CostsLimited impact in H1 2015 as anticipated
AppendixA