q2 report - baytexenergy.com reports... · q2 report summary • produced 53,073 boe/d (86% oil and...
TRANSCRIPT

14AUG2012210509
2012
Q2 REPORT
SUMMARY
• Produced 53,073 boe/d (86% oil and NGL) in Q2/2012, an increase of 11% over Q2/2011;
• Generated funds from operations (‘‘FFO’’) of $124.7 million ($1.04 per basic share) in Q2/2012, a decrease of 10%from Q2/2011;
• Generated net income of $157.3 million ($1.32 per basic share) in Q2/2012, an increase of 47% over Q2/2011;
• Completed the sale of non-operated assets in North Dakota for net proceeds of $313.8 million (US$312 million),realizing a pre-tax gain of $175.4 million ($105.2 million net of current and deferred income tax);
• Maintained a conservative cash payout ratio in Q2/2012 of 42% net of dividend reinvestment plan (‘‘DRIP’’)participation (63% before DRIP); and
• Subsequent to the end of the second quarter, issued $300 million of 6.625% Series C senior unsecureddebentures due July 19, 2022 at par and called $150 million of 9.15% Series A senior unsecured debentures due2016 for redemption.
Three Months Ended Six Months Ended
March 31, June 30, June 30,June 30, June 30,2012 2012 2011 2012 2011
FINANCIAL (thousands of Canadian dollars, except percommon share amounts)
Petroleum and natural gas sales 284,248 343,355 336,899 627,603 627,214Funds from operations(1) 124,692 141,736 138,233 266,428 247,703
Per share – basic 1.04 1.20 1.20 2.24 2.15Per share – diluted 1.03 1.18 1.17 2.20 2.10
Cash dividends declared(2) 51,943 55,559 52,763 107,502 104,765Cash dividends declared per share 0.66 0.66 0.60 1.32 1.20Net income 157,280 42,958 106,863 200,238 107,813
Per share – basic 1.32 0.36 0.92 1.68 0.94Per share – diluted 1.30 0.36 0.90 1.66 0.91
Exploration and development 102,895 135,918 108,453 238,813 195,467Property acquisitions 10,173 2,336 (185) 12,509 37,333Corporate acquisition – – 1,325 – 118,671Proceeds from divestitures (313,834) (3,568) – (317,402) –
Total oil and natural gas capital expenditures (200,766) 134,686 109,593 (66,080) 351,471
Bank loan 396,207 326,889 315,073 396,207 315,073Long-term debt 302,865 299,865 294,645 302,865 294,645Working capital (surplus) deficiency (261,153) 63,988 72,621 (261,153) 72,621
Total monetary debt(3) 437,919 690,742 682,339 437,919 682,339
Baytex Energy Corp. Second Quarter Report 2012 1

Three Months Ended Six Months Ended
March 31, June 30, June 30,June 30, June 30,2012 2012 2011 2012 2011
OPERATING
Daily productionLight oil and NGL (bbl/d) 7,090 7,565 6,055 7,327 6,329Heavy oil (bbl/d) 38,579 38,353 33,839 38,467 32,821Total oil and NGL (bbl/d) 45,669 45,918 39,894 45,794 39,150Natural gas (mmcf/d) 44.4 45.1 47.8 44.8 49.4Oil equivalent (boe/d @ 6:1)(4) 53,073 53,433 47,853 53,254 47,380
Average prices (before hedging)WTI oil (US$/bbl) 93.49 102.93 102.56 98.20 98.33Edmonton par oil ($/bbl) 84.42 92.81 102.63 88.55 95.57BTE light oil and NGL ($/bbl) 71.62 81.99 89.11 76.97 82.14BTE heavy oil ($/bbl)(5) 57.42 65.89 71.02 61.65 65.60BTE total oil and NGL ($/bbl) 59.63 68.54 73.78 64.10 68.26BTE natural gas ($/mcf) 2.00 2.46 4.36 2.23 4.27BTE oil equivalent ($/boe) 52.97 60.98 65.84 57.00 60.89
CAD/USD noon rate at period end 1.0191 0.9991 0.9643 1.0191 0.9643CAD/USD average rate for period 1.0102 1.0003 0.9676 1.0052 0.9767
COMMON SHARE INFORMATION
TSXShare price (Cdn$)
High $ 53.61 $ 59.40 $ 58.76 $ 59.40 $ 58.76Low $ 38.54 $ 50.52 $ 47.59 $ 38.54 $ 46.00Close $ 42.89 $ 51.79 $ 52.72 $ 42.89 $ 52.72
Volume traded (thousands) 34,162 23,378 22,857 57,540 57,055
NYSEShare price (US$)
High $ 54.44 $ 59.50 $ 61.95 $ 59.50 $ 61.95Low $ 37.40 $ 50.49 $ 48.63 $ 37.40 $ 46.25Close $ 42.11 $ 51.86 $ 54.44 $ 42.11 $ 54.44
Volume traded (thousands) 8,257 4,488 9,851 12,745 18,035Common shares outstanding (thousands) 119,914 118,905 116,004 119,914 116,004
Notes:
(1) Funds from operations is a non-GAAP measure that represents cash generated from operating activities adjusted for financecosts, changes in non-cash operating working capital and other operating items. Baytex’s funds from operations may not becomparable to other issuers. Baytex considers funds from operations a key measure of performance as it demonstrates itsability to generate the cash flow necessary to fund future dividends and capital investments. For a reconciliation of funds fromoperations to cash flow from operating activities, see Management’s Discussion and Analysis of the operating and financialresults for the three months and six months ended June 30, 2012.
(2) Cash dividends declared are net of DRIP participation.(3) Total monetary debt is a non-GAAP measure which we define to be the sum of monetary working capital (which is current
assets less current liabilities (excluding non-cash items such as deferred income tax assets or liabilities and unrealized gains orlosses on financial derivatives)), the principal amount of long-term debt and long-term bank loans.
(4) Barrel of oil equivalent (‘‘boe’’) amounts have been calculated using a conversion rate of six thousand cubic feet of natural gasto one barrel of oil. The use of boe amounts may be misleading, particularly if used in isolation. A boe conversion ratio of sixthousand cubic feet of natural gas to one barrel of oil is based on an energy equivalency conversion method primarilyapplicable at the burner tip and does not represent a value equivalency at the wellhead.
(5) Heavy oil prices are net of blending costs
2 Baytex Energy Corp. Second Quarter Report 2012

Forward-Looking Statements
This report contains forward-looking statements relating to: our average production rate for 2012; our exploration and developmentcapital expenditures for 2012; our production mix for 2012, development plans for our properties, including the number of wells tobe drilled in the remainder of 2012; initial production rates from wells drilled; our Cliffdale cyclic steam stimulation project at Seal,including our assessment of the steam and flowback operations, the cumulative steam-oil ratio for the project and our plan for asecond commercial module of CSS; our Lloydminster heavy oil area, including the development potential of these properties, ourability to exploit multiple horizons and estimated 30-day peak productions rates from new horizontal and vertical wells; the outlookfor Canadian heavy oil prices and the pricing differential between Canadian heavy oil and West Texas Intermediate; the alleviation ofpipeline constraints through the addition of incremental transportation capacity; the completion of refinery turnarounds; thedemand for Canadian heavy oil by U.S. refiners; the existence, operation and strategy of our risk management program forcommodity prices, heavy oil differentials and interest and foreign exchange rates; our ability to mitigate our exposure to heavy oilprice differentials by transporting our crude oil to market by railways; the volume of heavy oil to be transported to market on railwaysin 2012; the expected in-service date for a pipeline expansion that will enable us to access the U.S. Gulf Coast markets; theapplication of the proceeds from the sale of our non-operated interests in North Dakota; the amount of our undrawn credit facilitiesat June 30, 2012; our debt-to-FFO ratio; our pro forma financial position following the issuance of the Series C senior unsecureddebentures, the redemption of the Series A senior unsecured debentures and the repatriation of the proceeds from the sale of ournon-operated interests in North Dakota; our liquidity and financial capacity; and our ability to continue to execute our growth andincome business model in a volatile commodity price environment. In addition, information and statements relating to reserves aredeemed to be forward-looking statements, as they involve implied assessment, based on certain estimates and assumptions, thatthe reserves described exist in quantities predicted or estimated, and that the reserves can be profitably produced in the future.Cash dividends on our common shares are paid at the discretion of our Board of Directors and can fluctuate. In establishing thelevel of cash dividends, the Board of Directors considers all factors that it deems relevant, including, without limitation, the outlookfor commodity prices, our operational execution, the amount of FFO and capital expenditures and our prevailing financialcircumstances at the time. We refer you to the end of the Management’s Discussion and Analysis section of this report for ouradvisory on forward-looking statements.
Non-GAAP Financial Measures
In this report we refer to certain measures that are commonly used in the oil and gas industry but are not based on generallyaccepted accounting principles in Canada, such as funds from operations and total monetary debt. For a description of thesemeasures, we refer you to ‘‘Non-GAAP Financial Measures’’ in the Management’s Discussion and Analysis section of this report.
All amounts in this report are stated in Canadian dollars unless otherwise noted.
Baytex Energy Corp. Second Quarter Report 2012 3

MESSAGE TO SHAREHOLDERS
Operations Review
Production continued to perform in accordance with our operating budget, averaging 53,073 boe/d (86% oil andNGL) during Q2/2012. This production rate represents an increase of 11% over Q2/2011, which growth is essentiallyattributable to our exploration and development program. The current quarter production also compares favourablyto the 53,433 boe/d average in Q1/2012, after accounting for the approximately 440 boe/d impact on the quarteraverage from the North Dakota disposition, and the usual production curtailment associated with spring break-upfield conditions. Our 2012 annual production guidance remains at 53,500 to 54,500 boe/d and our 2012 explorationand development capital budget remains at $400 million. Our production mix for 2012 is forecast to be 73% heavyoil, 14% light oil and NGL and 13% natural gas.
Capital expenditures for exploration and development activities totaled $102.9 million for Q2/2012. During thequarter, Baytex participated in the drilling of 38 (22.9 net) wells with a 100% success rate.
Wells Drilled in Q2/2012Crude Oil
Stratigraphic Dry andPrimary Thermal Natural Gas and Service Abandoned Total
Gross Net Gross Net Gross Net Gross Net Gross Net Gross Net
Heavy oilLloydminster area 10 6.1 – – – – – – – – 10 6.1Peace River area 11 11.0 – – – – – – – – 11 11.0
21 17.1 – – – – – – – – 21 17.1
Light oil, NGL and natural gasWestern Canada 3 2.1 – – – – – – – – 3 2.1North Dakota 14 3.7 – – – – – – – – 14 3.7
17 5.8 – – – – – – – – 17 5.8
Total 38 22.9 – – – – – – – – 38 22.9
Heavy Oil
In Q2/2012, heavy oil production averaged 38,579 bbl/d, an increase of 14% over Q2/2011 and 1% over Q1/2012.During the current quarter, we drilled 21 (17.1 net) oil wells on our heavy oil properties with a success rate of 100%.
Production from our Peace River area properties averaged approximately 19,300 bbl/d in Q2/2012, an increase of4% over Q1/2012 and 34% over Q2/2011. In this quarter, we drilled 11 (11.0 net) cold horizontal producers in theSeal area (encompassing a total of 139 laterals). During the quarter, 10 Seal wells established average 30-day peakproduction rates of approximately 575 bbl/d and one Reno well established a 30-day peak production rate of300 bbl/d. We plan to drill approximately 22 cold horizontal wells in the Peace River area in the remainder of the year.
In the Cliffdale area of Seal, successful operations continued at our 10-well commercial cyclic steam stimulation(‘‘CSS’’) module, with production during the second quarter averaging 440 bbl/d, consistent with project designparameters. During Q2/2012, two wells received steam and four wells commenced post-steam flowbackoperations. First-cycle peak rates of 230 bbl/d and second-cycle peak rates of 325 bbl/d were observed. Thermalflowback operations on the original pilot well generated a fourth-cycle peak rate of 390 bbl/d with a significantincrease in sustained average daily production rates. The final five CSS wells that were completed during the firstquarter of 2012 continued their initial cold-production phase, a process designed to generate reservoir voidage priorto first steam. First-cycle steaming for these remaining five wells will commence in the second half of 2012. To date,the Cliffdale project has demonstrated a cumulative steam-oil-ratio of less than 1.9 barrels of steam per barrel of oil.Subject to receipt of regulatory approvals, we plan to initiate development of a new 15-well commercial CSS moduleduring Q4/2012.
Second quarter drilling included five (5.0 net) horizontal wells and five (1.1 net) vertical wells in our Lloydminsterheavy oil area. This area is characterized by stacked pay which has lead to successful exploitation of multiple
4 Baytex Energy Corp. Second Quarter Report 2012

horizons. Our Lloydminster heavy oil projects generate consistent, repeatable results with horizontal wells typicallyproducing 30-day peak rates of approximately 70-80 bbl/d and vertical wells typically producing 30-day peak ratesof approximately 30-40 bbl/d. We expect to drill approximately 11 horizontal wells and 18 vertical wells in this area inthe second half of 2012.
Light Oil & Natural Gas
During Q2/2012, light oil, NGL and natural gas production averaged 14,494 boe/d, which was comprised of7,090 bbl/d of light oil and NGL and 44.4 mmcf/d of natural gas. Compared to Q2/2011, light oil and NGL productionincreased 17% and natural gas production decreased 7%. Compared to the Q1/2012, light oil and NGL productiondecreased 6%, reflecting the sale of the non-operated North Dakota assets, and natural gas productiondecreased 2%.
On May 22, 2012, Baytex completed the sale of its non-operated interests in North Dakota for cash proceeds ofUS$312 million, after closing adjustments. The assets included approximately 950 boe/d of Bakken light oilproduction (based on Q1/2012 production) and 149,700 (50,400 net) acres of land, of which approximately 24% wasdeveloped. This sale represented 45% of our North Dakota net acreage and approximately 40% of ourU.S. production. These assets were not a primary focus of our U.S. Business Unit as they were non-operated andgenerally had a lower average working interest than our remaining lands.
In our Bakken/Three Forks play in North Dakota, we participated in the drilling of 14 (3.7 net) horizontal oil wellsduring Q2/2012, six of which were Baytex-operated, and the fracture-stimulation of 14 (2.7 net) wells. During thequarter, 18 Baytex-interest 1,280-acre spacing wells established average 30-day peak rates of approximately310 bbl/d. We plan to drill approximately 12 (4.0 net) wells in North Dakota during the remainder of 2012.
During Q2/2012, Baytex entered into an agreement to acquire approximately 72,300 (50,600 net) acres (70%working interest) in Weston and Niobrara Counties, Wyoming for US$176 per net acre (total initial consideration ofUS$8.9 million). Baytex is in the process of permitting two horizontal wells to test the Turner formation, whichproduces from existing vertical wells in the area and is being developed with horizontal techniques elsewhere in thebasin. Baytex will complete its obligations under this agreement by carrying the seller for a 30% working interest inthese two wells, estimated to cost approximately US$4 million per well on a 100% basis.
During Q2/2012, we drilled two horizontal wells in our Viking light oil resource play in Central Alberta, with one welldrilled in Q1/2012 and one well drilled in Q2/2012 establishing average 30-day peak rates of 80 bbl/d. We have fiveViking wells planned for the second half of 2012.
Financial Review
We generated FFO of $125 million ($1.04 per basic share) in Q2/2012, a decrease of 10% compared to Q2/2011,and a decrease of 12% compared to Q1/2012, both due to lower realized prices for oil and natural gas. Revenue, netof royalties, were $238.2 million in Q2/2012, a 17% decrease from Q2/2011 due in part to the increase in salesvolumes which were delivered to market on railways. Unlike pipelines, heavy oil transported on railways does notneed to be blended with condensate. As a result, we sell an unblended barrel, the price of which does not includethe cost of the blending diluent. Correspondingly, our transportation and blending expenses are 29% lower inQ2/2012 than they were in Q2/2011 as we did not have to purchase as much condensate for blending. Our salesprice, net of blending cost, is enhanced by transporting heavy oil on railways, but from a reporting perspective, thereis a reduction in gross revenue and a reduction in transportation and blending expenses.
The average WTI price for Q2/2012 was US$93.49, a 9% decrease from both Q2/2011 and Q1/2012. We received anaverage oil and NGL price of $59.63/bbl in Q2/2012 (inclusive of our physical hedging gains), down 19% from$73.78/bbl for Q2/2011 and down 13% from $68.54/bbl for Q1/2012. We received an average natural gas price of$2.00/mcf in Q2/2012, down 54% from $4.36/mcf for Q2/2011 and down 19% from $2.46/mcf for Q1/2012.
The discount for Canadian heavy oil, as measured by the Western Canadian Select (‘‘WCS’’) price differential to WTI,averaged 24% during Q2/2012, and 22% for the first half of 2012, as compared to 17% and 21%, respectively, forthe same periods in 2011. The increase in Canadian heavy crude differentials in Q2/2012, as compared to Q2/2011,
Baytex Energy Corp. Second Quarter Report 2012 5

was caused by operational issues at export pipelines and U.S. refineries that run Canadian heavy oil. Demand forCanadian heavy oil is expected to remain strong in the future, with additional refinery expansions in late 2012 and in2013, together with increasing rail exports of Canadian heavy oil and increasing pipeline access to U.S. gulf coastrefineries. However, sporadic refinery and export pipeline upsets, together with growing heavy oil production,increase the likelihood of continued volatility in WCS price differentials from month-to-month. Current prompt WCSdifferential to WTI is approximately 17%, with a forward strip suggesting approximately 24% for the second half of2012. Over the longer term, we continue to believe that transportation solutions to allow Canadian crudes to accessadditional markets will proceed, and that the prices for Canadian crudes will more closely match those of worldwidequality peers.
Baytex continues to actively hedge its exposure to commodity prices and foreign exchange rates. We haveestablished forward contracts for the balance of 2012 on approximately 43% of our WTI price exposure, 28% of ourheavy oil differential exposure, 38% of our natural gas price exposure, and 32% of our exposure to currencymovements between the Canadian and U.S. dollars. We have begun to secure hedging contracts on our WTIexposure for 2013. Details of all hedging contracts are contained in the notes to our interim financial statements. Wecontinue to monitor the markets for opportunities to add to our hedge positions.
Our WCS differential hedges are primarily contracts that provide a fixed dollar differential to WTI. Based on theforward strip for WTI, our WCS contracts for 2012 translate to approximately an 18% differential to WTI. We haveadditional contracts for smaller volumes in place for 2013 and 2014 at an average differential of 21% to WTI. Inaddition to our hedging program, we are also mitigating our exposure to WCS differentials by transporting crude oilto higher value markets by railways. We are currently delivering approximately 27% of our heavy oil volumes tomarket by rail and expect to increase rail deliveries to approximately 35% to 40% of our heavy oil volumes byyear-end. Furthermore, as part of our long-term transportation portfolio, we have entered into a transportationservices agreement for a pipeline expansion that will enable us to access the U.S. gulf coast markets forapproximately 12% of our heavy oil production (based on current production rates) for a 10-year period. Thispipeline expansion is expected to commence service in mid-2014.
During Q2/2012, Baytex completed the previously disclosed sale of non-operated interests in North Dakota for netproceeds of $313.8 million (US$312 million), realizing a pre-tax gain of $175.4 million. Cash tax expense of$17 million has been accrued in the second quarter related to this disposition. Under U.S. income tax laws, if theproceeds of a disposition are reinvested into qualifying properties within a prescribed time frame, the tax on the gainmay be deferred. In order to qualify for this potential deferral, we were required to place the sales proceeds intoescrow pending the acquisition of replacement properties. Subsequent to the end of the second quarter,US$112.5 million of the sales proceeds were returned from escrow and used to reduce borrowings on our creditfacilities. The balance of US$199.5 million will either be invested in replacement properties in the U.S. or remain inescrow until Q4/2012, at which time it will be released and used to reduce borrowings on our credit facilities. At thistime it is not likely we will conclude a transaction to acquire qualifying replacement properties within the prescribedtime frame and, therefore, the tax accrued will become payable as installments in the third and fourth quartersof 2012.
We ended the quarter with total monetary debt of $438 million representing a debt-to-FFO ratio of 0.8 times, basedon FFO over the trailing twelve-month period. In July 2012, we issued $300 million of 6.625% Series C seniorunsecured debentures due July 19, 2022 at par. A portion of the net proceeds of this issue will be used to redeem$150 million of 9.15% Series A senior unsecured debentures, which have been called for redemption on August 26,2012 at 104.575% of principal amount, with the remaining proceeds used to reduce borrowings on our creditfacilities. Pro forma the debenture issue in July and the debenture redemption in August, and assuming therepatriation of all of the North Dakota sales proceeds (net of tax), the only outstanding borrowings Baytex wouldhave are the US$150 million Series B debentures due 2021 and the $300 million Series C debentures due 2022. Ourentire $700 million credit facilities would be undrawn.
6 Baytex Energy Corp. Second Quarter Report 2012

12MAR200921080465
Conclusion
Baytex’s operations continue to advance in accordance with our business plans and budgets, underpinned by aproven asset base and dedicated employees led by a talented management team. Proceeds from the sale ofnon-operated assets in North Dakota, combined with the issuance of new 10-year senior unsecured debentures inJuly, create a balance sheet that provides us with ample liquidity to support the execution of our growth and incomebusiness model. We look forward to welcoming our new President and Chief Executive Officer, Jim Bowzer, inSeptember and continuing to deliver superior returns to our shareholders.
On behalf of the Board of Directors,
Raymond T. ChanExecutive Chairman and Interim Chief Executive OfficerAugust 14, 2012
Baytex Energy Corp. Second Quarter Report 2012 7

MANAGEMENT’S DISCUSSION AND ANALYSIS
The following is management’s discussion and analysis (‘‘MD&A’’) of the operating and financial results of BaytexEnergy Corp. for the three months and six months ended June 30, 2012. This information is provided as ofAugust 13, 2012. In this MD&A, references to ‘‘Baytex’’, the ‘‘Company’’, ‘‘we’’, ‘‘us’’ and ‘‘our’’ and similar terms referto Baytex Energy Corp. and its subsidiaries on a consolidated basis, except where the context requires otherwise.The second quarter results have been compared with the corresponding period in 2011. This MD&A should be readin conjunction with the Company’s condensed interim unaudited consolidated financial statements (‘‘consolidatedfinancial statements’’) for the three months and six months ended June 30, 2012 and 2011, its audited consolidatedcomparative financial statements for the years ended December 31, 2011 and 2010, together with accompanyingnotes, and its Revised Annual Information Form for the year ended December 31, 2011. These documents andadditional information about Baytex are accessible on the SEDAR website at www.sedar.com. All amounts are inCanadian dollars, unless otherwise stated, and all tabular amounts are in thousands of Canadian dollars, except forpercentages and per common share amounts as otherwise noted.
In this MD&A, barrel of oil equivalent (‘‘boe’’) amounts have been calculated using a conversion rate of six thousandcubic feet of natural gas to one barrel of oil, which represents an energy equivalency conversion method applicableat the burner tip and does not represent a value equivalency at the wellhead. While it is useful for comparativemeasures, it may not accurately reflect individual product values and may be misleading if used in isolation.
This MD&A contains forward-looking information and statements. We refer you to the end of the MD&A for ouradvisory on forward-looking information and statements.
NON-GAAP FINANCIAL MEASURES
In this MD&A, we refer to certain financial measures (such as funds from operations, payout ratio, total monetarydebt and operating netback) which do not have any standardized meaning prescribed by generally acceptedaccounting principles in Canada (‘‘GAAP’’). While funds from operations, payout ratio and operating netback arecommonly used in the oil and natural gas industry, our determination of these measures may not be comparablewith calculations of similar measures for other issuers.
Funds from Operations
We define funds from operations as cash flow from operating activities adjusted for financing costs, changes innon-cash operating working capital and other operating items. We believe that this measure assists in providing amore complete understanding of certain aspects of our results of operations and financial performance, includingour ability to generate the cash flow necessary to fund future dividends to shareholders and capital investments.However, funds from operations should not be construed as an alternative to traditional performance measuresdetermined in accordance with GAAP, such as cash flow from operating activities and net income. For areconciliation of funds from operations to cash flow from operating activities, see ‘‘Funds from Operations, PayoutRatio and Dividends’’.
Payout Ratio
We define payout ratio as cash dividends (net of participation in our dividend reinvestment plan) divided by fundsfrom operations. We believe that this measure assists in providing a more complete understanding of certainaspects of our results of operations and financial performance, including our ability to generate the cash flownecessary to fund future dividends to shareholders and capital investments.
8 Baytex Energy Corp. Second Quarter Report 2012
Total Monetary Debt
We define total monetary debt as the sum of monetary working capital (which is current assets less current liabilities(excluding non-cash items such as deferred income tax assets or liabilities and unrealized gains or losses onfinancial derivatives)), the principal amount of long-term debt and long-term bank loan. We believe that this measureassists in providing a more complete understanding of our cash liabilities.
Operating Netback
We define operating netback as product revenue less royalties, production and operating expenses andtransportation expenses divided by barrels of oil equivalent sales volume for the applicable period. We believe thatthis measure assists in characterizing our ability to generate cash margin on a unit of production basis.
Baytex Energy Corp. Second Quarter Report 2012 9
RESULTS OF OPERATIONS
Production
Three Months Ended June 30 Six Months Ended June 30
2012 2011 Change 2012 2011 Change
Daily ProductionLight oil and NGL (bbl/d) 7,090 6,055 17% 7,327 6,329 16%Heavy oil (bbl/d)(1) 38,579 33,839 14% 38,467 32,821 17%Natural gas (mmcf/d) 44.4 47.8 (7%) 44.8 49.4 (9%)
Total production (boe/d) 53,073 47,853 11% 53,254 47,380 12%
Production MixLight oil and NGL 13% 13% – 14% 14% –Heavy oil 73% 71% – 72% 69% –Natural gas 14% 16% – 14% 17% –
(1) Heavy oil sales volumes may differ from reported production volumes due to changes to Baytex’s heavy oil inventory. For thethree months ended June 30, 2012, heavy oil sales volumes were 88 bbl/d lower than production volumes (three monthsended June 30, 2011 – 71 bbl/d higher). For the six months ended June 30, 2012, heavy oil sales volumes were 1 bbl/d higherthan production volumes (six months ended June 30, 2011 – 332 bbl/d higher).
Production for the three months ended June 30, 2012 averaged 53,073 boe/d, compared to 47,853 boe/d for thesame period in 2011. Light oil and natural gas liquids (‘‘NGL’’) production increased by 17% to 7,090 bbl/d in thesecond quarter of 2012 from 6,055 bbl/d in the second quarter of 2011 due to development activities in the U.S., andproduction interruptions in 2011 from wet weather in North Dakota, as well as forest fires, and pipeline curtailmentsin Alberta. Light oil and NGL production was also impacted by an asset sale which reduced light oil production by anaverage of approximately 440 bbl/d in the current quarter. Heavy oil production for the second quarter of 2012increased by 14% to 38,579 bbl/d from 33,839 bbl/d a year ago primarily due to development activities. Natural gasproduction decreased by 7% to 44.4 mmcf/d for the second quarter of 2012, as compared to 47.8 mmcf/d for thesame period in 2011 primarily due to natural declines as we focused our capital spending on our oil portfolio.
Production for the six months ended June 30, 2012 averaged 53,254 boe/d, compared to 47,380 boe/d for the sameperiod in 2011. Light oil and NGL production increased by 16% to 7,327 bbl/d from 6,329 bbl/d due to similarreasons listed above for the quarter-over-quarter comparison. Light oil and NGL production was also reduced by anaverage of approximately 220 bbl/d due to an asset sale. Heavy oil production for the six month ended June 30,2012 increased by 17% to 38,467 bbl/d from 32,821 bbl/d a year ago primarily due to development activities.Natural gas production decreased by 9% to 44.8 mmcf/d for the first six months of 2012, as compared to49.4 mmcf/d for the same period in 2011 primarily due to natural declines as we focused our capital spending on ouroil portfolio.
Commodity Prices
Crude Oil
For the first six months of 2012, the price of prompt West Texas Intermediate (‘‘WTI’’) fluctuated between a low ofUS$78.10/bbl and a high of US$110.56/bbl, resulting in a six-month average price of US$98.20/bbl, similar to theUS$98.33/bbl average price for the first half of 2011. Several factors caused the oil price fluctuation seen in the firsthalf of 2012. Through April 2012, a combination of escalating tensions over Iran’s nuclear program and signs ofimproving economic conditions in the U.S. and developing world resulted in daily WTI prices of over US$100/bbl. Inthe second quarter of 2012, the average price of WTI fell to US$93.49/bbl, or 10% lower than the first quarter of2012, on news of worsening financial situations in the European Union, as well as softening economic growth in theU.S. and China. Driven by prospects of lower global economic growth, as well as high production rates from SaudiArabia, WTI prices declined for much of the second quarter to a low of US$78.10/bbl on June 28, 2012.
10 Baytex Energy Corp. Second Quarter Report 2012

The discount for Canadian heavy oil, as measured by the Western Canadian Select (‘‘WCS’’) price differential to WTI,averaged 24% during the second quarter of 2012, and 22% for the first half of 2012, as compared to 17% and 21%,respectively, for the same periods in 2011. The increase in Canadian heavy crude differentials in the second quarterof 2012, as compared to 2011 was primarily caused by operational issues at export pipelines and U.S. refineries thatrun Canadian heavy oil. Demand for Canadian heavy oil is expected to remain strong in the future, with additionalrefinery expansions in late 2012 and in 2013, together with increasing rail exports of Canadian heavy oil andincreasing pipeline access to U.S. gulf coast refineries. However, sporadic refinery and export pipeline upsets,together with growing heavy oil production, increase the likelihood of continued volatility of heavy oil differentialsfrom month-to-month.
Natural Gas
For the six months ended June 30, 2012, the average AECO natural gas price was $2.18/mcf, as compared to$3.76/mcf in the same period in 2011. For the three months ended June 30, 2012, AECO natural gas pricesaveraged $1.84/mcf, compared to $3.74/mcf in the same period last year. High U.S. natural gas production,combined with a relatively mild winter in major consuming areas, is largely responsible for the decline in natural gasprices seen through the first half of 2012, as storage levels in both the U.S. and western Canada set new records. Inthe later half of the second quarter in 2012, early and sustained hot weather across much of the U.S. increasedpower demand, particularly from gas-fired power generation. This in turn increased consumption of natural gas anddepleted excess natural gas storage to help rally prices towards the end of the second quarter.
Three Months Ended June 30 Six Months Ended June 30
2012 2011 Change 2012 2011 Change
Benchmark AveragesWTI oil (US$/bbl)(1) $ 93.49 $ 102.56 (9%) $ 98.20 $ 98.33 0%WCS heavy oil (US$/bbl)(2) $ 70.62 $ 84.93 (17%) $ 76.06 $ 78.08 (3%)Heavy oil differential(3) (24%) (17%) – (22%) (21%) –CAD/USD average exchange rate 1.0191 0.9677 (5%) 0.9947 0.9768 (2%)Edmonton par oil ($/bbl) $ 84.42 $ 102.63 (18%) $ 88.55 $ 95.57 (7%)AECO natural gas price ($/mcf)(4) $ 1.84 $ 3.74 (51%) $ 2.18 $ 3.76 (42%)
Baytex Average Sales PricesLight oil and NGL ($/bbl) $ 71.62 $ 89.11 (20%) $ 76.97 $ 82.14 (6%)Heavy oil ($/bbl)(5) $ 56.31 $ 70.75 (20%) $ 60.38 $ 64.47 (6%)Physical forward sales contracts
gain (loss) ($/bbl) 1.11 0.27 1.27 1.13
Heavy oil, net ($/bbl) $ 57.42 $ 71.02 (19%) $ 61.65 $ 65.60 (6%)
Total oil and NGL, net ($/bbl) $ 59.63 $ 73.78 (19%) $ 64.10 $ 68.26 (6%)
Natural gas ($/mcf)(6) $ 2.00 $ 4.04 (50%) $ 2.23 $ 3.98 (44%)Physical forward sales contracts
gain ($/mcf) – 0.21 – 0.29
Natural gas, net ($/mcf) $ 2.00 $ 4.36 (54%) $ 2.23 $ 4.27 (48%)
SummaryWeighted average ($/boe)(6) $ 52.04 $ 65.26 (20%) $ 55.94 $ 59.63 (6%)Physical forward sales contracts
gain (loss) ($/boe) 0.93 0.58 1.06 1.26
Weighted average, net ($/boe) $ 52.97 $ 65.84 (20%) $ 57.00 $ 60.89 (6%)
(1) WTI refers to the arithmetic average based on NYMEX prompt month WTI.(2) WCS refers to the average posting price for the benchmark WCS heavy oil.(3) Heavy oil differential refers to the WCS discount to WTI.(4) AECO refers to the AECO arithmetic average monthly index price published by the Canadian Gas Price Reporter.(5) Baytex’s realized heavy oil prices are calculated based on sales volumes, net of blending costs.(6) Baytex’s risk management strategy employs both oil and natural gas financial and physical forward contracts (fixed price
forward sales and collars) and heavy oil differential physical delivery contracts (fixed price and percentage of WTI). The abovepricing information in the table excludes the impact of financial derivatives.
Baytex Energy Corp. Second Quarter Report 2012 11

During the second quarter of 2012, Baytex’s average sales price for light oil and NGL was $71.62 bbl, down 20%from $89.11/bbl in the second quarter of 2011. Baytex’s realized heavy oil price during the second quarter of 2012,prior to physical forward sales contracts, was $56.31/bbl, or 78% of WCS. This compares to a realized heavy oilprice in the second quarter of 2011, prior to physical forward sales contracts, of $70.75/bbl, or 86% of WCS. Thediscount to WCS largely reflects the cost of blending Baytex’s heavy oil with diluent to meet pipeline specifications.Net of physical forward sales contracts, Baytex’s realized heavy oil price during the second quarter of 2012 was$57.42/bbl, down 19% from $71.02/bbl in the second quarter of 2011. Baytex’s realized natural gas price for thethree months ended June 30, 2012 was $2.00/mcf with no applicable physical forward sales contracts (threemonths ended June 30, 2011 – $4.04/mcf prior to physical forward sales contracts and $4.36/mcf inclusive ofphysical forward sales contracts).
In the first six months of 2012, Baytex’s average sales price for light oil and NGL was $76.97/bbl, down 6% from$82.14/bbl in the first six months of 2011. Baytex’s realized heavy oil price during the first six months of 2012, priorto physical forward sales contracts, was $60.38/bbl or 80% of WCS. This compares to a realized heavy oil price inthe first six months of 2011, prior to physical forward sales contracts, of $64.47/bbl, or 85% of WCS. The differentialto WCS largely reflects the cost of blending Baytex’s heavy oil with diluent to meet pipeline specifications. Net ofphysical forward sales contracts, Baytex’s realized heavy oil price during the first six months of 2012 was$61.65/bbl, down 6% from $65.60/bbl in the first six months of 2011. Baytex’s realized natural gas price for the sixmonths ended June 30, 2012 was $2.23/mcf with no applicable physical forward sales contracts (six months endedJune 30, 2011 – $3.98/mcf prior to physical forward sales contracts and $4.27/mcf inclusive of physical forwardsales contracts).
Gross Revenues
Three Months Ended June 30 Six Months Ended June 30
($ thousands except for %) 2012 2011 Change 2012 2011 Change
Oil revenueLight oil and NGL $ 46,206 $ 49,097 (6%) $ 102,649 $ 94,091 9%Heavy oil 201,130 217,882 (8%) 431,635 392,352 10%
Total oil revenue 247,336 266,979 (7%) 534,284 486,443 10%Natural gas revenue 8,086 18,957 (57%) 18,162 38,193 (52%)
Total oil and natural gas revenue 255,422 285,936 (11%) 552,446 524,636 5%
Sales of heavy oil blending diluent 28,826 50,963 (43%) 75,157 102,578 (27%)
Total petroleum and natural gas sales $ 284,248 $ 336,899 (16%) $ 627,603 $ 627,214 –%
Petroleum and natural gas sales decreased 16% to $284.2 million for the three months ended June 30, 2012 from$336.9 million for the same period in 2011. This decrease is a result of lower oil and natural gas sales prices, whichwas partially offset by an increase in heavy and light oil and NGL sales volumes compared to the three monthsended June 30, 2011. Sales of heavy oil blending diluent were down 43% for the three months ended June 30, 2012from the same period last year because of the increase in our sales volumes which were delivered by rail. Unlike oursales through oil pipelines, when we sell raw bitumen by rail we are not required to blend it with condensate.
For the six months ended June 30, 2012, petroleum and natural gas sales totaled $627.6 million, consistent with$627.2 million for the same period in 2011. Lower realized oil and natural gas sales prices during the six monthsended June 30, 2012 were offset by higher sales volumes as compared to the six months ended June 30, 2011.Sales of heavy oil blending diluent were down 27% for the six months ended June 30, 2012 from the same periodlast year because of the increase in our sales volumes which were delivered by rail. Unlike our sales through oilpipelines, when we sell raw bitumen by rail we are not required to blend it with condensate.
12 Baytex Energy Corp. Second Quarter Report 2012
Royalties
Three Months Ended June 30 Six Months Ended June 30
($ thousands except for % and per boe) 2012 2011 Change 2012 2011 Change
Royalties $ 46,020 $ 51,159 (10%) $ 99,014 $ 99,961 (1%)Royalty rates:
Light oil, NGL and natural gas 18.3% 17.0% – 18.4% 17.9% –Heavy oil 17.9% 18.2% – 17.8% 19.4% –
Average royalty rates(1) 18.0% 17.9% – 17.9% 19.1% –Royalty expenses per boe $ 9.54 $ 11.78 (19%) $ 10.22 $ 11.60 (12%)
(1) Average royalty rate excludes sales of heavy oil blending diluents and the effects of financial derivatives.
Total royalties for the second quarter of 2012 decreased to $46.0 million from $51.2 million in the second quarter of2011. Total royalties for the second quarter of 2012 were 18.0% of petroleum and natural gas revenue (excludingsales of heavy oil blending diluent), as compared to 17.9% for the same period in 2011. Total royalties for the sixmonths ended June 30, 2012 decreased to $99.0 million from $100.0 million in the six months ended June 30, 2011.Total royalties for the first six months of 2012 were 17.9% of petroleum and natural gas revenue (excluding sales ofheavy oil blending diluent), as compared to 19.1% for the same period in 2011.
Royalty rates for light oil, NGL and natural gas increased from 17.0% in the three months ended June 30, 2011 to18.3% in the three months ended June 30, 2012 due to expiry of conventional oil royalty rate incentives on new wellsand timing differences from our gas cost allowance annual filings. Royalty rates for heavy oil decreased from 18.2%in the three months ended June 30, 2011 to 17.9% for the three months ended June 30, 2012 due to a lowerSaskatchewan Resource Surcharge.
Royalty rates for light oil, NGL and natural gas increased from 17.9% in the six months ended June 30, 2011 to18.4% in the six months ended June 30, 2012 due to expiry of conventional oil royalty rate incentives on new wells.Royalty rates for heavy oil decreased from 19.4% in the six months ended June 30, 2011 to 17.8% in the six monthsended June 30, 2012 due to royalty incentives on new wells at Seal and Kerrobert. In Seal, the royalty frameworklevies a flat 5% royalty rate on horizontal wells for the first 50,000 to 100,000 barrels of production, depending onwell depth. In Kerrobert, our Steam Assisted Gravity Drainage projects attract favourable royalty rate incentives.
Baytex Energy Corp. Second Quarter Report 2012 13

Financial Derivatives
Three Months Ended June 30 Six Months Ended June 30
($ thousands) 2012 2011 Change 2012 2011 Change
Realized gain (loss) on financialderivatives(1)
Crude oil $ 7,688 $ (13,036) $ 20,724 $ (865) $ (17,469) $ 16,604Natural gas 1,763 (33) 1,796 2,988 (43) 3,031Foreign currency 917 4,692 (3,775) 2,798 10,794 (7,996)Interest rate 112 – 112 (1,581) (72) (1,509)
Total $ 10,480 $ (8,377) $ 18,857 $ 3,340 $ (6,790) $ 10,130
Unrealized gain (loss) on financialderivatives(2)
Crude oil $ 53,309 $ 52,384 $ 925 $ 44,391 $ 3,593 $ 40,798Natural gas (1,976) 1,097 (3,073) (1,608) 1,505 (3,113)Foreign currency (2,893) (4,077) 1,184 419 (2,697) 3,116Interest rate (1,056) 198 (1,254) (20) 731 (751)
Total $ 47,384 $ 49,602 $ (2,218) $ 43,182 $ 3,132 $ 40,050
Total gain (loss) on financialderivativesCrude oil $ 60,997 $ 39,348 $ 21,649 $ 43,526 $ (13,876) $ 57,402Natural gas (213) 1,064 (1,277) 1,380 1,462 (82)Foreign currency (1,976) 615 (2,591) 3,217 8,097 (4,880)Interest rate (944) 198 (1,142) (1,601) 659 (2,260)
Total $ 57,864 $ 41,225 $ 16,639 $ 46,522 $ (3,658) $ 50,180
(1) Realized gain (loss) on financial derivatives represents actual cash settlement or receipts for the financial derivatives.(2) Unrealized gain (loss) on financial derivatives represents the change in fair value of the financial derivatives during the period.
The total gain on financial derivatives for the three months ended June 30, 2012 was $57.9 million, as compared to again of $41.2 million for the same period in 2011. This includes a realized gain of $10.5 million and an unrealizedmark-to-market gain of $47.4 million for the second quarter of 2012, as compared to $8.4 million in realized lossesand an unrealized mark-to-market gain of $49.6 million for the second quarter of 2011. The realized gain of$10.5 million for the three months ended June 30, 2012 on derivative contracts relates to lower commodity pricesduring the period. The unrealized mark-to-market gain of $47.4 million for the three months ended June 30, 2012relates to lower oil prices at June 30, 2012, as compared to December 31, 2011, partially offset by a weakeningCanadian dollar against the U.S. dollar.
The total gain on financial derivatives for the six months ended June 30, 2012 was $46.5 million, as compared to aloss of $3.7 million for the same period in 2011. This includes a realized gain of $3.3 million and an unrealizedmark-to-market gain of $43.2 million for the first six months of 2012, as compared to a $6.8 million realized loss andan unrealized mark-to-market gain of $3.1 million for the same period of 2011. The realized gain of $3.3 million forthe six months ended June 30, 2012 relates to lower oil prices and favourable foreign currency contracts, partiallyoffset by losses on oil and interest rate contracts. The unrealized mark-to-market gain of $43.2 million for the sixmonths ended June 30, 2012 relates to lower natural gas prices at June 30, 2012, as compared to December 31,2011, partially offset by a weakening Canadian dollar against the U.S. dollar.
A summary of the risk management contracts in place as at June 30, 2012 and the accounting treatment of theCompany’s financial instruments are disclosed in note 15 to the consolidated financial statements.
Evaluation and Exploration Expense
Evaluation and exploration expense for the three months ended June 30, 2012 increased to $4.5 million from$3.4 million for the same period in 2011 due to an increase in the expiration of undeveloped land leases. Evaluationand exploration expense for the six months ended June 30, 2012 increased marginally to $6.9 million from
14 Baytex Energy Corp. Second Quarter Report 2012

$6.8 million for the same period in 2011. The increase in the second quarter of 2012 was offset by a decrease in thefirst quarter, resulting in no significant change for the six months ended June 30, 2012 as compared to 2011.
Production and Operating Expenses
Three Months Ended June 30 Six Months Ended June 30
($ thousands except for % and per boe) 2012 2011 Change 2012 2011 Change
Production and operating expenses $ 56,967 $ 50,189 14% $ 115,254 $ 97,665 18%Production and operating expenses
per boe:Heavy oil $ 10.62 $ 11.31 (6%) $ 10.84 $ 11.18 (3%)Light oil, NGL and natural gas $ 14.99 $ 12.14 23% $ 14.63 $ 11.69 25%Total $ 11.81 $ 11.56 2% $ 11.89 $ 11.34 5%
Production and operating expenses for the three months ended June 30, 2012 increased to $57.0 million from$50.2 million due to increased production volumes attributable to the development of existing assets in Canada andthe U.S. Production and operating expenses were $11.81 per boe for the three months ended June 30, 2012, ascompared to $11.56 per boe for the same period in 2011. Total production and operating expenses increased by14% and light oil, NGL and natural gas production and operating expenses increased by 27% for the three monthsended June 30, 2012, as compared to the same period of 2011 due to higher production and increased turnaroundcosts and labour rates.
Production and operating expenses for the six months ended June 30, 2012 increased to $115.3 million from$97.7 million due to increased production volumes attributable to the development of existing assets in Canada andthe U.S. and from the Reno and Brewster acquisitions completed in February and August 2011, respectively.Production and operating expenses were $11.89 per boe for the six months ended June 30, 2012, as compared to$11.34 per boe for the same period in 2011. Total production and operating expenses increased by 18% and lightoil, NGL and natural gas production and operating expenses increased by 28% for the six months ended June 30,2012, as compared to the same period of 2011 due to higher production and increased workover expenses,turnaround costs and labour rates.
Transportation and Blending Expenses
Three Months Ended June 30 Six Months Ended June 30
($ thousands except for % and per boe) 2012 2011 Change 2012 2011 Change
Blending expenses $ 28,826 $ 50,963 (43%) $ 75,157 $ 102,578 (27%)Transportation expenses 18,964 16,555 15% 34,370 29,100 18%
Total transportation and blendingexpenses $ 47,790 $ 67,518 (29%) $ 109,527 $ 131,678 (17%)
Transportation expenses per boe(1):Heavy oil $ 5.18 $ 5.04 3% $ 4.66 $ 4.52 3%Light oil, NGL and natural gas $ 0.61 $ 0.85 (28%) $ 0.66 $ 0.78 (15%)Total $ 3.93 $ 3.81 3% $ 3.55 $ 3.38 5%
(1) Transportation expenses per boe are before the purchase of blending diluent.
Transportation and blending expenses for the second quarter of 2012 were $47.8 million, as compared to$67.5 million for the second quarter of 2011. Transportation and blending expenses for the first half of 2012 were$109.5 million, as compared to $131.7 million for the first half of 2011.
The heavy oil produced by Baytex requires blending to reduce its viscosity in order to meet pipeline specifications.In most cases, Baytex purchases condensate from industry producers as the blending diluent facilitates themarketing of its heavy oil. In the second quarter of 2012, blending expenses were $28.8 million for the purchase of3,114 bbl/d of condensate at $101.73 per barrel, as compared to $51.0 million for the purchase of 5,208 bbl/d at
Baytex Energy Corp. Second Quarter Report 2012 15

$107.53 per barrel for the same period last year. In the six months ended June 30, 2012, blending expenses were$75.2 million for the purchase of 3,867 bbl/d of condensate at $106.79 per barrel, as compared to $102.6 million forthe purchase of 5,537 bbl/d at $102.35 per barrel for the same period last year. This decrease in blending for boththe three and six month periods ending June 30, 2012 is due to the export of a portion of our heavy oil production byrail, which does not require diluent blending, as compared to no rail exports in the prior periods. The cost of blendingdiluent is effectively recovered in the sale price of a blended product.
Transportation expenses were $3.93 per boe for the three months ended June 30, 2012, as compared to $3.81 perboe for the same period of 2011. Transportation expenses were $3.55 per boe for the six months ended June 30,2012, as compared to $3.38 per boe for the same period of 2011. The increase in transportation expenses per barrelof heavy oil for the three and six months ended June 30, 2012 is primarily driven by a larger portion of our heavy oilproduction coming from our Seal and Reno areas which utilize long-haul trucking to ship a portion of productionvolumes.
Operating Netback
Three Months Ended June 30 Six Months Ended June 30
($ per boe except for % and volume) 2012 2011 Change 2012 2011 Change
Sales volume (boe/d) 52,985 47,725 11% 53,255 47,603 12%
Operating netback(1):Sales price(2) $ 52.97 $ 65.84 (20%) $ 57.00 $ 60.89 (6%)Less:
Royalties 9.54 11.78 (19%) 10.22 11.60 (12%)Operating expenses 11.81 11.56 2% 11.89 11.34 5%Transportation expenses 3.93 3.81 3% 3.55 3.38 5%
Operating netback before financialderivatives $ 27.69 $ 38.69 (28%) $ 31.34 $ 34.57 (9%)
Financial derivatives gain (loss)(3) 2.17 (1.93) 212% 0.34 (0.79) 143%
Operating netback after financialderivatives gain (loss) $ 29.86 $ 36.76 (19%) $ 31.68 $ 33.78 (6%)
(1) Operating netback table includes revenues and costs associated with sulphur production.(2) Sales price is shown net of blending costs and gains (losses) on physical delivery contracts.(3) Financial derivatives reflect realized gains (losses) only.
General and Administrative Expenses
Three Months Ended June 30 Six Months Ended June 30
($ thousands except for % and per boe) 2012 2011 Change 2012 2011 Change
General and administrative expenses $ 11,137 $ 8,689 28% $ 22,325 $ 19,819 13%General and administrative expenses
per boe $ . 2.31 $ 2.00 16% $ 2.30 $ 2.30 –%
General and administrative expenses for the second quarter of 2012 increased to $11.1 million from $8.7 million, ascompared to the same period in 2011. On a per boe basis, general and administrative expenses increased by 16%from $2.00 in the second quarter of 2011 to $2.31 in the second quarter of 2012 due to higher salary levels, higheroffice rent and higher costs related to the 2011 year end reserve report.
General and administrative expenses for the six months ended June 30, 2012 increased to $22.3 million from$19.8 million, as compared to the same period in 2011. On a per boe basis, general and administrative expenses of$2.30 in the second quarter of 2012 were unchanged from the same period in 2011.
16 Baytex Energy Corp. Second Quarter Report 2012

Share-based Compensation Expense
On January 1, 2011, the Company adopted a full-value award plan (the ‘‘Share Award Incentive Plan’’) pursuant towhich restricted awards and performance awards may be granted to directors, officers and employees of theCompany and its subsidiaries. Concurrent with the adoption of the Share Award Incentive Plan, no further grantswere made under the Common Share Rights Incentive Plan (the ‘‘Share Rights Plan).
Compensation expense related to the Share Rights Plan decreased to $0.7 million in the second quarter of 2012(three months ended June 30, 2011 – $4.5 million) while compensation expense related to the Share AwardIncentive Plan increased to $11.6 million for the three months ended June 30, 2012 (three months ended June 30,2011 – $2.9 million). The overall increase in compensation expense of $5.0 million is mainly due to the conversion ofrestricted awards and performance awards held by a departed executive.
Compensation expense related to the Share Rights Plan decreased to $1.2 million in the six months ended June 30,2012 (six months ended June 30, 2011 – $9.8 million) while compensation expense related to the Share AwardIncentive Plan increased to $18.0 million for the six months ended June 30, 2012 (six months ended June 30, 2011 –$5.6 million). The overall increase in compensation expense of $3.9 million is mainly due to the conversion ofrestricted awards and performance awards held by a departed executive.
Compensation expense associated with the Share Rights Plan and the Share Award Incentive Plan is recognized inincome over the vesting period of the share rights or share awards with a corresponding increase in contributedsurplus. The issuance of common shares upon the exercise of share rights or conversion of share awards isrecorded as an increase in shareholders’ capital with a corresponding reduction in contributed surplus.
Financing Costs
Three Months Ended June 30 Six Months Ended June 30
($ thousands except for %) 2012 2011 Change 2012 2011 Change
Bank loan and other $ 3,144 $ 3,086 2% $ 5,684 $ 6,807 (16%)Long-term debt 6,168 6,008 3% 12,281 10,704 15%Accretion on asset retirement
obligations 1,652 1,516 9% 3,279 3,000 9%Debt financing costs 830 2,183 (62%) 849 2,844 (70%)
Financing costs $ 11,794 $ 12,793 (8%) $ 22,093 $ 23,355 (5%)
Financing costs for the three months ended June 30, 2012 decreased to $11.8 million, as compared to $12.8 millionin the second quarter of 2011. The decrease was primarily attributable to lower credit facility amendment fees andlower average borrowing on bank loans coupled with lower interest rates, offset by interest on the US$150 millionprincipal amount of 6.75% Series B senior unsecured debentures issued on February 17, 2011.
Financing costs for the six months ended June 30, 2012 decreased to $22.1 million, as compared to $23.4 million inthe first half of 2011. The decrease was primarily attributable to lower credit facility amendment fees and loweraverage borrowing on bank loans coupled with lower interest rates, offset by interest on the US$150 million principalamount of 6.75% Series B senior unsecured debentures issued on February 17, 2011.
Baytex Energy Corp. Second Quarter Report 2012 17

Foreign Exchange
Three Months Ended June 30 Six Months Ended June 30
($ thousands except for % and exchange rates) 2012 2011 Change 2012 2011 Change
Unrealized foreign exchange (gain) loss $ 8,105 $ (4,746) (271%) $ 2,112 $ (9,602) (122%)Realized foreign exchange loss (gain) (1,225) 740 266% (100) 1,666 106%
Total (gain) loss $ 6,880 $ (4,006) (271%) $ 2,012 $ (7,936) (125%)
CAD/USD exchange rates:At beginning of period 0.9991 0.9718 1.0170 0.9946At end of period 1.0191 0.9643 1.0191 0.9643
The foreign exchange loss for the three months ended June 30, 2012 was $6.9 million and comprised of anunrealized foreign exchange loss of $8.1 million and a realized foreign exchange gain of $1.2 million. The foreignexchange gain for the three months ended June 30, 2011 was $4.0 million and comprised of an unrealized foreignexchange gain of $4.7 million and a realized foreign exchange loss of $0.7 million. The second quarter of 2012unrealized loss of $8.1 million, as compared to a gain of $4.7 million for the second quarter of 2011, was mainly dueto the translation of the US$180 million portion of the bank loan and US$150 million Series B senior unsecureddebentures as the Canadian dollar weakened against the U.S. dollar at June 30, 2012 (as compared to March 31,2012) and strengthened at June 30, 2011 (as compared to March 31, 2011). The current quarter realized gains weredue to day-to-day U.S. dollar denominated transactions.
The foreign exchange loss for the six months ended June 30, 2012 was $2.0 million and comprised of an unrealizedforeign exchange loss of $2.1 million and a realized foreign exchange gain of $0.1 million. The foreign exchange gainfor the six months ended June 30, 2011 was $7.9 million and comprised of an unrealized foreign exchange gain of$9.6 million and a realized foreign exchange loss of $1.7 million. The unrealized loss in the first half of 2012 of$2.1 million, as compared to a gain of $9.6 million for the first half of 2011, was mainly due to the translation of theUS$180 million portion of the bank loan and US$150 million Series B senior unsecured debentures as the Canadiandollar weakened against the U.S. dollar at June 30, 2012 (as compared to December 31, 2011) and strengthened atJune 30, 2011 (as compared to December 31, 2010). The current quarter realized gains were due to day-to-dayU.S. dollar denominated transactions.
Depletion and Depreciation
Depletion and depreciation for the three months ended June 30, 2012 increased to $70.6 million from $56.4 millionfor the same period in 2011. On a sales-unit basis, the provision for the current quarter was $14.64 per boe, ascompared to $12.32 per boe for the same quarter in 2011. The increase relates primarily to an increase in estimatesof future development costs resulting in a higher depletable base.
Depletion and depreciation for the six months ended June 30, 2012 increased to $142.9 million from $113.1 millionfor the same period in 2011. On a sales-unit basis, the provision for the first half of 2012 was $14.74 per boe, ascompared to $12.79 per boe for the same period in 2011. The increase relates primarily to an increase in estimatesof future development costs resulting in a higher depletable base.
Income Taxes
For the six months ended June 30, 2012, total income tax expense was $110.0 million (six months ended June 30,2011 – $16.0 million) of which $16.7 million related to current income taxes (six months ended June 30, 2011 – $nil)and $93.4 million related to deferred income taxes (six months ended June 30, 2011 – $16.0 million). The increase inincome tax expense relates primarily to the disposition of non-operated assets in North Dakota during the secondquarter of 2012. The gain on disposition is, to the extent possible, sheltered from current taxes by available U.S. taxdeductions. The unsheltered portion of the gain results in a $16.7 million current tax expense payable to U.S. federaland state tax authorities. The remaining increase in income tax expense relates to changes in unrealized financialderivatives gains and losses and other minor differences.
18 Baytex Energy Corp. Second Quarter Report 2012

Net Income
Net income for the three months ended June 30, 2012 was $157.3 million, as compared to $106.9 million for thesame period in 2011. The increase in net income was primarily the result of a $175.4 million gain on disposition ofU.S. properties and increase in gain on financial derivative contracts, offset by lower operating netback, higherincome tax expense and higher depletion and depreciation.
Net income for the six months ended June 30, 2012 was $200.2 million, as compared to $107.8 million for the sameperiod in 2011. The increase in net income was primarily the result of a $175.4 million gain on disposition ofU.S. properties and increase in gain on financial derivative contracts, offset by lower operating netback, higherincome tax expense and higher depletion and depreciation.
Other Comprehensive Income
Revenues and expenses of foreign operations are translated to Canadian dollars using average foreign currencyexchange rates for the period. Monetary assets and liabilities that form part of the net investment in the foreignoperation are translated at the period-end foreign currency exchange rate. Gains or losses resulting from thetranslation are included in accumulated other comprehensive income (loss) in shareholders’ equity and arerecognized in net income when there has been a disposal or partial disposal of the foreign operation.
The $1.9 million balance of accumulated other comprehensive loss at June 30, 2012 is the sum of a $3.5 millionforeign currency translation loss incurred as at December 31, 2011 and a $1.6 million foreign currency translationgain related to the six months ended June 30, 2012.
Baytex Energy Corp. Second Quarter Report 2012 19

FUNDS FROM OPERATIONS, PAYOUT RATIO AND DIVIDENDS
Funds from operations and payout ratio are non-GAAP measures. Funds from operations represents cash flow fromoperating activities adjusted for financing costs, changes in non-cash operating working capital and other operatingitems. Payout ratio is calculated as cash dividends (net of participation in the Dividend Reinvestment Plan (‘‘DRIP’’))divided by funds from operations. Baytex considers these to be key measures of performance as they demonstrateits ability to generate the cash flow necessary to fund dividends and capital investments.
The following table reconciles cash flow from operating activities (a GAAP measure) to funds from operations(a non-GAAP measure):
Three Months Ended Six Months Ended
March 31, June 30, June 30,June 30, June 30,($ thousands except for %) 2012 2012 2011 2012 2011
Cash flow from operating activities $ 122,701 $ 151,361 $ 146,199 $ 274,062 $ 266,098Change in non-cash working capital 11,594 (1,881) 2,206 9,713 (186)Asset retirement expenditures 377 771 959 1,148 1,878Financing costs (11,794) (10,299) (12,793) (22,093) (23,355)Accretion on asset retirement obligations 1,652 1,627 1,516 3,279 3,000Accretion on debentures and long-term debt 162 157 146 319 268
Funds from operations $ 124,692 $ 141,736 $ 138,233 $ 266,428 $ 247,703
Cash dividends declared $ 78,908 $ 78,365 $ 69,425 $ 157,273 $ 104,765Reinvested dividends 26,965 22,806 16,661 49,771 33,453
Cash dividends declared (net of DRIP) $ 51,943 $ 55,559 $ 52,764 $ 107,502 $ 71,312
Payout ratio 63% 55% 50% 59% 42%Payout ratio (net of DRIP) 42% 39% 38% 40% 29%
Baytex does not deduct capital expenditures when calculating the payout ratio. Due to the depleting nature ofpetroleum and natural gas assets, certain levels of capital expenditures are required to minimize productiondeclines. In the petroleum and natural gas industry, due to the nature of reserve reporting, natural productiondeclines and the risks involved in capital investment, it is not possible to distinguish between capital spent onmaintaining productive capacity and capital spent on growth opportunities. Should the costs to explore for, developor acquire petroleum and natural gas assets increase significantly, it is possible that Baytex would be required toreduce or eliminate its dividends in order to fund capital expenditures. There can be no certainty that Baytex will beable to maintain current production levels in future periods. Cash dividends declared, net of DRIP participation, of$51.9 million for the second quarter of 2012 were funded through funds from operations of $124.7 million. Cashdividends declared, net of DRIP participation, of $107.5 million for the six month ended June 30, 2012 were fundedthrough funds from operations of $266.4 million.
LIQUIDITY AND CAPITAL RESOURCES
We regularly review our liquidity sources as well as our exposure to counterparties and have concluded that ourcapital resources are sufficient to meet our on-going short, medium and long-term commitments. Specifically, webelieve that our internally generated funds from operations, augmented by our hedging program and existing creditfacilities, will provide sufficient liquidity to sustain our operations in the short, medium and long-term. Further, webelieve that our counterparties currently have the financial capacities to honor outstanding obligations to us in the
20 Baytex Energy Corp. Second Quarter Report 2012

normal course of business. We periodically review the financial capacity of our counterparties and, in certaincircumstances, we will seek enhanced credit protection from a counterparty.
June 30, December 31,($ thousands) 2012 2011
Bank loan $ 396,207 $ 311,960Long-term debt(1) 302,865 302,550Working capital (surplus) deficiency (261,153) 36,071
Total monetary debt $ 437,919 $ 650,581
(1) Principal amount of instruments.
At June 30, 2012, total monetary debt was $437.9 million, as compared to $650.6 million at December 31, 2011.Bank borrowings at June 30, 2012 were $396.2 million, as compared to total credit facilities of $700 million.
Our wholly-owned subsidiary, Baytex Energy Ltd. (‘‘Baytex Energy’’), has established a $40 million extendibleoperating loan facility with a chartered bank and a $660 million extendible syndicated loan facility with a syndicate ofchartered banks, each of which constitute a revolving credit facility that is extendible annually for a 1, 2 or 3 yearperiod (subject to a maximum three-year term at any time). On June 12, 2012, the maturity date of the credit facilitieswas extended by one year to June 14, 2015. The Credit Facilities contain standard commercial covenants forfacilities of this nature. Baytex Energy is in compliance with all such covenants. The credit facilities do not requireany mandatory principal payments during the three-year term. Advances (including letters of credit) under the creditfacilities can be drawn in either Canadian or U.S. funds and bear interest at the agent bank’s prime lending rate,bankers’ acceptance discount rates or London Interbank Offer Rates, plus applicable margins. The credit facilitiesare secured by a floating charge over all of Baytex Energy’s assets and are guaranteed by us and certain of ourmaterial subsidiaries. The credit facilities do not include a term-out feature or a borrowing base restriction. In theevent that Baytex Energy does not comply with the covenants under the credit facilities, our ability to pay dividendsto shareholders may be restricted. A copy of the amended and restated credit agreement (and related amendments)which establishes the credit facilities and related amendments are accessible on the SEDAR website atwww.sedar.com (filed under the category ‘‘Material Document’’ on July 22, 2011 and July 10, 2012).
The weighted average interest rate on the bank loan for six months ended June 30, 2012 was 3.50% (3.69% for yearended December 31, 2011 and 3.88% for the six months ended June 30, 2011).
On February 17, 2011, we issued US$150 million principal amount of Series B senior unsecured debentures bearinginterest at 6.75% payable semi-annually with principal repayable on February 17, 2021. Net proceeds of this issuewere used to repay a portion of the amount drawn in Canadian currency on Baytex Energy’s credit facilities. Thesedebentures are unsecured and are subordinate to Baytex Energy’s credit facilities.
On July 19, 2012, we issued $300 million of 6.625% Series C senior unsecured debentures due July 19, 2022 at par.The net proceeds from the issuance were advanced to Baytex Energy which used the funds to repay a portion of theamount drawn on its credit facilities.
Also on July 19, 2012, we called our 9.15% Series A senior unsecured debentures due August 26, 2016 ($150 millionprincipal amount) for redemption on August 26, 2012 at 104.575% of the principal amount. The payment of theredemption price will be funded by drawing upon Baytex Energy’s credit facilities.
Pursuant to various agreements with our lenders, we are restricted from paying dividends to shareholders where thedividend would or could have a material adverse effect on us or our subsidiaries’ ability to fulfill our respectiveobligations under our senior unsecured debentures and Baytex Energy’s credit facilities.
Baytex believes that funds from operations, together with the existing credit facilities, will be sufficient to financecurrent operations, dividends to the shareholders and planned capital expenditures for the ensuing year. The timingof most of the capital expenditures is discretionary and there are no material long-term capital expenditurecommitments. The level of dividend is also discretionary, and the Company has the ability to modify dividend levels
Baytex Energy Corp. Second Quarter Report 2012 21

should funds from operations be negatively impacted by factors such as reductions in commodity prices orproduction volumes.
Capital Expenditures
Capital expenditures are summarized as follows:
Three Months Ended June 30 Six Months Ended June 30
($ thousands) 2012 2011 2012 2011
Land $ 4,195 $ 2,326 $ 6,787 $ 4,551Seismic 694 45 1,542 168Drilling and completion 69,256 73,744 164,591 136,939Equipment 28,831 32,341 65,886 53,772Other (81) (3) 7 37
Total exploration and development $ 102,895 $ 108,453 $ 238,813 $ 195,467
Acquisitions – Corporate – 1,325 – 118,671Acquisitions – Properties 10,173 (185) 12,509 37,333Proceeds from divestitures (313,834) – (317,402) –
Total acquisitions and divestitures (303,661) 1,140 (304,893) 156,004
Total oil and natural gas expenditures (200,766) 109,593 (66,080) 351,471
Other plant and equipment, net 1,623 1,100 6,667 825
Total capital expenditures $ (199,143) $ 110,693 $ (59,413) $ 352,296
On May 22, 2012, Baytex Energy USA Ltd. (‘‘Baytex USA’’), an indirect, wholly-owned subsidiary, disposed of itsnon-operated interests in North Dakota, which consisted of $116.8 million of oil and gas properties and $21.6 millionof exploration and evaluation assets, for net cash proceeds of $313.8 million. Gains totaling $175.4 million wererecognized in the statements of income and comprehensive income.
The net cash proceeds from the disposition were deposited into an escrow account in accordance withSection 1031 of the United States Internal Revenue Code, which provides the ability to defer in whole or in part thepayment of federal income taxes on a gain on disposition in the event that the sale proceeds are redeployed into areplacement property which is indentified within 45 days of closing of the disposition and ultimately acquired within180 days of the closing of the disposition. As at June 30, 2012, US$312.0 million was held in the escrow account. OnJuly 16, 2012, US$112.5 million of the escrowed funds were returned to Baytex USA from the escrow account. In theevent that a replacement property is not acquired by November 18, 2012, the remaining escrowed funds will bereturned to Baytex USA.
Shareholders’ Capital
Baytex is authorized to issue an unlimited number of common shares and 10,000,000 preferred shares. Baytexestablishes the rights and terms of preferred shares upon issuance. As at August 10, 2012, the Company had120,284,524 common shares and no preferred shares issued and outstanding.
Contractual Obligations
Baytex has a number of financial obligations that are incurred in the ordinary course of business. These obligationsare of a recurring nature and impact the Company’s funds from operations on an ongoing manner. A significant
22 Baytex Energy Corp. Second Quarter Report 2012

portion of these obligations will be funded with funds from operations. These obligations as of June 30, 2012, andthe expected timing of funding of these obligations, are noted in the table below.
Less than Beyond($ thousands) Total 1 year 1-3 years 3-5 years 5 years
Trade and other payables $ 215,666 $ 215,666 $ – $ – $ –Dividends payable to shareholders 26,381 26,381 – – –Bank loan(1) 396,207 – 396,207 – –Long-term debt(2) 302,865 – – 150,000 152,865Operating leases 48,488 5,887 12,419 12,432 17,750Processing agreements 70,001 4,037 10,989 11,300 43,675Transportation agreements 68,238 1,546 9,324 17,254 40,114
Total $ 1,127,846 $ 253,517 $ 428,939 $ 190,986 $ 254,404
(1) The bank loan is a covenant-based revolving loan that is extendible annually for a one, two or three year period (subject to amaximum three-year term at any time). Unless extended, the revolving period will end on June 14, 2015 with all amounts to bere-paid on such date.
(2) Principal amount of instruments.
Baytex also has ongoing obligations related to the abandonment and reclamation of well sites and facilities whichhave reached the end of their economic lives. Programs to abandon and reclaim them are undertaken regularly inaccordance with applicable legislative requirements.
FINANCIAL INSTRUMENTS AND RISK MANAGEMENT
Baytex is exposed to a number of financial risks, including market risk, liquidity risk and credit risk. Market risk is therisk that the fair value of future cash flows will fluctuate due to movements in market prices, and is comprised offoreign currency risk, interest rate risk and commodity price risk. Market risk is managed by Baytex through a seriesof derivative contracts intended to manage the volatility of its operating cash flow. Liquidity risk is the risk that theCompany will encounter difficulty in meeting obligations associated with financial liabilities. Baytex manages itsliquidity risk through cash and debt management. Credit risk is the risk that a counterparty to a financial asset willdefault resulting in the Company incurring a loss. Baytex manages credit risk by entering into sales contracts withcreditworthy entities and reviewing its exposure to individual entities on a regular basis.
A summary of the risk management contracts in place as at June 30, 2012 and the accounting treatment of theCompany’s financial instruments are disclosed in note 15 to the consolidated financial statements.
QUARTERLY FINANCIAL INFORMATION
2012 2011 2010($ thousands, except per common shareor trust unit amounts) Q2 Q1 Q4 Q3 Q2 Q1 Q4 Q3
Gross revenues 284,248 343,355 367,813 313,787 336,899 290,315 263,497 238,276Net income 157,280 42,958 57,780 51,839 106,863 950 21,356 23,319Per common share or trust
unit – basic 1.32 0.36 0.49 0.45 0.92 0.01 0.19 0.21Per common share or trust
unit – diluted 1.30 0.36 0.48 0.44 0.90 0.01 0.18 0.20
Baytex Energy Corp. Second Quarter Report 2012 23

FORWARD-LOOKING STATEMENTS
In the interest of providing our shareholders and potential investors with information regarding Baytex, includingmanagement’s assessment of the Company’s future plans and operations, certain statements in this document are‘‘forward-looking statements’’ within the meaning of the United States Private Securities Litigation Reform Act of1995 and ‘‘forward-looking information’’ within the meaning of applicable Canadian securities legislation(collectively, ‘‘forward-looking statements’’). In some cases, forward-looking statements can be identified byterminology such as ‘‘anticipate’’, ‘‘believe’’, ‘‘continue’’, ‘‘could’’, ‘‘estimate’’, ‘‘expect’’, ‘‘forecast’’, ‘‘intend’’, ‘‘may’’,‘‘objective’’, ‘‘ongoing’’, ‘‘outlook’’, ‘‘potential’’, ‘‘project’’, ‘‘plan’’, ‘‘should’’, ‘‘target’’, ‘‘would’’, ‘‘will’’ or similar wordssuggesting future outcomes, events or performance. The forward-looking statements contained in this documentspeak only as of the date of this document and are expressly qualified by this cautionary statement.
Specifically, this document contains forward-looking statements relating to: crude oil and natural gas prices and theprice differentials between light, medium and heavy oil prices; our business strategies, plans and objectives; ourability to fund our capital expenditures and dividends on our common shares from funds from operations; thesufficiency of our capital resources to meet our on-going short, medium and long-term commitments; the financialcapacity of counterparties to honor outstanding obligations to us in the normal course of business; funding sourcesfor our cash dividends and capital program; the timing of funding our financial obligations; and the existence,operation and strategy of our risk management program. In addition, information and statements relating to reservesare deemed to be forward-looking statements, as they involve implied assessment, based on certain estimates andassumptions, that the reserves described exist in quantities predicted or estimated, and that the reserves can beprofitably produced in the future. Cash dividends on our common shares are paid at the discretion of our Board ofDirectors and can fluctuate. In establishing the level of cash dividends, the Board of Directors considers all factorsthat it deems relevant, including, without limitation, the outlook for commodity prices, our operational execution, theamount of funds from operations and capital expenditures and our prevailing financial circumstances at the time.
These forward-looking statements are based on certain key assumptions regarding, among other things: petroleumand natural gas prices and differentials between light, medium and heavy oil prices; well production rates andreserve volumes; our ability to add production and reserves through our exploration and development activities;capital expenditure levels; the receipt, in a timely manner, of regulatory and other required approvals; the availabilityand cost of labour and other industry services; the amount of future cash dividends that we intend to pay; interestand foreign exchange rates; and the continuance of existing and, in certain circumstances, proposed tax and royaltyregimes. The reader is cautioned that such assumptions, although considered reasonable by Baytex at the time ofpreparation, may prove to be incorrect.
Actual results achieved during the forecast period will vary from the information provided herein as a result ofnumerous known and unknown risks and uncertainties and other factors. Such factors include, but are not limited to:fluctuations in market prices for petroleum and natural gas; fluctuations in foreign exchange or interest rates; generaleconomic, market and business conditions; stock market volatility and market valuations; changes in income taxlaws; industry capacity; geological, technical, drilling and processing problems and other difficulties in producingpetroleum and natural gas reserves; uncertainties associated with estimating petroleum and natural gas reserves;liabilities inherent in oil and natural gas operations; competition for, among other things, capital, acquisitions ofreserves, undeveloped lands and skilled personnel; risks associated with oil and natural gas operations; changes inroyalty rates and incentive programs relating to the oil and natural gas industry; changes in environmental and otherregulations; incorrect assessments of the value of acquisitions; failure to obtain the necessary regulatory and otherapprovals on the planned timelines and other factors, many of which are beyond the control of Baytex. These riskfactors are discussed in our Annual Information Form, Annual Report on Form 40-F and Management’s Discussionand Analysis for the year ended December 31, 2011, as filed with Canadian securities regulatory authorities and theU.S. Securities and Exchange Commission.
There is no representation by Baytex that actual results achieved during the forecast period will be the same in wholeor in part as those forecast and Baytex does not undertake any obligation to update publicly or to revise any of theincluded forward-looking statements, whether as a result of new information, future events or otherwise, except asmay be required by applicable securities law.
24 Baytex Energy Corp. Second Quarter Report 2012

CONDENSED CONSOLIDATED STATEMENTSOF FINANCIAL POSITION
June 30, December 31,As at(thousands of Canadian dollars) (unaudited) 2012 2011
ASSETSCurrent assets
Cash $ 312,466 $ 7,847Trade and other receivables 189,997 206,951Crude oil inventory 737 898Financial derivatives (note 15) 33,858 10,879
537,058 226,575Non-current assets
Deferred income tax asset – 10,133Financial derivatives (note 15) 427 180Exploration and evaluation assets (note 3) 114,213 129,774Oil and gas properties (note 4) 2,013,228 2,032,160Other plant and equipment 30,321 25,233Goodwill 37,755 37,755
$ 2,733,002 $ 2,461,810
LIABILITIESCurrent liabilities
Trade and other payables $ 215,666 $ 225,831Dividends payable to shareholders 26,381 25,936Financial derivatives (note 15) 8,499 25,205
250,546 276,972Non-current liabilities
Bank loan (note 5) 396,207 311,960Long-term debt (note 6) 298,362 297,731Asset retirement obligations (note 7) 265,922 260,411Deferred income tax liability 176,011 93,217Financial derivatives (note 15) 12,949 14,785
1,399,997 1,255,076
SHAREHOLDERS’ EQUITYShareholders’ capital (note 8) 1,778,235 1,680,184Contributed surplus 69,403 85,716Accumulated other comprehensive loss (1,978) (3,546)Deficit (512,655) (555,620)
1,333,005 1,206,734
$ 2,733,002 $ 2,461,810
See accompanying notes to the condensed consolidated financial statements.
Baytex Energy Corp. Second Quarter Report 2012 25

CONDENSED CONSOLIDATED STATEMENTS OF INCOME ANDCOMPREHENSIVE INCOME
Three Months Ended Six Months EndedJune 30 June 30
(thousands of Canadian dollars,except per common share amounts) (unaudited) 2012 2011 2012 2011
Revenues, net of royalties (note 12) $ 238,228 $ 285,740 $ 528,589 $ 527,253
ExpensesExploration and evaluation 4,467 3,351 6,930 6,817Production and operating 56,967 50,189 115,254 97,665Transportation and blending 47,790 67,518 109,527 131,678General and administrative 11,137 8,689 22,325 19,819Share-based compensation (note 9) 12,345 7,354 19,201 15,336Financing costs (note 13) 11,794 12,793 22,093 23,355(Gain) loss on financial derivatives (note 15) (57,864) (41,225) (46,522) 3,658Foreign exchange loss (gain) (note 14) 6,880 (4,006) 2,012 (7,936)Gain on divestiture of oil and gas properties (note 4) (175,406) – (175,406) –Depletion and depreciation 70,581 56,469 142,892 113,113
(11,309) 161,132 218,306 403,505
Net income before income taxes 249,537 124,608 310,283 123,748
Income tax expense (note 11)Current income tax expense 16,664 – 16,664 –Deferred income tax expense 75,593 17,745 93,381 15,935
92,257 17,745 110,045 15,935
Net income attributable to shareholders $ 157,280 $ 106,863 $ 200,238 $ 107,813
Other comprehensive income (loss)Foreign currency translation adjustment 6,954 (1,650) 1,568 (6,648)
Comprehensive income $ 164,234 $ 105,213 $ 201,806 $ 101,165
Net income per common share (note 10)Basic $ 1.32 $ 0.92 $ 1.68 $ 0.94Diluted $ 1.30 $ 0.90 $ 1.66 $ 0.91
Weighted average common shares (note 10)Basic 119,387 115,596 118,975 115,006Diluted 120,991 118,481 120,839 118,116
See accompanying notes to the condensed consolidated financial statements.
26 Baytex Energy Corp. Second Quarter Report 2012

CONDENSED CONSOLIDATED STATEMENTS OF CHANGESIN EQUITY
Accumulatedother
Shareholders’ Contributed comprehensive Total(thousands of Canadian dollars) (unaudited) capital surplus income (loss) Deficit equity
Balance at December 31, 2010 $ 1,484,335 $ 129,129 $ (10,323) $ (492,005) $ 1,111,136Dividends to shareholders – – – (138,218) (138,218)Exercise of share rights 76,002 (47,522) – – 28,480Share-based compensation – 15,336 – – 15,336Issued pursuant to dividend
reinvestment plan 33,738 – – – 33,738Comprehensive income (loss) for the
period – – (6,648) 107,813 101,165
Balance at June 30, 2011 $ 1,594,075 $ 96,943 $ (16,971) $ (522,410) $ 1,151,637
Balance at December 31, 2011 $ 1,680,184 $ 85,716 $ (3,546) $ (555,620) $ 1,206,734Dividends to shareholders – – – (157,273) (157,273)Exercise of share rights 36,492 (21,428) – – 15,064Vesting of share awards 14,086 (14,086) – – –Share-based compensation – 19,201 – – 19,201Issued pursuant to dividend
reinvestment plan 47,473 – – – 47,473Comprehensive income (loss) for the
period – – 1,568 200,238 201,806
Balance at June 30, 2012 $ 1,778,235 $ 69,403 $ (1,978) $ (512,655) $ 1,333,005
See accompanying notes to the condensed consolidated financial statements.
Baytex Energy Corp. Second Quarter Report 2012 27

CONDENSED CONSOLIDATED STATEMENTS OF CASH FLOWS
Three Months Ended Six Months EndedJune 30 June 30
(thousands of Canadian dollars) (unaudited) 2012 2011 2012 2011
CASH PROVIDED BY (USED IN):
Operating activitiesNet income for the period $ 157,280 $ 106,863 $ 200,238 $ 107,813Adjustments for:
Share-based compensation (note 9) 12,345 7,354 19,201 15,336Unrealized foreign exchange loss (gain) (note 14) 8,105 (4,746) 2,112 (9,602)Exploration and evaluation 5,100 2,470 6,930 4,954Depletion and depreciation 70,581 56,469 142,892 113,113Unrealized gain on financial derivatives (note 15) (47,384) (49,602) (43,182) (3,132)Gain on divestiture of oil and gas properties (note 4) (175,406) – (175,406) –Current income tax expense on divestiture 16,664 – 16,664 –Deferred income tax expense (note 11) 75,593 17,763 93,381 15,953Financing costs (note 13) 11,794 12,793 22,093 23,355Change in non-cash working capital (note 14) (11,594) (2,206) (9,713) 186Asset retirement obligations (note 7) (377) (959) (1,148) (1,878)
122,701 146,199 274,062 266,098
Financing activitiesPayments of dividends (54,004) (51,963) (109,355) (104,020)Increase in bank loan 65,718 17,830 83,860 16,753Proceeds from issuance of long-term debt (note 6) – – – 145,810Issuance of common shares (note 8) 6,239 8,849 15,064 28,480Interest paid (3,676) (5,867) (18,228) (16,387)
14,277 (31,151) (28,659) 70,636
Investing activitiesAdditions to exploration and evaluation assets (note 3) (3,963) (1,988) (7,694) (7,444)Additions to oil and gas properties (98,932) (106,465) (231,119) (188,023)Property acquisitions (10,173) 185 (12,509) (37,333)Corporate acquisitions – (1,325) – (118,671)Proceeds from divestitures (note 4) 313,834 – 317,402 –Current income tax expense on divestiture (16,664) – (16,664) –Additions to other plant and equipment, net of disposals (1,623) (1,100) (6,667) (825)Change in non-cash working capital (note 14) (9,276) (6,513) 16,842 17,317
173,203 (117,206) 59,591 (334,979)Impact of foreign currency translation on cash balances (527) 245 (375) 304
Change in cash 309,654 (1,913) 304,619 2,059Cash, beginning of period 2,812 3,972 7,847 –
Cash, end of period $ 312,466 $ 2,059 $ 312,466 $ 2,059
See accompanying notes to the condensed consolidated financial statements.
28 Baytex Energy Corp. Second Quarter Report 2012
NOTES TO THE CONDENSED CONSOLIDATEDFINANCIAL STATEMENTSAs at June 30, 2012, December 31, 2011 and for the three months and six months ended June 30, 2012 and 2011(all tabular amounts in thousands of Canadian dollars, except per common share amounts) (unaudited)
1. REPORTING ENTITY
Baytex Energy Corp. (the ‘‘Company’’ or ‘‘Baytex’’) is an oil and gas corporation engaged in the acquisition,development and production of oil and natural gas in the Western Canadian Sedimentary Basin and theUnited States. The Company’s common shares are traded on the Toronto Stock Exchange and the New York StockExchange under the symbol BTE. The Company’s head and principal office is located at 2800, 520 - 3rd AvenueS.W., Calgary, Alberta, T2P 0R3, and its registered office is located at 2400, 525 - 8th Avenue S.W., Calgary,Alberta, T2P 1G1.
2. BASIS OF PRESENTATION
The condensed interim unaudited consolidated financial statements (‘‘consolidated financial statements’’) havebeen prepared in accordance with International Accounting Standards 34, Interim Financial Reporting, as issued bythe International Accounting Standards Board. These consolidated financial statements do not include all thenecessary annual disclosures as prescribed by International Financial Reporting Standards and should be read inconjunction with the annual audited consolidated financial statements as of December 31, 2011. The Company’saccounting policies are unchanged compared to December 31, 2011 and the use of estimates and judgments is alsoconsistent with the December 31, 2011 financial statements.
The consolidated financial statements were approved and authorized by the Board of Directors on August 13, 2012.
The consolidated financial statements have been prepared on the historical cost basis, except for derivativefinancial instruments which have been measured at fair value. The consolidated financial statements are presentedin Canadian dollars, which is the Company’s functional currency. All financial information is rounded to the nearestthousand, except per share amounts and when otherwise indicated.
3. EXPLORATION AND EVALUATION ASSETS
Cost
As at December 31, 2010 $ 113,082Capital expenditures 9,104Corporate acquisition 14,944Property acquisition 18,013Exploration and evaluation expense (10,130)Transfer to oil and gas properties (14,398)Divestitures (2,058)Foreign currency translation 1,217
As at December 31, 2011 $ 129,774
Capital expenditures 7,694Property acquisition 10,515Exploration and evaluation expense (6,930)Transfer to oil and gas properties (4,997)Divestitures (22,034)Foreign currency translation 191
As at June 30, 2012 $ 114,213
Baytex Energy Corp. Second Quarter Report 2012 29

4. OIL AND GAS PROPERTIES
Cost
As at December 31, 2010 $ 1,819,351Capital expenditures 364,578Corporate acquisition 131,635Property acquisitions 61,137Transferred from exploration and evaluation assets 14,398Change in asset retirement obligations 84,879Divestitures (10,233)Foreign currency translation 5,674
As at December 31, 2011 $ 2,471,419
Capital expenditures 231,119Property acquisitions 1,994Transferred from exploration and evaluation assets 4,997Change in asset retirement obligations 3,378Divestitures (133,050)Foreign currency translation 980
As at June 30, 2012 $ 2,580,837
Accumulated depletion
As at December 31, 2010 $ 194,722Depletion for the period 244,893Divestitures (667)Foreign currency translation 311
As at December 31, 2011 $ 439,259
Depletion for the period 141,312Divestitures (13,089)Foreign currency translation 127
As at June 30, 2012 $ 567,609
Carrying value
As at December 31, 2011 $ 2,032,160
As at June 30, 2012 $ 2,013,228
On May 22, 2012, Baytex Energy USA Ltd. (‘‘Baytex USA’’), an indirect, wholly-owned subsidiary, disposed of itsnon-operated interests in North Dakota, which consisted of $116.8 million of oil and gas properties and $21.6 millionof exploration and evaluation assets, for net cash proceeds of $313.8 million. Gains totaling $175.4 million wererecognized in the statements of income and comprehensive income.
5. BANK LOAN
June 30, December 31,As at 2012 2011
Bank loan $ 396,207 $ 311,960
Baytex Energy Ltd. (‘‘Baytex Energy’’), a wholly-owned subsidiary of Baytex, has established a $40.0 millionextendible operating loan facility with a chartered bank and a $660.0 million extendible syndicated loan facility with asyndicate of chartered banks, each of which constitute a revolving credit facility that is extendible annually for a 1, 2or 3 year period (subject to a maximum three-year term at any time). On June 12, 2012, the maturity date of the credit
30 Baytex Energy Corp. Second Quarter Report 2012

facilities was extended by one year to June 14, 2015. The credit facilities contain standard commercial covenants forfacilities of this nature and do not require any mandatory principal payments during the three-year term. Advances(including letters of credit) under the credit facilities can be drawn in either Canadian or U.S. funds and bear interestat the agent bank’s prime lending rate, bankers’ acceptance discount rates or London Interbank Offer Rates, plusapplicable margins. The credit facilities are secured by a floating charge over all of Baytex Energy’s assets and areguaranteed by Baytex and certain of its material subsidiaries. The credit facilities do not include a term-out featureor a borrowing base restriction. In the event that Baytex Energy does not comply with the covenants under the creditfacilities, Baytex’s ability to pay dividends to its shareholders may be restricted.
Financing costs for the six months ended June 30, 2012 include facility amendment fees of $0.8 million ($2.2 millionfor the six months ended June 30, 2011). The weighted average interest rate on the bank loan for six months endedJune 30, 2012 was 3.50% (3.88% for the six months ended June 30, 2011).
6. LONG-TERM DEBT
June 30, December 31,As at 2012 2011
9.15% senior unsecured debentures (Cdn$150,000 – principal) $ 147,562 $ 147,3286.75% senior unsecured debentures (US$150,000 – principal) 150,800 150,403
$ 298,362 $ 297,731
On July 19, 2012, Baytex issued $300 million of 6.625% Series C senior unsecured debentures due July 19, 2022 atpar. The net proceeds from the issuance were advanced to Baytex Energy which used the funds to repay a portion ofthe amount drawn on its credit facilities.
Also on July 19, 2012, Baytex called its 9.15% Series A senior unsecured debentures due August 26, 2016($150 million principal amount) for redemption on August 26, 2012 at 104.575% of the principal amount. Thepayment of the redemption price will be funded by drawing upon Baytex Energy’s credit facilities.
Accretion expense on debentures of $0.2 million has been recorded for the three months ended June 30, 2012 (threemonths ended June 30, 2011 – $0.1 million) and $0.3 million for the six months ended June 30, 2012 (six monthsended June 30, 2011 – $0.3 million).
7. ASSET RETIREMENT OBLIGATIONS
June 30, December 31,2012 2011
Balance, beginning of period $ 260,411 $ 169,611Liabilities incurred 3,502 5,834Liabilities settled (1,148) (10,588)Liabilities acquired – 5,003Liabilities divested (1,457) (556)Accretion 3,279 6,185Change in estimate(1) 1,333 84,879Foreign currency translation 2 43
Balance, end of period $ 265,922 $ 260,411
(1) Changes in the status of wells, changes in discount rates and changes in the estimated costs of abandonment andreclamation are factors resulting in a change in estimate.
The Company’s asset retirement obligations are based on its net ownership in wells and facilities. Managementestimates the costs to abandon and reclaim the wells and the facilities using existing technology and the estimatedtime period during which these costs will be incurred in the future. These costs are expected to be incurred over thenext 52 years. The undiscounted amount of estimated cash flow required to settle the asset retirement obligations
Baytex Energy Corp. Second Quarter Report 2012 31
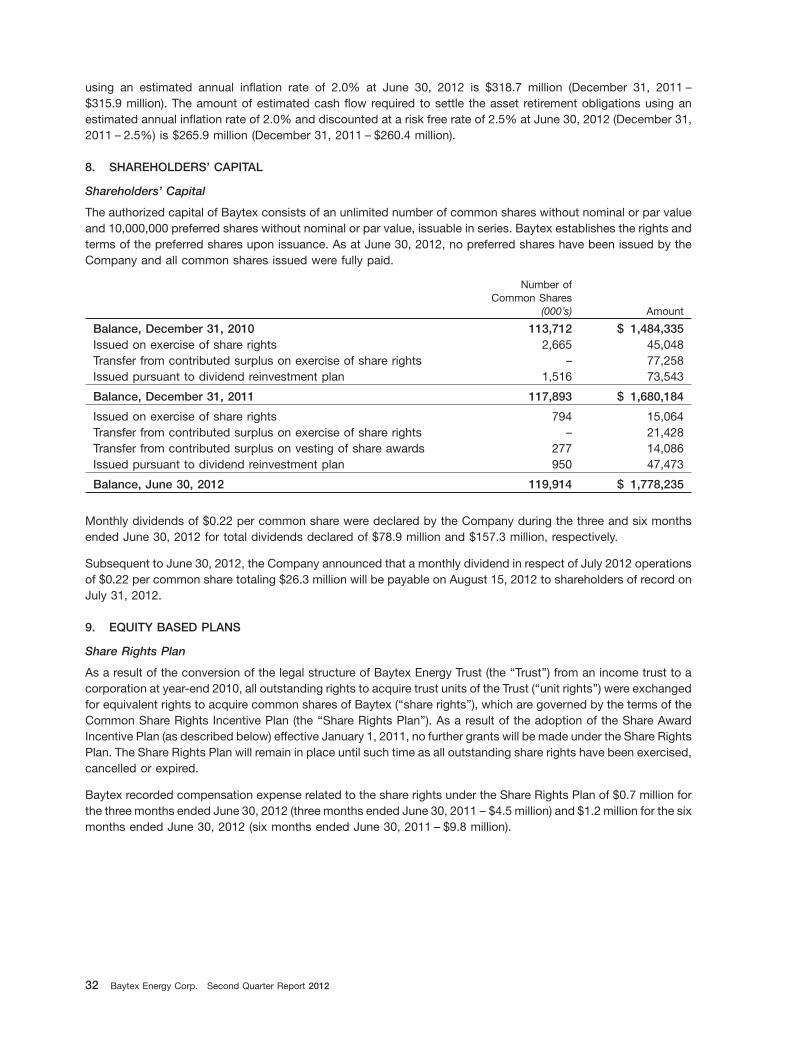
using an estimated annual inflation rate of 2.0% at June 30, 2012 is $318.7 million (December 31, 2011 –$315.9 million). The amount of estimated cash flow required to settle the asset retirement obligations using anestimated annual inflation rate of 2.0% and discounted at a risk free rate of 2.5% at June 30, 2012 (December 31,2011 – 2.5%) is $265.9 million (December 31, 2011 – $260.4 million).
8. SHAREHOLDERS’ CAPITAL
Shareholders’ Capital
The authorized capital of Baytex consists of an unlimited number of common shares without nominal or par valueand 10,000,000 preferred shares without nominal or par value, issuable in series. Baytex establishes the rights andterms of the preferred shares upon issuance. As at June 30, 2012, no preferred shares have been issued by theCompany and all common shares issued were fully paid.
Number ofCommon Shares
(000’s) Amount
Balance, December 31, 2010 113,712 $ 1,484,335Issued on exercise of share rights 2,665 45,048Transfer from contributed surplus on exercise of share rights – 77,258Issued pursuant to dividend reinvestment plan 1,516 73,543
Balance, December 31, 2011 117,893 $ 1,680,184
Issued on exercise of share rights 794 15,064Transfer from contributed surplus on exercise of share rights – 21,428Transfer from contributed surplus on vesting of share awards 277 14,086Issued pursuant to dividend reinvestment plan 950 47,473
Balance, June 30, 2012 119,914 $ 1,778,235
Monthly dividends of $0.22 per common share were declared by the Company during the three and six monthsended June 30, 2012 for total dividends declared of $78.9 million and $157.3 million, respectively.
Subsequent to June 30, 2012, the Company announced that a monthly dividend in respect of July 2012 operationsof $0.22 per common share totaling $26.3 million will be payable on August 15, 2012 to shareholders of record onJuly 31, 2012.
9. EQUITY BASED PLANS
Share Rights Plan
As a result of the conversion of the legal structure of Baytex Energy Trust (the ‘‘Trust’’) from an income trust to acorporation at year-end 2010, all outstanding rights to acquire trust units of the Trust (‘‘unit rights’’) were exchangedfor equivalent rights to acquire common shares of Baytex (‘‘share rights’’), which are governed by the terms of theCommon Share Rights Incentive Plan (the ‘‘Share Rights Plan’’). As a result of the adoption of the Share AwardIncentive Plan (as described below) effective January 1, 2011, no further grants will be made under the Share RightsPlan. The Share Rights Plan will remain in place until such time as all outstanding share rights have been exercised,cancelled or expired.
Baytex recorded compensation expense related to the share rights under the Share Rights Plan of $0.7 million forthe three months ended June 30, 2012 (three months ended June 30, 2011 – $4.5 million) and $1.2 million for the sixmonths ended June 30, 2012 (six months ended June 30, 2011 – $9.8 million).
32 Baytex Energy Corp. Second Quarter Report 2012

The number of share rights outstanding and exercise prices are detailed below:
Number ofshare rights Weighted average
(000’s) exercise price
Balance, December 31, 2010(1) 5,761 $ 17.02Exercised(2) (2,665) 16.92Forfeited(1) (125) 23.05
Balance, December 31, 2011(1) 2,971 $ 16.98
Exercised(2) (794) 19.04Forfeited(1) (78) 21.12
Balance, June 30, 2012(1) 2,099 $ 16.22
(1) Weighted average exercise price reflects the grant price less the reduction in exercise price.(2) Weighted average exercise price includes rights exercised at both original grant prices and original grant prices reduced for
dividends and distributions subsequent to grant date.
The following table summarizes information about the share rights outstanding at June 30, 2012:
Exercise Prices Applying Original Grant Price Reduced forExercise Prices Applying Original Grant Price Dividends and Distributions Subsequent to Grant Date
Number Weighted Number Number Weighted NumberOutstanding at Weighted Average Exercisable at Weighted Outstanding at Weighted Average Exercisable at Weighted
June 30, Average Remaining June 30, Average June 30, Average Remaining June 30, Average2012 Grant Term 2012 Exercise 2012 Exercise Term 2012 Exercise
PRICE RANGE (000’s) Price (years) (000’s) Price (000’s) Price (years) (000’s) Price
$5.34 to $12.50 5 $ 12.46 1.7 5 $ 12.46 949 $ 9.63 1.0 949 $ 9.63$12.51 to $19.50 663 17.97 1.3 663 17.97 221 16.87 1.7 162 17.28$19.51 to $26.50 495 20.36 0.8 431 20.08 812 21.76 2.4 477 21.71$26.51 to $33.50 894 27.93 2.4 532 27.90 100 29.02 2.7 48 28.40$33.51 to $40.50 39 35.71 3.1 11 35.06 16 34.81 3.1 7 34.61$40.51 to $47.72 3 45.02 3.4 1 45.19 1 43.95 3.5 – 43.95
$5.34 to $47.72 2,099 $ 23.12 1.7 1,643 $ 21.85 2,099 $ 16.22 1.7 1,643 $ 14.55
Share Award Incentive Plan
The Company has a full-value award plan (the ‘‘Share Award Incentive Plan’’) pursuant to which restricted awardsand performance awards (collectively, ‘‘share awards’’) may be granted to the directors, officers and employees ofthe Company and its subsidiaries. The maximum number of common shares issuable under the Share AwardIncentive Plan (and any other long-term incentive plan of the Company, including the Share Rights Plan) shall not atany time exceed 10% of the then issued and outstanding common shares.
The Company recorded compensation expense related to the share awards of $11.6 million for the three monthsended June 30, 2012 (three months ended June 30, 2011 – $2.9 million) and $18.0 million for the six months endedJune 30, 2012 (six months ended June 30, 2011 – $5.6 million).
The fair value of share awards is determined at the date of grant using the closing price of the common shares and,for performance awards, an estimated payout multiplier. The amount of compensation expense is reduced by anestimated forfeiture rate, which has been estimated at 4.6% of outstanding share awards. Fluctuations incompensation expense may occur due to changes in estimating the outcome of the performance conditions. Theestimated weighted average fair value for share awards at the measurement date is $56.04 per restricted award andperformance award granted during the six months ended June 30, 2012 (six months ended June 30, 2011 – $48.76per restricted award and performance award).
Baytex Energy Corp. Second Quarter Report 2012 33

The number of share awards outstanding is detailed below:
Number of Number of Number ofrestricted performance share
awards awards awards(000’s) (000’s) (000’s)
Balance, December 31, 2010 – – –Granted 389 243 632Forfeited (24) (14) (38)
Balance, December 31, 2011 365 229 594
Granted 183 147 330Vested and converted to common shares (72) (99) (171)Forfeited (33) (21) (54)
Balance, June 30, 2012 443 256 699
10. NET INCOME PER SHARE
Baytex calculates basic income per share based on the net income attributable to shareholders and a weightedaverage number of shares outstanding during the period. Diluted income per share amounts reflect the potentialdilution that could occur if share rights were exercised and share awards were converted. The treasury stockmethod is used to determine the dilutive effect of share rights and share awards whereby any proceeds from theexercise of share rights and the conversion of share awards or other dilutive instruments and the amount ofcompensation expense, if any, attributed to future services not yet recognized are assumed to be used to purchasecommon shares at the average market price during the periods.
Three Months Ended June 30, 2012 Three Months Ended June 30, 2011
Common Net Common NetShares income Shares income
Net income (000’s) per share Net income (000’s) per share
Net income – basic $157,280 119,387 $ 1.32 $106,863 115,596 $ 0.92Dilutive effect of share rights – 1,152 – 2,740Dilutive effect of share awards – 452 – 145
Net income – diluted $157,280 120,991 $ 1.30 $106,863 118,481 $ 0.90
For the three months ended June 30, 2012, and 2011, no share rights were anti-dilutive.
Six Months Ended June 30, 2012 Six Months Ended June 30, 2011
Common Net Common NetShares income Shares income
Net income (000’s) per share Net income (000’s) per share
Net income – basic $200,238 118,975 $ 1.68 $107,813 115,006 $ 0.94Dilutive effect of share rights – 1,325 – 2,987Dilutive effect of share awards – 539 – 123
Net income – diluted $200,238 120,839 $ 1.66 $107,813 118,116 $ 0.91
For the six months ended June 30, 2012, and 2011, no share rights were anti-dilutive.
34 Baytex Energy Corp. Second Quarter Report 2012

11. INCOME TAXES
The provision for (recovery of) income taxes has been computed as follows:
Six months ended June 30
2012 2011
Net income before income taxes $ 310,283 $ 123,748Expected income taxes at the statutory rate of 25.45% (2011 – 26.97%)(1) 78,967 33,375Increase (decrease) in income taxes resulting from:
Non-taxable portion of foreign exchange loss (gain) 88 (1,191)Share-based compensation 4,886 4,137Effect of change in income tax rates (243) (6,749)Effect of rate adjustments for foreign jurisdictions 22,573 (1,672)Effect of change in opening tax pool balances – (10,395)Other 3,774 (1,570)
Income tax expense $ 110,045 $ 15,935
(1) The change in statutory rate is related to a legislated reduction in the Canadian federal corporate income tax rate and changesin the provincial apportionment of income.
12. REVENUES
Three Months Ended June 30 Six Months Ended June 30
2012 2011 2012 2011
Petroleum and natural gas revenues $ 284,632 $ 335,811 $ 625,787 $ 625,603Royalty charges (46,020) (51,159) (99,014) (99,961)Royalty income (384) 1,088 1,816 1,611
Revenues, net of royalties $ 238,228 $ 285,740 $ 528,589 $ 527,253
13. FINANCING COSTS
Baytex incurred financing costs on its outstanding liabilities as follows:
Three Months Ended June 30 Six Months Ended June 30
2012 2011 2012 2011
Bank loan and other $ 3,144 $ 3,086 $ 5,684 $ 6,807Long-term debt 6,168 6,008 12,281 10,704Accretion on asset retirement obligations 1,652 1,516 3,279 3,000Debt financing costs 830 2,183 849 2,844
Financing costs $ 11,794 $ 12,793 $ 22,093 $ 23,355
Baytex Energy Corp. Second Quarter Report 2012 35

14. SUPPLEMENTAL INFORMATION
Change in Non-Cash Working Capital Items
Three Months Ended June 30 Six Months Ended June 30
2012 2011 2012 2011
Trade and other receivables $ (9,407) $ (12,484) $ 16,954 $ (39,951)Crude oil inventory (169) – 161 1,802Trade and other payables (12,447) 4,590 (10,432) 56,208Foreign exchange 1,153 (825) 446 (556)
$ (20,870) $ (8,719) $ 7,129 $ 17,503
Changes in non-cash working capitalrelated to:
Operating activities $ (11,594) $ (2,206) $ (9,713) $ 186Investing activities (9,276) (6,513) 16,842 17,317
$ (20,870) $ (8,719) $ 7,129 $ 17,503
Foreign Exchange
Three Months Ended June 30 Six Months Ended June 30
2012 2011 2012 2011
Unrealized foreign exchange loss (gain) $ 8,105 $ (4,746) $ 2,112 $ (9,602)Realized foreign exchange (gain) loss (1,225) 740 (100) 1,666
Foreign exchange loss (gain) $ 6,880 $ (4,006) $ 2,012 $ (7,936)
15. FINANCIAL INSTRUMENTS AND RISK MANAGEMENT
The Company’s financial assets and liabilities are comprised of cash, trade and other receivables, trade and otherpayables, dividends payable to shareholders, bank loan, financial derivatives and long-term debt.
Categories of Financial Instruments
The estimated fair values of the financial instruments have been determined based on the Company’s assessmentof available market information. These estimates may not necessarily be indicative of the amounts that could berealized or settled in a market transaction. The fair values of financial instruments, other than bank loan andlong-term debt, are equal to their carrying amounts due to the short-term maturity of these instruments. The fairvalue of the bank loan approximates its carrying value as it is at a market rate of interest. The fair value of thelong-term debt is based on the trading value of the debentures.
Fair Value of Financial Instruments
Baytex classifies the fair value of financial instruments according to the following hierarchy based on the amount ofobservable inputs used to value the instruments:
• Level 1: Values based on unadjusted quoted prices in active markets that are accessible at themeasurement date for identical assets or liabilities.
• Level 2: Values based on quoted prices in markets that are not active or model inputs that are observableeither directly or indirectly for substantially the full term of the asset or liability.
• Level 3: Values based on prices or valuation techniques that require inputs that are both unobservable andsignificant to the overall fair value measurement.
36 Baytex Energy Corp. Second Quarter Report 2012

The carrying value and fair value of the Company’s financial instruments carried on the condensed consolidatedstatements of financial position are classified into the following categories:
June 30, 2012 December 31, 2011
Fair ValueCarrying Carrying Measurement
As at Value Fair Value Value Fair Value Hierarchy
Financial Assets
FVTPL(1)
Cash $ 312,466 $ 312,466 $ 7,847 $ 7,847 Level 1Derivatives 34,285 34,285 11,059 11,059 Level 2
Total FVTPL(1) $ 346,751 $ 346,751 $ 18,906 $ 18,906
Loans and receivablesTrade and other receivables $ 189,997 $ 189,997 $ 206,951 $ 206,951 –
Total loans and receivables $ 189,997 $ 189,997 $ 206,951 $ 206,951
Financial Liabilities
FVTPL(1)
Derivatives $ (21,448) $ (21,448) $ (39,990) $ (39,990) Level 2
Total FVTPL(1) $ (21,448) $ (21,448) $ (39,990) $ (39,990)
Other financial liabilitiesTrade and other payables $ (215,666) $ (215,666) $ (225,831) $ (225,831) –Dividends payable to shareholders (26,381) (26,381) (25,936) (25,936) –Bank loan (396,207) (396,207) (311,960) (311,960) –Long-term debt (298,362) (315,290) (297,731) (314,201) –
Total other financial liabilities $ (936,616) $ (953,544) $ (861,458) $ (877,928)
(1) FVTPL means fair value through profit or loss.
There were no transfers between Level 1 and 2 in the period.
Financial Risk
Baytex is exposed to a variety of financial risks, including market risk, liquidity risk and credit risk. The Companymonitors and, when appropriate, utilizes derivative contracts to manage its exposure to these risks. The Companydoes not enter into derivative contracts for speculative purposes.
Market Risk
Market risk is the risk that the fair value or future cash flows of financial assets or liabilities will fluctuate due tomovements in market prices. Market risk is comprised of foreign currency risk, interest rate risk and commodityprice risk.
Foreign Currency Risk
Baytex is exposed to fluctuations in foreign currency as a result of the U.S. dollar portion of its bank loan, its Series Bsenior unsecured debentures, crude oil sales based on U.S. dollar indices and commodity contracts that are settledin U.S. dollars. The Company’s net income and cash flow will therefore be impacted by fluctuations in foreignexchange rates.
To manage the impact of currency exchange rate fluctuations, the Company may enter into agreements to fix theCanada – U.S. exchange rate.
Baytex Energy Corp. Second Quarter Report 2012 37

At June 30, 2012, the Company had in place the following currency derivative contracts:
AmountType Period per month Sales Price Reference
Monthly forward spot sale January 2011 to August 2012 US$1.00 million 1.0565 (1)Monthly forward spot sale January 2011 to September 2012 US$1.50 million 1.0553 (1)Monthly forward spot sale November 2011 to October 2013 US$1.00 million 1.0433 (1)Monthly average rate forward Calendar 2012 US$1.25 million 1.0209 (2)Monthly spot collar Calendar 2012 US$0.75 million 0.9524 - 1.0503 (1)Monthly spot collar Calendar 2012 US$0.25 million 1.0200 - 1.0700 (1)Monthly average collar Calendar 2012 US$0.25 million 0.9700 - 1.0310 (1)Monthly average collar Calendar 2012 US$0.50 million 0.9750 - 1.0305 (1)Monthly average collar Calendar 2012 US$0.50 million 0.9900 - 1.0805 (2)Monthly average collar Calendar 2012 US$0.75 million 1.0225 - 1.0425 (1)Monthly average collar Calendar 2012 US$0.25 million 1.0295 - 1.0545 (1)Monthly forward spot sale Calendar 2013 US$4.50 million 1.0007 (2)Monthly average rate forward Calendar 2013 US$0.25 million 1.0023 (1)Monthly average collar Calendar 2013 US$0.25 million 0.9700 - 1.0310 (1)Monthly spot collar Calendar 2012 US$1.00 million 0.9800 - 1.0722 (1)Monthly spot collar Calendar 2012 US$1.00 million 0.9900 - 1.0720 (1)Monthly spot collar Calendar 2012 US$0.50 million 0.9900 - 1.0785 (1)Monthly forward spot sale April 2012 to December 2012 US$3.00 million 0.9963 (1)Monthly spot collar June 2012 to December 2012 US$1.00 million 0.9800 - 1.0720 (1)Monthly average collar June 2012 to December 2013 US$1.00 million 1.0000 - 1.0725 (1)Monthly average collar June 2012 to December 2013 US$1.00 million 1.0100 - 1.0720 (1)Monthly average collar June 2012 to December 2013 US$1.00 million 1.0200 - 1.0575 (1)Monthly average collar June 2012 to December 2013 US$1.00 million 1.0200 - 1.0655 (1)Monthly average collar June 2012 to December 2013 US$1.00 million 1.0250 - 1.0702 (1)Monthly average collar June 2012 to December 2013 US$2.00 million 1.0300 - 1.0650 (1)Monthly forward spot sale July 2012 to December 2012 US$2.50 million 1.0173 (2)
(1) Actual contract rate (CAD/USD).(2) Based on the weighted average contract rates (CAD/USD).
The following table demonstrates the effect of exchange rate movements on net income due to changes in the fairvalue of risk management contracts in place at June 30, 2012 as well as the unrealized gain or loss on revaluation ofoutstanding U.S. dollar denominated debt. The sensitivity is based on a $0.01 increase and decrease in theCAD/USD foreign exchange rate and excludes the impact on revenue proceeds.
$0.01 Increase in $0.01 Decrease inCAD/USD CAD/USD
Sensitivity of Foreign Exchange Exposure: Exchange rate Exchange Rate
Loss (gain) on currency derivative contracts $ 2,353 $ (2,415)Loss (gain) on other monetary assets/liabilities (575) 575
Net income decrease (increase) $ 1,778 $ (1,840)
The carrying amounts of the Company’s U.S. dollar denominated monetary assets and liabilities at the reportingdate are as follows:
Assets Liabilities
June 30, December 31, June 30, December 31,2012 2011 2012 2011
U.S. dollar denominated US$461,292 US$107,138 US$403,952 US$402,979
38 Baytex Energy Corp. Second Quarter Report 2012
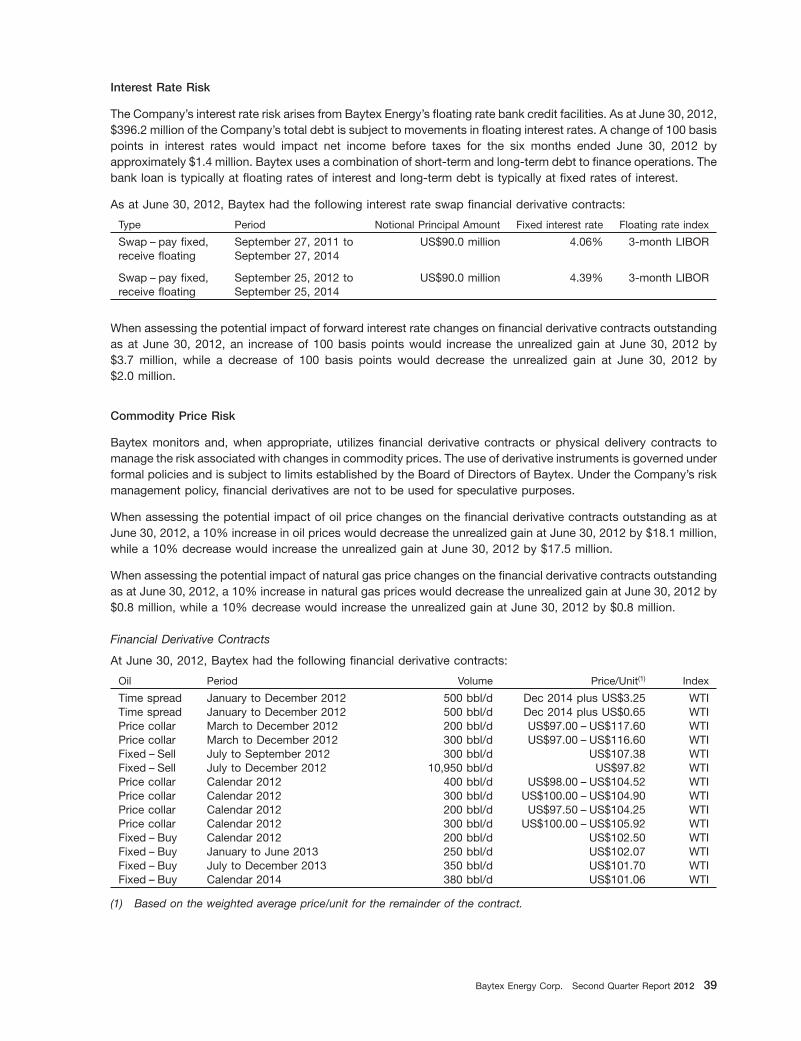
Interest Rate Risk
The Company’s interest rate risk arises from Baytex Energy’s floating rate bank credit facilities. As at June 30, 2012,$396.2 million of the Company’s total debt is subject to movements in floating interest rates. A change of 100 basispoints in interest rates would impact net income before taxes for the six months ended June 30, 2012 byapproximately $1.4 million. Baytex uses a combination of short-term and long-term debt to finance operations. Thebank loan is typically at floating rates of interest and long-term debt is typically at fixed rates of interest.
As at June 30, 2012, Baytex had the following interest rate swap financial derivative contracts:
Type Period Notional Principal Amount Fixed interest rate Floating rate index
Swap – pay fixed, September 27, 2011 to US$90.0 million 4.06% 3-month LIBORreceive floating September 27, 2014
Swap – pay fixed, September 25, 2012 to US$90.0 million 4.39% 3-month LIBORreceive floating September 25, 2014
When assessing the potential impact of forward interest rate changes on financial derivative contracts outstandingas at June 30, 2012, an increase of 100 basis points would increase the unrealized gain at June 30, 2012 by$3.7 million, while a decrease of 100 basis points would decrease the unrealized gain at June 30, 2012 by$2.0 million.
Commodity Price Risk
Baytex monitors and, when appropriate, utilizes financial derivative contracts or physical delivery contracts tomanage the risk associated with changes in commodity prices. The use of derivative instruments is governed underformal policies and is subject to limits established by the Board of Directors of Baytex. Under the Company’s riskmanagement policy, financial derivatives are not to be used for speculative purposes.
When assessing the potential impact of oil price changes on the financial derivative contracts outstanding as atJune 30, 2012, a 10% increase in oil prices would decrease the unrealized gain at June 30, 2012 by $18.1 million,while a 10% decrease would increase the unrealized gain at June 30, 2012 by $17.5 million.
When assessing the potential impact of natural gas price changes on the financial derivative contracts outstandingas at June 30, 2012, a 10% increase in natural gas prices would decrease the unrealized gain at June 30, 2012 by$0.8 million, while a 10% decrease would increase the unrealized gain at June 30, 2012 by $0.8 million.
Financial Derivative Contracts
At June 30, 2012, Baytex had the following financial derivative contracts:
Oil Period Volume Price/Unit(1) Index
Time spread January to December 2012 500 bbl/d Dec 2014 plus US$3.25 WTITime spread January to December 2012 500 bbl/d Dec 2014 plus US$0.65 WTIPrice collar March to December 2012 200 bbl/d US$97.00 – US$117.60 WTIPrice collar March to December 2012 300 bbl/d US$97.00 – US$116.60 WTIFixed – Sell July to September 2012 300 bbl/d US$107.38 WTIFixed – Sell July to December 2012 10,950 bbl/d US$97.82 WTIPrice collar Calendar 2012 400 bbl/d US$98.00 – US$104.52 WTIPrice collar Calendar 2012 300 bbl/d US$100.00 – US$104.90 WTIPrice collar Calendar 2012 200 bbl/d US$97.50 – US$104.25 WTIPrice collar Calendar 2012 300 bbl/d US$100.00 – US$105.92 WTIFixed – Buy Calendar 2012 200 bbl/d US$102.50 WTIFixed – Buy January to June 2013 250 bbl/d US$102.07 WTIFixed – Buy July to December 2013 350 bbl/d US$101.70 WTIFixed – Buy Calendar 2014 380 bbl/d US$101.06 WTI
(1) Based on the weighted average price/unit for the remainder of the contract.
Baytex Energy Corp. Second Quarter Report 2012 39

Natural Gas Period Volume Price/Unit(1) Index
Basis swap Calendar 2012 1,000 mmBtu/d NYMEX less US$0.328 AECOBasis swap Calendar 2012 1,000 mmBtu/d NYMEX less US$0.390 AECOBasis swap Calendar 2012 1,000 mmBtu/d NYMEX less US$0.370 AECOBasis swap Calendar 2012 1,000 mmBtu/d NYMEX less US$0.450 AECOBasis swap Calendar 2012 1,000 mmBtu/d NYMEX less US$0.430 AECOBasis swap Calendar 2012 1,000 mmBtu/d NYMEX less US$0.410 AECOBasis swap Calendar 2012 1,500 mmBtu/d NYMEX less US$0.490 AECOBasis swap Calendar 2012 1,000 mmBtu/d NYMEX less US$0.515 AECOBasis swap Calendar 2012 2,000 mmBtu/d NYMEX less US$0.520 AECOBasis swap Calendar 2012 2,500 mmBtu/d NYMEX less US$0.530 AECOSold call Calendar 2012 6,000 mmBtu/d US$5.25 NYMEXFixed – Sell July to December 2012 13,000 mmBtu/d US$4.04 NYMEX
(1) Based on the weighted average price/unit for the remainder of the contract.
Financial derivatives are marked-to-market at the end of each reporting period, with the following reflected in thecondensed consolidated statements of income and comprehensive income:
Three Months Ended June 30 Six Months Ended June 30
2012 2011 2012 2011
Realized (gain) loss on financial derivatives $ (10,480) $ 8,377 $ (3,340) $ 6,790Unrealized gain on financial derivatives (47,384) (49,602) (43,182) (3,132)
(Gain) loss on financial derivatives $ (57,864) $ (41,225) $ (46,522) $ 3,658
Subsequent to June 30, 2012, Baytex added the following financial derivative contracts:
Oil Period Volume Price/Unit(1) Index
Fixed – Sell August to December 2012(2) 1,000 bbl/d US$92.52 WTIFixed – Sell Calendar 2013 1,500 bbl/d US$96.00 WTIFixed – Sell Calendar 2013(2) 1,000 bbl/d US$98.00 WTIFixed – Sell Calendar 2013(2) 1,000 bbl/d US$96.10 WTI
(1) Based on the weighted average price/unit for the remainder of the contract.(2) Counterparty has the option to increase the volumes on the contract to 2,000 bbl/d.
Physical Delivery Contracts
At June 30, 2012, the following physical delivery contracts were entered into and continue to be held for the purposeof delivery of non-financial items in accordance with the Company’s expected sale requirements. Physical deliverycontracts are not considered financial instruments; therefore, no asset or liability has been recognized in theconsolidated financial statements.
Heavy Oil Period Volume Weighted Average Price/Unit(1)
WCS Blend October 2011 to December 2014 2,000 bbl/d WTI � 81.00%WCS Blend July to September 2012 500 bbl/d WTI less US$15.00WCS Blend October to December 2012 500 bbl/d WTI less US$18.00WCS Blend Calendar 2012 4,000 bbl/d WTI less US$18.13WCS Blend January to June 2013 1,250 bbl/d WTI � 80.00%WCS Blend January to June 2013 4,250 bbl/d WTI less US$18.18WCS Blend July to December 2013 2,750 bbl/d WTI � 80.00%WCS Blend July to December 2013 2,750 bbl/d WTI less US$21.00WCS Blend April to December 2012 2,600 bbl/d WTI less US$18.00WCS Blend June 2012 to March 2013 2,600 bbl/d WTI less US$18.00WCS Blend June to December 2012 1,000 bbl/d WTI less US$18.15WCS Blend January 2013 to June 2014 3,000 bbl/d WTI less US$18.00
(1) Based on the weighted average price/unit for the remainder of the contract.
40 Baytex Energy Corp. Second Quarter Report 2012
Condensate(diluent) Period Volume Price/Unit
Fixed – Buy April 2012 to March 2013 640 bbl/d WTI plus US$6.70Fixed – Buy April 2012 to December 2012 120 bbl/d WTI plus US$5.61Fixed – Buy June 2012 to March 2013 120 bbl/d WTI plus US$8.00Fixed – Buy January 2013 to December 2013 160 bbl/d WTI plus US$3.00
Liquidity Risk
Liquidity risk is the risk that Baytex will encounter difficulty in meeting obligations associated with financial liabilities.Baytex manages its liquidity risk through cash and debt management. Such strategies include continuouslymonitoring forecasted and actual cash flows from operating, financing and investing activities, available credit underexisting banking arrangements and opportunities to issue additional common shares. As at June 30, 2012, Baytexhad available unused bank credit facilities in the amount of $303.0 million.
The timing of cash outflows (excluding interest) relating to financial liabilities is outlined in the table below:
Less than Beyond 5Total 1 year 1-3 years 3-5 years years
Trade and other payables $ 215,666 $ 215,666 $ – $ – $ –Dividends payable to shareholders 26,381 26,381 – – –Bank loan(1) 396,207 – 396,207 – –Long-term debt(2) 302,865 – – 150,000 152,865
$ 941,119 $ 242,047 $ 396,207 $ 150,000 $ 152,865
(1) The bank loan is a covenant-based revolving loan that is extendible annually, for a one, two or three year period (subjectto a maximum three-year term at any time). Unless extended, the revolving period will end on June 14, 2015 with allamounts to be re-paid on such date.
(2) Principal amount of instruments.
Credit Risk
Credit risk is the risk that a counterparty to a financial asset will default resulting in Baytex incurring a loss. Most ofthe Company’s trade and other receivables relate to petroleum and natural gas sales and are exposed to typicalindustry credit risks. Baytex reviews its exposure to individual entities on a regular basis and manages its credit riskby entering into sales contracts with only creditworthy entities. Letters of credit and/or parental guarantees may beobtained prior to the commencement of business with certain counterparties. Credit risk may also arise fromfinancial derivative instruments. The maximum exposure to credit risk is equal to the carrying value of the financialassets. The Company considers that all financial assets that are not impaired or past due for each of the reportingdates under review are of good credit quality. None of the Company’s financial assets are secured by collateral.
Should Baytex determine that the ultimate collection of a receivable is in doubt based on the processes formanaging credit risk, the carrying amount of accounts receivable is reduced through the use of an allowance fordoubtful accounts and the amount of the loss is recognized in net income. If the Company subsequently determinesthat an account is uncollectible, the account is written-off with a corresponding change to allowance for doubtfulaccounts.
16. CONSOLIDATING FINANCIAL INFORMATION – BASE SHELF PROSPECTUS
On August 4, 2011, Baytex filed a Short Form Base Shelf Prospectus with the securities regulatory authorities ineach of the provinces of Canada (other than Quebec) and a Registration Statement with the United States Securitiesand Exchange Commission (collectively, the ‘‘Shelf Prospectus’’). The Shelf Prospectus allows Baytex to offer andissue common shares, subscription receipts, warrants, options and debt securities by way of one or moreprospectus supplements at any time during the 25-month period that the Shelf Prospectus remains in place. Thesecurities may be issued from time to time, at the discretion of Baytex, with an aggregate offering amount not toexceed $500 million (Canadian).
Baytex Energy Corp. Second Quarter Report 2012 41

On July 22, 2012, Baytex issued $300 million in 10 year Series C senior unsecured debentures at par bearing acoupon rate of 6.625%. The offering was made by way of a prospectus supplement dated July 10, 2012 to Baytex’sShort Form Base Prospectus dated August 4, 2011.
Any debt securities issued by Baytex pursuant to the Shelf Prospectus will be guaranteed by all of its direct andindirect wholly-owned material subsidiaries (the ‘‘Guarantor Subsidiaries’’). The guarantees of the GuarantorSubsidiaries are full and unconditional and joint and several. These guarantees may in turn be guaranteed byBaytex. Other than investments in its subsidiaries, Baytex has no independent assets or operations.
Pursuant to the credit agreement governing Baytex Energy’s credit facilities, Baytex Energy and its subsidiaries areprohibited from paying dividends to their shareholders that would have, or would reasonably be expected to have, amaterial adverse effect or would adversely affect or impair the ability or capacity of Baytex Energy to pay or fulfill anyof its obligations under the credit agreement. In addition, Baytex Energy may not permit any of its subsidiaries to payany dividends during the continuance of a default or event of default under the credit agreement.
The following tables present condensed interim unaudited consolidating financial information as at June 30, 2012,and December 31, 2011 and for the three months and six months ended June 30, 2012 and 2011 for: 1) Baytex, on astand-alone basis, 2) Guarantor subsidiaries, on a stand-alone basis, 3) non-guarantor subsidiaries, on a stand-alone basis and 4) Baytex, on a consolidated basis.
Guarantor Non-guarantor Consolidation Total(thousands of Canadian dollars) Baytex Subsidiaries Subsidiaries Adjustments Consolidated
As at June 30, 2012Current assets $ – $ 536,897 $ 161 $ – $ 537,058Intercompany advances and
investments 1,693,808 (465,524) 77,294 (1,305,578) –Non-current assets 2,435 2,193,509 – – 2,195,944Current liabilities 34,955 215,483 108 – 250,546Bank loan and long-term debt 298,362 396,207 – – 694,569Asset retirement obligation and
other non-current liabilities $ – $ 454,882 $ – $ – $ 454,882
As at December 31, 2011Current assets $ 351 $ 225,850 $ 374 $ – $ 226,575Intercompany advances and
investments 1,753,047 (515,492) 72,787 (1,310,342) –Non-current assets 2,435 2,232,800 – – 2,235,235Current liabilities 34,502 242,303 167 – 276,972Bank loan and long-term debt 297,731 311,960 – – 609,691Asset retirement obligation and
other non-current liabilities $ – $ 368,413 $ – $ – $ 368,413
For the six months endedJune 30, 2012
Revenues, net of royalties $ 11,708 $ 529,215 $ 8,324 $ (20,658) $ 528,589Production, operation and
exploration – 122,184 – – 122,184Transportation and blending – 109,527 – – 109,527General, administrative and share-
based compensation 626 41,400 126 (626) 41,526Financing, derivatives, foreign
exchange and othergains/losses 12,533 (190,327) 3 (20,032) (197,823)
Depletion and depreciation – 142,892 – – 142,892Income tax expense – 110,045 – – 110,045
Net income (loss) $ (1,451) $ 193,494 $ 8,195 $ – $ 200,238
42 Baytex Energy Corp. Second Quarter Report 2012

Guarantor Non-guarantor Consolidation Total(thousands of Canadian dollars) Baytex Subsidiaries Subsidiaries Adjustments Consolidated
For the three months endedJune 30, 2012
Revenues, net of royalties $ 5,875 $ 238,479 $ 4,418 $ (10,544) $ 238,228Production, operation and
exploration – 61,434 – – 61,434Transportation and blending – 47,790 – – 47,790General, administrative and
unit-based compensation 251 23,454 28 (251) 23,482Financing, derivatives, foreign
exchange and othergains/losses 9,155 (213,458) – (10,293) (214,596)
Depletion and depreciation – 70,581 – – 70,581Income tax expense – 92,257 – – 92,257
Net income (loss) $ (3,531) $ 156,421 $ 4,390 $ – $ 157,280
For the six months endedJune 30, 2011
Revenues, net of royalties $ 10,181 $ 527,253 $ 3,733 $ (13,914) $ 527,253Production, operation and
exploration – 104,482 – – 104,482Transportation and blending – 131,678 – – 131,678General, administrative and
share-based compensation 769 35,020 116 (750) 35,155Financing, derivatives, foreign
exchange and othergains/losses 7,373 24,906 (38) (13,164) 19,077
Depletion and depreciation – 113,113 – – 113,113Income tax expense 64 15,871 – – 15,935
Net income (loss) $ 1,975 $ 102,183 $ 3,655 $ – $ 107,813
For the three months endedJune 30, 2011
Revenues, net of royalties $ 5,749 $ 285,740 $ 1,917 $ (7,667) $ 285,740Production, operation and
exploration – 53,540 – – 53,540Transportation and blending – 67,518 – – 67,518General, administrative and
unit-based compensation 374 15,991 53 (375) 16,043Financing, derivatives, foreign
exchange and othergains/losses 2,677 (27,823) – (7,292) (32,438)
Depletion and depreciation – 56,469 – – 56,469Income tax expense 64 17,681 – – 17,745
Net income (loss) $ 2,634 $ 102,364 $ 1,865 $ – $ 106,863
Baytex Energy Corp. Second Quarter Report 2012 43

Guarantor Non-guarantor Consolidation Total(thousands of Canadian dollars) Baytex Subsidiaries Subsidiaries Adjustments Consolidated
For the six months endedJune 30, 2012
Cash provided by (used in):Operating activities $ 11,396 $ 251,897 $ 10,769 $ – $ 274,062Payment of dividends (109,355) – – – (109,355)Increase in bank loan – 83,860 – – 83,860Increase (decrease) in
intercompany loans 94,753 (21,108) (73,645) – –Increase in investments (73,645) 73,645 –Increase in equity 15,064 – 73,645 (73,645) 15,064Interest paid (11,858) 4,399 (10,769) – (18,228)
Financing activities (11,396) (6,494) (10,769) – (28,659)Additions to exploration and
evaluation assets – (7,694) – – (7,694)Additions to oil and gas
properties – (231,119) – – (231,119)Property acquisitions – (12,509) – – (12,509)Proceeds from divestitures – 317,402 – – 317,402Current income tax expense on
divestiture – (16,664) – – (16,664)Additions to other plant and
equipment, net of disposals – (6,667) – – (6,667)Change in non-cash working
capital – 16,842 – – 16,842
Investing activities – 59,591 – – 59,591
Impact of foreign currencytranslation on cash balances $ – $ (375) $ – $ – $ (375)
44 Baytex Energy Corp. Second Quarter Report 2012

Guarantor Non-guarantor Consolidation Total(thousands of Canadian dollars) Baytex Subsidiaries Subsidiaries Adjustments Consolidated
For the six months endedJune 30, 2011
Cash provided by (used in):Operating activities $ 9,240 $ 253,471 $ 3,387 $ – $ 266,098Payment of dividends (104,020) – – – (104,020)Increase in bank loan – 16,753 – – 16,753Increase (decrease) in
intercompany loans (72,647) 109,030 (36,383) – –Increase in investments 145,810 – – – 145,810Proceeds from issuance of
long-term debt (32,996) 32,996 –Increase in equity 28,480 – 32,996 (32,996) 28,480Interest paid (6,863) (9,524) – – (16,387)
Financing activities (9,240) 83,263 (3,387) – 70,636Additions to exploration and
evaluation assets – (7,444) – – (7,444)Additions to oil and gas
properties – (188,023) – – (188,023)Property acquisitions – (37,333) – – (37,333)Corporate acquisitions – (118,671) – – (118,671)Additions to other plant and
equipment, net of disposals – (825) – – (825)Change in non-cash working
capital – 17,317 – – 17,317
Investing activities – (334,979) – – (334,979)
Impact of foreign currencytranslation on cash balances $ – $ 304 $ – $ – $ 304
Baytex Energy Corp. Second Quarter Report 2012 45

ABBREVIATIONS
AcSB Accounting Standards Board LIBOR London Interbank Offered RateAECO the natural gas storage facility located LLB Lloyd Light Blend
at Suffield, Alberta LLK Lloyd KerrobertASC Accounting Standards Codification mbbl thousand barrelsbbl barrel mboe* thousand barrels of oil equivalentbbl/d barrel per day
mcf thousand cubic feetbcf billion cubic feet
mcf/d thousand cubic feet per dayboe* barrels of oil equivalentmmbbl million barrelsboe/d* barrels of oil equivalent per daymmboe* million barrels of oil equivalentCOSO Committee of SponsoringmmBtu million British Thermal UnitsOrganizations of the Treadway
Commission mmBtu/d million British Thermal Units per dayDRIP Dividend Reinvestment Plan mmcf million cubic feetGAAP generally accepted accounting mmcf/d million cubic feet per day
principles MW MegawattGJ gigajoule NGL natural gas liquidsGJ/d gigajoule per day
NYMEX New York Mercantile ExchangeIAS International Accounting Standard
NYSE New York Stock ExchangeIASB International Accounting StandardsTSX Toronto Stock ExchangeBoardWCS Western Canadian SelectIFRS International Financial ReportingWTI West Texas IntermediateStandards
* BOEs may be misleading, particularly if used in isolation. In accordance with NI 51-101, a BOE conversion ratio for natural gasof 6 Mcf: 1 bbl has been used, which is based on an energy equivalency conversion method primarily applicable at the burnertip and does not represent a value equivalency at the wellhead.
46 Baytex Energy Corp. Second Quarter Report 2012

CORPORATE INFORMATION
BOARD OF DIRECTORS OFFICERSRaymond T. Chan Raymond T. ChanExecutive Chairman and Executive Chairman andInterim Chief Executive Officer Interim Chief Executive OfficerBaytex Energy Corp.
W. Derek AylesworthJohn A. Brussa(2)(3)(4) Chief Financial OfficerPartner
Marty L. ProctorBurnet, Duckworth & Palmer LLPChief Operating Officer
Edward Chwyl (2)(3)(4)
Daniel G. AndersonLead Independent DirectorVice President, U.S. Business UnitIndependent Businessman
Kendall D. ArthurNaveen Dargan(1)(2)(4)
Vice President,Independent BusinessmanSaskatchewan Business Unit
R. E. T. (Rusty) Goepel (1)
Stephen BrownridgeSenior Vice PresidentVice President, ExplorationRaymond James Ltd.
Geoffrey J. DarcyGregory K. Melchin (1)
Vice President, MarketingIndependent Businessman
Murray J. DesrosiersDale O. Shwed(3)
Vice President,President & Chief Executive OfficerGeneral Counsel and Corporate SecretaryCrew Energy Inc.
(1) Member of the Audit Committee Brian G. Ector(2) Member of the Compensation Committee(3) Member of the Reserves Committee Vice President, Investor Relations(4) Member of the Nominating and Governance Committee
Michael S. KaluzaHEAD OFFICEVice President, Planning
Centennial Place, East TowerSuite 2800, 520 – 3rd Avenue S.W. Brett J. McDonaldCalgary, Alberta T2P 0R3 Vice President, LandT 587-952-3000F 587-952-3001 Timothy R. MorrisToll-free: 1-800-524-5521 Vice President, U.S. Business Developmentwww.baytex.ab.ca
Richard P. RamsayAUDITORS Vice President, Heavy OilDeloitte & Touche LLP
LEGAL COUNSELBANKERS Burnet, Duckworth & Palmer LLPThe Toronto-Dominion Bank
RESERVES ENGINEERSAlberta Treasury BranchesBank of America Sproule Associates LimitedBank of Montreal
TRANSFER AGENTBank of Nova ScotiaBarclays Bank PLC Valiant Trust CompanyCanadian Imperial Bank of CommerceCaisse Centrale Desjardins EXCHANGE LISTINGSCredit Suisse AG
Toronto Stock ExchangeNational Bank of CanadaNew York Stock ExchangeRoyal Bank of CanadaSymbol: BTESociete Generale
Union Bank of CaliforniaWells Fargo Bank