q2’20 financial results - cohu, inc
TRANSCRIPT

July 30, 2020Page 1
Q2’20 Financial Results
July 30, 2020

July 30, 2020Page 2
Cautionary Statement Regarding Forward Looking StatementsForward Looking Statements:
Certain statements contained in this presentation may be considered forward-looking statements within the meaning of the U.S. Private Securities Litigation Reform Act of 1995, including statements regarding market positions in mobility, medical, computing & network semiconductor & PCB test segments and leadership in automotive and industrial applications, expected recovery in automotive and industrial and status or speed of recovery, product segment market sizes and growth, new design-wins, customers adopting our solution for 5G RF test, mobility growth, future strength and growth beyond the COVID-19 pandemic, any comments about fourth quarter 2020 or second half 2020 projections, long-term benefiting from manufacturing consolidation reducing cost structure, temporary cost savings and expense reductions, optimizing OpEx spending, business model for FY’20 and mid-term target, % of incremental revenue expected to fall to operating income, third quarter 2020 expected strong RF tester shipments and new customer traction for handlers and inspection equipment, anticipated production ramp, minimum cash needed, the Company’s third quarter 2020 sales forecast, guidance, sales mix, non-GAAP operating expenses, gross margin, adjusted EBITDA and effective tax rate, and cash and shares outstanding, estimated minimum cash needed, estimated EBITDA breakeven point, and any other statements that are predictive in nature and depend upon or refer to future events or conditions, and include words such as “may,” “will,” “should,” “would,” “expect,” “anticipate,” “plan,” “likely,” “believe,” “estimate,” “project,” “intend,” and other similar expressions among others. Statements that are not historical facts are forward-looking statements. Forward-looking statements are based on current beliefs and assumptions that are subject to risks and uncertainties and are not guarantees of future performance.
Actual results could differ materially from those contained in any forward-looking statement as a result of various factors, including, without limitation: The ongoing global COVID-19 pandemic has adversely affected, and is continuing to adversely affect, our business, financial condition and results of operations including: i) our workforce and operations, the operations of our customers, and those of our respective vendors and suppliers, ii) our primary manufacturing facilities in Malaysia and the Philippines were partially operating in second quarter 2020 and could be abruptly impacted again due to COVID-19 and related restrictions, iii) we may face other government-mandated facility shutdowns, iv) import/export, shipping and logistics disruptions and cost increases, and other supply chain and distribution constraints or delays, v) continued rapid changes to business, political or regulatory conditions affecting the semiconductor equipment industry and the overall global economy, vi) availability of employees and lost employee productivity as large numbers of employees continue to “work from home”, vii) remote working IT and increased cybersecurity risks, viii) increased internal control risks over financial reporting as key finance staff works remotely, ix) delayed product development programs, x) customers’ canceling, pushing out orders or refusal to accept product deliveries, and delayed collection of receivables, xi) other actions of our customers, suppliers and competitors which may be sudden and inconsistent with our expectations, xii) additional credit rating agency downgrades which would increase the Company’s cost of raising capital, and xiii) potential additional impairment of goodwill or other intangible assets, and increased risk of inventory write-downs due to lower product demand; Other significant risks associated with the Xcerra acquisition, integration and synergies including the failure to achieve the expected benefits of the acquisition, and mandatory ongoing impairment evaluation of goodwill and other intangibles whereby Cohu could be required to write off some or all of this goodwill and other intangibles; Continued availability of capital and financing and additional rating agency downgrade actions, and limited market access given our high debt levels; Our Credit Agreement contains various representations and negative covenants that limit our business flexibility; Changes to or replacement of LIBOR may adversely affect interest rates; Adverse investor reaction to the recently suspended cash dividend; Other risks associated with acquisitions; inventory, goodwill and other asset write-downs; Our ability to convert new products into production on a timely basis and to support product development and meet customer delivery and acceptance requirements for new products; Our reliance on third-party contract manufacturers and suppliers; Failure to obtain customer acceptance resulting in the inability to recognize revenue and accounts receivable collection problems; Market demand and adoption of our new products; Customer orders may be canceled or delayed; Design-wins may or may not result in future orders or sales; The concentration of our revenues from a limited number of customers; Intense competition in the semiconductor equipment industry; Our reliance on patents and intellectual property; Compliance with U.S. export regulations; Impacts from the Tax Cuts and Jobs Act of 2017 and ongoing tax examinations; Geopolitical issues, trade wars and Huawei/HiSilicon export restrictions (including new restrictions effective in second quarter 2020); Retention of key staff; Other health epidemics or natural disasters; ERP system implementation issues particularly as Cohu recently launched a new ERP system in first quarter 2020 and plans a broader rollout in 2020; The seasonal, volatile and unpredictable nature of capital expenditures by semiconductor manufacturers particularly in light of weakened demand in 2019 followed by the COVID-19 global pandemic in 2020; and Rapid technological change.
These and other risks and uncertainties are discussed more fully in Cohu’s filings with the SEC, including the most recently filed Form 10-K and Form 10-Q, and the other filings made by Cohu with the SEC from time to time, which are available via the SEC’s website at www.sec.gov. Except as required by applicable law, Cohu does not undertake any obligation to revise or update any forward-looking statement, or to make any other forward-looking statements, whether as a result of new information, future events or otherwise.

July 30, 2020Page 3
Business Update

July 30, 2020Page 4
Summary
$150.0M $138.9M $144.1M
Q2'19 Q1'20 Q2'20
Quarter Revenue
• Mobility leading the growth• Strength in consumer,
telecom, computing & network infrastructure
• Automotive slowly improving; expected to recover in 2021
• Consolidation reducing cost and optimizing cash flow
• Manufacturing fully operational post COVID-19 disruption
• Optimizing OPEX spending
• Strong RF tester demand for 5G connectivity, consumer and industrial IoT
• PCB test record orders• Design-wins for handler and
inspection systems
7.9%6.3%
11.3%
Q2'19 Q1'20 Q2'20
Non-GAAP EBITDA(1)
(1) See appendix for GAAP to non-GAAP reconciliation
$0.02 $0.00
$0.17
Q2'19 Q1'20 Q2'20
Non-GAAP EPS(1)

July 30, 2020Page 5
2%IoT / IoV &
Optoelectronics
- All sensor technologies
- Low energy connectivity
- LED
- LiDAR
3%Computing &
Network
- Data center & cloud
- Hyperscale
- Computing
- Network infrastructure
- ASIC & FPGA
- Graphic processor
4%Industrial &
Medical
- Automation
- Machinery
- Energy management
- General medical ICs
- Remote security
- Smart grids
5%Automotive
- Autonomous driving
- Electrification
- Active safety
- Connectivity
- Infotainment
9%Consumer
- Digital TVs, FPD
- Fitness wearables
- Gaming, GPU
- Set-top box
- VR & AR
- Voice user interface
10%PCB
Manufacturing
- Multilayer PCBs
- Hi-density Interconnect
- Flex & Rigid Flex PCB
- IC Substrates
15%Mobility
- RF 5G to mmWave
- Application processors
- General connectivity
- FPD Drivers
- Power Mgmt. ICs
- Near-field Comm.
All Markets
- Contactors & Pins
- Device Kits
- Spares
- Services
- Applications
48% Systems
Market Segmentation(1)
52%Recurring
(1) Segment represents Q2’20 orders

July 30, 2020Page 6
Expertise in 5G RF High Volume ManufacturingTime to Yield
One-stop-shop for leading edge integrated RF solutions
accelerates “time to yield”
Higher RF measurement performance with integrated
test solutions to the DUT
Proven RF solutions with Cohu testers, handlers, vision
inspection and contactorsTotal Integration
Test and Inspection HandlerSemi Test Test Interface
AcceleratesTime to
Yield
Integrated OTA Solutions
Higher Signal Integrity

July 30, 2020Page 7
Q2’20 Financials and Q3’20 Guidance

July 30, 2020Page 8
Q2’20 Non-GAAP ResultsQ1’20 Actual
Q2’20 Guidance(2)
Q2’20 Actual
Sales $138.9M $130 - $155M $144.1M
Gross Margin(1) 41.7% 39% - 42% 42.5%
Operating Expenses(1) $52.1M ~$49M $47.9M
Non-GAAP EPS(1) $0.00 $0.17
Adjusted EBITDA(1) 6% ~8% 11%
Mobility (RF test) and PCB tester sales remain strong; Automotive slowly recovering Asia factories fully operational contributing to higher gross margin Optimizing operating expenses; temporary cost reductions remain in effect Q2’20 diluted shares outstanding at 42.3M
(1) Non-GAAP: See Appendix for Q1’20, Q2’20 GAAP to non-GAAP reconciliations(2) Guidance as provided on May 5, 2020 press release and May 5, 2020 earnings call
July 30, 2020Page 9
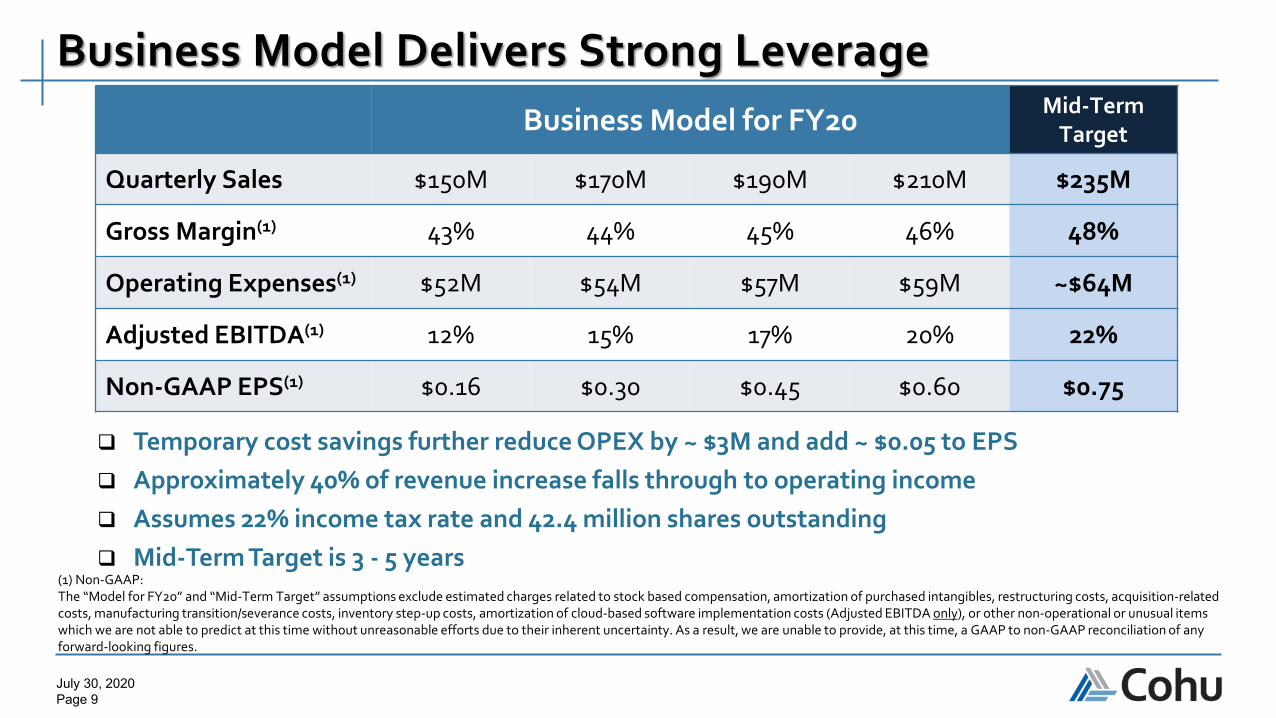
Business Model Delivers Strong LeverageBusiness Model for FY20 Mid-Term
Target
Quarterly Sales $150M $170M $190M $210M $235M
Gross Margin(1) 43% 44% 45% 46% 48%
Operating Expenses(1) $52M $54M $57M $59M ~$64M
Adjusted EBITDA(1) 12% 15% 17% 20% 22%
Non-GAAP EPS(1) $0.16 $0.30 $0.45 $0.60 $0.75
Temporary cost savings further reduce OPEX by ~ $3M and add ~ $0.05 to EPS Approximately 40% of revenue increase falls through to operating income Assumes 22% income tax rate and 42.4 million shares outstanding Mid-Term Target is 3 - 5 years
(1) Non-GAAP:The “Model for FY20” and “Mid-Term Target” assumptions exclude estimated charges related to stock based compensation, amortization of purchased intangibles, restructuring costs, acquisition-related costs, manufacturing transition/severance costs, inventory step-up costs, amortization of cloud-based software implementation costs (Adjusted EBITDA only), or other non-operational or unusual items which we are not able to predict at this time without unreasonable efforts due to their inherent uncertainty. As a result, we are unable to provide, at this time, a GAAP to non-GAAP reconciliation of any forward-looking figures.
July 30, 2020Page 10
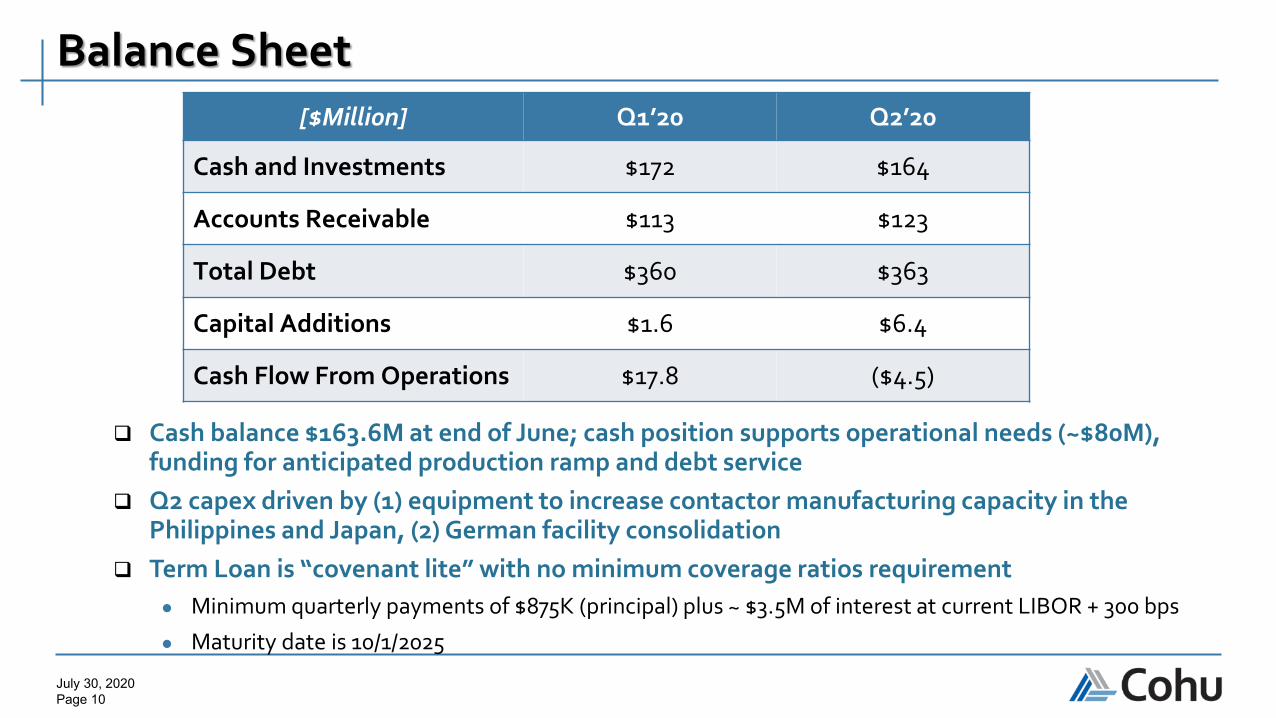
Balance Sheet[$Million] Q1’20 Q2’20
Cash and Investments $172 $164
Accounts Receivable $113 $123
Total Debt $360 $363
Capital Additions $1.6 $6.4
Cash Flow From Operations $17.8 ($4.5)
Cash balance $163.6M at end of June; cash position supports operational needs (~$80M), funding for anticipated production ramp and debt service
Q2 capex driven by (1) equipment to increase contactor manufacturing capacity in the Philippines and Japan, (2) German facility consolidation
Term Loan is “covenant lite” with no minimum coverage ratios requirement● Minimum quarterly payments of $875K (principal) plus ~ $3.5M of interest at current LIBOR + 300 bps
● Maturity date is 10/1/2025

July 30, 2020Page 11
Q3’20 OutlookQ2’20Actual
Q3’20Guidance
Sales $144.1M $134 - $146M
Gross Margin(1) 42.5% 41% - 44%
Operating Expenses(1) $47.9M ~ $48M
Adjusted EBITDA(1) 11% ~ 11%(mid-point of guidance)
Low end of sales guidance considers potential supply chain uncertainty caused by COVID-19 plus risks associated with book and bill sales and customer acceptance required for revenue
Gross margin reflects no constraints on Asia factories and favorable product mix vs. Q2 Q3’20 Operating Expenses flat QoQ; temporary cost reductions of ~ $3M remain in effect Fully diluted shares outstanding estimated at 42.4M
(1) See Appendix for Q2’20 GAAP to non-GAAP reconciliations. The Q3’20 guidance for non-GAAP Gross Margin, Operating Expenses and Adjusted EBITDA exclude estimated pre-tax charges related to stock-based compensation of $0.2M (CoS) and $3.1M (Opex), and amortization of purchased intangibles of $9.6M (Opex). Also, these figures do not reflect restructuring costs, acquisition-related costs, other manufacturing transition/severance costs, inventory step-up costs, amortization of cloud-based software implementation costs (Adjusted EBITDA only), or other non-operational or unusual items which we are not able to predict at this time without unreasonable efforts due to their inherent uncertainty. As a result, we are unable to provide, at this time, a GAAP to non-GAAP reconciliation of any forward-looking figures.

July 30, 2020Page 12
AppendixUse of Non-GAAP Financial Information:
This presentation includes non-GAAP financial measures, including non-GAAP Gross Margin/Profit, Income and Income (adjusted earnings) per share, Operating Income, Operating Expense and Adjusted EBITDA that supplement the Company’s Condensed Consolidated Statements of Operations prepared under generally accepted accounting principles (GAAP). These non-GAAP financial measures adjust the Company’s actual results prepared under GAAP to exclude charges and the related income tax effect for: share-based compensation, the amortization of purchased intangible assets including favorable/unfavorable lease adjustments, restructuring costs, manufacturing transition and severance costs, asset impairment charges, acquisition-related costs and associated professional fees, reduction of indemnification receivable, depreciation of purchase accounting adjustments to property, plant and equipment, purchase accounting inventory step-up included in cost of sales, and amortization of cloud-based software implementation costs (Adjusted EBITDA only). Reconciliations of GAAP to non-GAAP amounts for the periods presented herein are provided in schedules accompanying this release and should be considered together with the Condensed Consolidated Statements of Operations. With respect to any forward-looking non-GAAP figures, we are unable to provide without unreasonable efforts, at this time, a GAAP to non-GAAP reconciliation of any forward-looking figures due to their inherent uncertainty.These non-GAAP measures are not meant as a substitute for GAAP, but are included solely for informational and comparative purposes. The Company’s management believes that this information can assist investors in evaluating the Company’s operational trends, financial performance, and cash generating capacity. Management uses non-GAAP measures for a variety of reasons, including to make operational decisions, to determine executive compensation in part, to forecast future operational results, and for comparison to our annual operating plan. However, the non-GAAP financial measures should not be regarded as a replacement for (or superior to) corresponding, similarly captioned, GAAP measures.

July 30, 2020Page 13
GAAP to Non-GAAP ReconciliationEarnings Reconciliation
Jun 29, 2019
Diluted EPS
Mar 28, 2020
Diluted EPS
Jun 27, 2020
Diluted EPS
Loss From Continuing Operations - GAAP (19,383)$ (0.47)$ (17,318)$ (0.42)$ (4,740)$ (0.11)$ Share Based Compensation 3,662 0.09 3,611 0.09 3,403 0.08Amortization of Purchased Intangible Assets 9,987 0.24 9,538 0.23 9,527 0.23Manufacturing Transition and Severance Costs 1,148 0.03 63 0.00 76 0.00Restructuring Costs related to inventory in COS (1,259) (0.03) 1,603 0.04 72 0.00Restructuring Costs 8,545 0.21 403 0.01 585 0.01PP&E step-up included in COS and SG&A 1,257 0.03 243 0.01 243 0.01Other Acquisition Costs 180 0.00 0 0.00 0 0.00Impairment Charge 0 0.00 3,949 0.09 0 0.00Gain on Sale of Facility 0 0.00 0 0.00 (27) 0.00Tax Effect of Non-GAAP Adjustments (3,348) (0.08) (1,960) (0.05) (2,011) (0.05)
Income (Loss) From Continuing Operations - Non-GAAP 789$ $0.02 $132 $0.00 $7,128 $0.17
Weighted Average Shares - GAAP Diluted 41,125 Basic 41,502 Basic 41,844Weighted Average Shares - Non-GAAP Diluted 41,534 Diluted 42,428 Diluted 42,283
Adjusted EBITDA ReconciliationJun 29, 2019
% of Net Sales
Mar 28, 2020
% of Net Sales
Jun 27, 2020
% of Net Sales
Net loss attributable to Cohu - GAAP Basis (19,323)$ -12.9% (17,276)$ -12.4% (4,740)$ -3.3%Income from Discontinued Operations (24) 0.0% (42) 0.0% 0 0.0%Income Tax Provision (916) -0.6% (992) -0.7% 137 0.1%Interest Expense 5,282 3.5% 4,427 3.2% 3,456 2.4%Interest Income (191) -0.1% (147) -0.1% (21) 0.0%Amortization of Purchased Intangible Assets 9,987 6.7% 9,538 6.9% 9,527 6.6%Depreciation 5,102 3.4% 3,416 2.5% 3,557 2.5%Amortization of Cloud-Based Software Implementation Costs 0 0.0% 205 0.1% 308 0.2%Other Non-GAAP Adjustments 11,866 7.9% 9,629 6.9% 4,109 2.9%
Adjusted EBITDA 11,783$ 7.9% $8,758 6.3% $16,333 11.3%
3 Months Ending
3 Months Ending
3 Months Ending
3 Months Ending
3 Months Ending
3 Months Ending
July 30, 2020Page 14
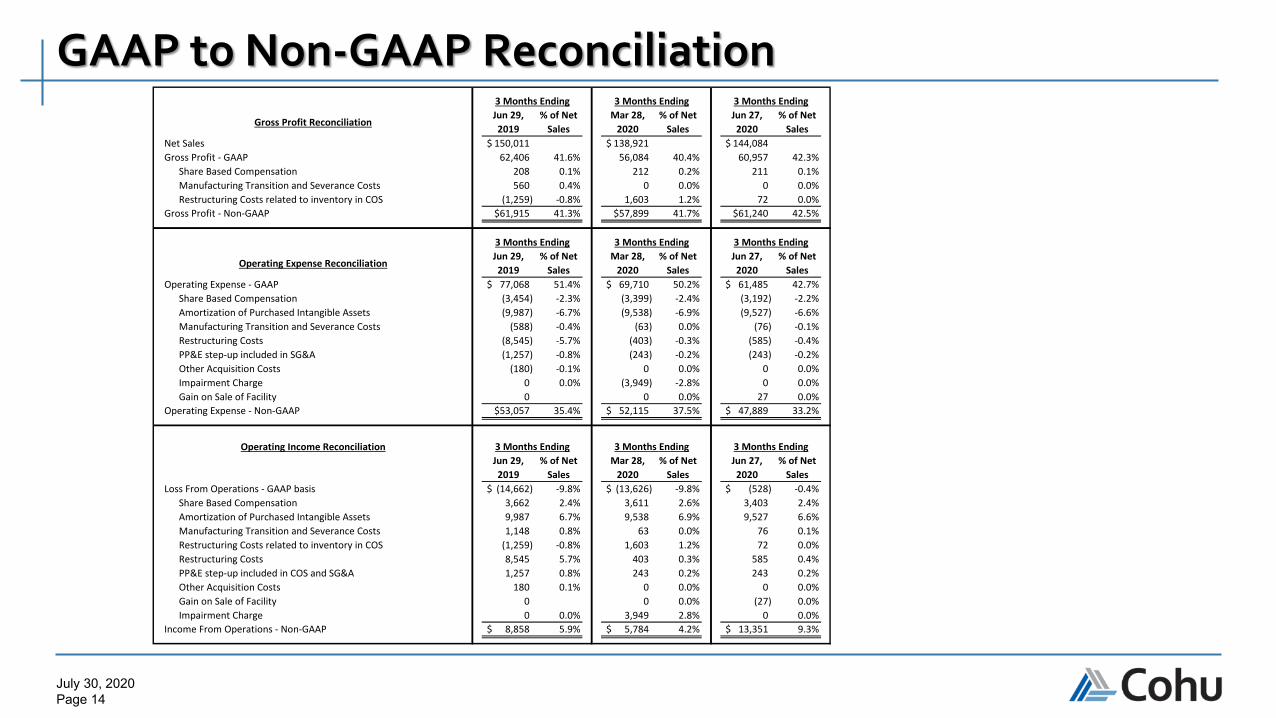
GAAP to Non-GAAP ReconciliationGross Profit Reconciliation
Jun 29, 2019
% of Net Sales
Mar 28, 2020
% of Net Sales
Jun 27, 2020
% of Net Sales
Net Sales 150,011$ 138,921$ 144,084$ Gross Profit - GAAP 62,406 41.6% 56,084 40.4% 60,957 42.3%
Share Based Compensation 208 0.1% 212 0.2% 211 0.1%Manufacturing Transition and Severance Costs 560 0.4% 0 0.0% 0 0.0%Restructuring Costs related to inventory in COS (1,259) -0.8% 1,603 1.2% 72 0.0%
Gross Profit - Non-GAAP $61,915 41.3% $57,899 41.7% $61,240 42.5%
Operating Expense ReconciliationJun 29, 2019
% of Net Sales
Mar 28, 2020
% of Net Sales
Jun 27, 2020
% of Net Sales
Operating Expense - GAAP 77,068$ 51.4% 69,710$ 50.2% 61,485$ 42.7%Share Based Compensation (3,454) -2.3% (3,399) -2.4% (3,192) -2.2%Amortization of Purchased Intangible Assets (9,987) -6.7% (9,538) -6.9% (9,527) -6.6%Manufacturing Transition and Severance Costs (588) -0.4% (63) 0.0% (76) -0.1%Restructuring Costs (8,545) -5.7% (403) -0.3% (585) -0.4%PP&E step-up included in SG&A (1,257) -0.8% (243) -0.2% (243) -0.2%Other Acquisition Costs (180) -0.1% 0 0.0% 0 0.0%Impairment Charge 0 0.0% (3,949) -2.8% 0 0.0%Gain on Sale of Facility 0 0 0.0% 27 0.0%
Operating Expense - Non-GAAP $53,057 35.4% 52,115$ 37.5% 47,889$ 33.2%
Operating Income ReconciliationJun 29, 2019
% of Net Sales
Mar 28, 2020
% of Net Sales
Jun 27, 2020
% of Net Sales
Loss From Operations - GAAP basis (14,662)$ -9.8% (13,626)$ -9.8% (528)$ -0.4%Share Based Compensation 3,662 2.4% 3,611 2.6% 3,403 2.4%Amortization of Purchased Intangible Assets 9,987 6.7% 9,538 6.9% 9,527 6.6%Manufacturing Transition and Severance Costs 1,148 0.8% 63 0.0% 76 0.1%Restructuring Costs related to inventory in COS (1,259) -0.8% 1,603 1.2% 72 0.0%Restructuring Costs 8,545 5.7% 403 0.3% 585 0.4%PP&E step-up included in COS and SG&A 1,257 0.8% 243 0.2% 243 0.2%Other Acquisition Costs 180 0.1% 0 0.0% 0 0.0%Gain on Sale of Facility 0 0 0.0% (27) 0.0%Impairment Charge 0 0.0% 3,949 2.8% 0 0.0%
Income From Operations - Non-GAAP 8,858$ 5.9% 5,784$ 4.2% 13,351$ 9.3%
3 Months Ending
3 Months Ending
3 Months Ending
3 Months Ending
3 Months Ending
3 Months Ending
3 Months Ending
3 Months Ending
3 Months Ending