q3 09-30-2017-mda - killam properties inc 09... · title: q3 09-30-2017-mda created date:...
TRANSCRIPT
Q3-2017 Management's Discussion and AnalysisDollar amounts in thousands of Canadian dollars (except as noted)
1
TABLE OF CONTENTS
PART I PART V
Business Overview Per Unit Calculations 23
Basis of Presentation 2 Funds from Operations 23
Declaration of Trust 2 Adjusted Funds from Operations 24
Forward-looking Statements 3 Adjusted Cash flow From Operations 26
Non-IFRS Financial Measures 3
PART II PART VI
Key Performance Indicators 4 Investment Properties 28
Financial and Operational Highlights 5 Investment Properties Under Construction 29
Summary of Q3-2017 Results and Operations 6 Capital Improvements 30
Outlook 7 Mortgages and Other Loans 33
2017 Strategic Targets 8 Unitholders' Equity 36
Portfolio Summary 9 Distribution Reinvestment Plan 36
Core Market Update 10 Liquidity and Capital Resources 36
PART III PART VII
Q3-2017 Financial Overview Risk Management 38
-Consolidated Results 13Critical Accounting Policies and Significant AccountingJudgments, Estimates and Assumptions 38
-Apartment Results 14 Disclosure Controls, Procedures and Internal Controls 38
-MHC Results 19 Related Party Transactions 38
-Commercial Results 19 Subsequent Events 38
PART IV
Other Income and Expenses
-Other Income 20
-Financing Costs 20
-Depreciation Expense 21
-Amortization of Deferred Financing Costs 21
-Administration Expenses 21
-Fair Value Adjustments 22
-Deferred Tax Expense 22
2
Q3-2017 Management's Discussion and AnalysisDollar amounts in thousands of Canadian dollars (except as noted)
2
PART I
Business Overview
Killam Apartment REIT ("Killam", the "Trust", or the "REIT"), based in Halifax, Nova Scotia ("NS"), is one of Canada's largest residential landlords, owning, operating, managing and developing a $2.2 billion portfolio of apartments and manufactured home community ("MHC") properties. Killam was founded in 2000 to create value through the consolidation of apartments in Atlantic Canada and MHCs across Canada. Killam entered the Ontario ("ON") apartment market in 2010 and made its first investment in Alberta ("AB") in 2014. Killam broke ground on its first development in 2010 and has completed eight projects to date with a further three projects currently under construction.
Killam’s strategy to enhance value and profitability focuses on three priorities:
1) increase earnings from the existing portfolio;
2) expand the portfolio and diversify geographically through accretive acquisitions, targeting newer properties; and
3) develop high-quality new properties in its core markets.
The apartment business is Killam’s largest segment and accounted for 89.8% of Killam’s net operating income ("NOI") for the nine months ended September 30, 2017. As at September 30, 2017, Killam’s apartment portfolio consisted of 14,545 units, including 1,245 units jointly-owned with institutional partners. Killam's 184 apartment properties are located predominantly in Atlantic Canada's six largest urban centres (Halifax, Moncton, Saint John, Fredericton, St. John’s and Charlottetown), Ontario (Ottawa, London, Toronto and Cambridge), and Alberta (Calgary and Edmonton). Killam is Atlantic Canada’s largest residential landlord, owning a 13.5% share of multi-family rental units in its core markets. Killam plans to expand its presence in Ontario and Alberta through acquisitions and developments and will also invest strategically in Atlantic Canada to maintain its market presence.
In addition, Killam owns 5,165 MHC sites, also known as land-lease communities or trailer parks, in Ontario and Atlantic Canada. Killam owns the land and infrastructure supporting these communities and leases lots to tenants who own their own homes and pay Killam site rent. The MHC portfolio accounted for 8.6% of Killam’s NOI for the first nine months of 2017. Killam also owns commercial properties that accounted for 1.6% of Killam's NOI for the nine months ended September 30, 2017.
Basis of PresentationThe following Management's Discussion and Analysis (“MD&A”) has been prepared by Management and focuses on key statistics from the condensed consolidated interim financial statements and pertains to known risks and uncertainties. This MD&A should be read in conjunction with the Trust's audited consolidated financial statements for the years ended December 31, 2016, and 2015, which have been prepared in accordance with International Financial Reporting Standards (“IFRS”) as issued by the International Accounting Standards Board. These documents, along with Killam’s 2016 Annual Information Form, are available on SEDAR at www.sedar.com.
The discussions in this MD&A are based on information available as at November 7, 2017. This MD&A has been reviewed and approved by Management and the REIT's Board of Trustees.
Declaration of Trust
Killam's investment guidelines and operating policies are set out in Killam's Amended and Restated Declaration of Trust ("DOT") dated November 27, 2015, which is available on SEDAR. A summary of the guidelines and policies are as follows:
Investment Guidelines• The Trust will acquire, hold, develop, maintain, improve, lease and manage income producing real estate properties;• Investments in joint ventures, partnerships (general or limited) and limited liability companies are permitted;• Investments in land for development that will be capital property for Killam are permitted; and• Investments that would disqualify Killam as a "mutual fund trust" or a "unit trust" as defined within the Income Tax Act (Canada) are
prohibited.
Operating Policies• Overall indebtedness is not to exceed 70% of Gross Book Value;• Guarantees of indebtedness that would disqualify Killam as a "mutual fund trust" or a "unit trust" as defined within the Income Tax
Act (Canada) are prohibited; and• Killam must maintain property insurance coverage in respect of potential liabilities of the Trust.
As at September 30, 2017, Killam was in compliance with all investment guidelines and operating policies.
Q3-2017 Management's Discussion and AnalysisDollar amounts in thousands of Canadian dollars (except as noted)
3
Forward-looking StatementsCertain statements in this MD&A constitute “forward-looking statements”. In some cases, forward-looking statements can be identified by the use of words such as "may", "will", "should", "expect", "plan", "anticipate", "believe", "estimate”, "potential", "continue" or the negative of these terms or other comparable terminology, and by discussions of strategies that involve risks and uncertainties. Readers should be aware that these statements are subject to known and unknown risks, uncertainties and other factors that could cause actual results to differ materially from those anticipated or implied, or those suggested by any forward-looking statements, including: competition, national and regional economic conditions and the availability of capital to fund further investments in Killam's business. Further information regarding these risks, uncertainties and other factors may be found under the heading "Risk Management" in this MD&A and in Killam's most recent Annual Information Form. Given these uncertainties, readers are cautioned not to place undue reliance on any forward-looking statements contained, or incorporated by reference, in this MD&A.
By their nature, forward-looking statements involve numerous assumptions, inherent risks and uncertainties, both general and specific, that contribute to the possibility that the predictions, forecasts, projections and various future events may not occur. Although Management believes that the expectations reflected in the forward-looking statements are reasonable, there can be no assurance that future results, levels of activity, performance or achievements will occur as anticipated. Neither Killam nor any other person assumes responsibility for the accuracy and completeness of any forward-looking statement, and no one has any obligation to update or revise any forward-looking statement, whether as a result of new information, future events, circumstances, or such other factors that affect this information, except as required by law. The forward-looking statements in this document are provided for the limited purpose of enabling current and potential investors to evaluate an investment in Killam. Readers are cautioned that such statements may not be appropriate and should not be used for any other purpose.
Non-IFRS Financial Measures
Management believes these non-IFRS financial measures are relevant measures of the ability of the REIT to earn revenue and to evaluate Killam's financial performance. The non-IFRS measures should not be construed as alternatives to net income (loss) or cash flow from operating activities determined in accordance with IFRS, as indicators of Killam's performance, or sustainability of Killam's distributions. These measures do not have a standardized meaning under IFRS and therefore may not be comparable to similarly titled measures presented by other publicly traded organizations.
• Funds from operations ("FFO"), and applicable per unit amounts, are calculated by Killam as net income adjusted for depreciation on an owner-occupied building, fair value gains (losses), interest expense related to exchangeable units, gains (losses) on disposition, deferred tax expense (recovery), unrealized gains (losses) on derivative liability, REIT conversion costs and non-controlling interest. FFO are calculated in accordance with the REALpac definition, except for the adjustment of REIT conversion costs as noted above; REALpac does not address this adjustment. A reconciliation between net income and FFO is included on page 23.
• Adjusted funds from operations ("AFFO"), and applicable per unit amounts and payout ratios, are calculated by Killam as FFO less $970 per apartment unit per annum and $225 per MHC site per annum for maintenance capital expenditures, representing a three-year rolling historical average capital spend to maintain and sustain Killam's properties. AFFO are calculated in accordance with the REALpac definition, most recently updated in February 2017. Management considers AFFO an earnings metric. A reconciliation from FFO to AFFO is included on page 24, as well as, the reconciliation of net income to FFO on page 23.
• Adjusted cash flow from operations ("ACFO"), is calculated by Killam as cash flow from operations with adjustments for changes in working capital that are not indicative of sustainable economic cash flow available for distribution, maintenance capital expenditures, amortization of deferred financing costs and non-controlling interest. Management considers ACFO a measure of sustainable cash flow. A reconciliation from cash flow from operating activities to ACFO is included on page 26. ACFO is calculated in accordance with the REALpac definition.
• Earnings before interest, tax, depreciation and amortization ("EBITDA") is calculated by Killam as income before fair value adjustments, loss on disposition, income taxes, interest, depreciation and amortization.
• Interest coverage is calculated by dividing EBITDA by interest expense, adjusted for interest expense related to exchangeable units.
• Debt service coverage is calculated by dividing EBITDA by interest expense, adjusted for interest expense related to exchangeable units and principal mortgage repayments.
• Same property results in relation to Killam are revenues and property operating expenses for stabilized properties that Killam has owned for equivalent periods in 2017 and 2016 (95.8% of the portfolio based on the September 30, 2017, unit count).
Q3-2017 Management's Discussion and AnalysisDollar amounts in thousands of Canadian dollars (except as noted)
4
PART II
Key Performance Indicators
To assist Management and investors in monitoring Killam's achievement of its objectives, Killam has defined a number of key
performance indicators to measure the success of its operating and financial performance:
1) FFO per Unit – A standard measure of earnings for real estate entities. Management is focused on growing FFO per unit.
2) AFFO per Unit – A standard measure of earnings for real estate entities. Management is focused on growing AFFO per unit.
3) Payout Ratio – Killam monitors its AFFO and ACFO payout ratios and targets improved payout ratios going forward. The ACFO payout ratio is a measure to assess the sustainability of distributions. The AFFO payout ratio is used as a supplemental metric. Although Killam expects to continue to sustain and grow distributions, the amount of distributions will depend on debt repayments and refinancings, capital investments, and other factors that may be beyond the control of the REIT.
4) Rental Increases – Management expects to increase average annual rental rates and tracks average rate increases.
5) Occupancy – Management is focused on maximizing occupancy while also managing the impact of higher rents. This measure is a percentage based on vacancy cost divided by gross potential residential rent (in dollars).
6) Same Property NOI – This measure considers Killam’s ability to increase the same property NOI, removing the impact of acquisitions, dispositions, developments and other non-same property operating adjustments.
7) Weighted Average Interest Rate of Mortgage Debt and Total Debt – Killam monitors the weighted average cost of its mortgage debt and total debt.
8) Debt to Total Assets – Killam's primary measure of its leverage is debt as a percentage of total assets. Killam's DOT operating policies stipulate that overall indebtedness is not to exceed 70% of total assets. Debt to total assets is calculated by dividing total interest bearing debt by total assets.
9) Weighted Average Years to Debt Maturity – Management monitors the average number of years to maturity on its debt.
10) Debt to Earnings Before Interest, Taxes, Depreciation and Amortization ("EBITDA") – A common measure of leverage used by lenders, this measure considers Killam’s financial health and liquidity. Generally, the lower the debt to EBITDA ratio, the lower the credit risk.
11) Debt Service Coverage Ratio – A common measure of credit risk used by lenders, this measure considers Killam’s ability to pay both interest and principal on outstanding debt. Generally, the higher the debt service coverage ratio, the lower the credit risk.
12) Interest Coverage Ratio – A common measure of credit risk used by lenders, this measure considers Killam’s ability to pay interest on outstanding debt. Generally, the higher the interest coverage ratio, the lower the credit risk.
Q3-2017 Management's Discussion and AnalysisDollar amounts in thousands of Canadian dollars (except as noted)
5
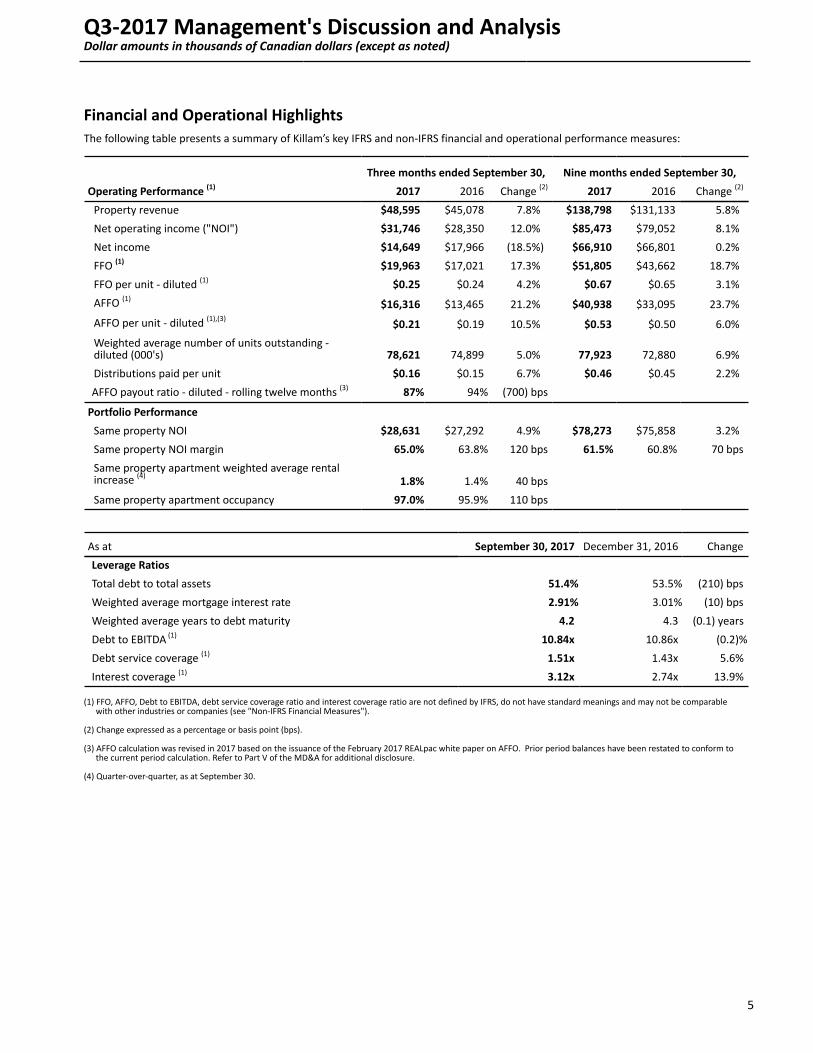
Financial and Operational HighlightsThe following table presents a summary of Killam’s key IFRS and non-IFRS financial and operational performance measures:
Three months ended September 30, Nine months ended September 30,
Operating Performance (1) 2017 2016 Change (2) 2017 2016 Change (2)
Property revenue $48,595 $45,078 7.8% $138,798 $131,133 5.8%
Net operating income ("NOI") $31,746 $28,350 12.0% $85,473 $79,052 8.1%
Net income $14,649 $17,966 (18.5%) $66,910 $66,801 0.2%
FFO (1) $19,963 $17,021 17.3% $51,805 $43,662 18.7%
FFO per unit - diluted (1) $0.25 $0.24 4.2% $0.67 $0.65 3.1%
AFFO (1)$16,316 $13,465 21.2% $40,938 $33,095 23.7%
AFFO per unit - diluted (1),(3)$0.21 $0.19 10.5% $0.53 $0.50 6.0%
Weighted average number of units outstanding - diluted (000's) 78,621 74,899 5.0% 77,923 72,880 6.9%
Distributions paid per unit $0.16 $0.15 6.7% $0.46 $0.45 2.2%
AFFO payout ratio - diluted - rolling twelve months (3) 87% 94% (700) bps
Portfolio Performance
Same property NOI $28,631 $27,292 4.9% $78,273 $75,858 3.2%
Same property NOI margin 65.0% 63.8% 120 bps 61.5% 60.8% 70 bps
Same property apartment weighted average rental increase (4)
1.8% 1.4% 40 bps
Same property apartment occupancy 97.0% 95.9% 110 bps
As at September 30, 2017 December 31, 2016 Change
Leverage Ratios
Total debt to total assets 51.4% 53.5% (210) bps
Weighted average mortgage interest rate 2.91% 3.01% (10) bps
Weighted average years to debt maturity 4.2 4.3 (0.1) years
Debt to EBITDA (1) 10.84x 10.86x (0.2)%
Debt service coverage (1) 1.51x 1.43x 5.6%
Interest coverage (1) 3.12x 2.74x 13.9%
(1) FFO, AFFO, Debt to EBITDA, debt service coverage ratio and interest coverage ratio are not defined by IFRS, do not have standard meanings and may not be comparable with other industries or companies (see "Non-IFRS Financial Measures").
(2) Change expressed as a percentage or basis point (bps).
(3) AFFO calculation was revised in 2017 based on the issuance of the February 2017 REALpac white paper on AFFO. Prior period balances have been restated to conform to the current period calculation. Refer to Part V of the MD&A for additional disclosure.
(4) Quarter-over-quarter, as at September 30.
Q3-2017 Management's Discussion and AnalysisDollar amounts in thousands of Canadian dollars (except as noted)
6
Summary of Q3-2017 Results and Operations
FFO per unit Growth of 4.2% Killam generated FFO per unit of $0.25 in Q3-2017, 4.2% higher than the $0.24 generated in Q3-2016. FFO growth was attributable to a 12.0% increase in NOI due to strong same property performance, the incremental contribution from recent acquisitions and interest savings on mortgage refinancings and the repayment of the $46 million convertible debentures in April 2017. This growth was partially offset by a 5.0% increase in the weighted average number of units outstanding following the equity raise in March 2017 used to delever the balance sheet and fund acquisitions and developments.
Higher Rents and Improved Occupancy Drive Same Property Revenue GrowthSame property revenue increased 2.9% compared to Q3-2016 as a result of a 110 bps increase in average apartment occupancy and a 1.8% increase in the average rental rate for the apartment portfolio, as well as 2.5% top-line growth within the MHC portfolio. With a strong leasing team, Killam's same property apartment portfolio achieved 97.0% occupancy for Q3-2017. As at September 30, 2017, occupancy based on unit count was 98.5%, compared to 97.1% as at September 30, 2016. Apartment growth was particularly strong in New Brunswick and Halifax, where same property apartment revenues increased by 5.2% and 3.0% compared to the same period in 2016. Apartment revenues increased by 1.9% in Ontario, above the rent control guidelines of 1.5% for renewals, due to strong demand on new leasing.
Same Property NOI growth of 4.9% Due to Rental Growth and Expense Savings Killam's same property total operating expenses were 60 bps lower for the three months ended September 30, 2017, as compared to Q3-2016, contributing to the 4.9% increase in same property NOI. Utility expenses for Q3-2017 were 6.0% lower than the same period in 2016 as it was approximately 30% cooler in Q3-2017 than the previous summer in Ontario, lowering consumption of electricity. Killam also benefited from lower electricity costs in Ontario. Water consumption was also down in Q3-2017 due to efficiency investments. Killam realized a 1.9% reduction in general operating expenses compared to Q3-2016 due to lower insurance and advertising costs, and the net impact of internalizing property management at its Newfoundland properties effective Q2-2017. These savings more than offset the 5.4% increase in property taxes.
Lower Interest Rates Contributed to Earnings Growth Killam benefited from lower interest rates on mortgages refinanced during Q4-2016 and the first three quarters of 2017, contributing to a 3.5% reduction in same property mortgage interest expense compared to Q3-2016. During Q3-2017, Killam refinanced $19.3 million of maturing mortgages with $27.6 million of new debt at a weighted average interest rate of 2.93%, 85 basis points lower than the weighted average rate of the maturing debt.
Portfolio Growth from Acquisitions and Developments On July 4, 2017, Killam invested $31.6 million in a two-building, 134-unit apartment complex in Halifax. In early August, Killam took possession of the first of two properties totaling 296 units in the Sherwood Park suburb of Edmonton, for $28.3 million. The second phase of this transaction ($39.2 million) is scheduled to close on December 1, 2017. These newly constructed properties contributed positively to FFO in the quarter and support Killam's strategy to expand the portfolio with an emphasis on newer properties.
Killam invested $15.7 million, which includes $7.8 million in equity, during the quarter in its three developments, The Alexander in Halifax, Saginaw Park in Cambridge and Gloucester City Centre in Ottawa. On October 1st, the first residents moved into The Alexander's four-level podium. All of the available suites in this section of the project are currently leased and 57 of the units in the tower are pre-leased with occupancy slated for late Q2-2018. In total, 46% of the project's units are under contract. Active pre-leasing of Saginaw Park began in late July 2017 as the development is expected to be completed in early Q2-2018, and Killam has pre-leased 30% of the property's 93 units. Construction at Gloucester is progressing on schedule and on budget, with construction on the building's 10th floor.
Q3-2017 Management's Discussion and AnalysisDollar amounts in thousands of Canadian dollars (except as noted)
7
Outlook
Increased Earnings from Killam's Same Property PortfolioManagement expects to generate same property NOI growth and improved operating margins through increased rental revenue and general operating expense management. Population growth, fueled in part from international immigration in Killam's core markets, is expected to support a strong rental market. Additionally, a significant number of baby boomers and seniors looking to transition from home ownership to apartment living are expected to support rental demand for the foreseeable future. Rapidly rising home prices, particularly in Ontario, have also increased demand for rental units.
Investments in energy initiatives and operational efficiencies should continue to contribute to improved operating margins and mitigate inflationary expense pressures. Killam is one year into its five-year, $25 million energy efficiency program. Management is on track to invest approximately $3.5 million this year and $7 million by 2018. These investments, including low-flow water solutions, heating system upgrades, lighting solutions and temperature control solutions, will augment Killam's same property NOI and net asset value ("NAV") growth.
Acquisitions Increase Geographic Diversification Management continues to evaluate acquisition opportunities in Alberta, Ontario and Atlantic Canada, with a focus on increasing its presence in Ontario and Alberta. Killam completed the first phase of its Sherwood Park (Edmonton) acquisition in August, and is scheduled to close the last 172 of 296 units on December 1, 2017. Approximately 23% of Killam's NOI is forecasted to be generated outside Atlantic Canada in 2017 following these acquisitions. Killam's longer-term target is to have over 30% of its NOI generated outside Atlantic Canada by 2020.
Developments to Contribute to FFO and NAV GrowthKillam is an experienced developer, having over $265 million in projects completed during the past five years or currently underway. Developments will continue to be an important component of Killam's growth strategy. Targeting a yield on development of 5.0% to 6.0%, approximately 50-125 bps higher than the anticipated capitalized value on completion, fueling accretive NAV per unit growth.
Killam has $135 million of developments currently underway in Halifax, Cambridge and Ottawa. With substantially all of the equity invested in these projects, the cash flow to complete these developments will be funded predominantly through construction financing. These developments are expected to add $0.04 to FFO per unit once occupied.
Additionally, Killam has a development pipeline of almost 1,500 units representing an inventory value of approximately $500 million. Two of these projects, in Mississauga and Halifax are in the final planning and approval stages and construction is expected to commence in 2018. These projects will further reinforce Killam's portfolio as one of the newest and highest quality apartment portfolios in Canada. See further discussion on land held for future development in the “Investment Properties” section of this MD&A.
Lower Interest Rates on RefinancingsManagement expects to refinance near-term maturities at lower interest rates, creating same property interest expense savings. Killam has approximately $80.4 million of apartment mortgages maturing through to the end of 2018 at a weighted average interest rate of 3.52%, approximately 80 bps and 50 bps higher than prevailing 5 and 10-year CMHC-insured rates. $20 million of MHC mortgages are also maturing through to the end of 2018 at a weighted average interest rate of 4.26%.
Assuming weighted average interest rates of 3.0% and 4.0% on apartment and MHC mortgages, through to the end of 2018, interest expense savings of approximately $0.5 million are expected on the refinance of maturing mortgages. However, Killam expects to up-finance these maturities, generating approximately $30 million of incremental cash flow, and interest expense is expected to remain relatively flat year-over-year.
Q3-2017 Management's Discussion and AnalysisDollar amounts in thousands of Canadian dollars (except as noted)
8
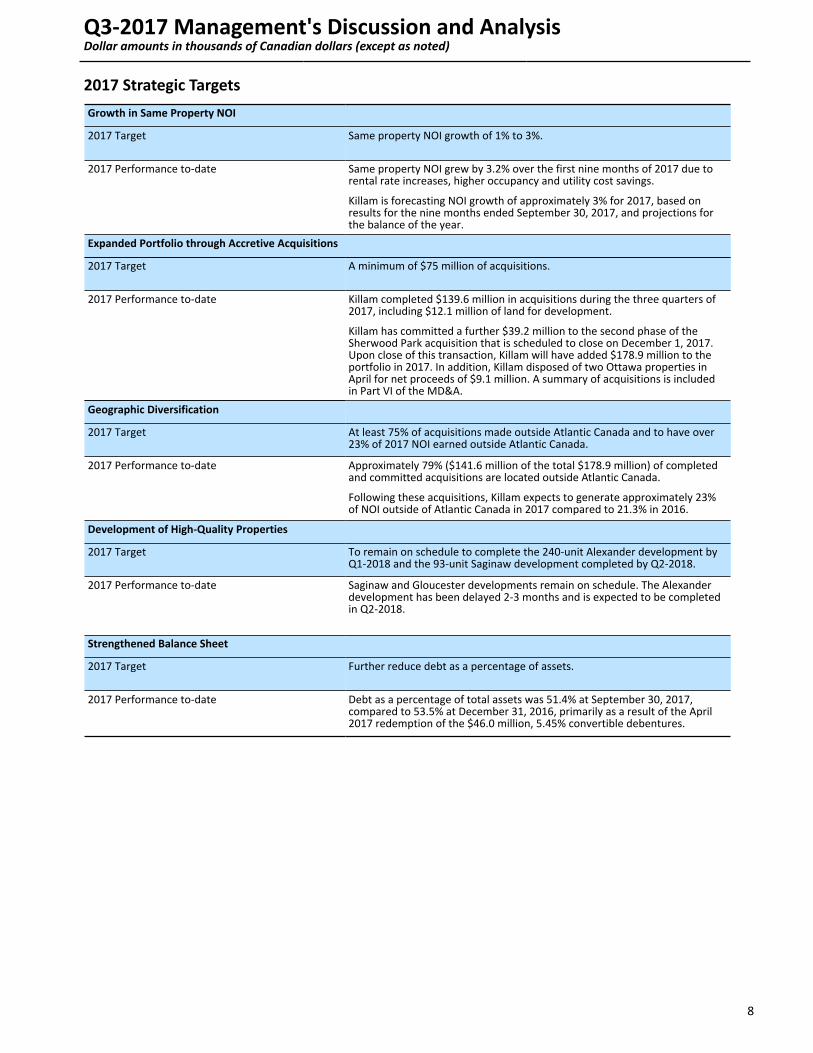
2017 Strategic Targets
Growth in Same Property NOI
2017 Target Same property NOI growth of 1% to 3%.
2017 Performance to-date Same property NOI grew by 3.2% over the first nine months of 2017 due torental rate increases, higher occupancy and utility cost savings.
Killam is forecasting NOI growth of approximately 3% for 2017, based onresults for the nine months ended September 30, 2017, and projections forthe balance of the year.
Expanded Portfolio through Accretive Acquisitions
2017 Target A minimum of $75 million of acquisitions.
2017 Performance to-date Killam completed $139.6 million in acquisitions during the three quarters of2017, including $12.1 million of land for development.
Killam has committed a further $39.2 million to the second phase of theSherwood Park acquisition that is scheduled to close on December 1, 2017.Upon close of this transaction, Killam will have added $178.9 million to theportfolio in 2017. In addition, Killam disposed of two Ottawa properties inApril for net proceeds of $9.1 million. A summary of acquisitions is includedin Part VI of the MD&A.
Geographic Diversification
2017 Target At least 75% of acquisitions made outside Atlantic Canada and to have over23% of 2017 NOI earned outside Atlantic Canada.
2017 Performance to-date Approximately 79% ($141.6 million of the total $178.9 million) of completed and committed acquisitions are located outside Atlantic Canada.
Following these acquisitions, Killam expects to generate approximately 23%of NOI outside of Atlantic Canada in 2017 compared to 21.3% in 2016.
Development of High-Quality Properties
2017 Target To remain on schedule to complete the 240-unit Alexander development byQ1-2018 and the 93-unit Saginaw development completed by Q2-2018.
2017 Performance to-date Saginaw and Gloucester developments remain on schedule. The Alexanderdevelopment has been delayed 2-3 months and is expected to be completedin Q2-2018.
Strengthened Balance Sheet
2017 Target Further reduce debt as a percentage of assets.
2017 Performance to-date Debt as a percentage of total assets was 51.4% at September 30, 2017,compared to 53.5% at December 31, 2016, primarily as a result of the April2017 redemption of the $46.0 million, 5.45% convertible debentures.
Q3-2017 Management's Discussion and AnalysisDollar amounts in thousands of Canadian dollars (except as noted)
9
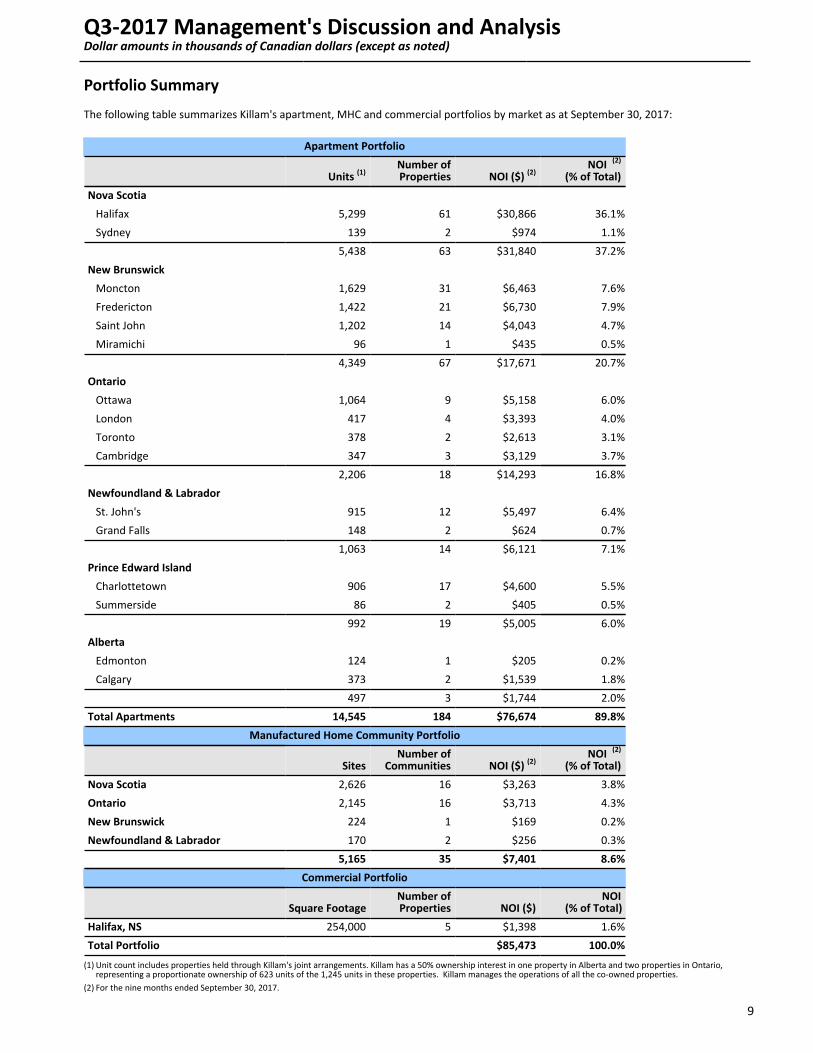
Portfolio Summary
The following table summarizes Killam's apartment, MHC and commercial portfolios by market as at September 30, 2017:
Apartment Portfolio
Units (1)Number ofProperties NOI ($) (2)
NOI (2) (% of Total)
Nova Scotia
Halifax 5,299 61 $30,866 36.1%
Sydney 139 2 $974 1.1%
5,438 63 $31,840 37.2%
New Brunswick
Moncton 1,629 31 $6,463 7.6%
Fredericton 1,422 21 $6,730 7.9%
Saint John 1,202 14 $4,043 4.7%
Miramichi 96 1 $435 0.5%
4,349 67 $17,671 20.7%
Ontario
Ottawa 1,064 9 $5,158 6.0%
London 417 4 $3,393 4.0%
Toronto 378 2 $2,613 3.1%
Cambridge 347 3 $3,129 3.7%
2,206 18 $14,293 16.8%
Newfoundland & Labrador
St. John's 915 12 $5,497 6.4%
Grand Falls 148 2 $624 0.7%
1,063 14 $6,121 7.1%
Prince Edward Island
Charlottetown 906 17 $4,600 5.5%
Summerside 86 2 $405 0.5%
992 19 $5,005 6.0%
Alberta
Edmonton 124 1 $205 0.2%
Calgary 373 2 $1,539 1.8%
497 3 $1,744 2.0%
Total Apartments 14,545 184 $76,674 89.8%
Manufactured Home Community Portfolio
SitesNumber of
Communities NOI ($) (2)NOI (2)
(% of Total)
Nova Scotia 2,626 16 $3,263 3.8%
Ontario 2,145 16 $3,713 4.3%
New Brunswick 224 1 $169 0.2%
Newfoundland & Labrador 170 2 $256 0.3%
5,165 35 $7,401 8.6%
Commercial Portfolio
Square FootageNumber ofProperties NOI ($)
NOI(% of Total)
Halifax, NS 254,000 5 $1,398 1.6%
Total Portfolio $85,473 100.0%
(1) Unit count includes properties held through Killam's joint arrangements. Killam has a 50% ownership interest in one property in Alberta and two properties in Ontario, representing a proportionate ownership of 623 units of the 1,245 units in these properties. Killam manages the operations of all the co-owned properties.
(2) For the nine months ended September 30, 2017.
Q3-2017 Management's Discussion and AnalysisDollar amounts in thousands of Canadian dollars (except as noted)
10
Core Market Update
Halifax36% of Killam’s total NOI is generated from its Halifax apartment portfolio. The city's rental market totals 46,097 units, accounting for 47.1% of the rental universe in Atlantic Canada as measured by the Canada Mortgage and Housing Corporation ("CMHC"). Halifax is the largest city in the region and home to 17% of Atlantic Canadians. It is the region’s economic hub, generating 56% of Nova Scotia’s GDP and housing 45% of the province’s population. The city attracts a diverse population base, from rural areas of Nova Scotia, other regions in Atlantic Canada and internationally. With six degree-granting universities and three large community college campuses, Halifax has approximately 36,000 students, including 6,000 international students. Halifax’s employment base is diversified, with the largest sector jobs focused on public service, health care, education and, retail and wholesale trade. Halifax is home to the largest Canadian Forces Base by number of personnel and the Department of National Defence is the city's largest single employer.
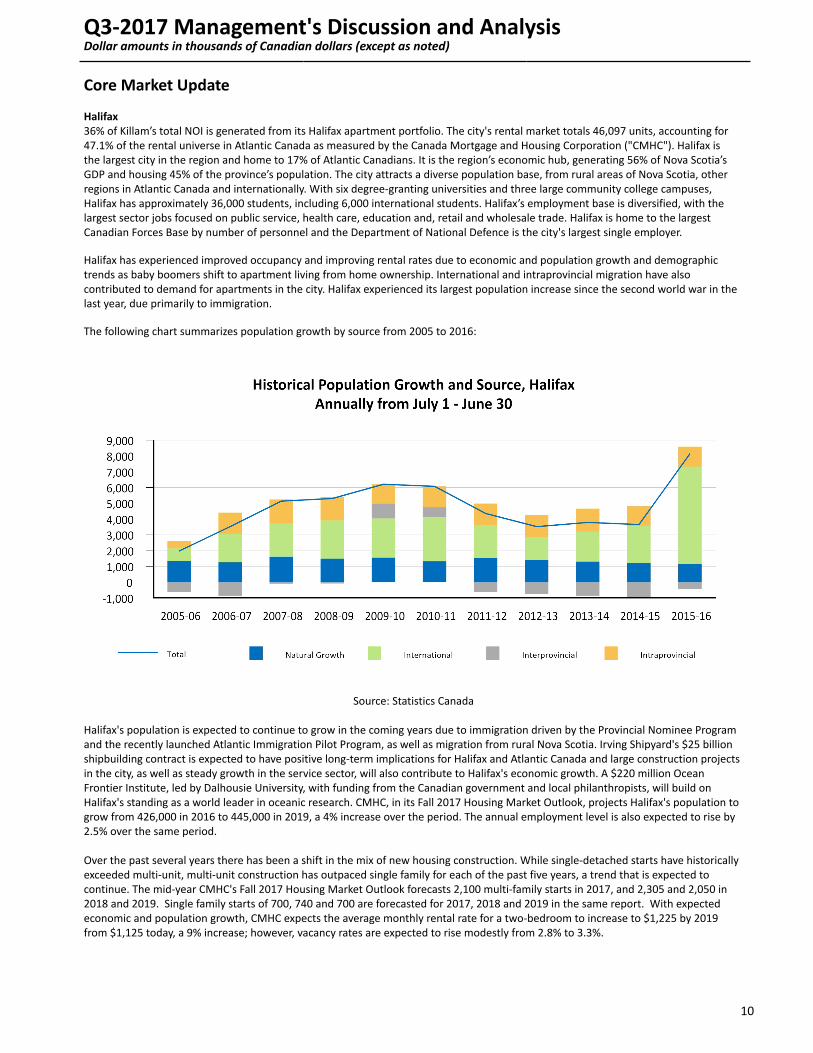
Halifax has experienced improved occupancy and improving rental rates due to economic and population growth and demographic trends as baby boomers shift to apartment living from home ownership. International and intraprovincial migration have also contributed to demand for apartments in the city. Halifax experienced its largest population increase since the second world war in the last year, due primarily to immigration.
The following chart summarizes population growth by source from 2005 to 2016:
Source: Statistics Canada
Halifax's population is expected to continue to grow in the coming years due to immigration driven by the Provincial Nominee Program and the recently launched Atlantic Immigration Pilot Program, as well as migration from rural Nova Scotia. Irving Shipyard's $25 billion shipbuilding contract is expected to have positive long-term implications for Halifax and Atlantic Canada and large construction projects in the city, as well as steady growth in the service sector, will also contribute to Halifax's economic growth. A $220 million Ocean Frontier Institute, led by Dalhousie University, with funding from the Canadian government and local philanthropists, will build on Halifax's standing as a world leader in oceanic research. CMHC, in its Fall 2017 Housing Market Outlook, projects Halifax's population to grow from 426,000 in 2016 to 445,000 in 2019, a 4% increase over the period. The annual employment level is also expected to rise by 2.5% over the same period.
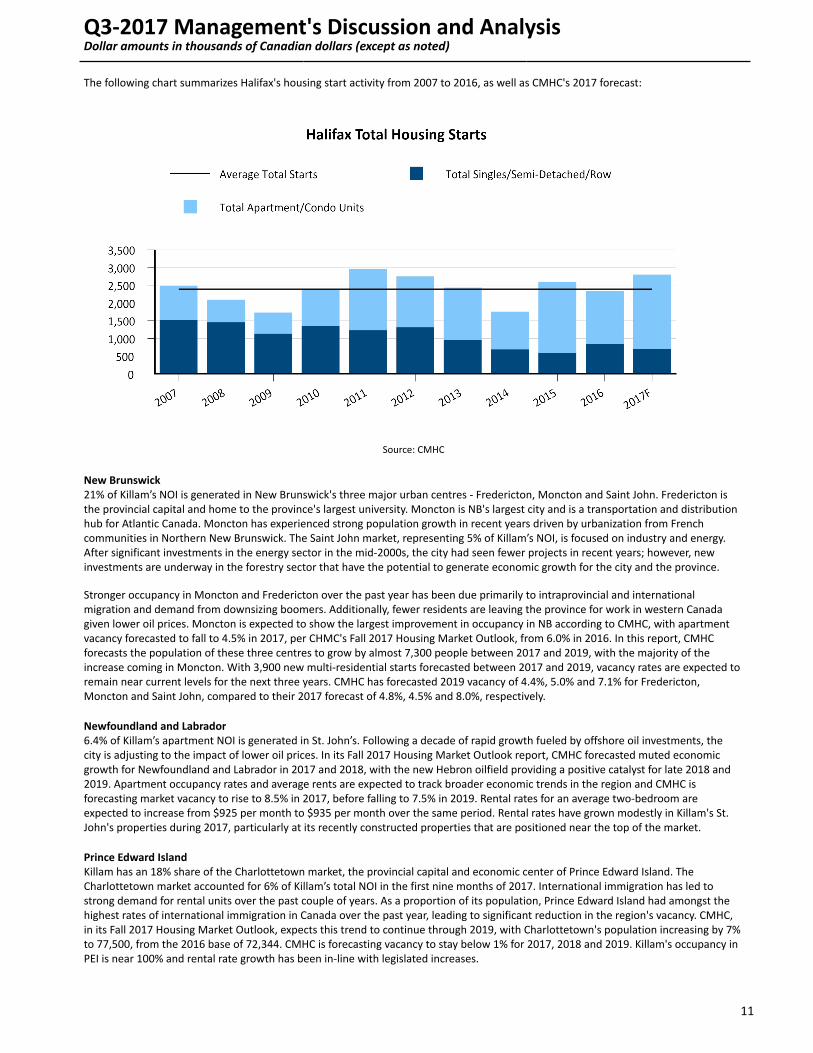
Over the past several years there has been a shift in the mix of new housing construction. While single-detached starts have historically exceeded multi-unit, multi-unit construction has outpaced single family for each of the past five years, a trend that is expected to continue. The mid-year CMHC's Fall 2017 Housing Market Outlook forecasts 2,100 multi-family starts in 2017, and 2,305 and 2,050 in 2018 and 2019. Single family starts of 700, 740 and 700 are forecasted for 2017, 2018 and 2019 in the same report. With expected economic and population growth, CMHC expects the average monthly rental rate for a two-bedroom to increase to $1,225 by 2019 from $1,125 today, a 9% increase; however, vacancy rates are expected to rise modestly from 2.8% to 3.3%.
Q3-2017 Management's Discussion and AnalysisDollar amounts in thousands of Canadian dollars (except as noted)
11
The following chart summarizes Halifax's housing start activity from 2007 to 2016, as well as CMHC's 2017 forecast:
Source: CMHC
New Brunswick21% of Killam’s NOI is generated in New Brunswick's three major urban centres - Fredericton, Moncton and Saint John. Fredericton is the provincial capital and home to the province's largest university. Moncton is NB's largest city and is a transportation and distribution hub for Atlantic Canada. Moncton has experienced strong population growth in recent years driven by urbanization from French communities in Northern New Brunswick. The Saint John market, representing 5% of Killam’s NOI, is focused on industry and energy. After significant investments in the energy sector in the mid-2000s, the city had seen fewer projects in recent years; however, new investments are underway in the forestry sector that have the potential to generate economic growth for the city and the province.
Stronger occupancy in Moncton and Fredericton over the past year has been due primarily to intraprovincial and international migration and demand from downsizing boomers. Additionally, fewer residents are leaving the province for work in western Canada given lower oil prices. Moncton is expected to show the largest improvement in occupancy in NB according to CMHC, with apartment vacancy forecasted to fall to 4.5% in 2017, per CHMC's Fall 2017 Housing Market Outlook, from 6.0% in 2016. In this report, CMHC forecasts the population of these three centres to grow by almost 7,300 people between 2017 and 2019, with the majority of the increase coming in Moncton. With 3,900 new multi-residential starts forecasted between 2017 and 2019, vacancy rates are expected to remain near current levels for the next three years. CMHC has forecasted 2019 vacancy of 4.4%, 5.0% and 7.1% for Fredericton, Moncton and Saint John, compared to their 2017 forecast of 4.8%, 4.5% and 8.0%, respectively.
Newfoundland and Labrador6.4% of Killam’s apartment NOI is generated in St. John’s. Following a decade of rapid growth fueled by offshore oil investments, the city is adjusting to the impact of lower oil prices. In its Fall 2017 Housing Market Outlook report, CMHC forecasted muted economic growth for Newfoundland and Labrador in 2017 and 2018, with the new Hebron oilfield providing a positive catalyst for late 2018 and 2019. Apartment occupancy rates and average rents are expected to track broader economic trends in the region and CMHC is forecasting market vacancy to rise to 8.5% in 2017, before falling to 7.5% in 2019. Rental rates for an average two-bedroom are expected to increase from $925 per month to $935 per month over the same period. Rental rates have grown modestly in Killam's St. John's properties during 2017, particularly at its recently constructed properties that are positioned near the top of the market.
Prince Edward IslandKillam has an 18% share of the Charlottetown market, the provincial capital and economic center of Prince Edward Island. The Charlottetown market accounted for 6% of Killam’s total NOI in the first nine months of 2017. International immigration has led to strong demand for rental units over the past couple of years. As a proportion of its population, Prince Edward Island had amongst the highest rates of international immigration in Canada over the past year, leading to significant reduction in the region's vacancy. CMHC, in its Fall 2017 Housing Market Outlook, expects this trend to continue through 2019, with Charlottetown's population increasing by 7% to 77,500, from the 2016 base of 72,344. CMHC is forecasting vacancy to stay below 1% for 2017, 2018 and 2019. Killam's occupancy in PEI is near 100% and rental rate growth has been in-line with legislated increases.
Q3-2017 Management's Discussion and AnalysisDollar amounts in thousands of Canadian dollars (except as noted)
12
OntarioKillam's Ontario apartment portfolio generated 17% of its NOI in the first nine months of 2017. The Ontario rental market is strong as the province continues to experience economic and population growth attributable to high levels of international immigration and a widening gap between the costs of home ownership and renting. CMHC reported a 2.7% increase in average rents for the overall Ontario rental market and a 10 bps point reduction in vacancy compared to 2016 in its Fall 2017 Housing Market Outlook. CMHC projects that vacancy rates will remain near 2.0% through 2019 driven by higher housing prices, international migration and an aging population, and rental rates will increase by 4.7% over this period. Killam has seen strong rental rate growth in Ontario and consistent occupancy.
On May 18, 2017, the Government of Ontario passed the Rental Fairness Act, extending rent control to properties built after 1991. For 2017, rental increases on existing leases are limited to 1.5% with future rental rate increases pegged to inflation. On June 23, 2017, the rental increase ceiling was set at 1.8% for 2018. Landlords are expected to continue to increase rents to market on unit turns and the legislation is not expected to have a significant impact on Killam's investments in the province.
Alberta2% of Killam's NOI is earned in Alberta through its 50% interest in a Calgary high-rise apartment building; and the 66-unit low-rise complex acquired in January 2017, as well as the first phase of the Sherwood Park, Edmonton, property that closed in mid-August 2017. The Alberta rental market has softened over the past three years as a result of lower oil prices. CMHC is forecasting vacancy of 6.8% in 2017 for Calgary, a slight reduction from 2016, as economic activity is picking up in the city. Vacancy is forecasted to fall to 5.0% in 2019 as migration due to economic growth drives rental demand. Residential leasing activity has improved over the first nine months of 2017 and occupancy is up significantly at Killam's Calgary properties; however, rents are down 7% compared to the prior year. In Edmonton, CMHC is expecting vacancy to fall to 5.2% by 2019 from the 2017 forecast of 6.9%, as stronger employment leads to population growth in this city.
Q3-2017 Management's Discussion and AnalysisDollar amounts in thousands of Canadian dollars (except as noted)
13
PART III
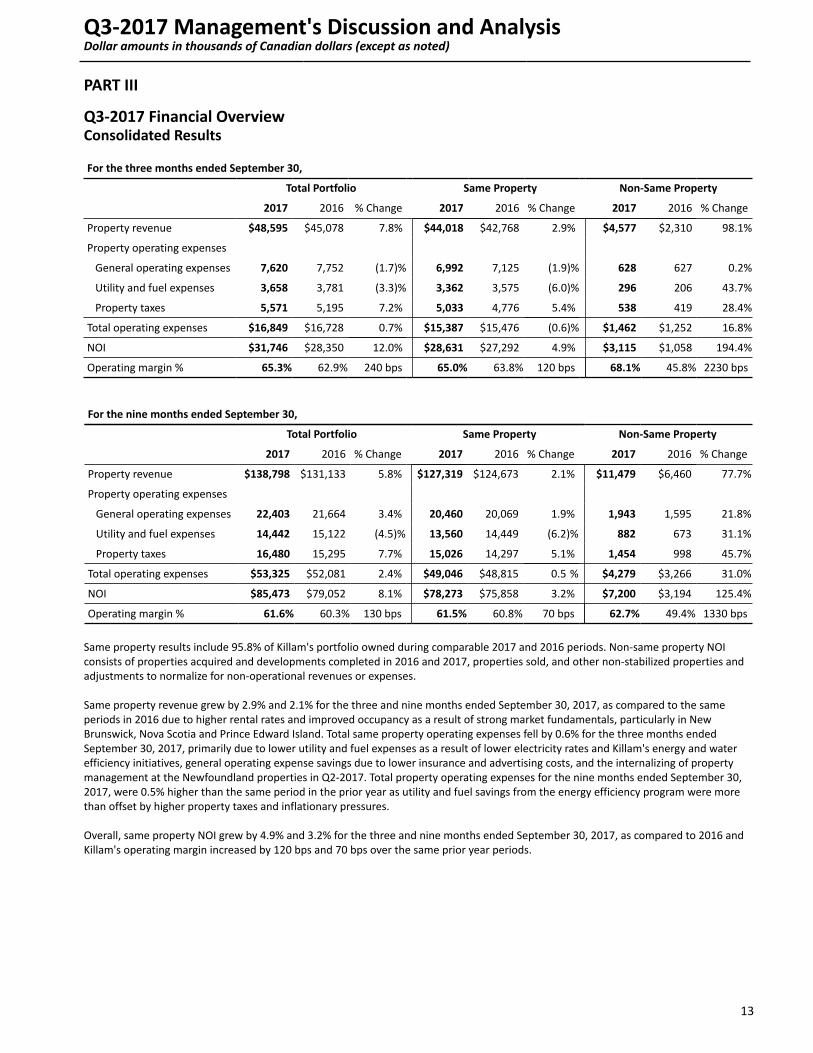
Q3-2017 Financial OverviewConsolidated Results
For the three months ended September 30,
Total Portfolio Same Property Non-Same Property
2017 2016 % Change 2017 2016 % Change 2017 2016 % Change
Property revenue $48,595 $45,078 7.8% $44,018 $42,768 2.9% $4,577 $2,310 98.1%
Property operating expenses
General operating expenses 7,620 7,752 (1.7)% 6,992 7,125 (1.9)% 628 627 0.2%
Utility and fuel expenses 3,658 3,781 (3.3)% 3,362 3,575 (6.0)% 296 206 43.7%
Property taxes 5,571 5,195 7.2% 5,033 4,776 5.4% 538 419 28.4%
Total operating expenses $16,849 $16,728 0.7% $15,387 $15,476 (0.6)% $1,462 $1,252 16.8%
NOI $31,746 $28,350 12.0% $28,631 $27,292 4.9% $3,115 $1,058 194.4%
Operating margin % 65.3% 62.9% 240 bps 65.0% 63.8% 120 bps 68.1% 45.8% 2230 bps
For the nine months ended September 30,
Total Portfolio Same Property Non-Same Property
2017 2016 % Change 2017 2016 % Change 2017 2016 % Change
Property revenue $138,798 $131,133 5.8% $127,319 $124,673 2.1% $11,479 $6,460 77.7%
Property operating expenses
General operating expenses 22,403 21,664 3.4% 20,460 20,069 1.9% 1,943 1,595 21.8%
Utility and fuel expenses 14,442 15,122 (4.5)% 13,560 14,449 (6.2)% 882 673 31.1%
Property taxes 16,480 15,295 7.7% 15,026 14,297 5.1% 1,454 998 45.7%
Total operating expenses $53,325 $52,081 2.4% $49,046 $48,815 0.5 % $4,279 $3,266 31.0%
NOI $85,473 $79,052 8.1% $78,273 $75,858 3.2% $7,200 $3,194 125.4%
Operating margin % 61.6% 60.3% 130 bps 61.5% 60.8% 70 bps 62.7% 49.4% 1330 bps
Same property results include 95.8% of Killam's portfolio owned during comparable 2017 and 2016 periods. Non-same property NOI consists of properties acquired and developments completed in 2016 and 2017, properties sold, and other non-stabilized properties and adjustments to normalize for non-operational revenues or expenses.
Same property revenue grew by 2.9% and 2.1% for the three and nine months ended September 30, 2017, as compared to the same periods in 2016 due to higher rental rates and improved occupancy as a result of strong market fundamentals, particularly in New Brunswick, Nova Scotia and Prince Edward Island. Total same property operating expenses fell by 0.6% for the three months ended September 30, 2017, primarily due to lower utility and fuel expenses as a result of lower electricity rates and Killam's energy and water efficiency initiatives, general operating expense savings due to lower insurance and advertising costs, and the internalizing of property management at the Newfoundland properties in Q2-2017. Total property operating expenses for the nine months ended September 30, 2017, were 0.5% higher than the same period in the prior year as utility and fuel savings from the energy efficiency program were more than offset by higher property taxes and inflationary pressures.
Overall, same property NOI grew by 4.9% and 3.2% for the three and nine months ended September 30, 2017, as compared to 2016 and Killam's operating margin increased by 120 bps and 70 bps over the same prior year periods.
Q3-2017 Management's Discussion and AnalysisDollar amounts in thousands of Canadian dollars (except as noted)
14
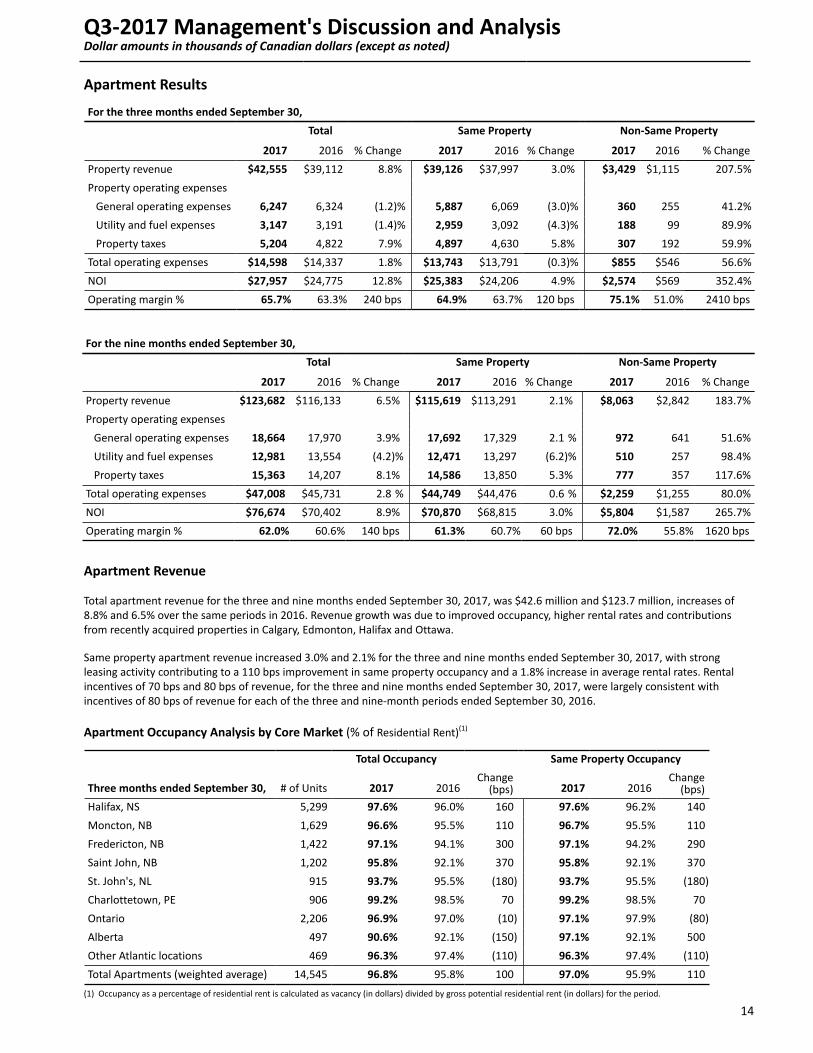
Apartment Results
For the three months ended September 30,
Total Same Property Non-Same Property
2017 2016 % Change 2017 2016 % Change 2017 2016 % Change
Property revenue $42,555 $39,112 8.8% $39,126 $37,997 3.0% $3,429 $1,115 207.5%
Property operating expenses
General operating expenses 6,247 6,324 (1.2)% 5,887 6,069 (3.0)% 360 255 41.2%
Utility and fuel expenses 3,147 3,191 (1.4)% 2,959 3,092 (4.3)% 188 99 89.9%
Property taxes 5,204 4,822 7.9% 4,897 4,630 5.8% 307 192 59.9%
Total operating expenses $14,598 $14,337 1.8% $13,743 $13,791 (0.3)% $855 $546 56.6%
NOI $27,957 $24,775 12.8% $25,383 $24,206 4.9% $2,574 $569 352.4%
Operating margin % 65.7% 63.3% 240 bps 64.9% 63.7% 120 bps 75.1% 51.0% 2410 bps
For the nine months ended September 30,
Total Same Property Non-Same Property
2017 2016 % Change 2017 2016 % Change 2017 2016 % Change
Property revenue $123,682 $116,133 6.5% $115,619 $113,291 2.1% $8,063 $2,842 183.7%
Property operating expenses
General operating expenses 18,664 17,970 3.9% 17,692 17,329 2.1 % 972 641 51.6%
Utility and fuel expenses 12,981 13,554 (4.2)% 12,471 13,297 (6.2)% 510 257 98.4%
Property taxes 15,363 14,207 8.1% 14,586 13,850 5.3% 777 357 117.6%
Total operating expenses $47,008 $45,731 2.8 % $44,749 $44,476 0.6 % $2,259 $1,255 80.0%
NOI $76,674 $70,402 8.9% $70,870 $68,815 3.0% $5,804 $1,587 265.7%
Operating margin % 62.0% 60.6% 140 bps 61.3% 60.7% 60 bps 72.0% 55.8% 1620 bps
Apartment Revenue
Total apartment revenue for the three and nine months ended September 30, 2017, was $42.6 million and $123.7 million, increases of 8.8% and 6.5% over the same periods in 2016. Revenue growth was due to improved occupancy, higher rental rates and contributions from recently acquired properties in Calgary, Edmonton, Halifax and Ottawa.
Same property apartment revenue increased 3.0% and 2.1% for the three and nine months ended September 30, 2017, with strong leasing activity contributing to a 110 bps improvement in same property occupancy and a 1.8% increase in average rental rates. Rental incentives of 70 bps and 80 bps of revenue, for the three and nine months ended September 30, 2017, were largely consistent with incentives of 80 bps of revenue for each of the three and nine-month periods ended September 30, 2016.
Apartment Occupancy Analysis by Core Market (% of Residential Rent)(1)
Total Occupancy Same Property Occupancy
Three months ended September 30, # of Units 2017 2016Change
(bps) 2017 2016Change
(bps)
Halifax, NS 5,299 97.6% 96.0% 160 97.6% 96.2% 140
Moncton, NB 1,629 96.6% 95.5% 110 96.7% 95.5% 110
Fredericton, NB 1,422 97.1% 94.1% 300 97.1% 94.2% 290
Saint John, NB 1,202 95.8% 92.1% 370 95.8% 92.1% 370
St. John's, NL 915 93.7% 95.5% (180) 93.7% 95.5% (180)
Charlottetown, PE 906 99.2% 98.5% 70 99.2% 98.5% 70
Ontario 2,206 96.9% 97.0% (10) 97.1% 97.9% (80)
Alberta 497 90.6% 92.1% (150) 97.1% 92.1% 500
Other Atlantic locations 469 96.3% 97.4% (110) 96.3% 97.4% (110)
Total Apartments (weighted average) 14,545 96.8% 95.8% 100 97.0% 95.9% 110
(1) Occupancy as a percentage of residential rent is calculated as vacancy (in dollars) divided by gross potential residential rent (in dollars) for the period.
Q3-2017 Management's Discussion and AnalysisDollar amounts in thousands of Canadian dollars (except as noted)
15
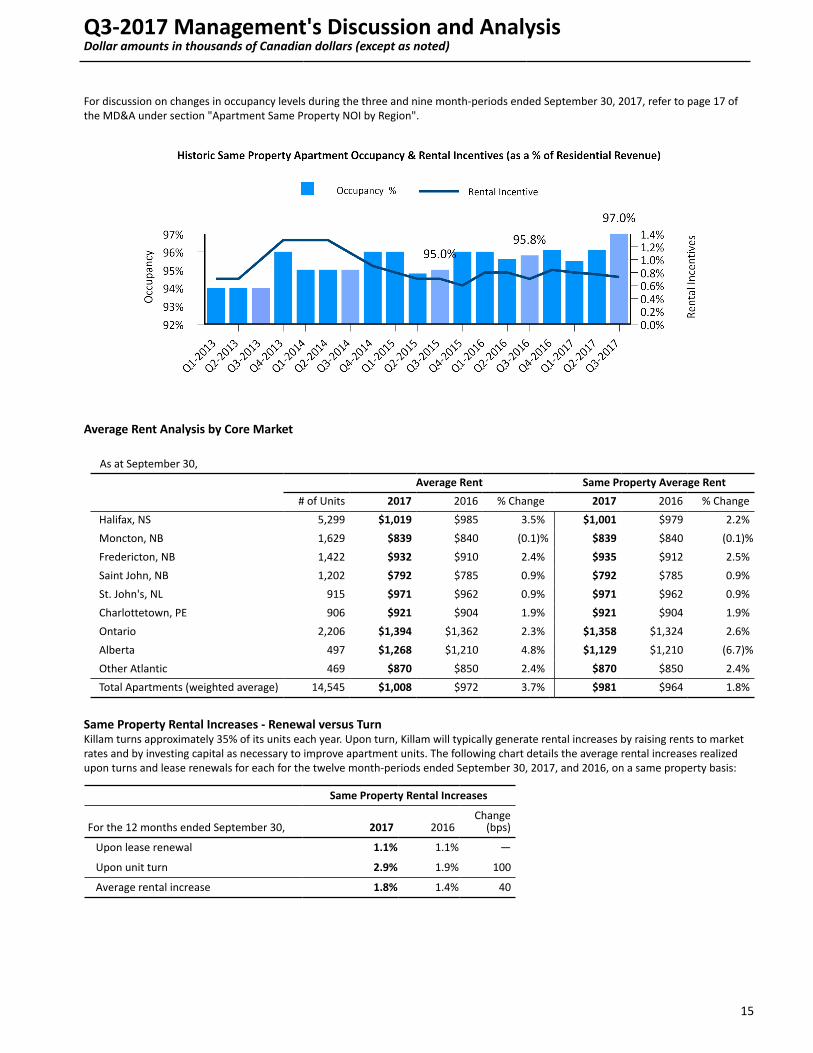
For discussion on changes in occupancy levels during the three and nine month-periods ended September 30, 2017, refer to page 17 of the MD&A under section "Apartment Same Property NOI by Region".
Average Rent Analysis by Core Market
As at September 30,
Average Rent Same Property Average Rent
# of Units 2017 2016 % Change 2017 2016 % Change
Halifax, NS 5,299 $1,019 $985 3.5% $1,001 $979 2.2%
Moncton, NB 1,629 $839 $840 (0.1)% $839 $840 (0.1)%
Fredericton, NB 1,422 $932 $910 2.4% $935 $912 2.5%
Saint John, NB 1,202 $792 $785 0.9% $792 $785 0.9%
St. John's, NL 915 $971 $962 0.9% $971 $962 0.9%
Charlottetown, PE 906 $921 $904 1.9% $921 $904 1.9%
Ontario 2,206 $1,394 $1,362 2.3% $1,358 $1,324 2.6%
Alberta 497 $1,268 $1,210 4.8% $1,129 $1,210 (6.7)%
Other Atlantic 469 $870 $850 2.4% $870 $850 2.4%
Total Apartments (weighted average) 14,545 $1,008 $972 3.7% $981 $964 1.8%
Same Property Rental Increases - Renewal versus TurnKillam turns approximately 35% of its units each year. Upon turn, Killam will typically generate rental increases by raising rents to market rates and by investing capital as necessary to improve apartment units. The following chart details the average rental increases realized upon turns and lease renewals for each for the twelve month-periods ended September 30, 2017, and 2016, on a same property basis:
Same Property Rental Increases
For the 12 months ended September 30, 2017 2016Change
(bps)
Upon lease renewal 1.1% 1.1% —
Upon unit turn 2.9% 1.9% 100
Average rental increase 1.8% 1.4% 40
Q3-2017 Management's Discussion and AnalysisDollar amounts in thousands of Canadian dollars (except as noted)
16
Apartment ExpensesTotal same property operating expenses for the three months ended September 30, 2017, were 0.3% lower than the same period in 2016 due to lower insurance and marketing costs, net savings from internalizing property management in Newfoundland in Q2-2017, and lower utility costs. These savings more than offset property tax increases from higher assessments and other inflationary pressures. Total same property operating expenses for the nine months ended September 30, 2017, were only 0.6% higher than the comparative period in 2016 as lower natural gas costs in Nova Scotia in Q1, and savings in utilities due to lower consumption from the energy efficiency program offset higher insurance premiums in the first half of the year, as well as, higher property taxes due to increased assessments.
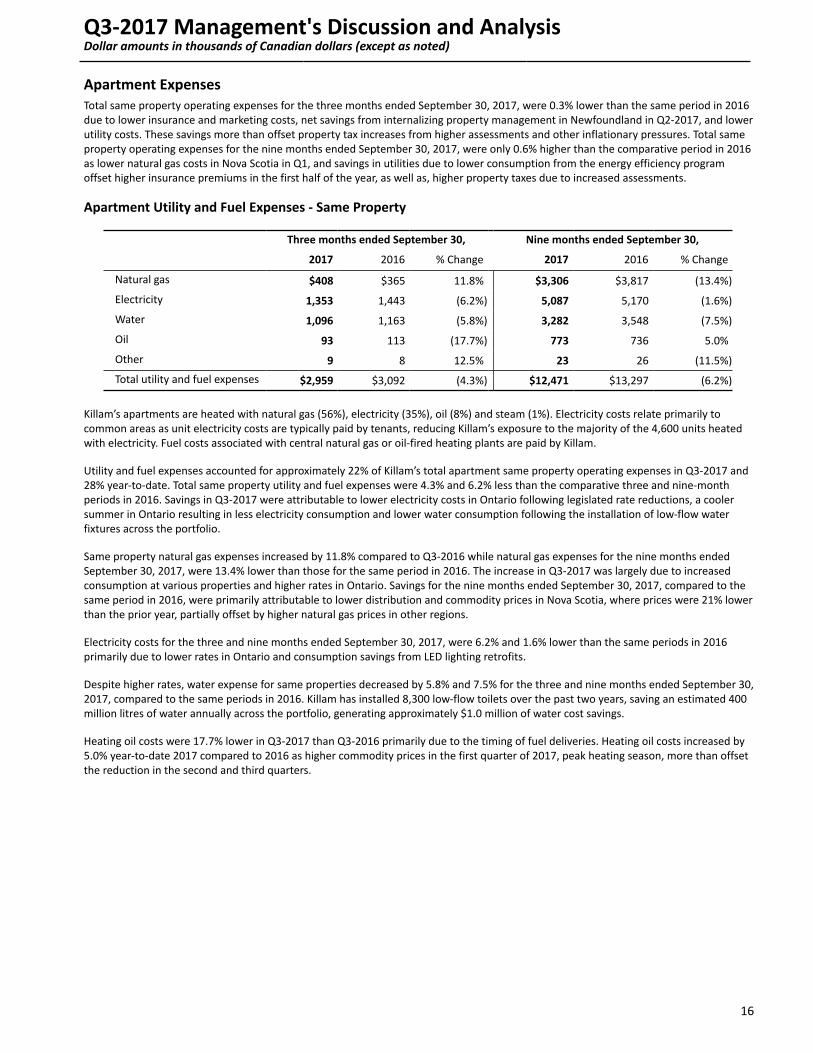
Apartment Utility and Fuel Expenses - Same Property
Three months ended September 30, Nine months ended September 30,
2017 2016 % Change 2017 2016 % Change
Natural gas $408 $365 11.8% $3,306 $3,817 (13.4%)
Electricity 1,353 1,443 (6.2%) 5,087 5,170 (1.6%)
Water 1,096 1,163 (5.8%) 3,282 3,548 (7.5%)
Oil 93 113 (17.7%) 773 736 5.0%
Other 9 8 12.5% 23 26 (11.5%)
Total utility and fuel expenses $2,959 $3,092 (4.3%) $12,471 $13,297 (6.2%)
Killam’s apartments are heated with natural gas (56%), electricity (35%), oil (8%) and steam (1%). Electricity costs relate primarily to common areas as unit electricity costs are typically paid by tenants, reducing Killam’s exposure to the majority of the 4,600 units heated with electricity. Fuel costs associated with central natural gas or oil-fired heating plants are paid by Killam.
Utility and fuel expenses accounted for approximately 22% of Killam’s total apartment same property operating expenses in Q3-2017 and 28% year-to-date. Total same property utility and fuel expenses were 4.3% and 6.2% less than the comparative three and nine-month periods in 2016. Savings in Q3-2017 were attributable to lower electricity costs in Ontario following legislated rate reductions, a cooler summer in Ontario resulting in less electricity consumption and lower water consumption following the installation of low-flow water fixtures across the portfolio.
Same property natural gas expenses increased by 11.8% compared to Q3-2016 while natural gas expenses for the nine months ended September 30, 2017, were 13.4% lower than those for the same period in 2016. The increase in Q3-2017 was largely due to increased consumption at various properties and higher rates in Ontario. Savings for the nine months ended September 30, 2017, compared to the same period in 2016, were primarily attributable to lower distribution and commodity prices in Nova Scotia, where prices were 21% lower than the prior year, partially offset by higher natural gas prices in other regions.
Electricity costs for the three and nine months ended September 30, 2017, were 6.2% and 1.6% lower than the same periods in 2016 primarily due to lower rates in Ontario and consumption savings from LED lighting retrofits.
Despite higher rates, water expense for same properties decreased by 5.8% and 7.5% for the three and nine months ended September 30, 2017, compared to the same periods in 2016. Killam has installed 8,300 low-flow toilets over the past two years, saving an estimated 400 million litres of water annually across the portfolio, generating approximately $1.0 million of water cost savings.
Heating oil costs were 17.7% lower in Q3-2017 than Q3-2016 primarily due to the timing of fuel deliveries. Heating oil costs increased by 5.0% year-to-date 2017 compared to 2016 as higher commodity prices in the first quarter of 2017, peak heating season, more than offset the reduction in the second and third quarters.
Q3-2017 Management's Discussion and AnalysisDollar amounts in thousands of Canadian dollars (except as noted)
17
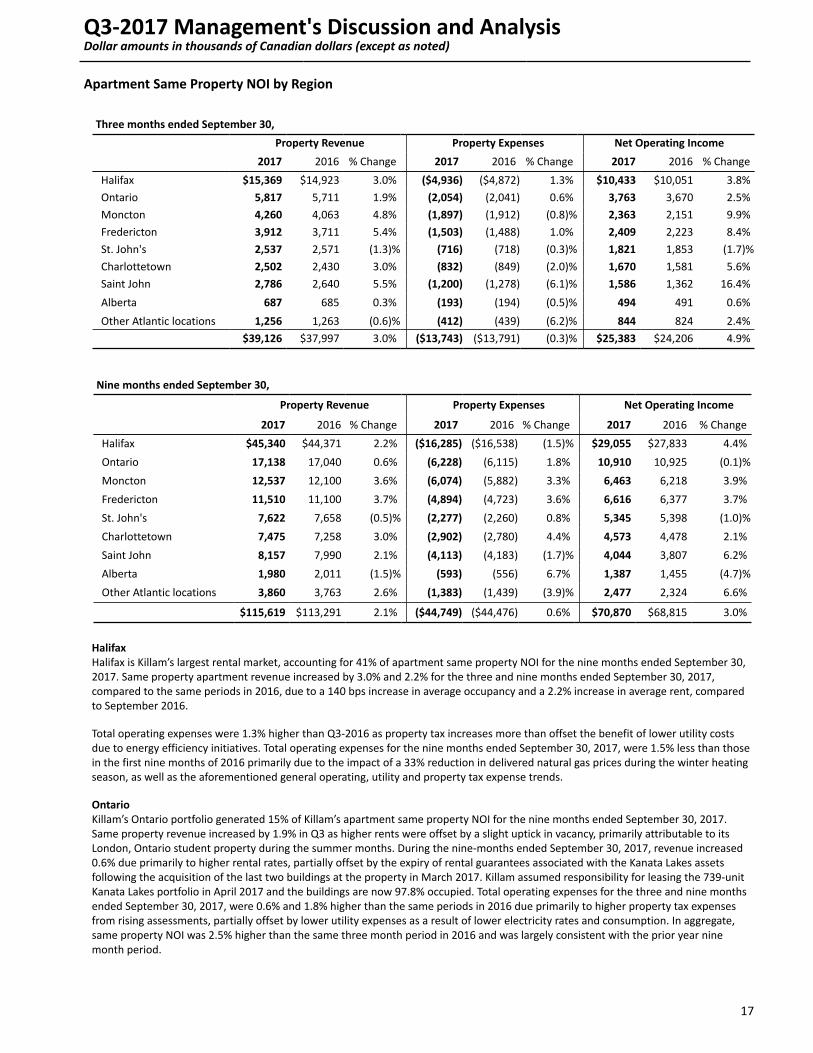
Apartment Same Property NOI by Region
Three months ended September 30,
Property Revenue Property Expenses Net Operating Income
2017 2016 % Change 2017 2016 % Change 2017 2016 % Change
Halifax $15,369 $14,923 3.0% ($4,936) ($4,872) 1.3% $10,433 $10,051 3.8%
Ontario 5,817 5,711 1.9% (2,054) (2,041) 0.6% 3,763 3,670 2.5%
Moncton 4,260 4,063 4.8% (1,897) (1,912) (0.8)% 2,363 2,151 9.9%
Fredericton 3,912 3,711 5.4% (1,503) (1,488) 1.0% 2,409 2,223 8.4%
St. John's 2,537 2,571 (1.3)% (716) (718) (0.3)% 1,821 1,853 (1.7)%
Charlottetown 2,502 2,430 3.0% (832) (849) (2.0)% 1,670 1,581 5.6%
Saint John 2,786 2,640 5.5% (1,200) (1,278) (6.1)% 1,586 1,362 16.4%
Alberta 687 685 0.3% (193) (194) (0.5)% 494 491 0.6%
Other Atlantic locations 1,256 1,263 (0.6)% (412) (439) (6.2)% 844 824 2.4%
$39,126 $37,997 3.0% ($13,743) ($13,791) (0.3)% $25,383 $24,206 4.9%
Nine months ended September 30,
Property Revenue Property Expenses Net Operating Income
2017 2016 % Change 2017 2016 % Change 2017 2016 % Change
Halifax $45,340 $44,371 2.2% ($16,285) ($16,538) (1.5)% $29,055 $27,833 4.4%
Ontario 17,138 17,040 0.6% (6,228) (6,115) 1.8% 10,910 10,925 (0.1)%
Moncton 12,537 12,100 3.6% (6,074) (5,882) 3.3% 6,463 6,218 3.9%
Fredericton 11,510 11,100 3.7% (4,894) (4,723) 3.6% 6,616 6,377 3.7%
St. John's 7,622 7,658 (0.5)% (2,277) (2,260) 0.8% 5,345 5,398 (1.0)%
Charlottetown 7,475 7,258 3.0% (2,902) (2,780) 4.4% 4,573 4,478 2.1%
Saint John 8,157 7,990 2.1% (4,113) (4,183) (1.7)% 4,044 3,807 6.2%
Alberta 1,980 2,011 (1.5)% (593) (556) 6.7% 1,387 1,455 (4.7)%
Other Atlantic locations 3,860 3,763 2.6% (1,383) (1,439) (3.9)% 2,477 2,324 6.6%
$115,619 $113,291 2.1% ($44,749) ($44,476) 0.6% $70,870 $68,815 3.0%
HalifaxHalifax is Killam’s largest rental market, accounting for 41% of apartment same property NOI for the nine months ended September 30, 2017. Same property apartment revenue increased by 3.0% and 2.2% for the three and nine months ended September 30, 2017, compared to the same periods in 2016, due to a 140 bps increase in average occupancy and a 2.2% increase in average rent, compared to September 2016.
Total operating expenses were 1.3% higher than Q3-2016 as property tax increases more than offset the benefit of lower utility costs due to energy efficiency initiatives. Total operating expenses for the nine months ended September 30, 2017, were 1.5% less than those in the first nine months of 2016 primarily due to the impact of a 33% reduction in delivered natural gas prices during the winter heating season, as well as the aforementioned general operating, utility and property tax expense trends.
OntarioKillam’s Ontario portfolio generated 15% of Killam’s apartment same property NOI for the nine months ended September 30, 2017. Same property revenue increased by 1.9% in Q3 as higher rents were offset by a slight uptick in vacancy, primarily attributable to its London, Ontario student property during the summer months. During the nine-months ended September 30, 2017, revenue increased 0.6% due primarily to higher rental rates, partially offset by the expiry of rental guarantees associated with the Kanata Lakes assets following the acquisition of the last two buildings at the property in March 2017. Killam assumed responsibility for leasing the 739-unit Kanata Lakes portfolio in April 2017 and the buildings are now 97.8% occupied. Total operating expenses for the three and nine months ended September 30, 2017, were 0.6% and 1.8% higher than the same periods in 2016 due primarily to higher property tax expenses from rising assessments, partially offset by lower utility expenses as a result of lower electricity rates and consumption. In aggregate, same property NOI was 2.5% higher than the same three month period in 2016 and was largely consistent with the prior year nine month period.
Q3-2017 Management's Discussion and AnalysisDollar amounts in thousands of Canadian dollars (except as noted)
18
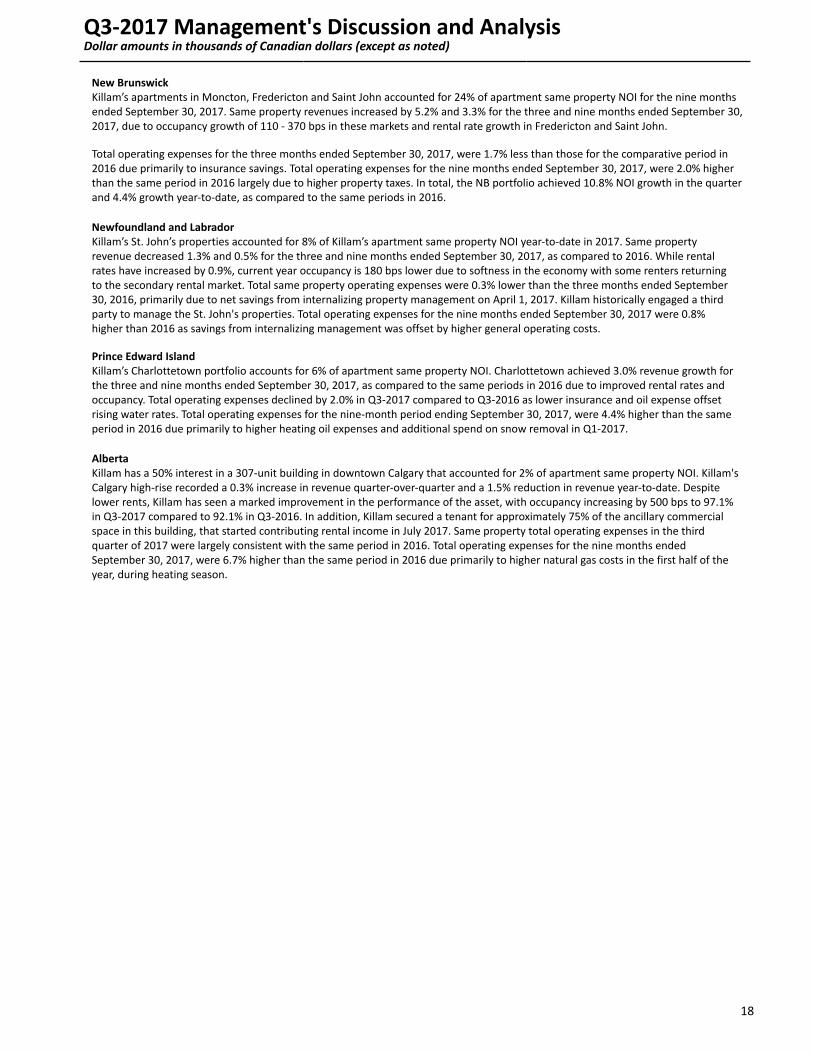
New BrunswickKillam’s apartments in Moncton, Fredericton and Saint John accounted for 24% of apartment same property NOI for the nine months ended September 30, 2017. Same property revenues increased by 5.2% and 3.3% for the three and nine months ended September 30, 2017, due to occupancy growth of 110 - 370 bps in these markets and rental rate growth in Fredericton and Saint John.
Total operating expenses for the three months ended September 30, 2017, were 1.7% less than those for the comparative period in 2016 due primarily to insurance savings. Total operating expenses for the nine months ended September 30, 2017, were 2.0% higher than the same period in 2016 largely due to higher property taxes. In total, the NB portfolio achieved 10.8% NOI growth in the quarter and 4.4% growth year-to-date, as compared to the same periods in 2016.
Newfoundland and LabradorKillam’s St. John’s properties accounted for 8% of Killam’s apartment same property NOI year-to-date in 2017. Same property revenue decreased 1.3% and 0.5% for the three and nine months ended September 30, 2017, as compared to 2016. While rental rates have increased by 0.9%, current year occupancy is 180 bps lower due to softness in the economy with some renters returning to the secondary rental market. Total same property operating expenses were 0.3% lower than the three months ended September 30, 2016, primarily due to net savings from internalizing property management on April 1, 2017. Killam historically engaged a third party to manage the St. John's properties. Total operating expenses for the nine months ended September 30, 2017 were 0.8% higher than 2016 as savings from internalizing management was offset by higher general operating costs.
Prince Edward IslandKillam’s Charlottetown portfolio accounts for 6% of apartment same property NOI. Charlottetown achieved 3.0% revenue growth for the three and nine months ended September 30, 2017, as compared to the same periods in 2016 due to improved rental rates and occupancy. Total operating expenses declined by 2.0% in Q3-2017 compared to Q3-2016 as lower insurance and oil expense offset rising water rates. Total operating expenses for the nine-month period ending September 30, 2017, were 4.4% higher than the same period in 2016 due primarily to higher heating oil expenses and additional spend on snow removal in Q1-2017.
AlbertaKillam has a 50% interest in a 307-unit building in downtown Calgary that accounted for 2% of apartment same property NOI. Killam's Calgary high-rise recorded a 0.3% increase in revenue quarter-over-quarter and a 1.5% reduction in revenue year-to-date. Despite lower rents, Killam has seen a marked improvement in the performance of the asset, with occupancy increasing by 500 bps to 97.1% in Q3-2017 compared to 92.1% in Q3-2016. In addition, Killam secured a tenant for approximately 75% of the ancillary commercial space in this building, that started contributing rental income in July 2017. Same property total operating expenses in the third quarter of 2017 were largely consistent with the same period in 2016. Total operating expenses for the nine months ended September 30, 2017, were 6.7% higher than the same period in 2016 due primarily to higher natural gas costs in the first half of the year, during heating season.
Q3-2017 Management's Discussion and AnalysisDollar amounts in thousands of Canadian dollars (except as noted)
19
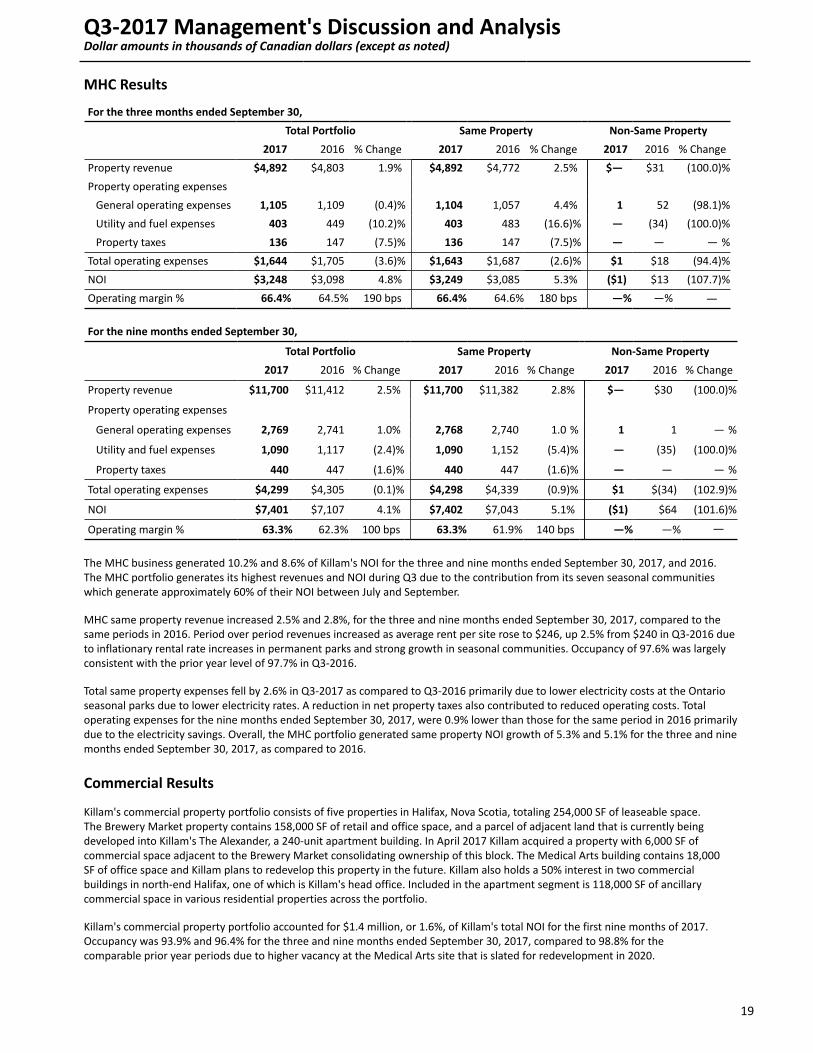
MHC Results
For the three months ended September 30,
Total Portfolio Same Property Non-Same Property
2017 2016 % Change 2017 2016 % Change 2017 2016 % Change
Property revenue $4,892 $4,803 1.9% $4,892 $4,772 2.5% $— $31 (100.0)%
Property operating expenses
General operating expenses 1,105 1,109 (0.4)% 1,104 1,057 4.4% 1 52 (98.1)%
Utility and fuel expenses 403 449 (10.2)% 403 483 (16.6)% — (34) (100.0)%
Property taxes 136 147 (7.5)% 136 147 (7.5)% — — — %
Total operating expenses $1,644 $1,705 (3.6)% $1,643 $1,687 (2.6)% $1 $18 (94.4)%
NOI $3,248 $3,098 4.8% $3,249 $3,085 5.3% ($1) $13 (107.7)%
Operating margin % 66.4% 64.5% 190 bps 66.4% 64.6% 180 bps —% —% —
For the nine months ended September 30,
Total Portfolio Same Property Non-Same Property
2017 2016 % Change 2017 2016 % Change 2017 2016 % Change
Property revenue $11,700 $11,412 2.5% $11,700 $11,382 2.8% $— $30 (100.0)%
Property operating expenses
General operating expenses 2,769 2,741 1.0% 2,768 2,740 1.0 % 1 1 — %
Utility and fuel expenses 1,090 1,117 (2.4)% 1,090 1,152 (5.4)% — (35) (100.0)%
Property taxes 440 447 (1.6)% 440 447 (1.6)% — — — %
Total operating expenses $4,299 $4,305 (0.1)% $4,298 $4,339 (0.9)% $1 $(34) (102.9)%
NOI $7,401 $7,107 4.1% $7,402 $7,043 5.1% ($1) $64 (101.6)%
Operating margin % 63.3% 62.3% 100 bps 63.3% 61.9% 140 bps —% —% —
The MHC business generated 10.2% and 8.6% of Killam's NOI for the three and nine months ended September 30, 2017, and 2016. The MHC portfolio generates its highest revenues and NOI during Q3 due to the contribution from its seven seasonal communities which generate approximately 60% of their NOI between July and September.
MHC same property revenue increased 2.5% and 2.8%, for the three and nine months ended September 30, 2017, compared to the same periods in 2016. Period over period revenues increased as average rent per site rose to $246, up 2.5% from $240 in Q3-2016 due to inflationary rental rate increases in permanent parks and strong growth in seasonal communities. Occupancy of 97.6% was largely consistent with the prior year level of 97.7% in Q3-2016.
Total same property expenses fell by 2.6% in Q3-2017 as compared to Q3-2016 primarily due to lower electricity costs at the Ontario seasonal parks due to lower electricity rates. A reduction in net property taxes also contributed to reduced operating costs. Total operating expenses for the nine months ended September 30, 2017, were 0.9% lower than those for the same period in 2016 primarily due to the electricity savings. Overall, the MHC portfolio generated same property NOI growth of 5.3% and 5.1% for the three and nine months ended September 30, 2017, as compared to 2016.
Commercial Results
Killam's commercial property portfolio consists of five properties in Halifax, Nova Scotia, totaling 254,000 SF of leaseable space. The Brewery Market property contains 158,000 SF of retail and office space, and a parcel of adjacent land that is currently being developed into Killam's The Alexander, a 240-unit apartment building. In April 2017 Killam acquired a property with 6,000 SF of commercial space adjacent to the Brewery Market consolidating ownership of this block. The Medical Arts building contains 18,000 SF of office space and Killam plans to redevelop this property in the future. Killam also holds a 50% interest in two commercial buildings in north-end Halifax, one of which is Killam's head office. Included in the apartment segment is 118,000 SF of ancillary commercial space in various residential properties across the portfolio.
Killam's commercial property portfolio accounted for $1.4 million, or 1.6%, of Killam's total NOI for the first nine months of 2017. Occupancy was 93.9% and 96.4% for the three and nine months ended September 30, 2017, compared to 98.8% for the comparable prior year periods due to higher vacancy at the Medical Arts site that is slated for redevelopment in 2020.
Q3-2017 Management's Discussion and AnalysisDollar amounts in thousands of Canadian dollars (except as noted)
20
PART IV
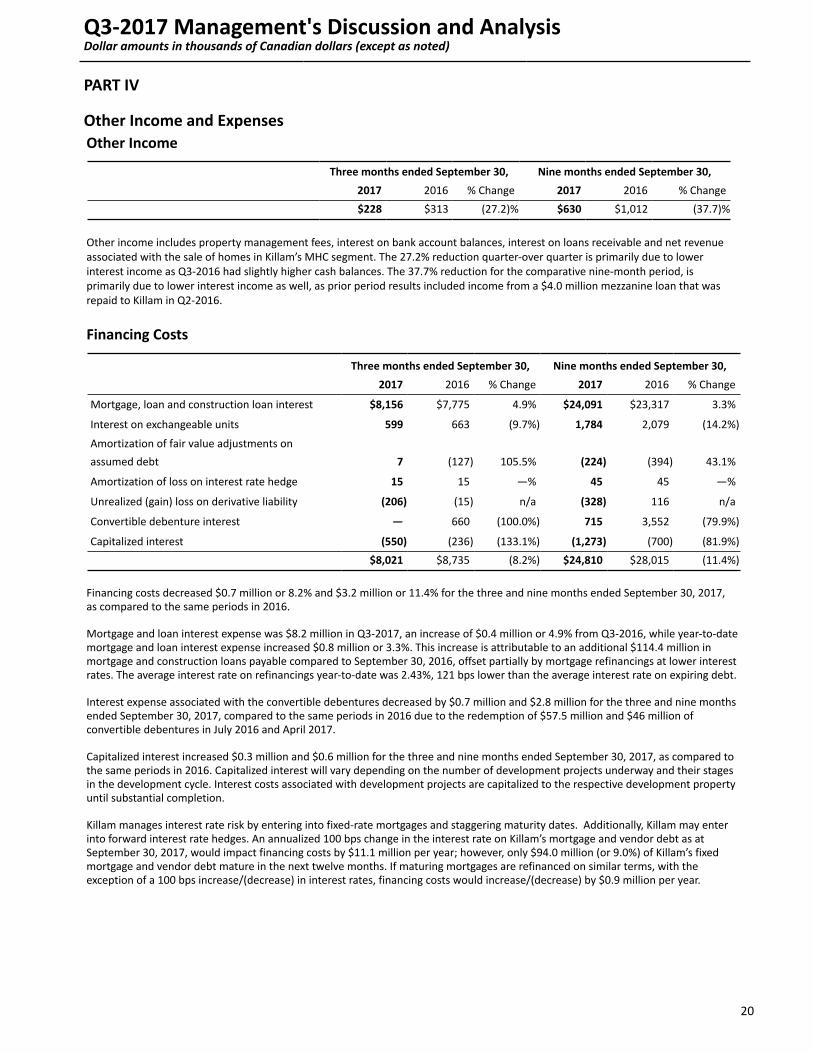
Other Income and ExpensesOther Income
Three months ended September 30, Nine months ended September 30,
2017 2016 % Change 2017 2016 % Change
$228 $313 (27.2)% $630 $1,012 (37.7)%
Other income includes property management fees, interest on bank account balances, interest on loans receivable and net revenue associated with the sale of homes in Killam’s MHC segment. The 27.2% reduction quarter-over quarter is primarily due to lower interest income as Q3-2016 had slightly higher cash balances. The 37.7% reduction for the comparative nine-month period, is primarily due to lower interest income as well, as prior period results included income from a $4.0 million mezzanine loan that was repaid to Killam in Q2-2016.
Financing Costs
Three months ended September 30, Nine months ended September 30,
2017 2016 % Change 2017 2016 % Change
Mortgage, loan and construction loan interest $8,156 $7,775 4.9% $24,091 $23,317 3.3%
Interest on exchangeable units 599 663 (9.7%) 1,784 2,079 (14.2%)
Amortization of fair value adjustments on
assumed debt 7 (127) 105.5% (224) (394) 43.1%
Amortization of loss on interest rate hedge 15 15 —% 45 45 —%
Unrealized (gain) loss on derivative liability (206) (15) n/a (328) 116 n/a
Convertible debenture interest — 660 (100.0%) 715 3,552 (79.9%)
Capitalized interest (550) (236) (133.1%) (1,273) (700) (81.9%)
$8,021 $8,735 (8.2%) $24,810 $28,015 (11.4%)
Financing costs decreased $0.7 million or 8.2% and $3.2 million or 11.4% for the three and nine months ended September 30, 2017, as compared to the same periods in 2016.
Mortgage and loan interest expense was $8.2 million in Q3-2017, an increase of $0.4 million or 4.9% from Q3-2016, while year-to-date mortgage and loan interest expense increased $0.8 million or 3.3%. This increase is attributable to an additional $114.4 million in mortgage and construction loans payable compared to September 30, 2016, offset partially by mortgage refinancings at lower interest rates. The average interest rate on refinancings year-to-date was 2.43%, 121 bps lower than the average interest rate on expiring debt.
Interest expense associated with the convertible debentures decreased by $0.7 million and $2.8 million for the three and nine months ended September 30, 2017, compared to the same periods in 2016 due to the redemption of $57.5 million and $46 million of convertible debentures in July 2016 and April 2017.
Capitalized interest increased $0.3 million and $0.6 million for the three and nine months ended September 30, 2017, as compared to the same periods in 2016. Capitalized interest will vary depending on the number of development projects underway and their stages in the development cycle. Interest costs associated with development projects are capitalized to the respective development property until substantial completion.
Killam manages interest rate risk by entering into fixed-rate mortgages and staggering maturity dates. Additionally, Killam may enter into forward interest rate hedges. An annualized 100 bps change in the interest rate on Killam’s mortgage and vendor debt as at September 30, 2017, would impact financing costs by $11.1 million per year; however, only $94.0 million (or 9.0%) of Killam’s fixed mortgage and vendor debt mature in the next twelve months. If maturing mortgages are refinanced on similar terms, with the exception of a 100 bps increase/(decrease) in interest rates, financing costs would increase/(decrease) by $0.9 million per year.
Q3-2017 Management's Discussion and AnalysisDollar amounts in thousands of Canadian dollars (except as noted)
21
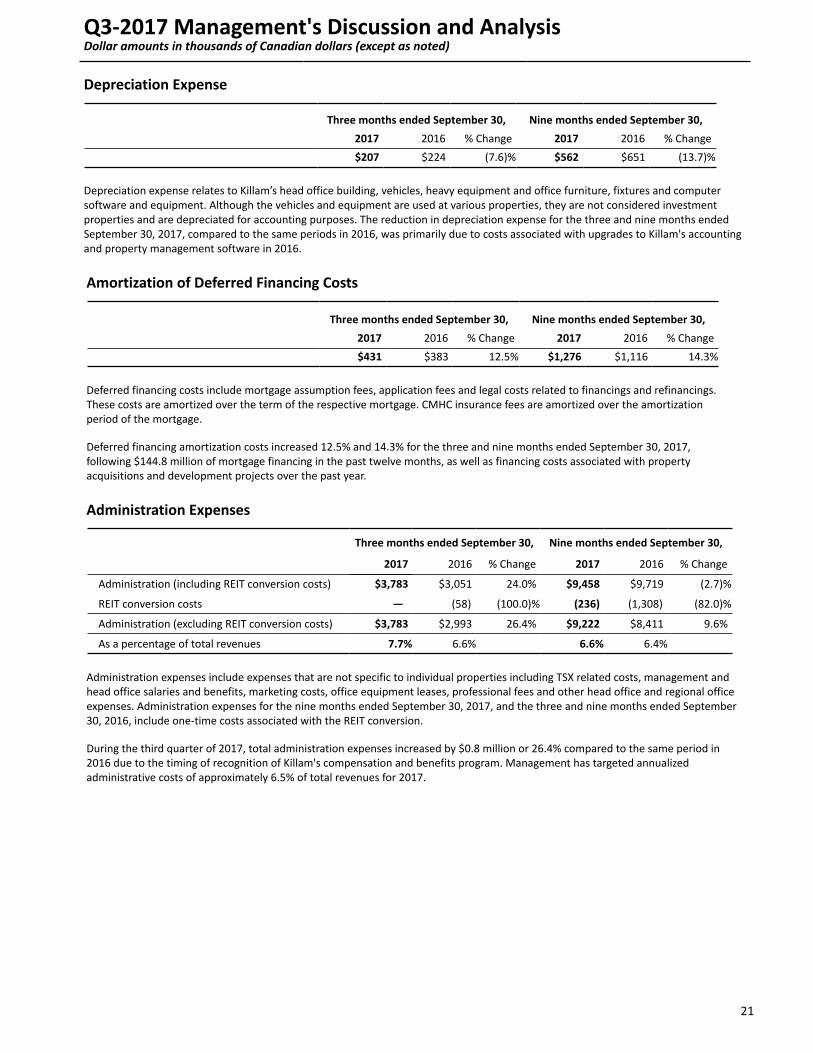
Depreciation Expense
Three months ended September 30, Nine months ended September 30,
2017 2016 % Change 2017 2016 % Change
$207 $224 (7.6)% $562 $651 (13.7)%
Depreciation expense relates to Killam’s head office building, vehicles, heavy equipment and office furniture, fixtures and computer software and equipment. Although the vehicles and equipment are used at various properties, they are not considered investment properties and are depreciated for accounting purposes. The reduction in depreciation expense for the three and nine months ended September 30, 2017, compared to the same periods in 2016, was primarily due to costs associated with upgrades to Killam's accounting and property management software in 2016.
Amortization of Deferred Financing Costs
Three months ended September 30, Nine months ended September 30,
2017 2016 % Change 2017 2016 % Change
$431 $383 12.5% $1,276 $1,116 14.3%
Deferred financing costs include mortgage assumption fees, application fees and legal costs related to financings and refinancings. These costs are amortized over the term of the respective mortgage. CMHC insurance fees are amortized over the amortization period of the mortgage.
Deferred financing amortization costs increased 12.5% and 14.3% for the three and nine months ended September 30, 2017, following $144.8 million of mortgage financing in the past twelve months, as well as financing costs associated with property acquisitions and development projects over the past year.
Administration Expenses
Three months ended September 30, Nine months ended September 30,
2017 2016 % Change 2017 2016 % Change
Administration (including REIT conversion costs) $3,783 $3,051 24.0% $9,458 $9,719 (2.7)%
REIT conversion costs — (58) (100.0)% (236) (1,308) (82.0)%
Administration (excluding REIT conversion costs) $3,783 $2,993 26.4% $9,222 $8,411 9.6%
As a percentage of total revenues 7.7% 6.6% 6.6% 6.4%
Administration expenses include expenses that are not specific to individual properties including TSX related costs, management and head office salaries and benefits, marketing costs, office equipment leases, professional fees and other head office and regional office expenses. Administration expenses for the nine months ended September 30, 2017, and the three and nine months ended September 30, 2016, include one-time costs associated with the REIT conversion.
During the third quarter of 2017, total administration expenses increased by $0.8 million or 26.4% compared to the same period in 2016 due to the timing of recognition of Killam's compensation and benefits program. Management has targeted annualized administrative costs of approximately 6.5% of total revenues for 2017.
Q3-2017 Management's Discussion and AnalysisDollar amounts in thousands of Canadian dollars (except as noted)
22
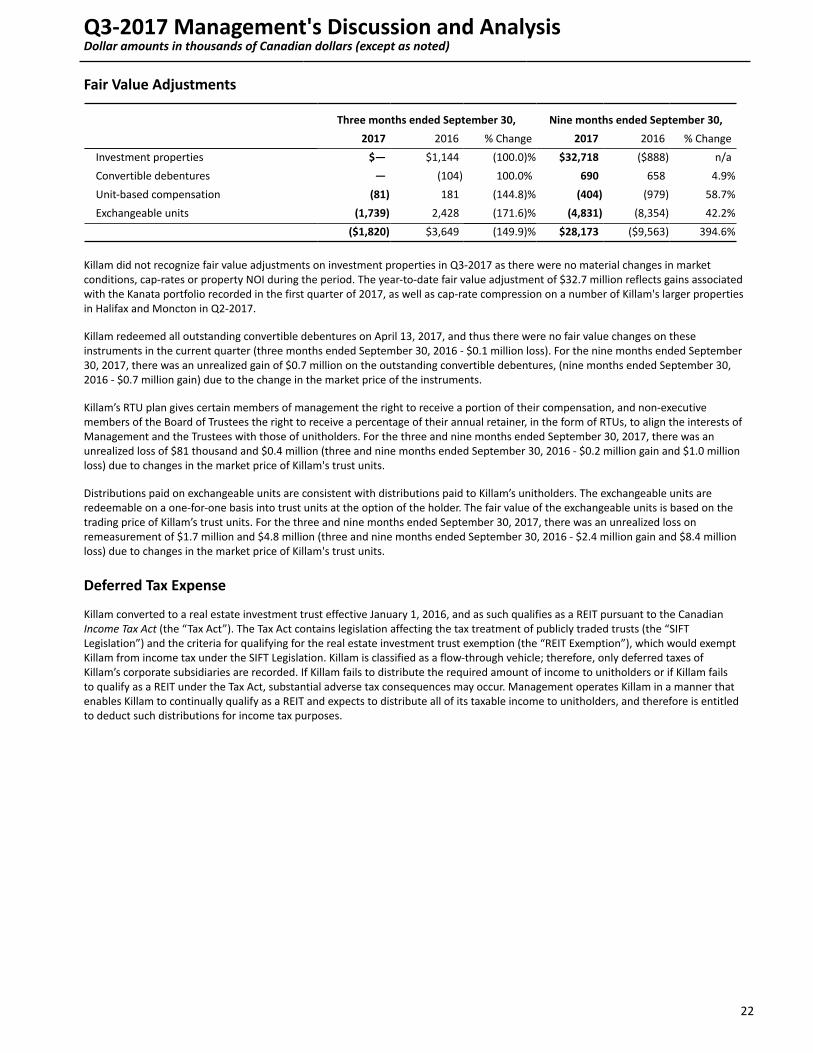
Fair Value Adjustments
Three months ended September 30, Nine months ended September 30,
2017 2016 % Change 2017 2016 % Change
Investment properties $— $1,144 (100.0)% $32,718 ($888) n/a
Convertible debentures — (104) 100.0% 690 658 4.9%
Unit-based compensation (81) 181 (144.8)% (404) (979) 58.7%
Exchangeable units (1,739) 2,428 (171.6)% (4,831) (8,354) 42.2%
($1,820) $3,649 (149.9)% $28,173 ($9,563) 394.6%
Killam did not recognize fair value adjustments on investment properties in Q3-2017 as there were no material changes in market conditions, cap-rates or property NOI during the period. The year-to-date fair value adjustment of $32.7 million reflects gains associated with the Kanata portfolio recorded in the first quarter of 2017, as well as cap-rate compression on a number of Killam's larger properties in Halifax and Moncton in Q2-2017.
Killam redeemed all outstanding convertible debentures on April 13, 2017, and thus there were no fair value changes on these instruments in the current quarter (three months ended September 30, 2016 - $0.1 million loss). For the nine months ended September 30, 2017, there was an unrealized gain of $0.7 million on the outstanding convertible debentures, (nine months ended September 30, 2016 - $0.7 million gain) due to the change in the market price of the instruments.
Killam’s RTU plan gives certain members of management the right to receive a portion of their compensation, and non-executive members of the Board of Trustees the right to receive a percentage of their annual retainer, in the form of RTUs, to align the interests of Management and the Trustees with those of unitholders. For the three and nine months ended September 30, 2017, there was an unrealized loss of $81 thousand and $0.4 million (three and nine months ended September 30, 2016 - $0.2 million gain and $1.0 million loss) due to changes in the market price of Killam's trust units.
Distributions paid on exchangeable units are consistent with distributions paid to Killam’s unitholders. The exchangeable units are redeemable on a one-for-one basis into trust units at the option of the holder. The fair value of the exchangeable units is based on the trading price of Killam’s trust units. For the three and nine months ended September 30, 2017, there was an unrealized loss on remeasurement of $1.7 million and $4.8 million (three and nine months ended September 30, 2016 - $2.4 million gain and $8.4 million loss) due to changes in the market price of Killam's trust units.
Deferred Tax Expense
Killam converted to a real estate investment trust effective January 1, 2016, and as such qualifies as a REIT pursuant to the Canadian Income Tax Act (the “Tax Act”). The Tax Act contains legislation affecting the tax treatment of publicly traded trusts (the “SIFT Legislation”) and the criteria for qualifying for the real estate investment trust exemption (the “REIT Exemption”), which would exempt Killam from income tax under the SIFT Legislation. Killam is classified as a flow-through vehicle; therefore, only deferred taxes of Killam’s corporate subsidiaries are recorded. If Killam fails to distribute the required amount of income to unitholders or if Killam fails to qualify as a REIT under the Tax Act, substantial adverse tax consequences may occur. Management operates Killam in a manner that enables Killam to continually qualify as a REIT and expects to distribute all of its taxable income to unitholders, and therefore is entitled to deduct such distributions for income tax purposes.
Q3-2017 Management's Discussion and AnalysisDollar amounts in thousands of Canadian dollars (except as noted)
23
PART V
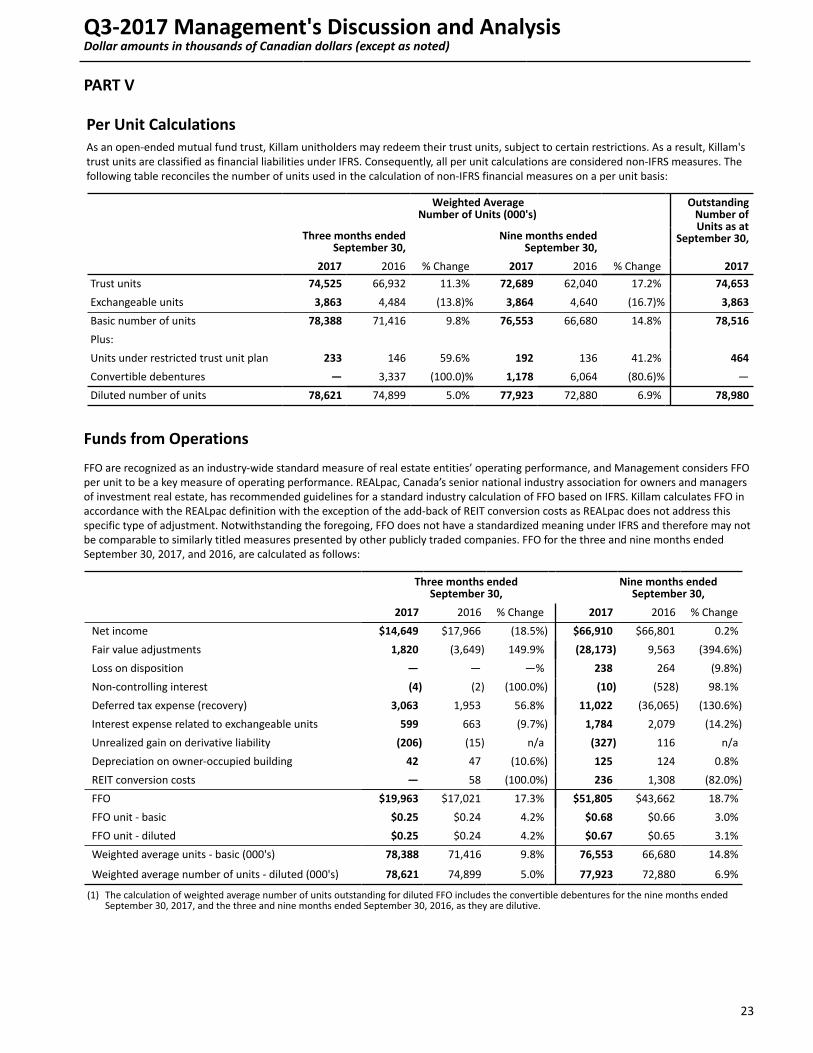
Per Unit CalculationsAs an open-ended mutual fund trust, Killam unitholders may redeem their trust units, subject to certain restrictions. As a result, Killam's trust units are classified as financial liabilities under IFRS. Consequently, all per unit calculations are considered non-IFRS measures. The following table reconciles the number of units used in the calculation of non-IFRS financial measures on a per unit basis:
Weighted AverageNumber of Units (000's)
OutstandingNumber ofUnits as at
September 30,Three months endedSeptember 30,
Nine months endedSeptember 30,
2017 2016 % Change 2017 2016 % Change 2017
Trust units 74,525 66,932 11.3% 72,689 62,040 17.2% 74,653
Exchangeable units 3,863 4,484 (13.8)% 3,864 4,640 (16.7)% 3,863
Basic number of units 78,388 71,416 9.8% 76,553 66,680 14.8% 78,516
Plus:
Units under restricted trust unit plan 233 146 59.6% 192 136 41.2% 464
Convertible debentures — 3,337 (100.0)% 1,178 6,064 (80.6)% —
Diluted number of units 78,621 74,899 5.0% 77,923 72,880 6.9% 78,980
Funds from Operations
FFO are recognized as an industry-wide standard measure of real estate entities’ operating performance, and Management considers FFO per unit to be a key measure of operating performance. REALpac, Canada’s senior national industry association for owners and managers of investment real estate, has recommended guidelines for a standard industry calculation of FFO based on IFRS. Killam calculates FFO in accordance with the REALpac definition with the exception of the add-back of REIT conversion costs as REALpac does not address this specific type of adjustment. Notwithstanding the foregoing, FFO does not have a standardized meaning under IFRS and therefore may not be comparable to similarly titled measures presented by other publicly traded companies. FFO for the three and nine months ended September 30, 2017, and 2016, are calculated as follows:
Three months endedSeptember 30,
Nine months endedSeptember 30,
2017 2016 % Change 2017 2016 % Change
Net income $14,649 $17,966 (18.5%) $66,910 $66,801 0.2%
Fair value adjustments 1,820 (3,649) 149.9% (28,173) 9,563 (394.6%)
Loss on disposition — — —% 238 264 (9.8%)
Non-controlling interest (4) (2) (100.0%) (10) (528) 98.1%
Deferred tax expense (recovery) 3,063 1,953 56.8% 11,022 (36,065) (130.6%)
Interest expense related to exchangeable units 599 663 (9.7%) 1,784 2,079 (14.2%)
Unrealized gain on derivative liability (206) (15) n/a (327) 116 n/a
Depreciation on owner-occupied building 42 47 (10.6%) 125 124 0.8%
REIT conversion costs — 58 (100.0%) 236 1,308 (82.0%)
FFO $19,963 $17,021 17.3% $51,805 $43,662 18.7%
FFO unit - basic $0.25 $0.24 4.2% $0.68 $0.66 3.0%
FFO unit - diluted $0.25 $0.24 4.2% $0.67 $0.65 3.1%
Weighted average units - basic (000's) 78,388 71,416 9.8% 76,553 66,680 14.8%
Weighted average number of units - diluted (000's) 78,621 74,899 5.0% 77,923 72,880 6.9%
(1) The calculation of weighted average number of units outstanding for diluted FFO includes the convertible debentures for the nine months ended September 30, 2017, and the three and nine months ended September 30, 2016, as they are dilutive.
Q3-2017 Management's Discussion and AnalysisDollar amounts in thousands of Canadian dollars (except as noted)
24
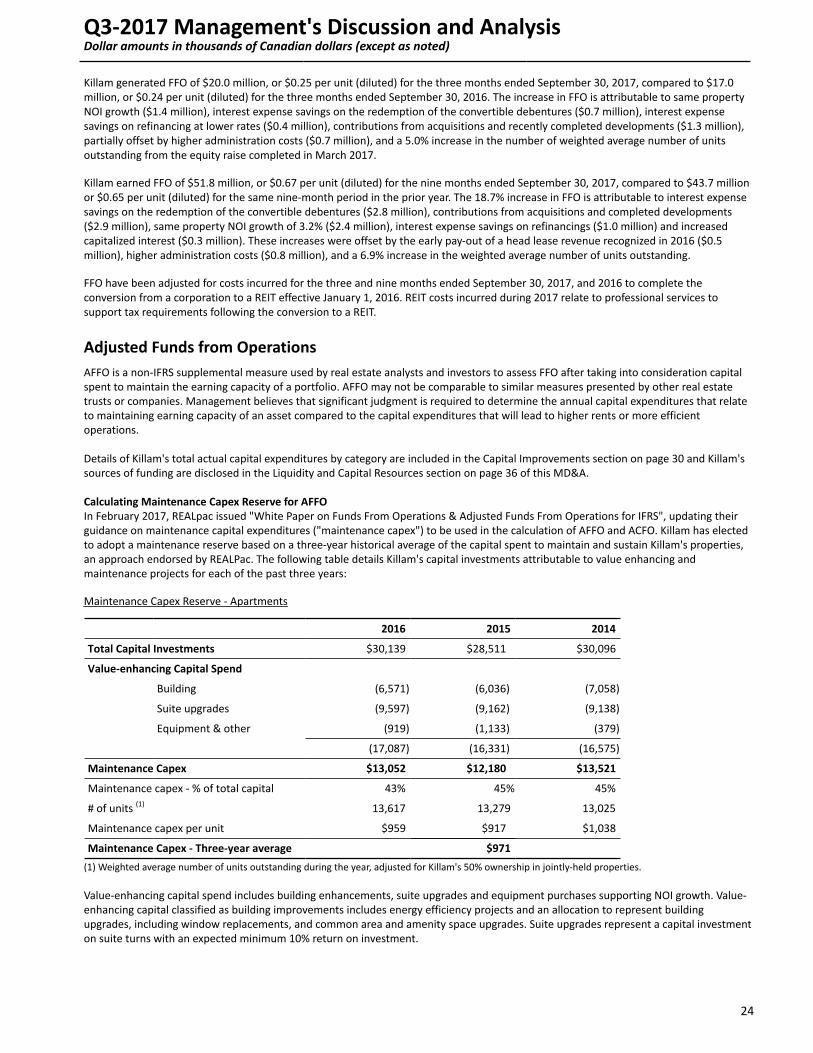
Killam generated FFO of $20.0 million, or $0.25 per unit (diluted) for the three months ended September 30, 2017, compared to $17.0 million, or $0.24 per unit (diluted) for the three months ended September 30, 2016. The increase in FFO is attributable to same property NOI growth ($1.4 million), interest expense savings on the redemption of the convertible debentures ($0.7 million), interest expense savings on refinancing at lower rates ($0.4 million), contributions from acquisitions and recently completed developments ($1.3 million), partially offset by higher administration costs ($0.7 million), and a 5.0% increase in the number of weighted average number of units outstanding from the equity raise completed in March 2017.
Killam earned FFO of $51.8 million, or $0.67 per unit (diluted) for the nine months ended September 30, 2017, compared to $43.7 million or $0.65 per unit (diluted) for the same nine-month period in the prior year. The 18.7% increase in FFO is attributable to interest expense savings on the redemption of the convertible debentures ($2.8 million), contributions from acquisitions and completed developments ($2.9 million), same property NOI growth of 3.2% ($2.4 million), interest expense savings on refinancings ($1.0 million) and increased capitalized interest ($0.3 million). These increases were offset by the early pay-out of a head lease revenue recognized in 2016 ($0.5 million), higher administration costs ($0.8 million), and a 6.9% increase in the weighted average number of units outstanding.
FFO have been adjusted for costs incurred for the three and nine months ended September 30, 2017, and 2016 to complete the conversion from a corporation to a REIT effective January 1, 2016. REIT costs incurred during 2017 relate to professional services to support tax requirements following the conversion to a REIT.
Adjusted Funds from Operations
AFFO is a non-IFRS supplemental measure used by real estate analysts and investors to assess FFO after taking into consideration capital spent to maintain the earning capacity of a portfolio. AFFO may not be comparable to similar measures presented by other real estate trusts or companies. Management believes that significant judgment is required to determine the annual capital expenditures that relate to maintaining earning capacity of an asset compared to the capital expenditures that will lead to higher rents or more efficient operations.
Details of Killam's total actual capital expenditures by category are included in the Capital Improvements section on page 30 and Killam's sources of funding are disclosed in the Liquidity and Capital Resources section on page 36 of this MD&A.
Calculating Maintenance Capex Reserve for AFFOIn February 2017, REALpac issued "White Paper on Funds From Operations & Adjusted Funds From Operations for IFRS", updating their guidance on maintenance capital expenditures ("maintenance capex") to be used in the calculation of AFFO and ACFO. Killam has elected to adopt a maintenance reserve based on a three-year historical average of the capital spent to maintain and sustain Killam's properties, an approach endorsed by REALPac. The following table details Killam's capital investments attributable to value enhancing and maintenance projects for each of the past three years:
Maintenance Capex Reserve - Apartments
2016 2015 2014
Total Capital Investments $30,139 $28,511 $30,096
Value-enhancing Capital Spend
Building (6,571) (6,036) (7,058)
Suite upgrades (9,597) (9,162) (9,138)
Equipment & other (919) (1,133) (379)
(17,087) (16,331) (16,575)
Maintenance Capex $13,052 $12,180 $13,521
Maintenance capex - % of total capital 43% 45% 45%
# of units (1) 13,617 13,279 13,025
Maintenance capex per unit $959 $917 $1,038
Maintenance Capex - Three-year average $971
(1) Weighted average number of units outstanding during the year, adjusted for Killam's 50% ownership in jointly-held properties.
Value-enhancing capital spend includes building enhancements, suite upgrades and equipment purchases supporting NOI growth. Value-enhancing capital classified as building improvements includes energy efficiency projects and an allocation to represent building upgrades, including window replacements, and common area and amenity space upgrades. Suite upgrades represent a capital investment on suite turns with an expected minimum 10% return on investment.
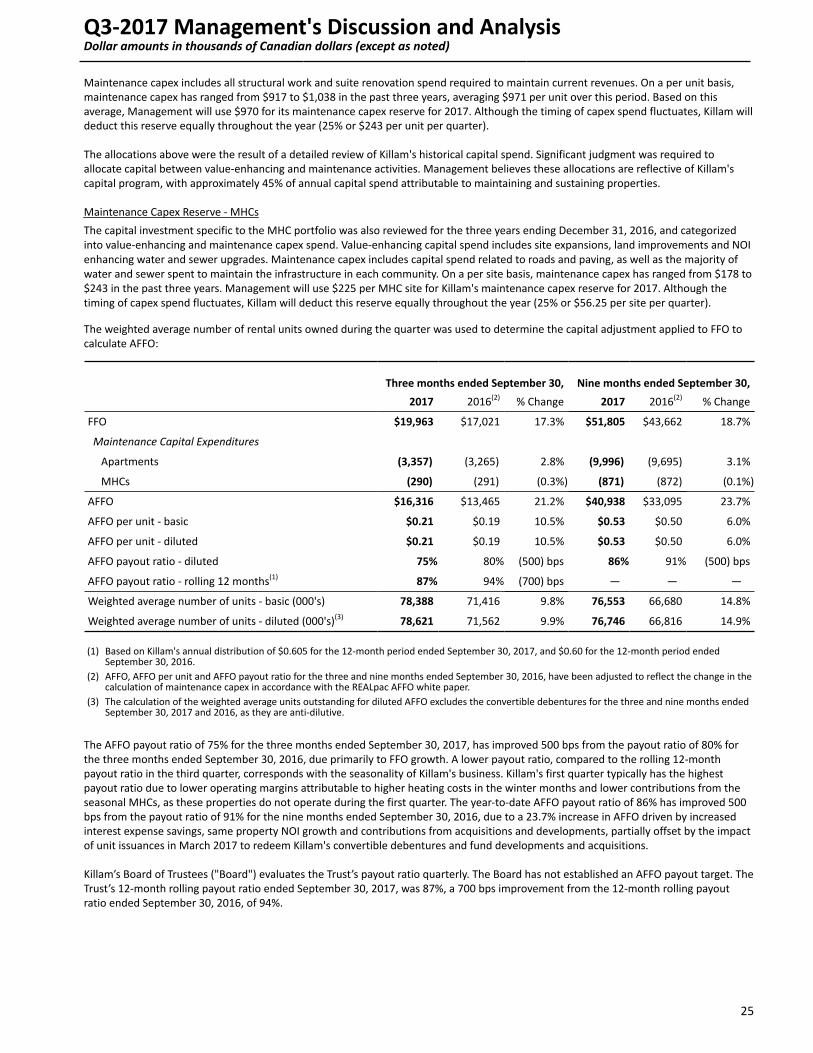
Q3-2017 Management's Discussion and AnalysisDollar amounts in thousands of Canadian dollars (except as noted)
25
Maintenance capex includes all structural work and suite renovation spend required to maintain current revenues. On a per unit basis, maintenance capex has ranged from $917 to $1,038 in the past three years, averaging $971 per unit over this period. Based on this average, Management will use $970 for its maintenance capex reserve for 2017. Although the timing of capex spend fluctuates, Killam will deduct this reserve equally throughout the year (25% or $243 per unit per quarter).
The allocations above were the result of a detailed review of Killam's historical capital spend. Significant judgment was required to allocate capital between value-enhancing and maintenance activities. Management believes these allocations are reflective of Killam's capital program, with approximately 45% of annual capital spend attributable to maintaining and sustaining properties.
Maintenance Capex Reserve - MHCs
The capital investment specific to the MHC portfolio was also reviewed for the three years ending December 31, 2016, and categorized into value-enhancing and maintenance capex spend. Value-enhancing capital spend includes site expansions, land improvements and NOI enhancing water and sewer upgrades. Maintenance capex includes capital spend related to roads and paving, as well as the majority of water and sewer spent to maintain the infrastructure in each community. On a per site basis, maintenance capex has ranged from $178 to $243 in the past three years. Management will use $225 per MHC site for Killam's maintenance capex reserve for 2017. Although the timing of capex spend fluctuates, Killam will deduct this reserve equally throughout the year (25% or $56.25 per site per quarter).
The weighted average number of rental units owned during the quarter was used to determine the capital adjustment applied to FFO to calculate AFFO:
Three months ended September 30, Nine months ended September 30,
2017 2016(2) % Change 2017 2016(2) % Change
FFO $19,963 $17,021 17.3% $51,805 $43,662 18.7%
Maintenance Capital Expenditures
Apartments (3,357) (3,265) 2.8% (9,996) (9,695) 3.1%
MHCs (290) (291) (0.3%) (871) (872) (0.1%)
AFFO $16,316 $13,465 21.2% $40,938 $33,095 23.7%
AFFO per unit - basic $0.21 $0.19 10.5% $0.53 $0.50 6.0%
AFFO per unit - diluted $0.21 $0.19 10.5% $0.53 $0.50 6.0%
AFFO payout ratio - diluted 75% 80% (500) bps 86% 91% (500) bps
AFFO payout ratio - rolling 12 months(1) 87% 94% (700) bps — — —
Weighted average number of units - basic (000's) 78,388 71,416 9.8% 76,553 66,680 14.8%
Weighted average number of units - diluted (000's)(3) 78,621 71,562 9.9% 76,746 66,816 14.9%
(1) Based on Killam's annual distribution of $0.605 for the 12-month period ended September 30, 2017, and $0.60 for the 12-month period ended September 30, 2016.
(2) AFFO, AFFO per unit and AFFO payout ratio for the three and nine months ended September 30, 2016, have been adjusted to reflect the change in the calculation of maintenance capex in accordance with the REALpac AFFO white paper.
(3) The calculation of the weighted average units outstanding for diluted AFFO excludes the convertible debentures for the three and nine months ended September 30, 2017 and 2016, as they are anti-dilutive.
The AFFO payout ratio of 75% for the three months ended September 30, 2017, has improved 500 bps from the payout ratio of 80% for the three months ended September 30, 2016, due primarily to FFO growth. A lower payout ratio, compared to the rolling 12-month payout ratio in the third quarter, corresponds with the seasonality of Killam's business. Killam's first quarter typically has the highest payout ratio due to lower operating margins attributable to higher heating costs in the winter months and lower contributions from the seasonal MHCs, as these properties do not operate during the first quarter. The year-to-date AFFO payout ratio of 86% has improved 500 bps from the payout ratio of 91% for the nine months ended September 30, 2016, due to a 23.7% increase in AFFO driven by increased interest expense savings, same property NOI growth and contributions from acquisitions and developments, partially offset by the impact of unit issuances in March 2017 to redeem Killam's convertible debentures and fund developments and acquisitions.
Killam’s Board of Trustees ("Board") evaluates the Trust’s payout ratio quarterly. The Board has not established an AFFO payout target. The Trust’s 12-month rolling payout ratio ended September 30, 2017, was 87%, a 700 bps improvement from the 12-month rolling payout ratio ended September 30, 2016, of 94%.
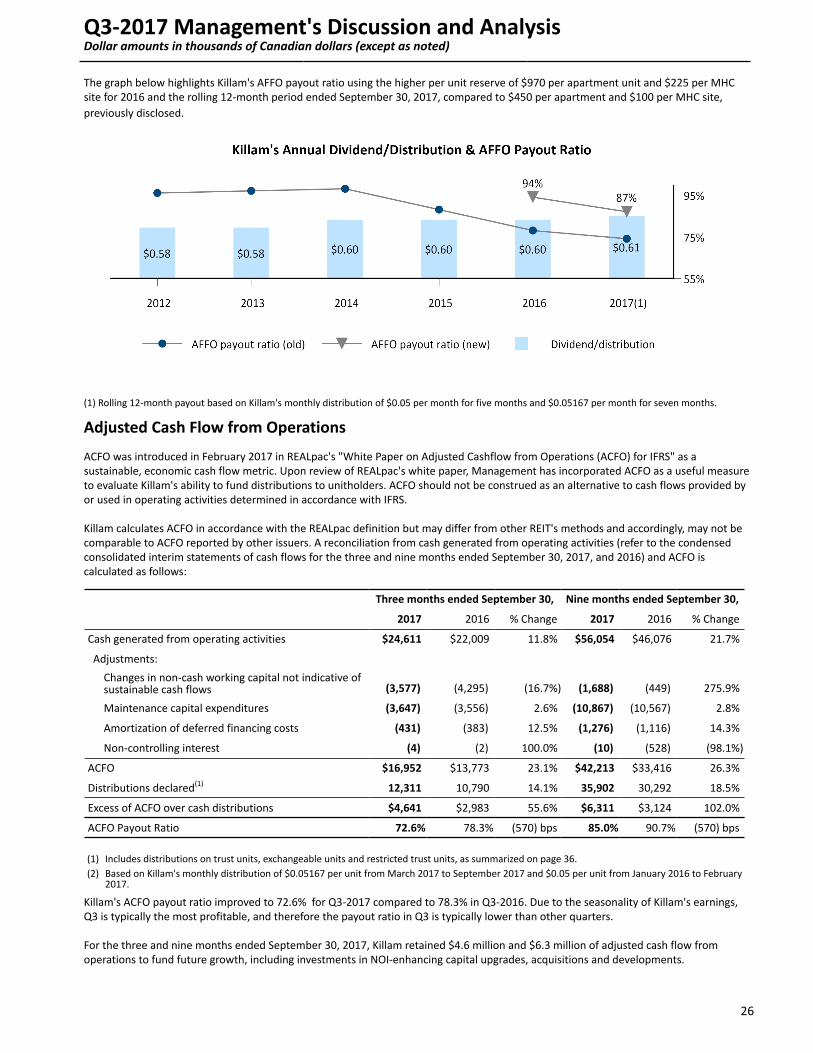
Q3-2017 Management's Discussion and AnalysisDollar amounts in thousands of Canadian dollars (except as noted)
26
The graph below highlights Killam's AFFO payout ratio using the higher per unit reserve of $970 per apartment unit and $225 per MHC site for 2016 and the rolling 12-month period ended September 30, 2017, compared to $450 per apartment and $100 per MHC site,
previously disclosed.
(1) Rolling 12-month payout based on Killam's monthly distribution of $0.05 per month for five months and $0.05167 per month for seven months.
Adjusted Cash Flow from Operations
ACFO was introduced in February 2017 in REALpac's "White Paper on Adjusted Cashflow from Operations (ACFO) for IFRS" as a sustainable, economic cash flow metric. Upon review of REALpac's white paper, Management has incorporated ACFO as a useful measure to evaluate Killam's ability to fund distributions to unitholders. ACFO should not be construed as an alternative to cash flows provided by or used in operating activities determined in accordance with IFRS.
Killam calculates ACFO in accordance with the REALpac definition but may differ from other REIT's methods and accordingly, may not be comparable to ACFO reported by other issuers. A reconciliation from cash generated from operating activities (refer to the condensed consolidated interim statements of cash flows for the three and nine months ended September 30, 2017, and 2016) and ACFO is calculated as follows:
Three months ended September 30, Nine months ended September 30,
2017 2016 % Change 2017 2016 % Change
Cash generated from operating activities $24,611 $22,009 11.8% $56,054 $46,076 21.7%
Adjustments:
Changes in non-cash working capital not indicative of sustainable cash flows (3,577) (4,295) (16.7%) (1,688) (449) 275.9%
Maintenance capital expenditures (3,647) (3,556) 2.6% (10,867) (10,567) 2.8%
Amortization of deferred financing costs (431) (383) 12.5% (1,276) (1,116) 14.3%
Non-controlling interest (4) (2) 100.0% (10) (528) (98.1%)
ACFO $16,952 $13,773 23.1% $42,213 $33,416 26.3%
Distributions declared(1) 12,311 10,790 14.1% 35,902 30,292 18.5%
Excess of ACFO over cash distributions $4,641 $2,983 55.6% $6,311 $3,124 102.0%
ACFO Payout Ratio 72.6% 78.3% (570) bps 85.0% 90.7% (570) bps
(1) Includes distributions on trust units, exchangeable units and restricted trust units, as summarized on page 36.
(2) Based on Killam's monthly distribution of $0.05167 per unit from March 2017 to September 2017 and $0.05 per unit from January 2016 to February 2017.
Killam's ACFO payout ratio improved to 72.6% for Q3-2017 compared to 78.3% in Q3-2016. Due to the seasonality of Killam's earnings, Q3 is typically the most profitable, and therefore the payout ratio in Q3 is typically lower than other quarters.
For the three and nine months ended September 30, 2017, Killam retained $4.6 million and $6.3 million of adjusted cash flow from operations to fund future growth, including investments in NOI-enhancing capital upgrades, acquisitions and developments.
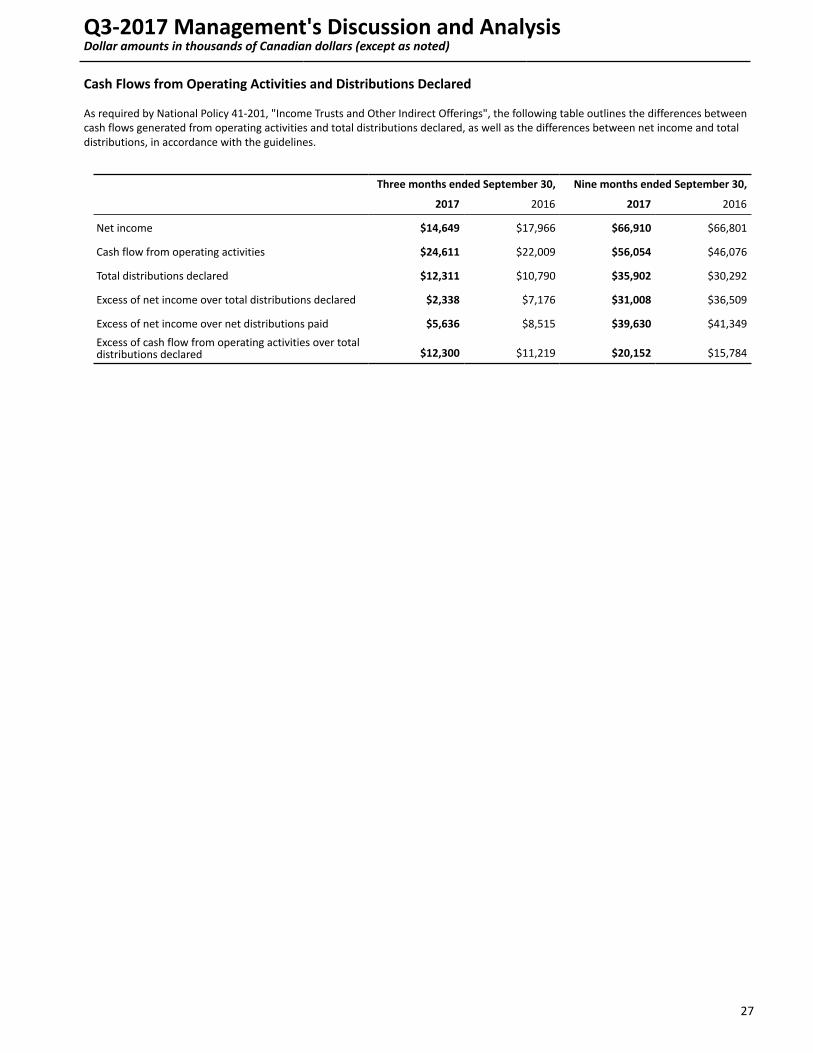
Q3-2017 Management's Discussion and AnalysisDollar amounts in thousands of Canadian dollars (except as noted)
27
Cash Flows from Operating Activities and Distributions Declared
As required by National Policy 41-201, "Income Trusts and Other Indirect Offerings", the following table outlines the differences between cash flows generated from operating activities and total distributions declared, as well as the differences between net income and total distributions, in accordance with the guidelines.
Three months ended September 30, Nine months ended September 30,
2017 2016 2017 2016
Net income $14,649 $17,966 $66,910 $66,801
Cash flow from operating activities $24,611 $22,009 $56,054 $46,076
Total distributions declared $12,311 $10,790 $35,902 $30,292
Excess of net income over total distributions declared $2,338 $7,176 $31,008 $36,509
Excess of net income over net distributions paid $5,636 $8,515 $39,630 $41,349
Excess of cash flow from operating activities over total distributions declared $12,300 $11,219 $20,152 $15,784
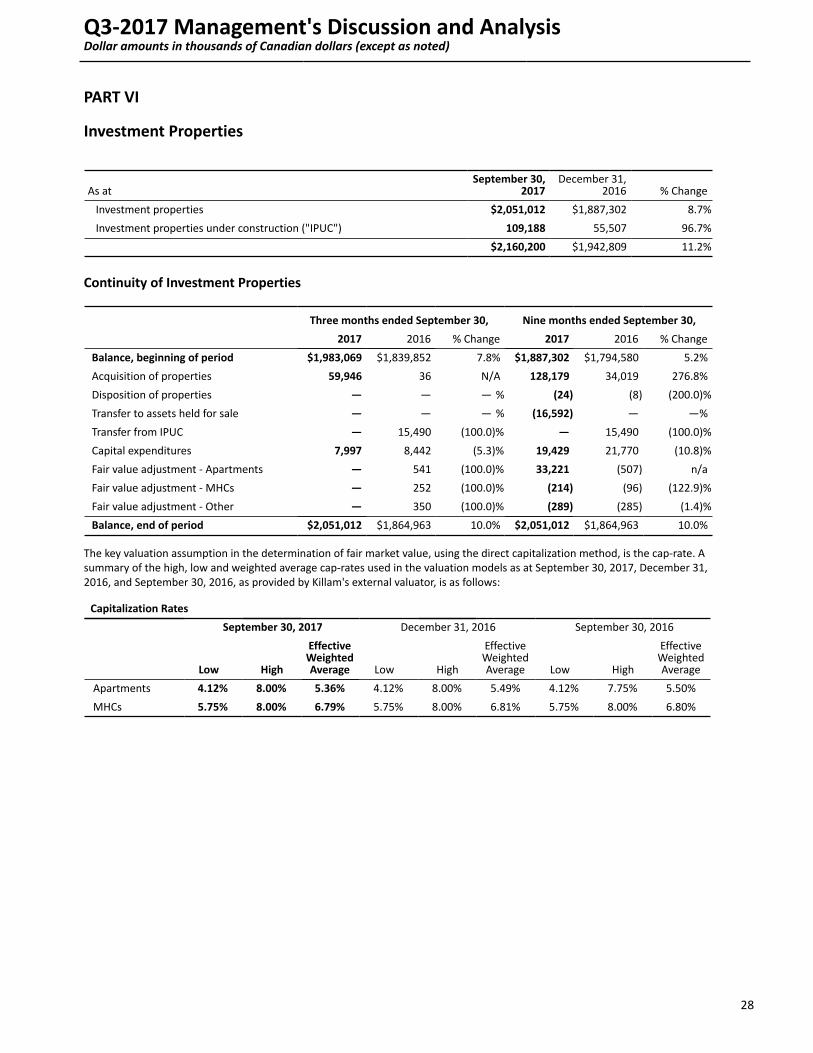
Q3-2017 Management's Discussion and AnalysisDollar amounts in thousands of Canadian dollars (except as noted)
28
PART VI
Investment Properties
As atSeptember 30,
2017December 31,
2016 % Change
Investment properties $2,051,012 $1,887,302 8.7%
Investment properties under construction ("IPUC") 109,188 55,507 96.7%
$2,160,200 $1,942,809 11.2%
Continuity of Investment Properties
Three months ended September 30, Nine months ended September 30,
2017 2016 % Change 2017 2016 % Change
Balance, beginning of period $1,983,069 $1,839,852 7.8% $1,887,302 $1,794,580 5.2%
Acquisition of properties 59,946 36 N/A 128,179 34,019 276.8%
Disposition of properties — — — % (24) (8) (200.0)%
Transfer to assets held for sale — — — % (16,592) — —%
Transfer from IPUC — 15,490 (100.0)% — 15,490 (100.0)%
Capital expenditures 7,997 8,442 (5.3)% 19,429 21,770 (10.8)%
Fair value adjustment - Apartments — 541 (100.0)% 33,221 (507) n/a
Fair value adjustment - MHCs — 252 (100.0)% (214) (96) (122.9)%
Fair value adjustment - Other — 350 (100.0)% (289) (285) (1.4)%
Balance, end of period $2,051,012 $1,864,963 10.0% $2,051,012 $1,864,963 10.0%
The key valuation assumption in the determination of fair market value, using the direct capitalization method, is the cap-rate. A summary of the high, low and weighted average cap-rates used in the valuation models as at September 30, 2017, December 31, 2016, and September 30, 2016, as provided by Killam's external valuator, is as follows:
Capitalization Rates
September 30, 2017 December 31, 2016 September 30, 2016
Low High
EffectiveWeightedAverage Low High
EffectiveWeightedAverage Low High
EffectiveWeightedAverage
Apartments 4.12% 8.00% 5.36% 4.12% 8.00% 5.49% 4.12% 7.75% 5.50%
MHCs 5.75% 8.00% 6.79% 5.75% 8.00% 6.81% 5.75% 8.00% 6.80%
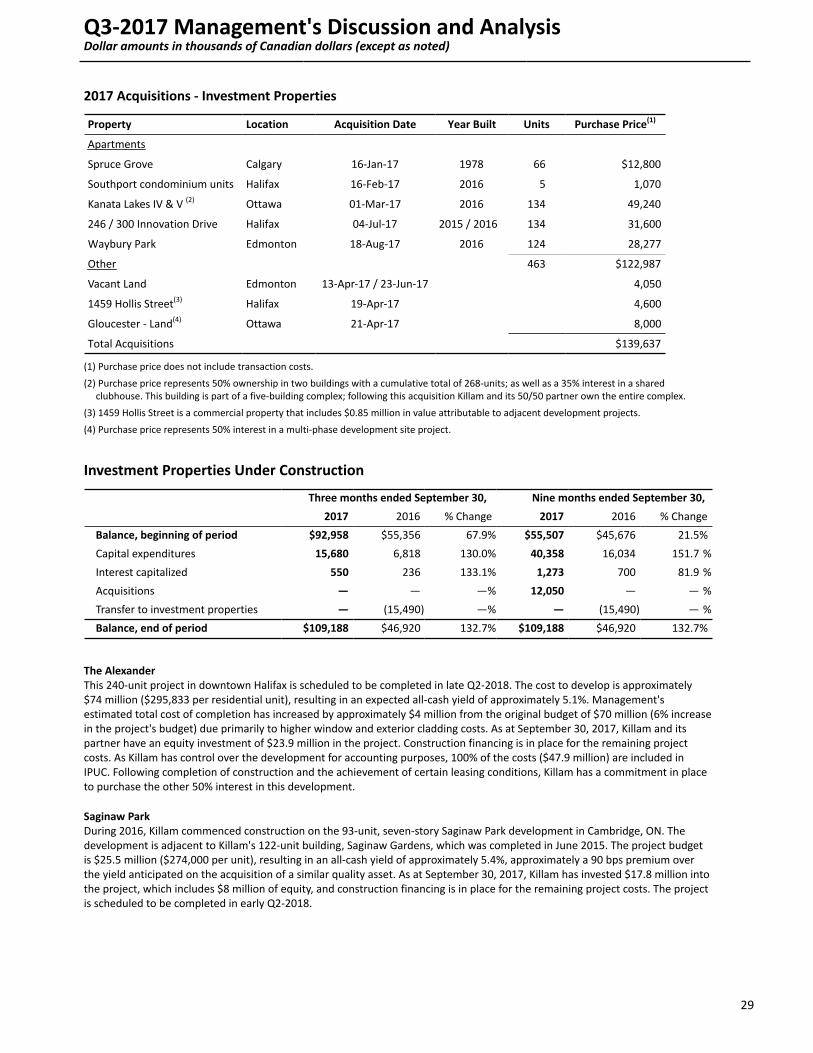
Q3-2017 Management's Discussion and AnalysisDollar amounts in thousands of Canadian dollars (except as noted)
29
2017 Acquisitions - Investment Properties
Property Location Acquisition Date Year Built Units Purchase Price(1)
Apartments
Spruce Grove Calgary 16-Jan-17 1978 66 $12,800
Southport condominium units Halifax 16-Feb-17 2016 5 1,070
Kanata Lakes IV & V (2) Ottawa 01-Mar-17 2016 134 49,240
246 / 300 Innovation Drive Halifax 04-Jul-17 2015 / 2016 134 31,600
Waybury Park Edmonton 18-Aug-17 2016 124 28,277
Other 463 $122,987
Vacant Land Edmonton 13-Apr-17 / 23-Jun-17 4,050
1459 Hollis Street(3) Halifax 19-Apr-17 4,600
Gloucester - Land(4) Ottawa 21-Apr-17 8,000
Total Acquisitions $139,637
(1) Purchase price does not include transaction costs.
(2) Purchase price represents 50% ownership in two buildings with a cumulative total of 268-units; as well as a 35% interest in a shared clubhouse. This building is part of a five-building complex; following this acquisition Killam and its 50/50 partner own the entire complex.
(3) 1459 Hollis Street is a commercial property that includes $0.85 million in value attributable to adjacent development projects.
(4) Purchase price represents 50% interest in a multi-phase development site project.
Investment Properties Under Construction
Three months ended September 30, Nine months ended September 30,
2017 2016 % Change 2017 2016 % Change
Balance, beginning of period $92,958 $55,356 67.9% $55,507 $45,676 21.5%
Capital expenditures 15,680 6,818 130.0% 40,358 16,034 151.7 %
Interest capitalized 550 236 133.1% 1,273 700 81.9 %
Acquisitions — — —% 12,050 — — %
Transfer to investment properties — (15,490) —% — (15,490) — %
Balance, end of period $109,188 $46,920 132.7% $109,188 $46,920 132.7%
The Alexander This 240-unit project in downtown Halifax is scheduled to be completed in late Q2-2018. The cost to develop is approximately $74 million ($295,833 per residential unit), resulting in an expected all-cash yield of approximately 5.1%. Management's estimated total cost of completion has increased by approximately $4 million from the original budget of $70 million (6% increase in the project's budget) due primarily to higher window and exterior cladding costs. As at September 30, 2017, Killam and its partner have an equity investment of $23.9 million in the project. Construction financing is in place for the remaining project costs. As Killam has control over the development for accounting purposes, 100% of the costs ($47.9 million) are included in IPUC. Following completion of construction and the achievement of certain leasing conditions, Killam has a commitment in place to purchase the other 50% interest in this development.
Saginaw Park During 2016, Killam commenced construction on the 93-unit, seven-story Saginaw Park development in Cambridge, ON. The development is adjacent to Killam's 122-unit building, Saginaw Gardens, which was completed in June 2015. The project budget is $25.5 million ($274,000 per unit), resulting in an all-cash yield of approximately 5.4%, approximately a 90 bps premium over the yield anticipated on the acquisition of a similar quality asset. As at September 30, 2017, Killam has invested $17.8 million into the project, which includes $8 million of equity, and construction financing is in place for the remaining project costs. The project is scheduled to be completed in early Q2-2018.
Q3-2017 Management's Discussion and AnalysisDollar amounts in thousands of Canadian dollars (except as noted)
30
Gloucester City CentreOn April 24, 2017, Killam and RioCan REIT ("RioCan") formed a joint venture to develop a residential rental community at Gloucester City Centre in Ottawa, with Killam acquiring a 50% interest in a 7.1 acre development site for $8.0 million ($16 million at 100%). Killam and RioCan each own a 50% interest in the land and participate on the same basis in this development. RioCan acts as the development manager, and upon completion, Killam will act as the residential property manager. The site has zoning approval for four residential towers with an aggregate total of 840 units. The first phase of the development, a 217,000 SF, 23-storey tower containing approximately 227 units, is currently in progress. The total cost to develop Phase I is approximately $73 million ($36.5 million for Killam's 50% interest). As at September 30, 2017, Killam has invested approximately $9 million in the Phase I project and the majority of the remaining project costs for the development's first phase are expected to be funded through construction financing. The first phase is scheduled to be completed in the first half of 2019.
Killam has a robust development pipeline. Developments that are expected to begin in 2018 include Carlton Terrace, an 18-storey, 104-unit development adjacent Killam's Spring Garden Terrace apartments in downtown Halifax, as well as the Silver Spear II development on land adjacent to the existing 199-unit building in Mississauga. Killam will have a 50% ownership in this 12-storey, 128-unit development.
With the three developments underway, Killam forecasts adding approximately $135 million of new developments to its portfolio during the next three years.
As at November 7, 2017, Killam has the following land available for future development:
Property Location
Development Potential
(# of Units) Status
Silver Spear(1) Mississauga, ON 64 In design and approval process
Carlton Terrace Halifax, NS 104 In design and approval process
The Governor Halifax, NS 48 In design and approval process
Cameron Heights Edmonton, AB 190 In design and approval process
Grid 5 vacant land(1) Calgary, AB 199 Future development
Topsail Road St. John's, NL 225 Future development
Medical Arts (Spring Garden) Halifax, NS 200 Future development
Block 4 St. John's, NL 80 Future development
Carlton Houses Halifax, NS 70 Future development
Gloucester Phase 2 - 4(1) Ottawa, ON 309 Future development
Total Development Opportunities 1,489
(1) Represents Killam's 50% interest in the potential development units.
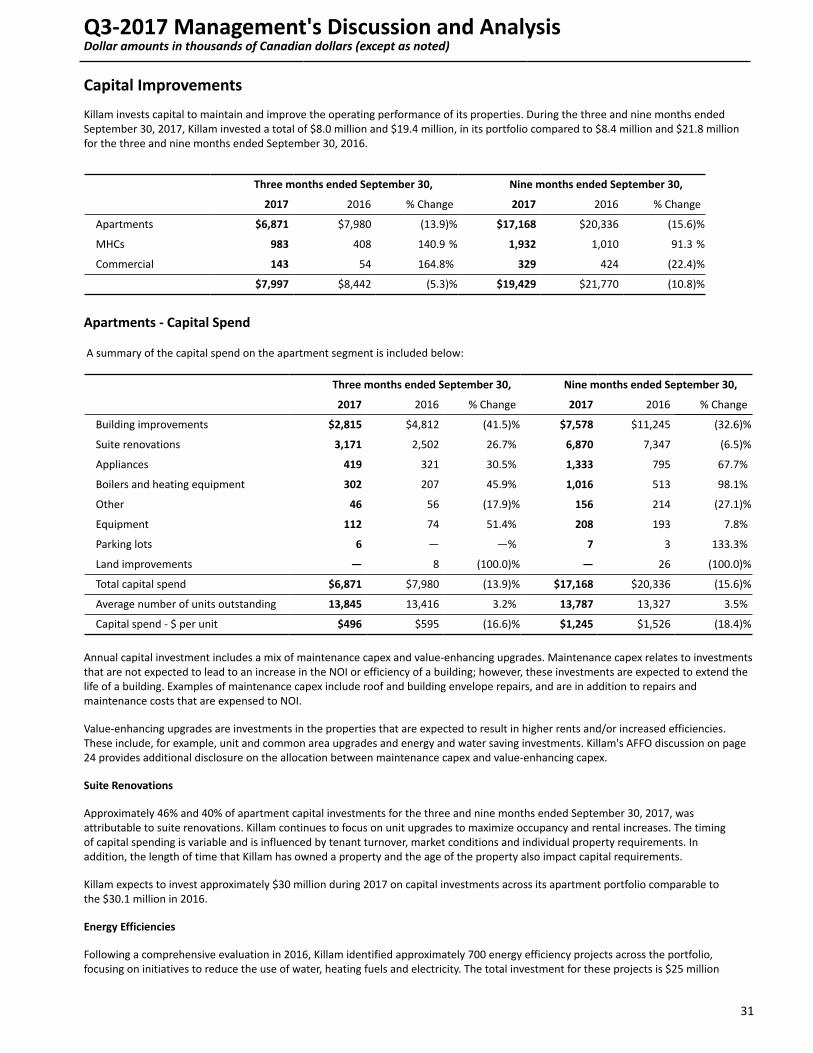
Q3-2017 Management's Discussion and AnalysisDollar amounts in thousands of Canadian dollars (except as noted)
31
Capital Improvements
Killam invests capital to maintain and improve the operating performance of its properties. During the three and nine months ended September 30, 2017, Killam invested a total of $8.0 million and $19.4 million, in its portfolio compared to $8.4 million and $21.8 million for the three and nine months ended September 30, 2016.
Three months ended September 30, Nine months ended September 30,
2017 2016 % Change 2017 2016 % Change
Apartments $6,871 $7,980 (13.9)% $17,168 $20,336 (15.6)%
MHCs 983 408 140.9 % 1,932 1,010 91.3 %
Commercial 143 54 164.8% 329 424 (22.4)%
$7,997 $8,442 (5.3)% $19,429 $21,770 (10.8)%
Apartments - Capital Spend
A summary of the capital spend on the apartment segment is included below:
Three months ended September 30, Nine months ended September 30,
2017 2016 % Change 2017 2016 % Change
Building improvements $2,815 $4,812 (41.5)% $7,578 $11,245 (32.6)%
Suite renovations 3,171 2,502 26.7% 6,870 7,347 (6.5)%
Appliances 419 321 30.5% 1,333 795 67.7%
Boilers and heating equipment 302 207 45.9% 1,016 513 98.1%
Other 46 56 (17.9)% 156 214 (27.1)%
Equipment 112 74 51.4% 208 193 7.8%
Parking lots 6 — —% 7 3 133.3%
Land improvements — 8 (100.0)% — 26 (100.0)%
Total capital spend $6,871 $7,980 (13.9)% $17,168 $20,336 (15.6)%
Average number of units outstanding 13,845 13,416 3.2% 13,787 13,327 3.5%
Capital spend - $ per unit $496 $595 (16.6)% $1,245 $1,526 (18.4)%
Annual capital investment includes a mix of maintenance capex and value-enhancing upgrades. Maintenance capex relates to investments that are not expected to lead to an increase in the NOI or efficiency of a building; however, these investments are expected to extend the life of a building. Examples of maintenance capex include roof and building envelope repairs, and are in addition to repairs and maintenance costs that are expensed to NOI.
Value-enhancing upgrades are investments in the properties that are expected to result in higher rents and/or increased efficiencies. These include, for example, unit and common area upgrades and energy and water saving investments. Killam's AFFO discussion on page 24 provides additional disclosure on the allocation between maintenance capex and value-enhancing capex.
Suite Renovations
Approximately 46% and 40% of apartment capital investments for the three and nine months ended September 30, 2017, was attributable to suite renovations. Killam continues to focus on unit upgrades to maximize occupancy and rental increases. The timing of capital spending is variable and is influenced by tenant turnover, market conditions and individual property requirements. In addition, the length of time that Killam has owned a property and the age of the property also impact capital requirements.
Killam expects to invest approximately $30 million during 2017 on capital investments across its apartment portfolio comparable to the $30.1 million in 2016.
Energy Efficiencies
Following a comprehensive evaluation in 2016, Killam identified approximately 700 energy efficiency projects across the portfolio, focusing on initiatives to reduce the use of water, heating fuels and electricity. The total investment for these projects is $25 million
Q3-2017 Management's Discussion and AnalysisDollar amounts in thousands of Canadian dollars (except as noted)
32
and once complete, aggregate annual savings of $7 million are expected. At a 5% average cap-rate, these savings could increase the net asset value of Killam's portfolio by $140 million.
These projects should allow Killam to decrease energy intensity from its current $1.40 per square foot to $1.10 per square foot, a 23% reduction by the end of 2021. Energy intensity measures all energy sources (including water) used within a property, converted to a single common measurement of dollars per SF. This $0.30 decline is an estimated $4.3 million in annual energy costs, which should more than offset rising energy rates and other operating pressures.
As at September 30, 2017, Killam has invested approximately $3.4 million of the $25 million of projects identified. By the end of 2018, Killam expects to have invested $7.0 million, or approximately 28% of its energy efficiency plan. To date, the projects have focused on the installation of ultra-low-flow toilets ($0.8 million), lighting ($0.8 million) and heating efficiency ($1.8 million) (i.e., condensing gas boilers and system recommissioning). These projects are estimated to generate $0.8 million in annualized savings, with an average payback period of 4.3 years.
MHCs - Capital Spend
A summary of the capital spend for the MHC segment is included below:
Three months ended September 30,
Nine months ended September 30,
2017 2016 % Change 2017 2016 % Change
Water and sewer upgrades $502 $192 161.5% $905 $409 121.3%
Site expansion and land improvements 240 132 81.8% 639 343 86.3%
Other 93 71 31.0 % 185 210 (11.9)%
Roads and paving 3 9 (66.7)% 14 20 (30.0)%
Equipment 145 4 3,525.0 % 189 28 575.0%
Total capital spend - MHCs $983 $408 140.9% $1,932 $1,010 91.3%
Average number of units outstanding 5,165 5,165 —% 5,165 5,165 —%
Capital spend - $ per site $190 $79 140.5% $374 $196 90.8%
Management expects to invest between $300 and $500 per MHC site annually. Consistent with the apartment portfolio, a portion of the MHC capital is considered maintenance capital and a portion is considered value enhancing. Maintenance capital includes costs to support the existing infrastructure, and value-enhancing capital includes improvements to roadways, work to accommodate future expansion, and community enhancements, such as the addition of playgrounds. A portion of MHC capital may be recovered through the above guideline increases in the provinces with rent control, leading to increased NOI from the investments.
Q3-2017 Management's Discussion and AnalysisDollar amounts in thousands of Canadian dollars (except as noted)
33
Total capital spend during the three and nine months ended September 30, 2017, was $1.0 million and $1.9 million, up from $0.4 million and $1.0 million in the same periods of 2016. The increase in capital spend is due to extensive water and sewer upgrades at two communities in Ontario.
As with the apartment portfolio, the timing of MHC capital investment changes based on requirements at each community. Killam expects to invest between $2.5 and $3.0 million during 2017 on capital investments across its MHC portfolio compared to $2.0 million in 2016.
Mortgages and Other Loans
Below are Killam's key debt metrics:
As at September 30, 2017 December 31, 2016 Change
Weighted average years to debt maturity 4.2 4.3 (0.1) years
Gross mortgage, loan, credit facilities and vendor debt as a percentage of total assets 51.4% 51.2% 20 bps
Total debt as a percentage of total assets 51.4% 53.5% (210) bps
Interest coverage - rolling twelve months 3.12x 2.74x 13.9%
Debt service coverage - rolling twelve months 1.51x 1.43x 5.6%
Debt to EBITDA (1) 10.84x 10.86x (0.2)%
Weighted average mortgage interest rate 2.91% 3.01% (10) bps
Weighted average interest rate of total debt 2.94% 3.11% (17) bps(1)Ratio calculated net of cash
Killam’s long-term debt consists largely of fixed-rate, long-term mortgage financings. In certain cases, Killam will also utilize vendor-take-back mortgages as part of an acquisition. Mortgages are secured by a first or second charge against individual properties and the vendor financing is secured by a general corporate guarantee. Killam’s weighted average interest rate on mortgages as at September 30, 2017, improved to 2.91% from 3.01% as at December 31, 2016, as a result of refinancing at lower interest rates during the period. This trend is expected to continue over the remainder of 2017 with $11.1 million of mortgage balances maturing.
Total debt as a percentage of total assets has decreased 210 bps to 51.4% from December 31, 2016, largely due to the redemption of the convertible debentures. The ratio increased by 100 bps from 50.4% at June 30, 2017, due to the upfinancing of mortgage maturities in Q3, as well as the investment in current developments funded with construction debt. This ratio is sensitive to changes in the fair value of investment properties, in particular cap-rate changes. A 10 bps increase in the weighted average cap-rate as at September 30, 2017, would have increased the ratio of debt as a percentage of total assets by 90 bps.
Refinancings
For the nine months ended September 30, 2017, Killam refinanced the following mortgages:
Mortgage DebtMaturities
Mortgage Debton Refinancing
WeightedAverage Term Net Proceeds
Apartments $54,715 3.45% $75,183 2.27% 5.9 years $20,468
MHCs 5,654 5.47% 10,511 3.62% 5.0 years 4,857
$60,369 3.64% $85,694 2.43% 5.8 years $25,325
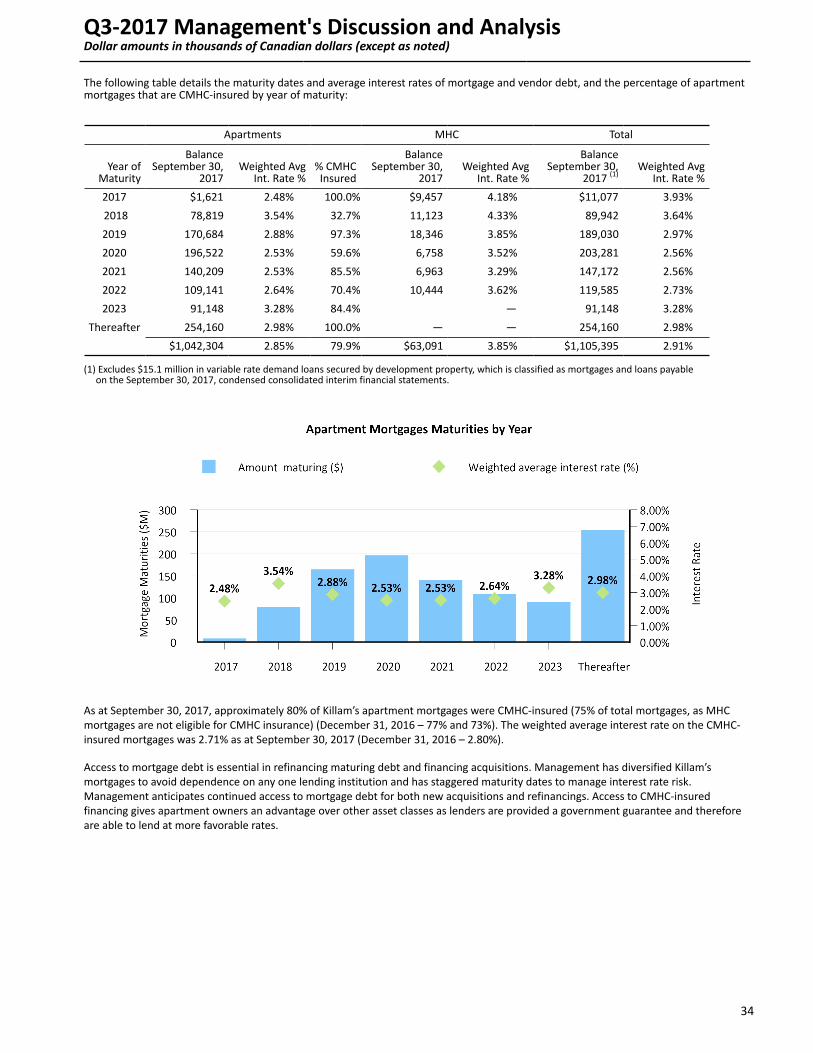
Q3-2017 Management's Discussion and AnalysisDollar amounts in thousands of Canadian dollars (except as noted)
34
The following table details the maturity dates and average interest rates of mortgage and vendor debt, and the percentage of apartment mortgages that are CMHC-insured by year of maturity:
Apartments MHC Total
Year of Maturity
Balance September 30,
2017Weighted Avg
Int. Rate %% CMHCInsured
Balance September 30,
2017Weighted Avg
Int. Rate %
Balance September 30,
2017 (1)Weighted Avg
Int. Rate %
2017 $1,621 2.48% 100.0% $9,457 4.18% $11,077 3.93%
2018 78,819 3.54% 32.7% 11,123 4.33% 89,942 3.64%
2019 170,684 2.88% 97.3% 18,346 3.85% 189,030 2.97%
2020 196,522 2.53% 59.6% 6,758 3.52% 203,281 2.56%
2021 140,209 2.53% 85.5% 6,963 3.29% 147,172 2.56%
2022 109,141 2.64% 70.4% 10,444 3.62% 119,585 2.73%
2023 91,148 3.28% 84.4% — 91,148 3.28%
Thereafter 254,160 2.98% 100.0% — — 254,160 2.98%
$1,042,304 2.85% 79.9% $63,091 3.85% $1,105,395 2.91%
(1) Excludes $15.1 million in variable rate demand loans secured by development property, which is classified as mortgages and loans payable on the September 30, 2017, condensed consolidated interim financial statements.
As at September 30, 2017, approximately 80% of Killam’s apartment mortgages were CMHC-insured (75% of total mortgages, as MHC mortgages are not eligible for CMHC insurance) (December 31, 2016 – 77% and 73%). The weighted average interest rate on the CMHC-insured mortgages was 2.71% as at September 30, 2017 (December 31, 2016 – 2.80%).
Access to mortgage debt is essential in refinancing maturing debt and financing acquisitions. Management has diversified Killam’s mortgages to avoid dependence on any one lending institution and has staggered maturity dates to manage interest rate risk. Management anticipates continued access to mortgage debt for both new acquisitions and refinancings. Access to CMHC-insured financing gives apartment owners an advantage over other asset classes as lenders are provided a government guarantee and therefore are able to lend at more favorable rates.
Q3-2017 Management's Discussion and AnalysisDollar amounts in thousands of Canadian dollars (except as noted)
35
The following tables present the NOI for properties that are available to Killam to refinance at debt maturity for the remainder of 2017 and in 2018:
Remaining 2017 Debt MaturitiesNumber of Properties Estimated NOI
Principal Balance(at maturity)
Apartments with debt maturing 1 $180 $1,610
MHCs with debt maturing 7 1,854 9,439
8 $2,034 $11,049
2018 Debt MaturitiesNumber of Properties Estimated NOI
Principal Balance(at maturity)
Apartments with debt maturing 19 $8,769 $77,188
MHCs with debt maturing 9 1,906 10,604
28 $10,675 $87,792
Future Contractual Debt Obligations
As at September 30, 2017, the timing of Killam's future contractual debt obligations is as follows:
For the twelve months ending September 30,
Mortgage and loans
payableConstruction
loans Total
2018 $139,646 $22,251 $161,897
2019 169,347 8,612 177,959
2020 224,138 — 224,138
2021 129,500 — 129,500
2022 161,806 — 161,806
Thereafter 293,074 — 293,074
$1,117,511 $30,863 $1,148,374
Convertible Debentures
On April 13, 2017, Killam completed the redemption of the $46.0 million, 5.45%, convertible unsecured debentures. There are currently no convertible debentures outstanding.
Construction Loans
As at September 30, 2017, Killam had access to two floating rate non-revolving demand construction loans for the purpose of financing development projects including a $51.8 million construction loan commitment related to The Alexander, where Killam has a 50% ownership interest, and a $18.8 million construction loan commitment related to the Saginaw Gardens II development project. Payments are to be made monthly on an interest only basis. The construction loans have interest rates of prime plus 0.625%. Once construction is complete and rental targets achieved, the construction loans will be repaid in full and replaced with conventional mortgages.
As at September 30, 2017, $30.9 million (December 31, 2016 - $18.5 million) was drawn on The Alexander and Saginaw Gardens II construction loans, at a weighted average interest rate of 3.58% (December 31, 2016 - 3.39%).
Credit Facilities
Killam has access to two credit facilities with credit limits of $30.0 million and $1.5 million (December 31, 2016 - $30.0 million and $1.5 million) that can be used for acquisition and general business purposes.
The $30.0 million facility bears interest at prime plus 75 bps on prime rate advances or 175 bps over bankers acceptances ("BAs"). Killam has the right to choose between prime rate advances and BAs based on available rates and timing. As at September 30, 2017, Killam has assets with a carrying value of $46.7 million pledged to the line and a balance outstanding of $3.0 million (December 31, 2016 - $nil). The agreement includes certain covenants and undertakings with which Killam is in compliance as at September 30, 2017.
Q3-2017 Management's Discussion and AnalysisDollar amounts in thousands of Canadian dollars (except as noted)
36
The $1.5 million facility bears interest at prime plus 175 bps on advances and 135 bps on issuance of letters of credit in addition to 50 bps per annum. As at September 30, 2017, Killam had assets with a carrying value of $1.8 million pledged as collateral (December 31, 2016 - $1.6 million) and letters of credit totaling $1.2 million outstanding against the facility (December 31, 2016 - $1.2 million). The agreement includes certain covenants and undertakings with which Killam is in compliance as at September 30, 2017.
As at September 30, 2017 Maximum loan amount Amount drawn Letters of credit Amount available
$30 million demand facility $30,000 $3,000 — $27,000
$1.5 million demand facility 1,500 — 1,200 300
Total $31,500 $3,000 $1,200 $27,300
As at December 31, 2016 Maximum loan amount Amount drawn Letters of credit Amount available
$30 million demand facility $30,000 — — $30,000
$1.5 million demand facility 1,500 — 1,200 300
Total $31,500 — $1,200 $30,300
Unitholders’ Equity
As an open-ended mutual fund trust, unitholders of trust units are entitled to redeem their trust units at any time at prices determined and payable in accordance with the conditions specified in Killam’s DOT. Consequently, under IFRS, trust units are defined as financial liabilities; however, for the purposes of financial statement classification and presentation, the trust units may be presented as equity instruments as they meet the puttable instrument exemption under IAS 32.
All trust units outstanding are fully paid, have no par value and are voting trust units. The DOT authorizes the issuance of an unlimited number of trust units. Trust units represent a unitholder’s proportionate undivided beneficial interest in Killam. No trust unit has any preference or priority over another. No unitholder has or is deemed to have any right of ownership in any of the assets of Killam. Each unit confers the right to one vote at any meeting of unitholders and to participate pro rata in any distributions and, on liquidation, to a pro rata share of the residual net assets remaining after preferential claims thereon of debtholders.
Unitholders have the right to redeem their units at the lesser of (i) 90% of the market price of the trust unit (market price is defined as the weighted average trading price of the previous 10 trading days) and (ii) the most recent closing market price (closing market price is defined as the weighted average trading price on the specified date) at the time of the redemption. The redemption price will be satisfied by cash, up to a limit of $50 thousand for all redemptions in a calendar month, or a note payable. For the three and nine months ended September 30, 2017, no unitholders redeemed units.
Killam pays a distribution of $0.05167 per unit per month ($0.62 per unit annualized). Killam's Distribution Reinvestment Plan ("DRIP") allows unitholders to elect to have all cash distributions from the trust reinvested in additional units. Unitholders who participate in the DRIP receive an additional distribution of units equal to 3% of each cash distribution that was reinvested. The price per unit is calculated by reference to the ten day volume weighted average price of Killam's units on the Toronto Stock Exchange preceding the relevant distribution date, which typically is on or about the 15th day of the month following the distribution declaration. The following chart highlights Killam's distributions paid and trust units reinvested for the three and nine months ended September 30, 2017, and 2016:
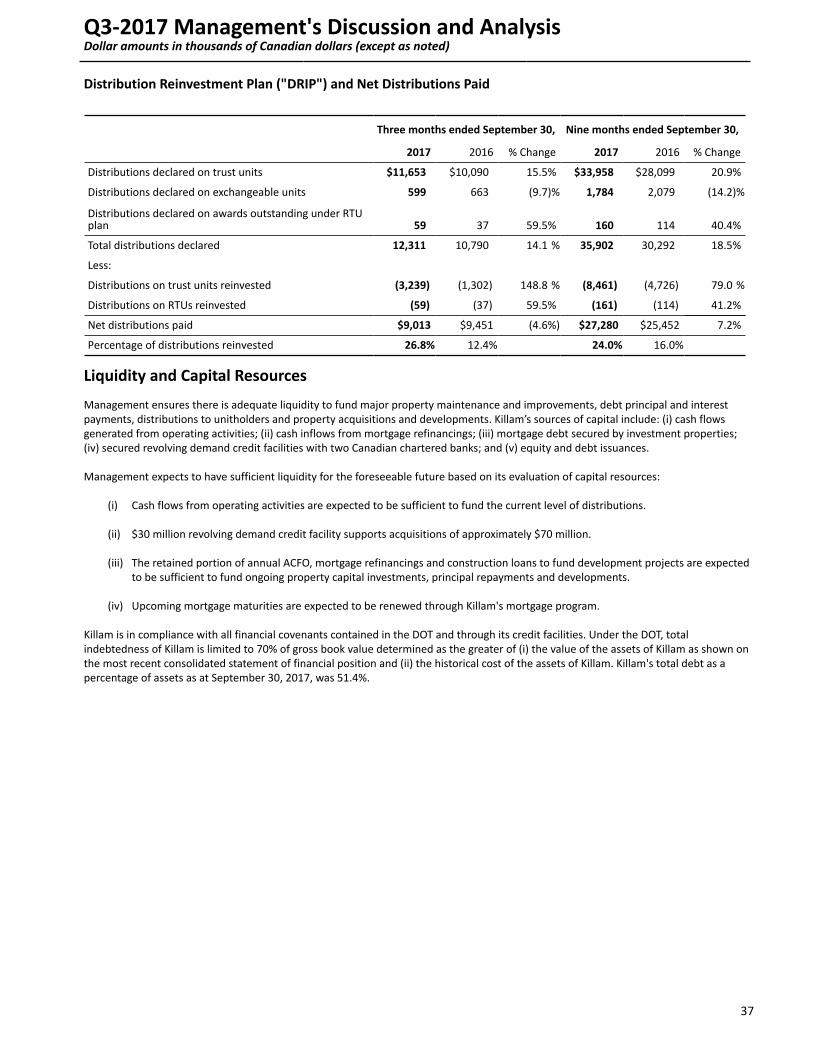
Q3-2017 Management's Discussion and AnalysisDollar amounts in thousands of Canadian dollars (except as noted)
37
Distribution Reinvestment Plan ("DRIP") and Net Distributions Paid
Three months ended September 30, Nine months ended September 30,
2017 2016 % Change 2017 2016 % Change
Distributions declared on trust units $11,653 $10,090 15.5% $33,958 $28,099 20.9%
Distributions declared on exchangeable units 599 663 (9.7)% 1,784 2,079 (14.2)%
Distributions declared on awards outstanding under RTU plan 59 37 59.5% 160 114 40.4%
Total distributions declared 12,311 10,790 14.1 % 35,902 30,292 18.5%
Less:
Distributions on trust units reinvested (3,239) (1,302) 148.8 % (8,461) (4,726) 79.0 %
Distributions on RTUs reinvested (59) (37) 59.5% (161) (114) 41.2%
Net distributions paid $9,013 $9,451 (4.6%) $27,280 $25,452 7.2%
Percentage of distributions reinvested 26.8% 12.4% 24.0% 16.0%
Liquidity and Capital Resources
Management ensures there is adequate liquidity to fund major property maintenance and improvements, debt principal and interest payments, distributions to unitholders and property acquisitions and developments. Killam’s sources of capital include: (i) cash flows generated from operating activities; (ii) cash inflows from mortgage refinancings; (iii) mortgage debt secured by investment properties; (iv) secured revolving demand credit facilities with two Canadian chartered banks; and (v) equity and debt issuances.
Management expects to have sufficient liquidity for the foreseeable future based on its evaluation of capital resources:
(i) Cash flows from operating activities are expected to be sufficient to fund the current level of distributions.
(ii) $30 million revolving demand credit facility supports acquisitions of approximately $70 million.
(iii) The retained portion of annual ACFO, mortgage refinancings and construction loans to fund development projects are expected to be sufficient to fund ongoing property capital investments, principal repayments and developments.
(iv) Upcoming mortgage maturities are expected to be renewed through Killam's mortgage program.
Killam is in compliance with all financial covenants contained in the DOT and through its credit facilities. Under the DOT, total indebtedness of Killam is limited to 70% of gross book value determined as the greater of (i) the value of the assets of Killam as shown on the most recent consolidated statement of financial position and (ii) the historical cost of the assets of Killam. Killam's total debt as a percentage of assets as at September 30, 2017, was 51.4%.
Q3-2017 Management's Discussion and AnalysisDollar amounts in thousands of Canadian dollars (except as noted)
38
PART VII
Risk Management
Killam faces a variety of risks, the majority of which are common to real estate entities. These are described in detail in the Management's Discussion and Analysis of Killam's 2016 Annual Report and in Killam's Annual Information Form, both filed on SEDAR. These factors still exist at the end of this quarter and remain relatively unchanged.
Critical Accounting Policies and Significant Accounting Judgments, Estimates and Assumptions
The condensed consolidated interim financial statements should be read in conjunction with the most recently issued Annual Report of Killam, which includes information necessary or useful to understanding Killam's business and financial statement presentation. In particular, Killam's significant accounting policies were presented in note 2 to the audited consolidated financial statements for the year ended December 31, 2016, and any changes in the accounting policies applied have been described in note 2 to the condensed consolidated interim financial statements for the three and nine-month periods ended September 30, 2017.
The preparation of financial statements in conformity with IFRS requires Management to make estimates and assumptions. Significant areas of judgment, estimates and assumptions are set out in note 3 to the consolidated financial statements found in Killam's 2016 Annual Report. The most significant estimates relate to the fair value of investment properties and deferred income taxes.
Disclosure Controls, Procedures and Internal Controls
Management, including the Chief Executive Officer and the Chief Financial Officer, does not expect that Killam’s disclosure controls and, procedures and internal controls will prevent or detect all error and all fraud. Because of the inherent limitations in all control systems, an evaluation of controls can provide only reasonable, not absolute, assurance that all control issues and instances of fraud or error, if any, within Killam have been detected. During the most recent interim period, there have been no significant changes to Killam's disclosure controls and, procedures or internal controls.
Related Party Transactions
For the three and nine months ended September 30, 2017, Killam paid $17 and $34 thousand in commercial leasing fees to a property management company controlled by an executive and Trustee of Killam (for the three and nine months ended September 30, 2016 - $nil).
During the three and nine months ended September 30, 2017, Killam paid a sales commission, totaling $nil and $0.3 million, to a property management company that is 50% owned by an executive and Trustee of Killam (for the three and nine months ended September 30, 2016 - $nil).
Halkirk Properties Limited ("Halkirk") is a company that is partially owned by a Trustee of Killam. During 2016 and year-to-date in 2017, Killam and Halkirk have been developing a 240-unit building adjacent to the Brewery Market in Halifax, Nova Scotia. Construction of the development is managed by Killam and the cost of construction is funded 50/50 by each partner.
Subsequent Events
On October 18, 2017, Killam announced a distribution of $0.05167 per unit, payable on November 15, 2017, to unitholders of record on October 31, 2017.