q3 2017 - s21.q4cdn.com · pdf filetsx – cmed . condensed consolidated interim...
TRANSCRIPT
Q3 2017
CONDENSED CONSOLIDATED
INTERIM FINANCIAL STATEMENTS (UNAUDITED)
JULY 31, 2017
FOR FURTHER INFORMATION PLEASE CONTACT: CanniMed Therapeutics Inc. #1 Plant Technology Road Saskatoon, Saskatchewan Canada S7K 3J8 [email protected] [email protected] www.cannimedtherapeutics.com TRADING SYMBOL: TSX – CMED
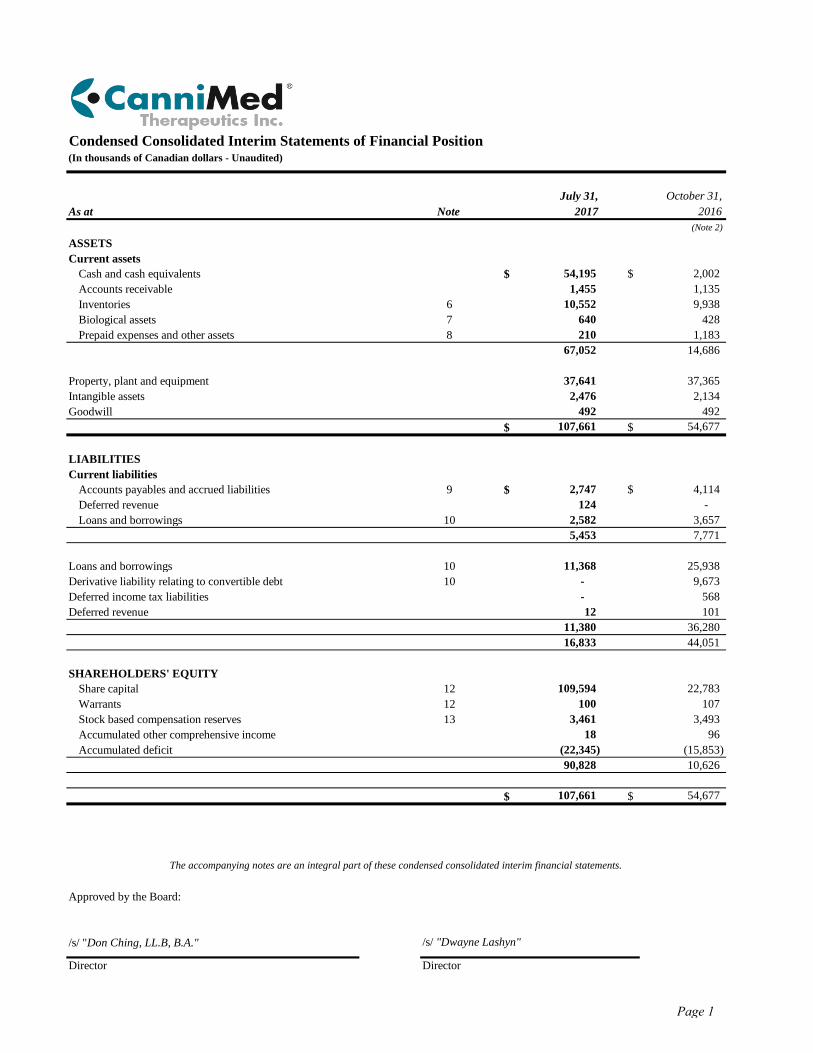
Condensed Consolidated Interim Statements of Financial Position(In thousands of Canadian dollars - Unaudited)
July 31, October 31,As at Note 2017 2016
(Note 2)
ASSETSCurrent assets
Cash and cash equivalents $ 54,195 $ 2,002 Accounts receivable 1,455 1,135 Inventories 6 10,552 9,938 Biological assets 7 640 428 Prepaid expenses and other assets 8 210 1,183
67,052 14,686
Property, plant and equipment 37,641 37,365 Intangible assets 2,476 2,134 Goodwill 492 492
$ 107,661 $ 54,677
LIABILITIESCurrent liabilities
Accounts payables and accrued liabilities 9 $ 2,747 $ 4,114 Deferred revenue 124 - Loans and borrowings 10 2,582 3,657
5,453 7,771
Loans and borrowings 10 11,368 25,938 Derivative liability relating to convertible debt 10 - 9,673 Deferred income tax liabilities - 568 Deferred revenue 12 101
11,380 36,280 16,833 44,051
SHAREHOLDERS' EQUITYShare capital 12 109,594 22,783 Warrants 12 100 107 Stock based compensation reserves 13 3,461 3,493 Accumulated other comprehensive income 18 96 Accumulated deficit (22,345) (15,853)
90,828 10,626
$ 107,661 $ 54,677
Approved by the Board:
/s/ "Don Ching, LL.B, B.A."
Director Director
The accompanying notes are an integral part of these condensed consolidated interim financial statements.
/s/ "Dwayne Lashyn"
Page 1
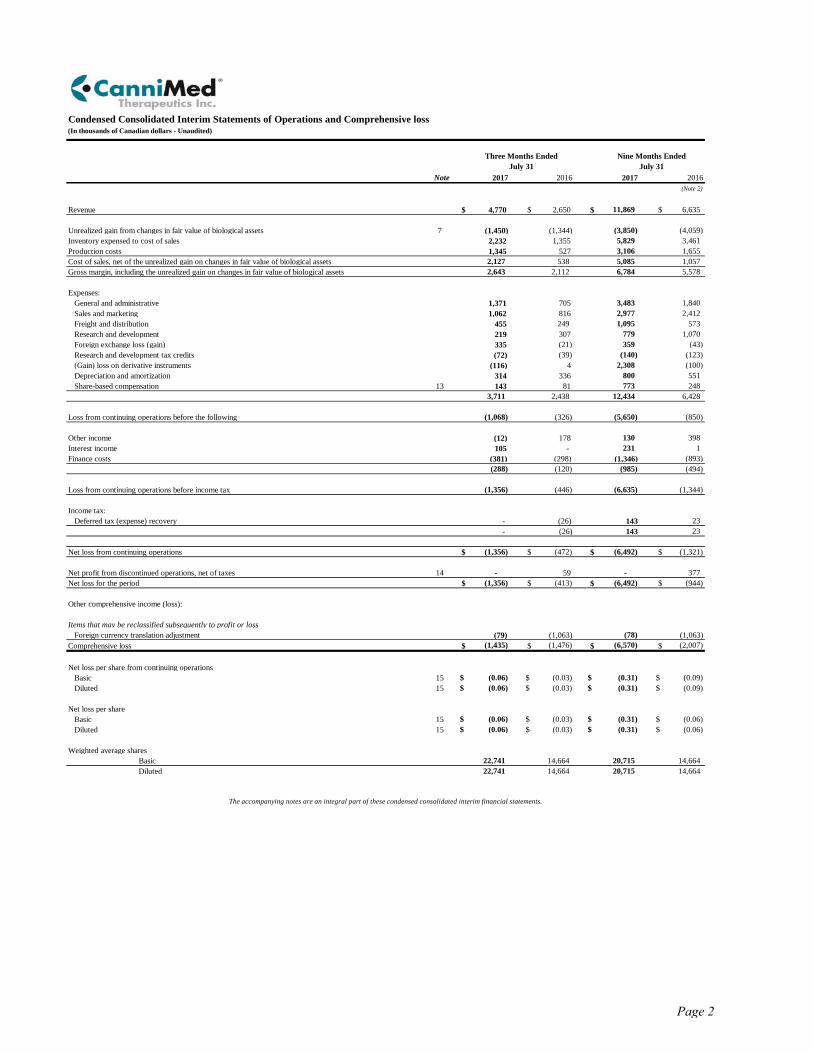
Condensed Consolidated Interim Statements of Operations and Comprehensive loss(In thousands of Canadian dollars - Unaudited)
Note 2017 2016 2017 2016(Note 2)
Revenue $ 4,770 $ 2,650 $ 11,869 $ 6,635
Unrealized gain from changes in fair value of biological assets 7 (1,450) (1,344) (3,850) (4,059) Inventory expensed to cost of sales 2,232 1,355 5,829 3,461 Production costs 1,345 527 3,106 1,655 Cost of sales, net of the unrealized gain on changes in fair value of biological assets 2,127 538 5,085 1,057 Gross margin, including the unrealized gain on changes in fair value of biological assets 2,643 2,112 6,784 5,578
Expenses: General and administrative 1,371 705 3,483 1,840 Sales and marketing 1,062 816 2,977 2,412 Freight and distribution 455 249 1,095 573 Research and development 219 307 779 1,070 Foreign exchange loss (gain) 335 (21) 359 (43) Research and development tax credits (72) (39) (140) (123) (Gain) loss on derivative instruments (116) 4 2,308 (100) Depreciation and amortization 314 336 800 551 Share-based compensation 13 143 81 773 248
3,711 2,438 12,434 6,428
Loss from continuing operations before the following (1,068) (326) (5,650) (850)
Other income (12) 178 130 398 Interest income 105 - 231 1 Finance costs (381) (298) (1,346) (893)
(288) (120) (985) (494)
Loss from continuing operations before income tax (1,356) (446) (6,635) (1,344)
Income tax: Deferred tax (expense) recovery - (26) 143 23
- (26) 143 23
Net loss from continuing operations $ (1,356) $ (472) $ (6,492) $ (1,321)
Net profit from discontinued operations, net of taxes 14 - 59 - 377 Net loss for the period $ (1,356) $ (413) $ (6,492) $ (944)
Other comprehensive income (loss):
Items that may be reclassified subsequently to profit or loss Foreign currency translation adjustment (79) (1,063) (78) (1,063)Comprehensive loss $ (1,435) $ (1,476) $ (6,570) $ (2,007)
Net loss per share from continuing operations Basic 15 $ (0.06) $ (0.03) $ (0.31) $ (0.09) Diluted 15 $ (0.06) $ (0.03) $ (0.31) $ (0.09)
Net loss per share Basic 15 $ (0.06) $ (0.03) $ (0.31) $ (0.06) Diluted 15 $ (0.06) $ (0.03) $ (0.31) $ (0.06)
Weighted average shares Basic 22,741 14,664 20,715 14,664 Diluted 22,741 14,664 20,715 14,664
Nine Months EndedJuly 31
Three Months EndedJuly 31
The accompanying notes are an integral part of these condensed consolidated interim financial statements.
Page 2
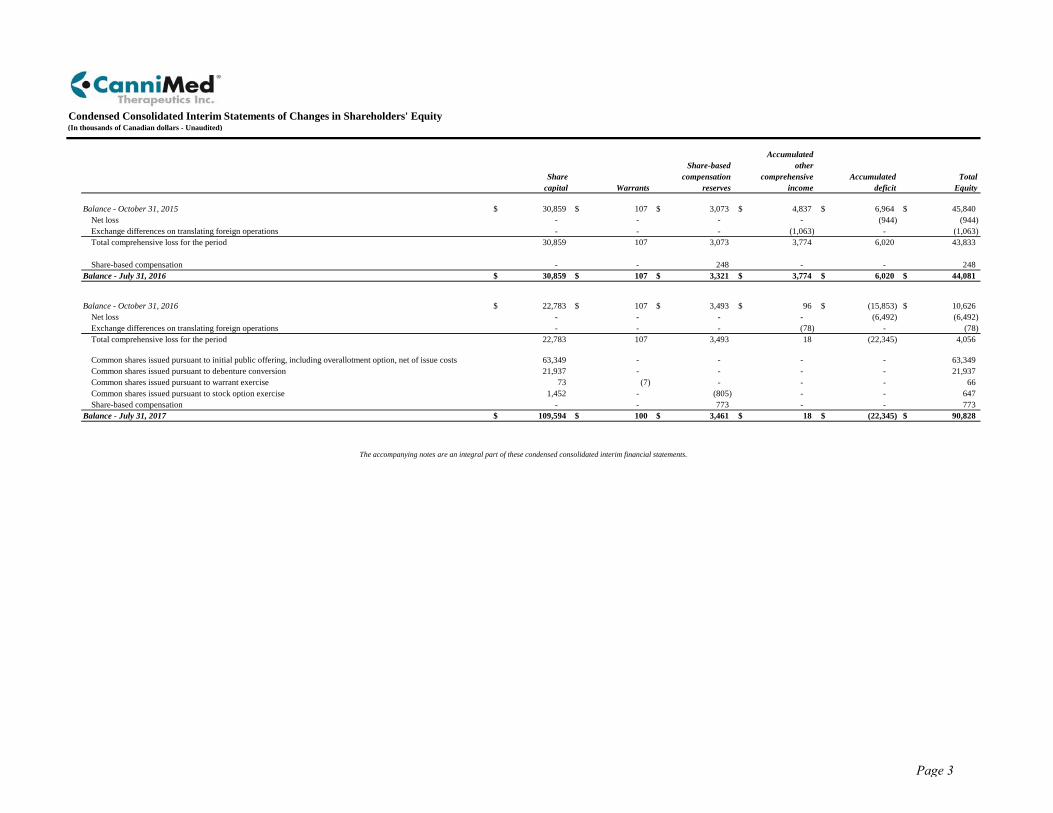
Condensed Consolidated Interim Statements of Changes in Shareholders' Equity(In thousands of Canadian dollars - Unaudited)
AccumulatedShare-based other
Share compensation comprehensive Accumulated Totalcapital Warrants reserves income deficit Equity
Balance - October 31, 2015 $ 30,859 $ 107 $ 3,073 $ 4,837 $ 6,964 $ 45,840 Net loss - - - - (944) (944) Exchange differences on translating foreign operations - - - (1,063) - (1,063) Total comprehensive loss for the period 30,859 107 3,073 3,774 6,020 43,833
Share-based compensation - - 248 - - 248 Balance - July 31, 2016 $ 30,859 $ 107 $ 3,321 $ 3,774 $ 6,020 $ 44,081
Balance - October 31, 2016 $ 22,783 $ 107 $ 3,493 $ 96 $ (15,853) $ 10,626 Net loss - - - - (6,492) (6,492) Exchange differences on translating foreign operations - - - (78) - (78) Total comprehensive loss for the period 22,783 107 3,493 18 (22,345) 4,056
Common shares issued pursuant to initial public offering, including overallotment option, net of issue costs 63,349 - - - - 63,349 Common shares issued pursuant to debenture conversion 21,937 - - - - 21,937 Common shares issued pursuant to warrant exercise 73 (7) - - - 66 Common shares issued pursuant to stock option exercise 1,452 - (805) - - 647 Share-based compensation - - 773 - - 773 Balance - July 31, 2017 $ 109,594 $ 100 $ 3,461 $ 18 $ (22,345) $ 90,828
The accompanying notes are an integral part of these condensed consolidated interim financial statements.
Page 3
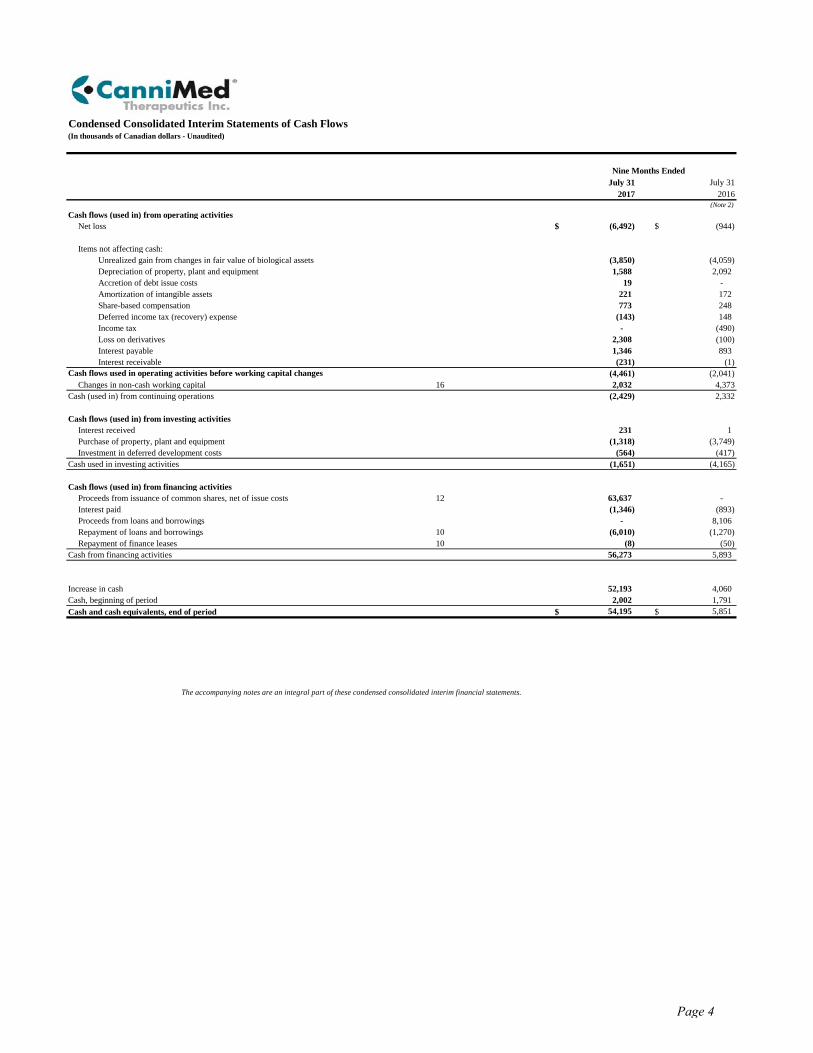
Condensed Consolidated Interim Statements of Cash Flows(In thousands of Canadian dollars - Unaudited)
July 31 July 312017 2016
(Note 2)Cash flows (used in) from operating activities
Net loss $ (6,492) $ (944)
Items not affecting cash:Unrealized gain from changes in fair value of biological assets (3,850) (4,059) Depreciation of property, plant and equipment 1,588 2,092 Accretion of debt issue costs 19 - Amortization of intangible assets 221 172 Share-based compensation 773 248 Deferred income tax (recovery) expense (143) 148 Income tax - (490) Loss on derivatives 2,308 (100) Interest payable 1,346 893 Interest receivable (231) (1)
(4,461) (2,041) Changes in non-cash working capital 16 2,032 4,373
Cash (used in) from continuing operations (2,429) 2,332
Cash flows (used in) from investing activitiesInterest received 231 1 Purchase of property, plant and equipment (1,318) (3,749) Investment in deferred development costs (564) (417)
Cash used in investing activities (1,651) (4,165)
Cash flows (used in) from financing activitiesProceeds from issuance of common shares, net of issue costs 12 63,637 - Interest paid (1,346) (893) Proceeds from loans and borrowings - 8,106 Repayment of loans and borrowings 10 (6,010) (1,270) Repayment of finance leases 10 (8) (50)
Cash from financing activities 56,273 5,893
Increase in cash 52,193 4,060 Cash, beginning of period 2,002 1,791 Cash and cash equivalents, end of period $ 54,195 $ 5,851
The accompanying notes are an integral part of these condensed consolidated interim financial statements.
Cash flows used in operating activities before working capital changes
Nine Months Ended
Page 4
CanniMed Therapeutics Inc. Notes to the Condensed Consolidated Interim Financial Statements For the three and nine months ended July 31, 2017 and 2016 Expressed in Thousands of Canadian Dollars, except share data or as otherwise noted
Page 5
1. General Information CanniMed Therapeutics Inc. (“CanniMed”) is a company incorporated in Canada, with its registered and head office located at #1 Plant Technology Road, Saskatoon, SK., Canada, S7K 3J8.
The principal business activities of CanniMed and its subsidiaries (collectively “the Company”) are plant biotechnology research, product development and the production of plant based materials for biopharmaceutical, agricultural and environmental market applications. The Company is a licensed producer and distributor of medical cannabis pursuant to the provisions of the Access to Cannabis for Medical Purposes Regulations (“ACMPR”) and the Controlled Drugs and Substances Act and its Regulations.
2. Basis of preparation Statement of compliance These condensed consolidated interim financial statements for the three and nine months ended July 31, 2017 and 2016 have been prepared in accordance with International Accounting Standard 34, Interim Financial Reporting (“IAS 34”), following the same accounting policies and methods of application as those used in preparing the audited consolidated financial statements for the year ended October 31, 2016. These condensed consolidated interim financial statements do not include all of the information required for full annual financial statements and should be read in conjunction with the Company’s 2016 annual consolidated financial statements prepared in accordance with International Financial Reporting Standards (“IFRS”).
These condensed consolidated interim financial statements were authorized for issue by the Company’s Board of Directors on September 8, 2017.
Corporate reorganization Since acquiring all of the shares of Prairie Plant Systems Inc. (“PPS”) on November 1, 2016, PPS has been a wholly-owned subsidiary of CanniMed. On October 31, 2016, prior to its acquisition by CanniMed, PPS completed a corporate reorganization (the “Reorganization”).
Prior to the Reorganization, shareholders of PPS held 3,667,695 Class “A” common shares in the capital of PPS (the “Old Shares”) and PPS owned all of the shares of PPS USA Holdings, Inc. Also, prior to the Reorganization, PPS created a new wholly-owned subsidiary, PM Power Group Holdings Ltd. (“PM Power”) which acquired all of the shares of PPS USA Holdings, Inc. Another holding company, CanniMed, was also created. Pursuant to a share exchange agreement entered into with each of its shareholders (the “Share Exchange Agreements”), PPS amended its capital by filing articles of amendment to create an unlimited number of Class “D” shares, and PPS shareholders then transferred to PPS their Old Shares effective on October 31, 2016 in exchange for one Class “D” share of PPS (the “New Shares”) and one common share of PM Power (the “PM Shares”) for each Old Share held by the PPS shareholders.
On November 1, 2016, CanniMed acquired 100 percent of the Class “D” shares of PPS by executing a share exchange transaction on a 4:1 basis where CanniMed issued 14,670,780 CanniMed common shares to PPS’ shareholders in exchange for their 3,667,695 Class “D” shares of PPS. As a result of this transaction, former shareholders of PPS held 100 percent of the common shares of CanniMed, and CanniMed became the holder of 100 percent of the issued and outstanding shares of PPS.
In relation to the transaction whereby CanniMed acquired 100% of the PPS Class D shares, CanniMed is considered the acquirer and the PPS the acquiree. The acquisition was recorded using the previous carrying values of PPS’s assets and liabilities as the acquisition of the shares did not result in a substantial change in ownership. Moreover, the
CanniMed Therapeutics Inc. Notes to the Condensed Consolidated Interim Financial Statements For the three and nine months ended July 31, 2017 and 2016 Expressed in Thousands of Canadian Dollars, except share data or as otherwise noted
Page 6
condensed consolidated interim financial statements are under the name of CanniMed; however, they are a continuation of the financial statements of PPS, which had a financial year end of October 31, 2016. As a result, the comparative figures presented are those of PPS.
Basis of measurement These condensed consolidated interim financial statements have been prepared on the historical cost basis except for biological assets and certain financial instruments, which are measured at fair value.
Historical cost is generally based on the fair value of the consideration given in exchange for assets.
Functional and presentation currency These condensed consolidated interim financial statements are presented in Canadian dollars, which is CanniMed’s functional and presentation currency. The subsidiary located in the United States of America has a U.S. dollar functional currency and the subsidiaries located in Canada have a Canadian dollar functional currency.
Basis of consolidation These condensed consolidated interim financial statements incorporate the accounts of CanniMed and entities controlled by it. Control exists when CanniMed has the power to govern the financial and operating policies of an entity so as to obtain benefits from its activities. In assessing control, potential voting rights that currently are exercisable are taken into account. The accounts of subsidiaries are included in the consolidated financial statements of the Company from the date that control commences until the date that control ceases. Specifically, income and expenses of the subsidiary acquired or disposed of during the year are included in the consolidated statement of profit or loss and other comprehensive income from the date the Company gains control until the date when the Company ceases to control the subsidiary.
When the Company loses control of a subsidiary, a gain or loss is recognized in the profit or loss and is calculated as the difference between (i) the aggregate of the fair value of the consideration received and the fair value of any retained interest and (ii) the previous carrying amount of the assets (including goodwill), and liabilities of the subsidiary interest. All amounts previously recognized in other comprehensive income in relation to that subsidiary are accounted for as if the Company had directly disposed of the related assets or liabilities.
At July 31, 2017, the Company had the following wholly-owned subsidiary corporations: Prairie Plant Systems Inc. (operating in Canada), CanniMed Ltd. (operating in Canada), SubTerra (operating in the US) and CanniMed International Ltd., a holding company which was incorporated in Canada during the third quarter of 2017 for the Company’s international sales.
Intercompany balances and transactions, and any unrealized income and expenses arising from intercompany transactions, are eliminated in preparing the condensed consolidated interim financial statements.
3. Significant accounting policies These condensed consolidated interim financial statements are prepared, except as noted below (Note 4), using accounting policies consistent with the Company’s annual consolidated financial statements and notes thereto for the year ended October 31, 2016. The accounting policies used by Management for the Company and its wholly-owned subsidiaries have been applied consistently to all periods presented in these condensed consolidated interim financial statements, unless otherwise indicated.
CanniMed Therapeutics Inc. Notes to the Condensed Consolidated Interim Financial Statements For the three and nine months ended July 31, 2017 and 2016 Expressed in Thousands of Canadian Dollars, except share data or as otherwise noted
Page 7
4. Accounting standards Changes in Accounting Policies The Company has adopted the following new standards, along with any consequential amendments, effective November 1, 2016. These changes were made in accordance with the applicable transitional provisions.
Amendments to IAS 16 and IAS 41 Agriculture: Bearer Plants
This amendment provides guidance regarding the accounting for bearer plants by providing a definition of bearer plants and brings bearer plants within the scope of IAS 16 from IAS 41. The amendment is effective for annual reporting periods beginning on or after January 1, 2016, and has been applied retrospectively. The amendment did not have a significant impact on the Company’s consolidated financial statements as the carrying cost of bearer plants is negligible.
Disclosure Initiative (Amendments to IAS 1)
On December 18, 2014, the IASB issued amendments to IAS 1 Presentation of Financial Statements as part of its major initiative to improve presentation and disclosure in financial statements. The amendments are effective for annual periods beginning on or after January 1, 2016. These amendments did not have a significant impact on the Company’s consolidated financial statements.
IFRS 10 Consolidated Financial Statements
In September 2014, IFRS 10 was amended to clarify an inconsistency between this standard and IAS 28, Investments in Associates and Joint Ventures. The amendment requires that a full gain or loss is recognized when a transaction involves a business (whether it is housed in a subsidiary or not). A partial gain or loss is recognized when a transaction involves assets that do not constitute a business, even if the assets are housed in a subsidiary. The amendment is effective for annual reporting periods beginning on or after January 1, 2016. This amendment did not have an impact on the consolidated financial statements of the Company.
Future Changes in Accounting Policies These are the changes that the Company reasonably expects will have an impact on its disclosures, financial position or performance when applied at a future date. The Company intends to adopt these standards, if applicable, when they become effective.
IFRS 15 Revenue from Contracts with Customers
In May 2014, IFRS 15 was issued by the International Accounting Standards Board (“IASB”) which provides a comprehensive framework for recognition, measurement, and disclosure of revenue from contracts with customers, excluding contracts within the scope of the standards on leases, insurance contracts and financial instruments. IFRS 15 is effective for annual periods beginning on or after January 1, 2018, with early application permitted. Entities have the option of using either a full retrospective or a modified retrospective approach to adopt the guidance. The Company is currently assessing the potential impacts of IFRS 15.
IFRS 9 Financial Instruments
IFRS 9 was issued by IASB in November 2009 and October 2010 and will replace IAS 39. IFRS 9 uses a single approach to determine whether a financial asset is measured at amortized cost or fair value, replacing the multiple rules in IAS 39. The approach in IFRS 9 is based on how an entity manages its financial instruments in the context of its business model and the contractual cash flow characteristics of the financial assets. Two measurement categories continue to exist to account for financial liabilities in IFRS 9, fair value through profit or loss and amortized cost.
CanniMed Therapeutics Inc. Notes to the Condensed Consolidated Interim Financial Statements For the three and nine months ended July 31, 2017 and 2016 Expressed in Thousands of Canadian Dollars, except share data or as otherwise noted
Page 8
Financial liabilities held-for-trading are measured at fair value through profit or loss, and all other financial liabilities are measured at amortized cost unless the fair value option is applied. The treatment of embedded derivatives under the new standard is consistent with IAS 39 and is applied to financial liabilities and non-derivative hosts not within the scope of the standard. IFRS 9 is effective for annual periods beginning on or after January 1, 2018, with early application permitted. The Company is currently assessing the potential impact of IFRS 9.
IFRS 16 Leases
In January 2016, the IASB issued IFRS 16, which specifies how an IFRS reporter will recognize, measure, present and disclose leases. The standard provides a single lessee accounting model, requiring lessees to recognize assets and liabilities for all leases unless the lease term is 12 months or less or the underlying asset has a low value. Lessors continue to classify leases as operating or finance, with IFRS 16’s approach to lessor accounting substantially unchanged from its predecessor, IAS 17. IFRS 16 is effective for annual reporting periods beginning on or after January 1, 2019, and a lessee shall either apply IFRS 16 with full retrospective effect or alternatively not restate comparative information but recognize the cumulative effect of initially applying IFRS 16 as an adjustment to opening equity at the date of initial application. The Company is currently assessing the potential impact of IFRS 16.
IFRS 2 Share-Based Payment
In June 2016, the IASB issued amendments to IFRS 2. These amendments provide clarification on how to account for certain types of share-based payment transactions. The amendments are effective for the annual period beginning on or after January 1, 2018. The extent of the impact of the adoption of the amendments has not yet been determined.
IAS 7 Statement of Cash Flows
As part of their disclosure initiative, the IASB has issued amendments to IAS 7 Statement of Cash Flows requiring a reconciliation of liabilities arising from financing activities to enable users of the financial statements to evaluate both cash flow and non-cash changes in the net debt of a Company. The amendments to IAS 7 are effective for annual periods beginning on or after January 1, 2017. The extent of the impact of adoption of the amendments has not yet been determined.
IAS 12 Income Taxes
In January 2016, the IASB issued amendments to IAS 12 to provide clarification on the requirements relating to the recognition of deferred tax assets for unrealized losses on debt instruments measured at fair value. Adoption of the amendments to IAS 12 is required for the annual period beginning on or after January 1, 2017. The Company will adopt these amendments in its financial statements for the year beginning on November 1, 2017. The extent of the impact of adoption of the amendments has not yet been determined.
5. Critical accounting estimates and judgements: The preparation of the consolidated financial statements in conformity with IFRS requires management to make judgements, estimates and assumptions that affect the application of accounting policies and the reported amounts of assets, liabilities, income and expenses. Actual results may differ from these estimates. Estimates and underlying assumptions are reviewed on an ongoing basis. Revisions to accounting estimates are recognized in the year in which the estimates are revised and in any future years affected.
Critical judgements in applying accounting policies Revenue recognition In relation to its discontinued operation, the Company considered the detailed criteria for the recognition of revenue from the sale of power set out in IAS 18, specifically whether the amount of revenue could be measured reliably. As
CanniMed Therapeutics Inc. Notes to the Condensed Consolidated Interim Financial Statements For the three and nine months ended July 31, 2017 and 2016 Expressed in Thousands of Canadian Dollars, except share data or as otherwise noted
Page 9
a result, management made judgements regarding whether the amount of revenue could be measured reliably and determined that the revenue recognized under these contracts could be measured reliably.
Key sources of estimation uncertainty Valuation of biological assets and inventories Biological assets consisting of cannabis plants are measured at fair value less costs to sell up to the point of harvest.
Determination of the fair values of the biological assets requires the Company to make assumptions about how market participants assign fair values to these assets. These assumptions primarily relate to the level of effort required to bring the cannabis plants up to the point of harvest, costs to convert the harvested plants to finished goods, sales price, risk of loss, expected remaining future yields for the plants, and estimating values during the growth cycle.
The valuation of biological assets at the point of harvest is the cost basis for all cannabis based inventory and thus any critical estimates and judgements related to the valuation of biological assets are also applicable for inventory. The valuation of work in process and finished goods also requires the estimate of conversion costs incurred, which become part of the carrying amount for the inventory. The Company must also determine if the cost of any inventory exceeds its net realizable value, such as cases where prices have decreased, or inventory has spoiled or has otherwise been damaged. See Note 7 for additional information with respect to the estimates contained within biological assets.
Estimated useful lives and amortization of property plant and equipment and intangible assets Amortization of property, plant and equipment and finite-life intangible assets are dependent upon estimates of useful lives, which are determined through the exercise of judgement. The assessment of any impairment of these assets is dependent upon estimates of recoverable amounts that take into account factors such as economic and market conditions and the useful lives of assets.
Impairment of goodwill, intangibles and long-lived assets Determining whether impairment relating to goodwill, intangibles and long-lived assets exists requires an estimation of the recoverable amount of cash generating units (“CGUs”). Determining a CGU’s recoverable amount requires the determination of the higher of the value in use of the CGU and the fair value less cost to sell of the CGU. The determination of the recoverable amount requires the Company to estimate future cash flows, discount rates and salvage values, as applicable.
Share-based compensation In calculating the share-based compensation expense, key estimates such as the value of the common shares, the rate of forfeiture of options granted, the expected life of the option and the risk-free interest rate are used.
Warrants In calculating the value of the warrants, key estimates such as the value of the common shares and the risk-free interest rate are used.
Taxes Deferred tax assets are recognized for all unused tax losses to the extent that it is probable that taxable profit will be available against which the losses can be utilized. Significant management judgement is required to determine the amount of deferred tax assets that can be recognized, based upon the likely timing and the level of future taxable profits together with tax planning strategies.
CanniMed Therapeutics Inc. Notes to the Condensed Consolidated Interim Financial Statements For the three and nine months ended July 31, 2017 and 2016 Expressed in Thousands of Canadian Dollars, except share data or as otherwise noted
Page 10
Derivative liability relating to convertible debt Determination of the fair value of the Company’s derivative liabilities requires the Company to establish estimates of unobservable inputs such as the fair value of the Company’s shares.
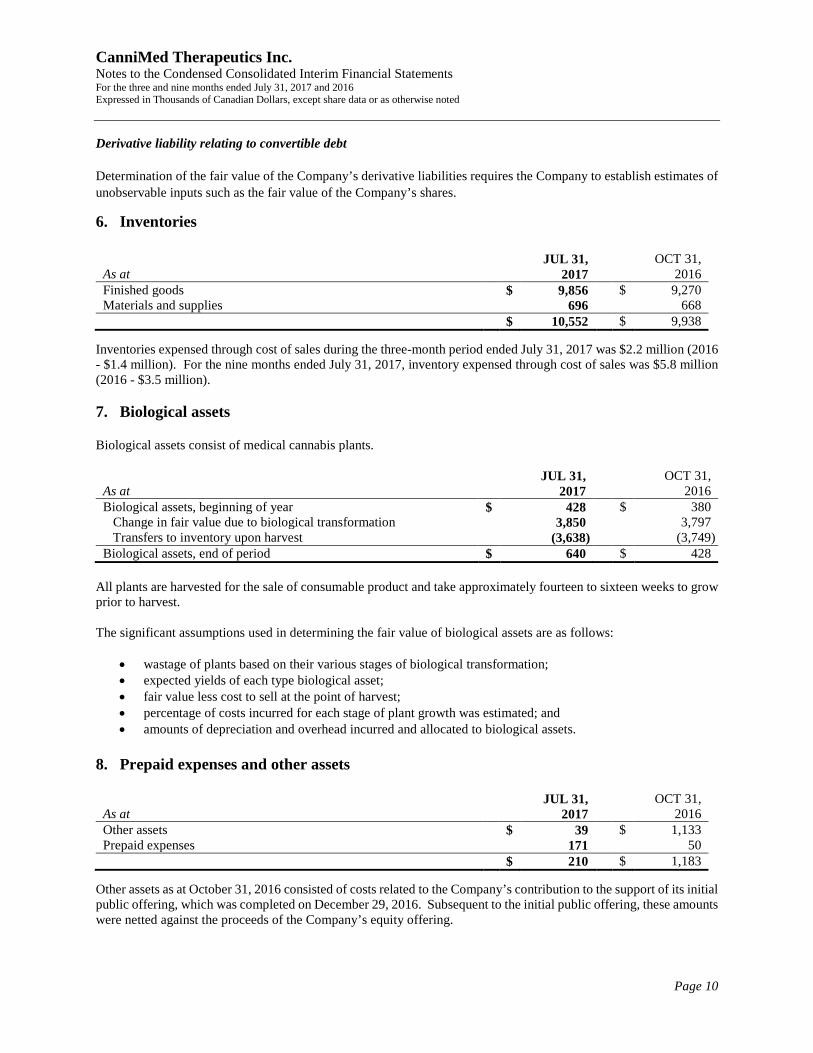
6. Inventories
JUL 31, OCT 31, As at 2017 2016 Finished goods $ 9,856 $ 9,270 Materials and supplies 696 668 $ 10,552 $ 9,938
Inventories expensed through cost of sales during the three-month period ended July 31, 2017 was $2.2 million (2016 - $1.4 million). For the nine months ended July 31, 2017, inventory expensed through cost of sales was $5.8 million (2016 - $3.5 million).
7. Biological assets Biological assets consist of medical cannabis plants.
JUL 31, OCT 31, As at 2017 2016 Biological assets, beginning of year $ 428 $ 380 Change in fair value due to biological transformation 3,850 3,797 Transfers to inventory upon harvest (3,638) (3,749) Biological assets, end of period $ 640 $ 428
All plants are harvested for the sale of consumable product and take approximately fourteen to sixteen weeks to grow prior to harvest. The significant assumptions used in determining the fair value of biological assets are as follows:
• wastage of plants based on their various stages of biological transformation; • expected yields of each type biological asset; • fair value less cost to sell at the point of harvest; • percentage of costs incurred for each stage of plant growth was estimated; and • amounts of depreciation and overhead incurred and allocated to biological assets.
8. Prepaid expenses and other assets
JUL 31, OCT 31, As at 2017 2016 Other assets $ 39 $ 1,133 Prepaid expenses 171 50 $ 210 $ 1,183
Other assets as at October 31, 2016 consisted of costs related to the Company’s contribution to the support of its initial public offering, which was completed on December 29, 2016. Subsequent to the initial public offering, these amounts were netted against the proceeds of the Company’s equity offering.
CanniMed Therapeutics Inc. Notes to the Condensed Consolidated Interim Financial Statements For the three and nine months ended July 31, 2017 and 2016 Expressed in Thousands of Canadian Dollars, except share data or as otherwise noted
Page 11
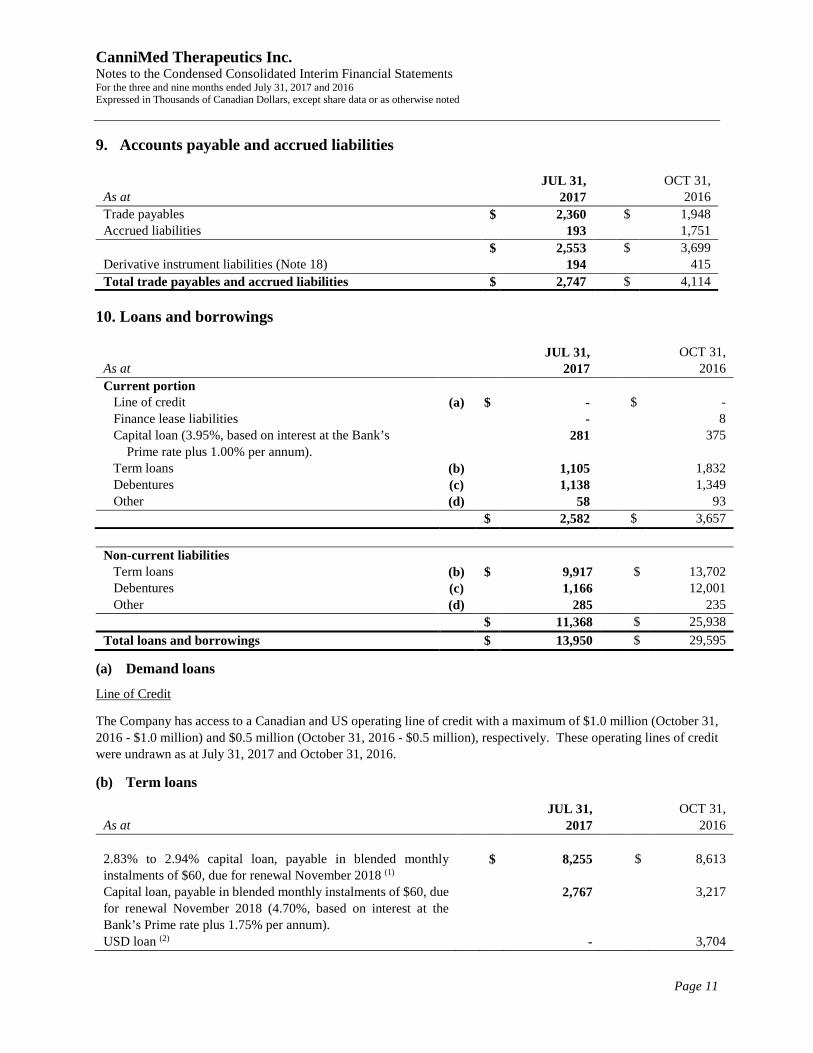
9. Accounts payable and accrued liabilities
10. Loans and borrowings
JUL 31, OCT 31, As at 2017 2016 Current portion Line of credit (a) $ - $ - Finance lease liabilities - 8 Capital loan (3.95%, based on interest at the Bank’s Prime rate plus 1.00% per annum).
281 375
Term loans (b) 1,105 1,832 Debentures (c) 1,138 1,349 Other (d) 58 93 $ 2,582 $ 3,657
Non-current liabilities Term loans (b) $ 9,917 $ 13,702 Debentures (c) 1,166 12,001 Other (d) 285 235 $ 11,368 $ 25,938 Total loans and borrowings $ 13,950 $ 29,595
(a) Demand loans
Line of Credit
The Company has access to a Canadian and US operating line of credit with a maximum of $1.0 million (October 31, 2016 - $1.0 million) and $0.5 million (October 31, 2016 - $0.5 million), respectively. These operating lines of credit were undrawn as at July 31, 2017 and October 31, 2016.
(b) Term loans
JUL 31, OCT 31, As at 2017 2016 2.83% to 2.94% capital loan, payable in blended monthly instalments of $60, due for renewal November 2018 (1)
$ 8,255 $ 8,613
Capital loan, payable in blended monthly instalments of $60, due for renewal November 2018 (4.70%, based on interest at the Bank’s Prime rate plus 1.75% per annum).
2,767 3,217
USD loan (2) - 3,704
JUL 31, OCT 31, As at 2017 2016 Trade payables $ 2,360 $ 1,948 Accrued liabilities 193 1,751 $ 2,553 $ 3,699 Derivative instrument liabilities (Note 18) 194 415 Total trade payables and accrued liabilities $ 2,747 $ 4,114
CanniMed Therapeutics Inc. Notes to the Condensed Consolidated Interim Financial Statements For the three and nine months ended July 31, 2017 and 2016 Expressed in Thousands of Canadian Dollars, except share data or as otherwise noted
Page 12
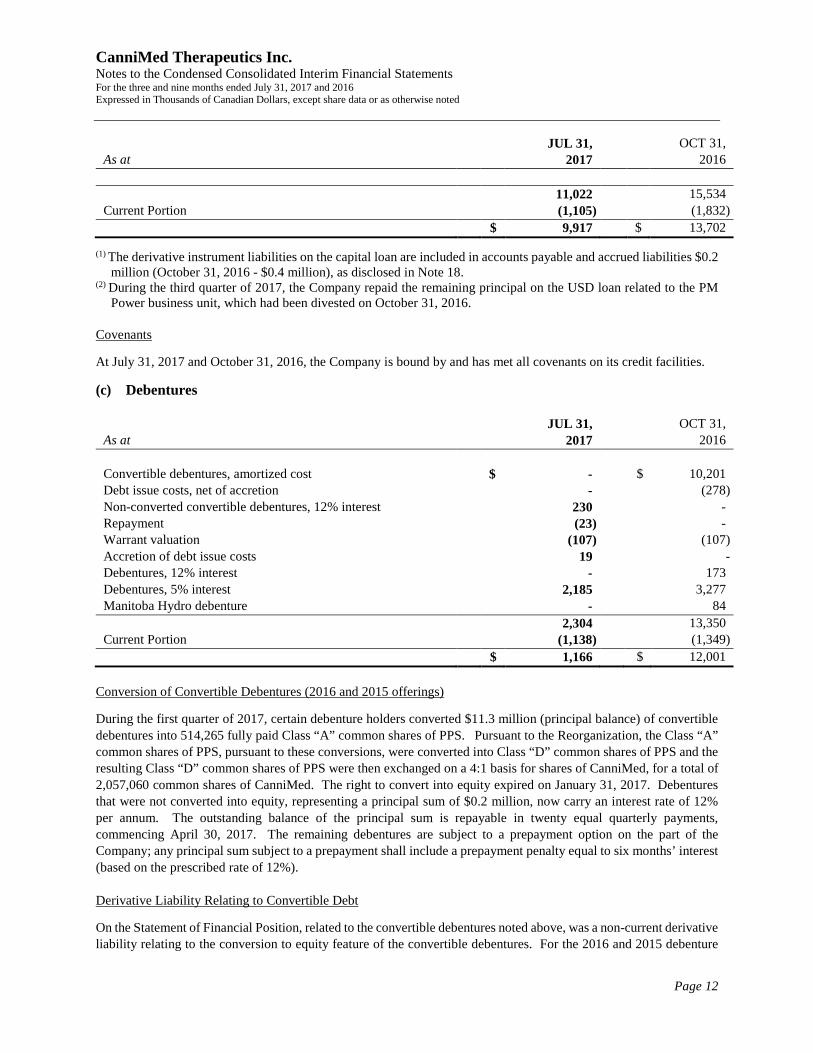
JUL 31, OCT 31, As at 2017 2016 11,022 15,534 Current Portion (1,105) (1,832) $ 9,917 $ 13,702
(1) The derivative instrument liabilities on the capital loan are included in accounts payable and accrued liabilities $0.2
million (October 31, 2016 - $0.4 million), as disclosed in Note 18. (2) During the third quarter of 2017, the Company repaid the remaining principal on the USD loan related to the PM
Power business unit, which had been divested on October 31, 2016. Covenants
At July 31, 2017 and October 31, 2016, the Company is bound by and has met all covenants on its credit facilities.
(c) Debentures
JUL 31, OCT 31, As at 2017 2016 Convertible debentures, amortized cost $ - $ 10,201 Debt issue costs, net of accretion - (278) Non-converted convertible debentures, 12% interest 230 - Repayment (23) - Warrant valuation (107) (107) Accretion of debt issue costs 19 - Debentures, 12% interest - 173 Debentures, 5% interest 2,185 3,277 Manitoba Hydro debenture - 84 2,304 13,350 Current Portion (1,138) (1,349) $ 1,166 $ 12,001
Conversion of Convertible Debentures (2016 and 2015 offerings)
During the first quarter of 2017, certain debenture holders converted $11.3 million (principal balance) of convertible debentures into 514,265 fully paid Class “A” common shares of PPS. Pursuant to the Reorganization, the Class “A” common shares of PPS, pursuant to these conversions, were converted into Class “D” common shares of PPS and the resulting Class “D” common shares of PPS were then exchanged on a 4:1 basis for shares of CanniMed, for a total of 2,057,060 common shares of CanniMed. The right to convert into equity expired on January 31, 2017. Debentures that were not converted into equity, representing a principal sum of $0.2 million, now carry an interest rate of 12% per annum. The outstanding balance of the principal sum is repayable in twenty equal quarterly payments, commencing April 30, 2017. The remaining debentures are subject to a prepayment option on the part of the Company; any principal sum subject to a prepayment shall include a prepayment penalty equal to six months’ interest (based on the prescribed rate of 12%). Derivative Liability Relating to Convertible Debt
On the Statement of Financial Position, related to the convertible debentures noted above, was a non-current derivative liability relating to the conversion to equity feature of the convertible debentures. For the 2016 and 2015 debenture
CanniMed Therapeutics Inc. Notes to the Condensed Consolidated Interim Financial Statements For the three and nine months ended July 31, 2017 and 2016 Expressed in Thousands of Canadian Dollars, except share data or as otherwise noted
Page 13
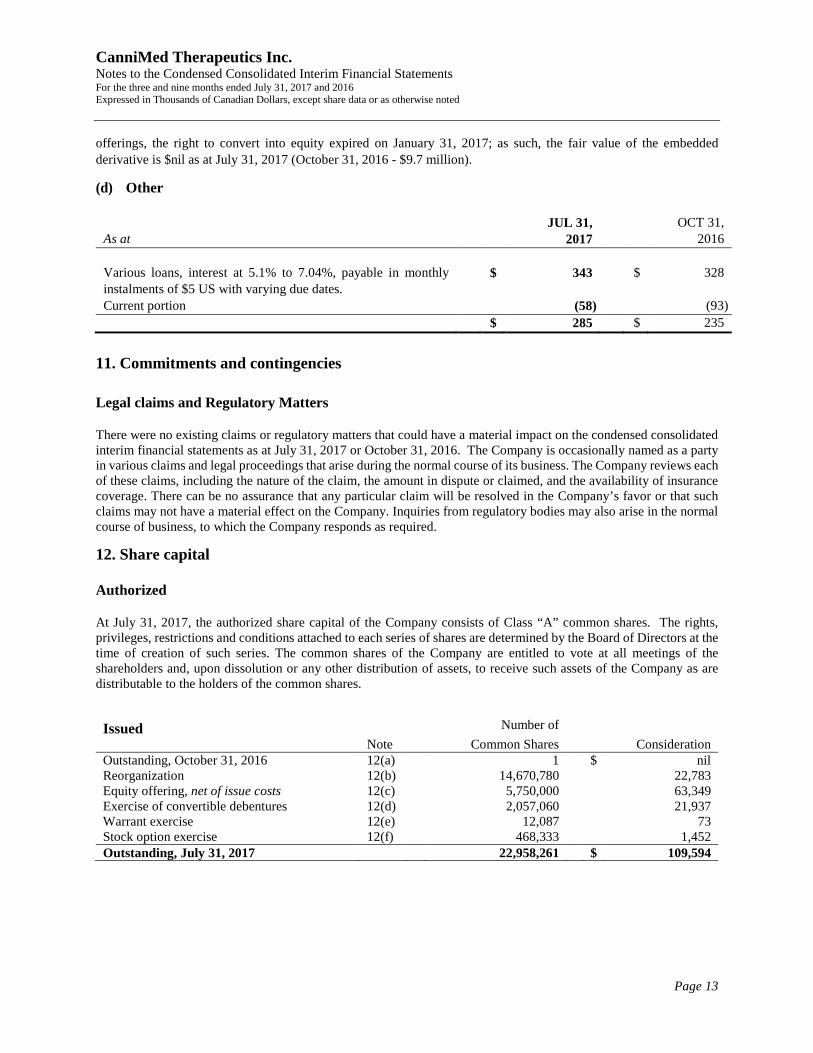
offerings, the right to convert into equity expired on January 31, 2017; as such, the fair value of the embedded derivative is $nil as at July 31, 2017 (October 31, 2016 - $9.7 million).
(d) Other
JUL 31, OCT 31, As at 2017 2016 Various loans, interest at 5.1% to 7.04%, payable in monthly instalments of $5 US with varying due dates.
$ 343 $ 328
Current portion (58) (93) $ 285 $ 235
11. Commitments and contingencies
Legal claims and Regulatory Matters There were no existing claims or regulatory matters that could have a material impact on the condensed consolidated interim financial statements as at July 31, 2017 or October 31, 2016. The Company is occasionally named as a party in various claims and legal proceedings that arise during the normal course of its business. The Company reviews each of these claims, including the nature of the claim, the amount in dispute or claimed, and the availability of insurance coverage. There can be no assurance that any particular claim will be resolved in the Company’s favor or that such claims may not have a material effect on the Company. Inquiries from regulatory bodies may also arise in the normal course of business, to which the Company responds as required.
12. Share capital
Authorized At July 31, 2017, the authorized share capital of the Company consists of Class “A” common shares. The rights, privileges, restrictions and conditions attached to each series of shares are determined by the Board of Directors at the time of creation of such series. The common shares of the Company are entitled to vote at all meetings of the shareholders and, upon dissolution or any other distribution of assets, to receive such assets of the Company as are distributable to the holders of the common shares.
Issued Number of Note Common Shares Consideration Outstanding, October 31, 2016 12(a) 1 $ nil Reorganization 12(b) 14,670,780 22,783 Equity offering, net of issue costs 12(c) 5,750,000 63,349 Exercise of convertible debentures 12(d) 2,057,060 21,937 Warrant exercise 12(e) 12,087 73 Stock option exercise 12(f) 468,333 1,452 Outstanding, July 31, 2017 22,958,261 $ 109,594
CanniMed Therapeutics Inc. Notes to the Condensed Consolidated Interim Financial Statements For the three and nine months ended July 31, 2017 and 2016 Expressed in Thousands of Canadian Dollars, except share data or as otherwise noted
Page 14
Issuance of shares (a) Equity Issue on Incorporation
On October 31, 2016, CanniMed issued a single common share upon incorporation.
(b) Reorganization
On November 1, 2016, as a result of the Reorganization of PPS, CanniMed issued 14,670,780 common shares as consideration for the sale by former shareholders of PPS of all of their shares of PPS to CanniMed.
(c) Initial Public Offering and Exercise of Over-allotment Option
On December 29, 2017, CanniMed completed an initial public offering of its common shares (the “Offering”). In connection with the Offering, CanniMed issued 5,000,000 common shares at a price of $12.00 per common share.
CanniMed granted the underwriters an over-allotment option, exercisable in whole or in part, for a period of 30 days following the closing of the Offering, to purchase up to an additional 750,000 common shares at $12.00 per common share; this option was exercised in full on January 30, 2017.
(d) Conversion of Convertible Debentures
During the nine months ended July 31, 2017, CanniMed issued 2,057,060 common shares upon conversion convertible debentures.
(e) Exercise of Warrants
During the nine months ended July 31, 2017, CanniMed issued 12,087 common shares upon exercise of warrants.
(f) Exercise of Stock Options
During the nine months ended July 31, 2017, CanniMed issued 468,333 common shares upon exercise of stock options (Note 13).
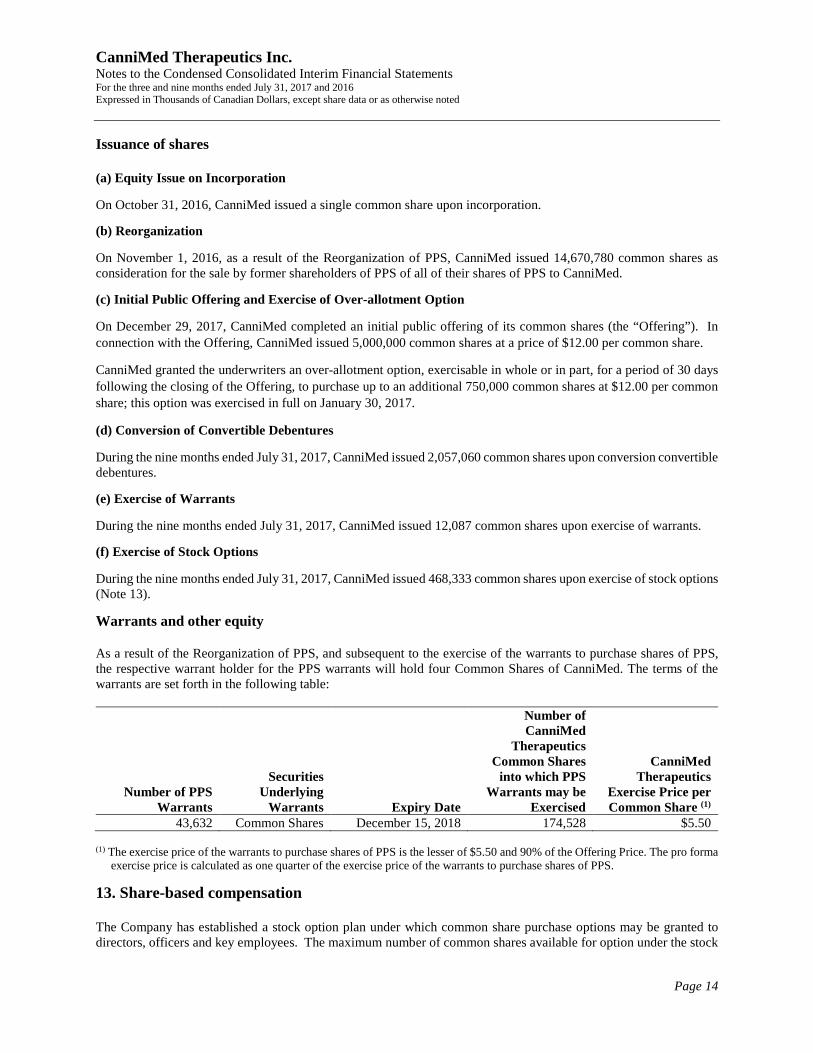
Warrants and other equity As a result of the Reorganization of PPS, and subsequent to the exercise of the warrants to purchase shares of PPS, the respective warrant holder for the PPS warrants will hold four Common Shares of CanniMed. The terms of the warrants are set forth in the following table:
Number of PPS Warrants
Securities Underlying
Warrants Expiry Date
Number of CanniMed
Therapeutics Common Shares
into which PPS Warrants may be
Exercised
CanniMed Therapeutics
Exercise Price per Common Share (1)
43,632 Common Shares December 15, 2018 174,528 $5.50
(1) The exercise price of the warrants to purchase shares of PPS is the lesser of $5.50 and 90% of the Offering Price. The pro forma exercise price is calculated as one quarter of the exercise price of the warrants to purchase shares of PPS.
13. Share-based compensation The Company has established a stock option plan under which common share purchase options may be granted to directors, officers and key employees. The maximum number of common shares available for option under the stock
CanniMed Therapeutics Inc. Notes to the Condensed Consolidated Interim Financial Statements For the three and nine months ended July 31, 2017 and 2016 Expressed in Thousands of Canadian Dollars, except share data or as otherwise noted
Page 15
option plan is outlined in the stock options agreement. Options granted have an exercise price comparable to the market prices of CanniMed shares, as determined by the Company’s Board of Directors. All options are settled by physical delivery of shares. Vesting periods of options granted under the Company’s stock option plan vary on a grant by grant basis, at the discretion of the Company’s Board of Directors.
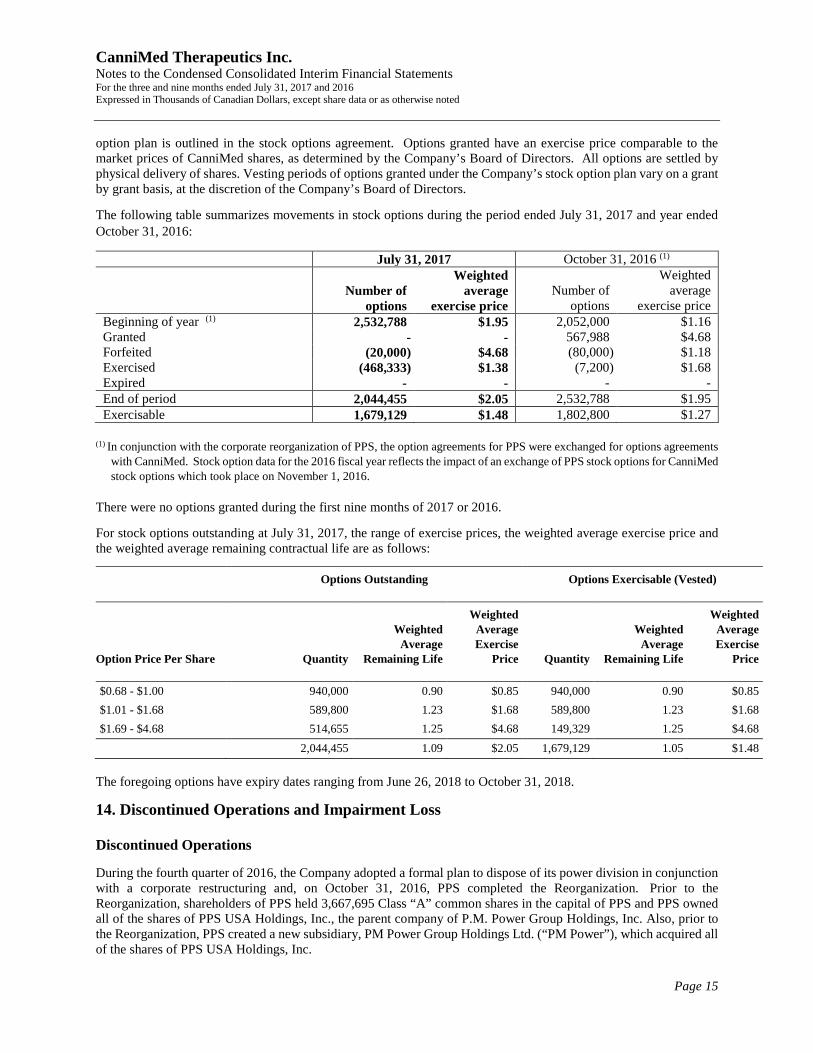
The following table summarizes movements in stock options during the period ended July 31, 2017 and year ended October 31, 2016:
July 31, 2017 October 31, 2016 (1)
Number of options
Weighted average
exercise price Number of
options
Weighted average
exercise price Beginning of year (1) 2,532,788 $1.95 2,052,000 $1.16 Granted - - 567,988 $4.68 Forfeited (20,000) $4.68 (80,000) $1.18 Exercised (468,333) $1.38 (7,200) $1.68 Expired - - - - End of period 2,044,455 $2.05 2,532,788 $1.95 Exercisable 1,679,129 $1.48 1,802,800 $1.27
(1) In conjunction with the corporate reorganization of PPS, the option agreements for PPS were exchanged for options agreements
with CanniMed. Stock option data for the 2016 fiscal year reflects the impact of an exchange of PPS stock options for CanniMed stock options which took place on November 1, 2016.
There were no options granted during the first nine months of 2017 or 2016.
For stock options outstanding at July 31, 2017, the range of exercise prices, the weighted average exercise price and the weighted average remaining contractual life are as follows:
Options Outstanding Options Exercisable (Vested)
Option Price Per Share Quantity
Weighted Average
Remaining Life
Weighted Average Exercise
Price Quantity
Weighted Average
Remaining Life
Weighted Average Exercise
Price
$0.68 - $1.00 940,000 0.90 $0.85 940,000 0.90 $0.85 $1.01 - $1.68 589,800 1.23 $1.68 589,800 1.23 $1.68 $1.69 - $4.68 514,655 1.25 $4.68 149,329 1.25 $4.68
2,044,455 1.09 $2.05 1,679,129 1.05 $1.48
The foregoing options have expiry dates ranging from June 26, 2018 to October 31, 2018.
14. Discontinued Operations and Impairment Loss Discontinued Operations
During the fourth quarter of 2016, the Company adopted a formal plan to dispose of its power division in conjunction with a corporate restructuring and, on October 31, 2016, PPS completed the Reorganization. Prior to the Reorganization, shareholders of PPS held 3,667,695 Class “A” common shares in the capital of PPS and PPS owned all of the shares of PPS USA Holdings, Inc., the parent company of P.M. Power Group Holdings, Inc. Also, prior to the Reorganization, PPS created a new subsidiary, PM Power Group Holdings Ltd. (“PM Power”), which acquired all of the shares of PPS USA Holdings, Inc.
CanniMed Therapeutics Inc. Notes to the Condensed Consolidated Interim Financial Statements For the three and nine months ended July 31, 2017 and 2016 Expressed in Thousands of Canadian Dollars, except share data or as otherwise noted
Page 16
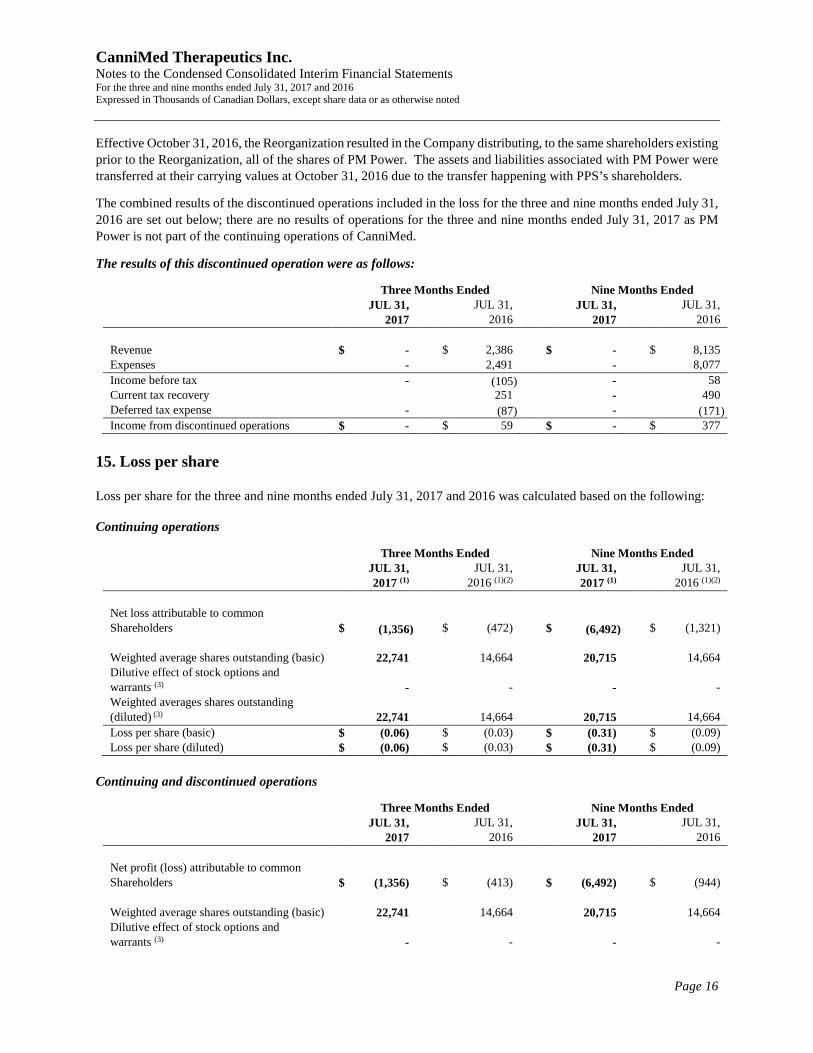
Effective October 31, 2016, the Reorganization resulted in the Company distributing, to the same shareholders existing prior to the Reorganization, all of the shares of PM Power. The assets and liabilities associated with PM Power were transferred at their carrying values at October 31, 2016 due to the transfer happening with PPS’s shareholders.
The combined results of the discontinued operations included in the loss for the three and nine months ended July 31, 2016 are set out below; there are no results of operations for the three and nine months ended July 31, 2017 as PM Power is not part of the continuing operations of CanniMed.
The results of this discontinued operation were as follows:
Three Months Ended Nine Months Ended JUL 31, JUL 31, JUL 31, JUL 31, 2017 2016 2017 2016 Revenue $ - $ 2,386 $ - $ 8,135 Expenses - 2,491 - 8,077 Income before tax - (105) - 58 Current tax recovery 251 - 490 Deferred tax expense - (87) - (171) Income from discontinued operations $ - $ 59 $ - $ 377
15. Loss per share Loss per share for the three and nine months ended July 31, 2017 and 2016 was calculated based on the following: Continuing operations
Three Months Ended Nine Months Ended JUL 31, JUL 31, JUL 31, JUL 31, 2017 (1) 2016 (1)(2) 2017 (1) 2016 (1)(2) Net loss attributable to common Shareholders $ (1,356) $ (472) $ (6,492) $ (1,321) Weighted average shares outstanding (basic) 22,741 14,664 20,715 14,664 Dilutive effect of stock options and warrants (3) - - - - Weighted averages shares outstanding (diluted) (3) 22,741 14,664 20,715 14,664 Loss per share (basic) $ (0.06) $ (0.03) $ (0.31) $ (0.09) Loss per share (diluted) $ (0.06) $ (0.03) $ (0.31) $ (0.09)
Continuing and discontinued operations
Three Months Ended Nine Months Ended JUL 31, JUL 31, JUL 31, JUL 31, 2017 2016 2017 2016 Net profit (loss) attributable to common Shareholders $ (1,356) $ (413) $ (6,492) $ (944) Weighted average shares outstanding (basic) 22,741 14,664 20,715 14,664 Dilutive effect of stock options and warrants (3) - - - -
CanniMed Therapeutics Inc. Notes to the Condensed Consolidated Interim Financial Statements For the three and nine months ended July 31, 2017 and 2016 Expressed in Thousands of Canadian Dollars, except share data or as otherwise noted
Page 17
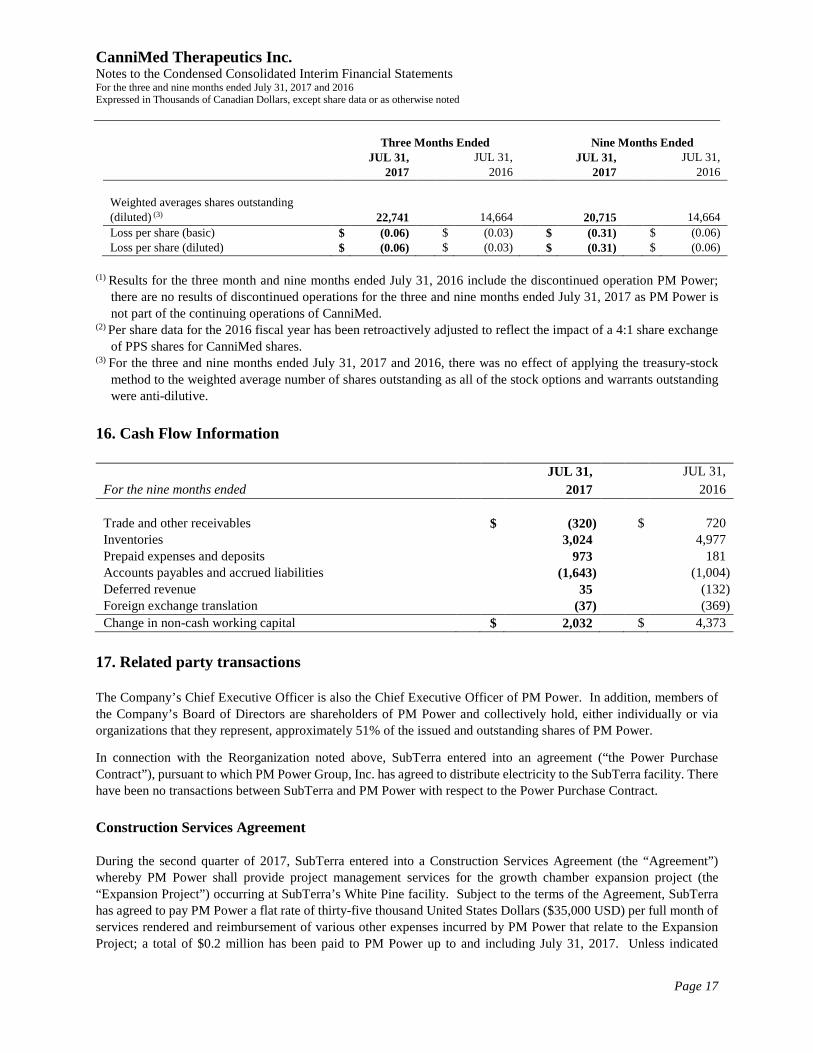
Three Months Ended Nine Months Ended JUL 31, JUL 31, JUL 31, JUL 31, 2017 2016 2017 2016 Weighted averages shares outstanding (diluted) (3) 22,741 14,664 20,715 14,664 Loss per share (basic) $ (0.06) $ (0.03) $ (0.31) $ (0.06) Loss per share (diluted) $ (0.06) $ (0.03) $ (0.31) $ (0.06)
(1) Results for the three month and nine months ended July 31, 2016 include the discontinued operation PM Power; there are no results of discontinued operations for the three and nine months ended July 31, 2017 as PM Power is not part of the continuing operations of CanniMed.
(2) Per share data for the 2016 fiscal year has been retroactively adjusted to reflect the impact of a 4:1 share exchange of PPS shares for CanniMed shares.
(3) For the three and nine months ended July 31, 2017 and 2016, there was no effect of applying the treasury-stock method to the weighted average number of shares outstanding as all of the stock options and warrants outstanding were anti-dilutive.
16. Cash Flow Information
17. Related party transactions The Company’s Chief Executive Officer is also the Chief Executive Officer of PM Power. In addition, members of the Company’s Board of Directors are shareholders of PM Power and collectively hold, either individually or via organizations that they represent, approximately 51% of the issued and outstanding shares of PM Power.
In connection with the Reorganization noted above, SubTerra entered into an agreement (“the Power Purchase Contract”), pursuant to which PM Power Group, Inc. has agreed to distribute electricity to the SubTerra facility. There have been no transactions between SubTerra and PM Power with respect to the Power Purchase Contract. Construction Services Agreement During the second quarter of 2017, SubTerra entered into a Construction Services Agreement (the “Agreement”) whereby PM Power shall provide project management services for the growth chamber expansion project (the “Expansion Project”) occurring at SubTerra’s White Pine facility. Subject to the terms of the Agreement, SubTerra has agreed to pay PM Power a flat rate of thirty-five thousand United States Dollars ($35,000 USD) per full month of services rendered and reimbursement of various other expenses incurred by PM Power that relate to the Expansion Project; a total of $0.2 million has been paid to PM Power up to and including July 31, 2017. Unless indicated
JUL 31, JUL 31, For the nine months ended 2017 2016 Trade and other receivables $ (320) $ 720 Inventories 3,024 4,977 Prepaid expenses and deposits 973 181 Accounts payables and accrued liabilities (1,643) (1,004) Deferred revenue 35 (132) Foreign exchange translation (37) (369) Change in non-cash working capital $ 2,032 $ 4,373
CanniMed Therapeutics Inc. Notes to the Condensed Consolidated Interim Financial Statements For the three and nine months ended July 31, 2017 and 2016 Expressed in Thousands of Canadian Dollars, except share data or as otherwise noted
Page 18
otherwise between SubTerra and PM Power, fees for management services pursuant to the Agreement will be provided until the Expansion Project is completed; it is expected that the Expansion Project will not take longer than 24 months to complete. Either SubTerra or PM Power may terminate the Agreement by advance written notice of one week. Loan Agreement During the third quarter of 2017, PPS (the “Lender”) entered into a Loan Agreement (the “Loan”) with PM Power Group Inc. (the “Borrower”) for one hundred fifty thousand United States Dollars ($150,000 USD), together with interest commencing July 6, 2017 at a rate of 1.25% per month, calculated daily and compounded monthly. The loan matures on October 31, 2017. To secure obligations of the Borrower to pay the principal amount, interest and any and all other amounts owing to the Borrower or its affiliates and related parties, the Borrower agreed to grant the Lender a primary security interest over all real and personal property of the Borrower (the “Security”). The Security ranks ahead of any security provided by the Borrower to other parties and shall be further evidenced by a general security agreement. In addition to the Loan, the Borrower is indebted to the Lender in the additional amount of one hundred eight thousand three hundred thirty-five United States Dollars ($108,334 USD) which is repayable in full on or before October 31, 2017.
18. Financial risk management and financial instruments The Company is exposed to various risks through its financial instruments, as follows:
Capital Management The Company manages its capital to provide sufficient liquidity for it operating and growth activities. In order to achieve this objective the Company prepares annual budgets and capital requirements to manage its capital structure. The capital structure of the Company consists of loans and borrowings (Note 10) and equity, comprised of issued capital stock, share-based payments, accumulated and other comprehensive income and retained earnings.
Credit Risk Credit risk is the risk that a counterparty will not meet its obligations under a financial instrument or customer contract, leading to a financial loss. The Company is exposed to credit risk from its operating activities (primarily for trade and other receivables) and from its financing activities, including deposits with banks and financial institutions, foreign exchange transactions and derivatives.
The Company does not hold any collateral as security but mitigates this risk by dealing only with what management believes to be financially sound counterparties and, accordingly, does not anticipate significant loss for non-performance. The exposure on trade receivables is minimal since the majority of the amount noted is due from government agencies or insurers. There is no material exposure to credit risk on cash and cash equivalents and accounts receivable on the statement of financial position.
Liquidity The Company’s exposure to liquidity risk is dependent on the collection of accounts receivable and the raising of funds to meet commitments and sustain operations. The Company controls liquidity risk by management of working capital, cash flows and the issuance of share capital. The Company has access to lines of credit with available borrowings of $1.5 million at July 31, 2017 and cash and cash equivalents totaling $54.2 million (October 31, 2016 - $2.0 million). Other than the conversion of $11.3 million of convertible debentures (principal balance) into equity of CanniMed, the $3.3 million repayment of the USD loan, and the principal payments of other debt, the principal
CanniMed Therapeutics Inc. Notes to the Condensed Consolidated Interim Financial Statements For the three and nine months ended July 31, 2017 and 2016 Expressed in Thousands of Canadian Dollars, except share data or as otherwise noted
Page 19
payments / commitments of the Company have not materially changed since those disclosed within the consolidated financial statements as at October 31, 2016 of the Company’s subsidiary, PPS.
Market
Market risk is the risk that the fair value or future cash flows of a financial instrument will fluctuate because of changes in market prices. Market risk comprises three types of risk: currency rate risk, interest rate risk and commodity price risk.
Foreign currency risk Foreign currency risk is the risk to the Company’s earnings that arise from fluctuations of foreign exchange rates, specifically the U.S. Dollar. Currency risk arises as a result of the Company's investment in SubTerra. Management believes this risk is reduced by the fact that this U.S. subsidiary operates in a politically and economically stable foreign country. The Company’s exposure to foreign currency changes is considered to be not material. Interest rate risk Interest rate risk is the risk that the fair value or future cash flows of a financial instrument will fluctuate because of changes in market interest rates. The Company’s exposure to the risk of changes in market interest rates relates primarily to the loans and borrowings obligations with floating interest rates. The Company has entered into interest rate swaps to fix its exposure to variable interest rates on approximately one half of its long term debt.
Categories of financial instruments
Fair value is the price that would be received to sell an asset or paid to transfer a liability in an orderly transaction between market participants at the measurement date, regardless of whether that price is directly observable or estimated using another valuation technique. In estimating the fair value of an asset or a liability, the Company takes into account the characteristics of the asset or liability if market participants would take those characteristics into account when pricing the asset or liability at the measurement date. In addition, for financial reporting purposes, fair value measurements are categorized into Level 1, 2 and 3 based on the degree to which the fair value measurement are observable and the significance of the inputs to the fair value measurement in its entirety, which are described as follows:
Level 1 inputs are from quoted prices (unadjusted) in active markets for identical assets and liabilities that the entity can access at the measurement date;
Level 2 inputs are inputs, other than quoted prices included within Level 1 that are observable for assets and liabilities, either directly or indirectly;
Level 3 inputs are the unobservable inputs for assets and liabilities.
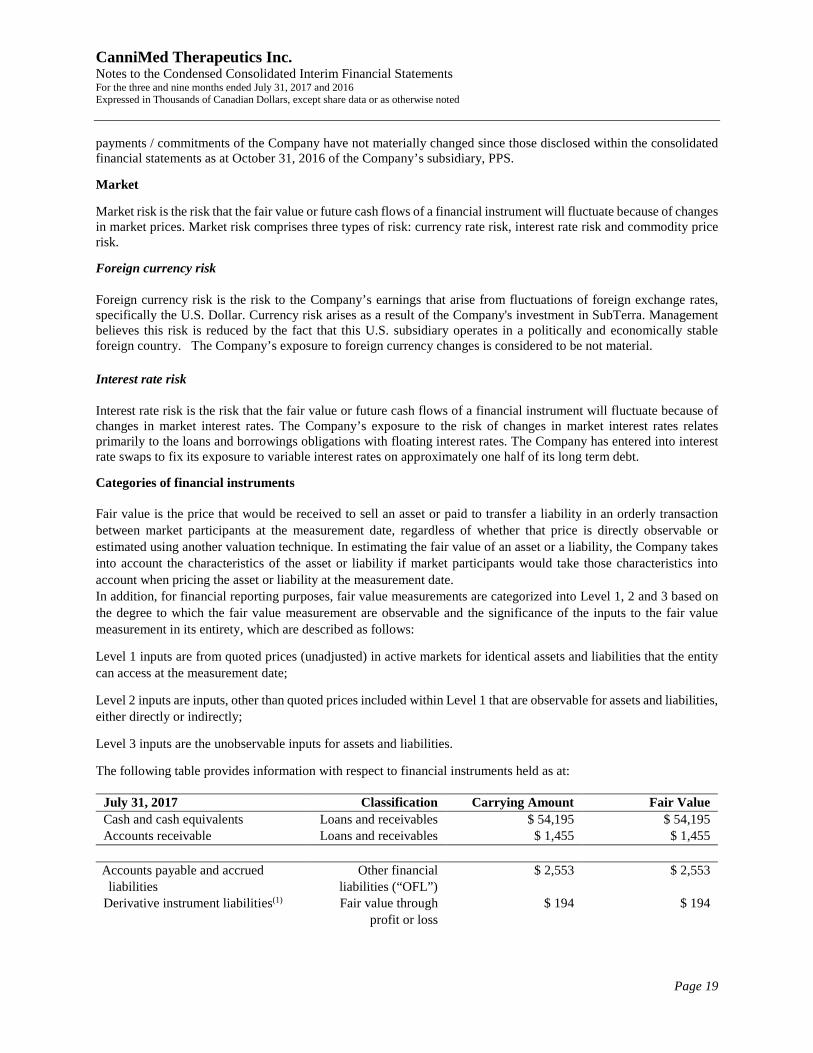
The following table provides information with respect to financial instruments held as at:
July 31, 2017 Classification Carrying Amount Fair Value Cash and cash equivalents Loans and receivables $ 54,195 $ 54,195 Accounts receivable Loans and receivables $ 1,455 $ 1,455 Accounts payable and accrued liabilities
Other financial liabilities (“OFL”)
$ 2,553 $ 2,553
Derivative instrument liabilities(1) Fair value through profit or loss
$ 194 $ 194
CanniMed Therapeutics Inc. Notes to the Condensed Consolidated Interim Financial Statements For the three and nine months ended July 31, 2017 and 2016 Expressed in Thousands of Canadian Dollars, except share data or as otherwise noted
Page 20
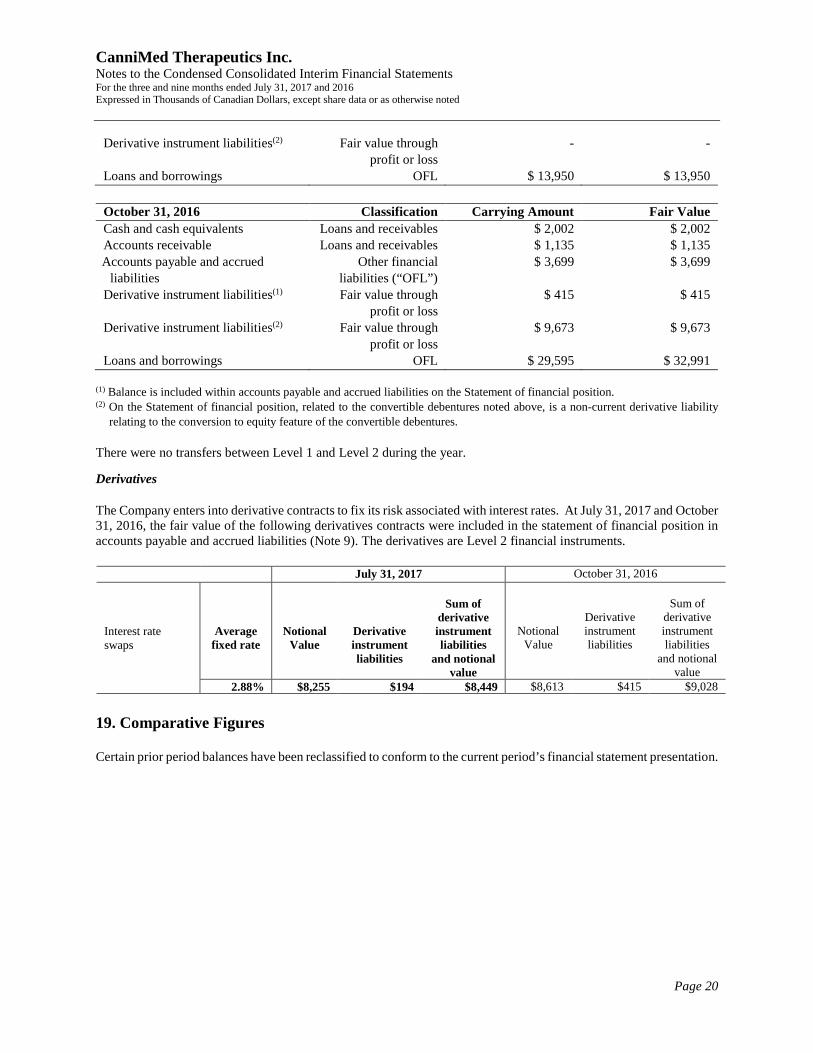
(1) Balance is included within accounts payable and accrued liabilities on the Statement of financial position. (2) On the Statement of financial position, related to the convertible debentures noted above, is a non-current derivative liability
relating to the conversion to equity feature of the convertible debentures. There were no transfers between Level 1 and Level 2 during the year.
Derivatives The Company enters into derivative contracts to fix its risk associated with interest rates. At July 31, 2017 and October 31, 2016, the fair value of the following derivatives contracts were included in the statement of financial position in accounts payable and accrued liabilities (Note 9). The derivatives are Level 2 financial instruments.
19. Comparative Figures
Certain prior period balances have been reclassified to conform to the current period’s financial statement presentation.
Derivative instrument liabilities(2) Fair value through profit or loss
- -
Loans and borrowings OFL $ 13,950 $ 13,950
October 31, 2016 Classification Carrying Amount Fair Value Cash and cash equivalents Loans and receivables $ 2,002 $ 2,002 Accounts receivable Loans and receivables $ 1,135 $ 1,135 Accounts payable and accrued liabilities
Other financial liabilities (“OFL”)
$ 3,699 $ 3,699
Derivative instrument liabilities(1) Fair value through profit or loss
$ 415 $ 415
Derivative instrument liabilities(2) Fair value through profit or loss
$ 9,673 $ 9,673
Loans and borrowings OFL $ 29,595 $ 32,991
July 31, 2017 October 31, 2016
Interest rate swaps
Average fixed rate
Notional Value
Derivative instrument liabilities
Sum of
derivative instrument liabilities
and notional value
Notional Value
Derivative instrument liabilities
Sum of
derivative instrument liabilities
and notional value
2.88% $8,255 $194 $8,449 $8,613 $415 $9,028