q3 2021 - swedishmatch.com
TRANSCRIPT

Q3 2021
Interim Report January – September 2021
Highlights for the third quarter
• Record sales with year-on-year revenue growth across product segments, despite comparing to a prior year quarter with elevated demand for certain product lines.
• In local currencies, sales increased by 10 percent for the third quarter. Reported sales increased by 9 percent to 4,778 MSEK (4,400).
• Record operating profit from product segments, in spite of continued ramp-up in spending behind growth opportunities for smokefree products.
• In local currencies, operating profit from product segments1) increased by 2 percent for the third quarter. Reported operating profit from product segments increased by 1 percent to 2,099 MSEK (2,075).
• For the Smokefree product segment, continued momentum for ZYN nicotine pouches in the US and solid performance in Scandinavia drove increased sales and operating profit.
• For the Cigars product segment, increased sales of natural leaf varieties outpaced declines for HTL cigars while operating profit in local currency was virtually flat principally reflecting higher production costs.
• For the Lights product segment, robust performance for lighters drove enhanced earnings.
• Operating profit amounted to 2,075 MSEK (2,048) for the third quarter.
• Profit after tax for the third quarter amounted to 1,540 MSEK (1,222). Profit after tax for the third quarter of the prior year included a charge of 286 MSEK following an adverse ruling in a tax case.
• Earnings per share increased by 30 percent to 0.99 SEK (0.76) for the third quarter. Adjusted earnings per share increased by 5 percent to 0.99 SEK (0.94).2)
• On September 14, Swedish Match announced its intention to spin off its US cigar business to shareholders. Subject to various conditions, the separation is expected to be completed during the second half of 2022, at the earliest. For more details, see the September 14 press release. 1) Excludes Other operations and larger one-time items. 2) In May 2021, a share split (10:1) was made. Historical share data in this report has been restated in accordance with IAS 33.

________________________________________________________________________ January-September 2021 2
CEO Lars Dahlgren comments:
Sales and operating profit growth despite increased brand investments and challenging comparisons I am pleased to report that Swedish Match in the third quarter continued to deliver double-digit revenue growth
in local currencies along with improved operating profit compared to the third quarter of the prior year. With
continued ramp-up in marketing related activities to support brand building and long-term growth, as well as
the elevated demand (brought on by the pandemic) for several product lines in the prior year period, the
financial development in the third quarter is a testimony to the strength and potential of our business.
In the US, more and more adult tobacco consumers are discovering the benefits of nicotine pouches. Our ZYN
portfolio in the US continued its impressive growth trajectory with higher velocities in existing stores and a
resilient market share relative to the second quarter, despite very aggressive promotional activities by our
largest competitors. During the quarter, Swedish Match continued to ramp up marketing investments geared
toward driving awareness, engagement and loyalty with both consumers and the trade in support of long-term
growth and brand building. These investments, along with targeted promotions, also supported the volume
development for ZYN in the quarter. For traditional smokefree products in the US (moist snuff and chewing
tobacco), the impact of comparing against a period with elevated demand was the most evident, and relatively
steep volume declines for traditional products (accentuated by timing effects on promotions) muted the
earnings growth for our US Smokefree business compared with the prior year period.
Also, in Scandinavia, more and more consumers turn to nicotine pouches as a better alternative to smoking,
and snus consumption also held up well. For Swedish Match, volume growth was less pronounced than the
smokefree category growth rate, but revenues grew relatively strongly as the realized price per can was higher
as a consequence of favorable geographic and product mix along with price increases. Our target of increasing
market share within the fast-growing Scandinavian nicotine pouch market was not achieved during the quarter.
We will continue to invest behind this growth opportunity, and as the third quarter demonstrated, our
Scandinavian smokefree business has the potential to combine high investment levels with strong earnings.
In September, we announced the intention to spin off our US cigar business into a stand-alone entity to be
listed on a stock exchange in the US (expected completion during the second half of 2022, at the earliest).
Detailed preparations have been initiated but are in early stages with significant work ahead. I am convinced
that the prospects for the US cigar business are even more attractive as an independent company with the
ability to explore a wider scope of growth opportunities within its autonomous and focused strategic agenda.
With further progress in addressing capacity constraints for natural leaf varieties, the third quarter
demonstrated the potential of our US cigar business by reporting notable market share gains within the faster
growing natural leaf segment for Swedish Match. At the same time, production challenges have not been
completely overcome and limitations in the supply of certain input materials had a significant negative effect
on the performance for HTL cigars. Despite these production challenges and a difficult comparison period in
the third quarter of the prior year, we managed to grow revenues, and also shipments slightly. Operating profit
measured in USD remained in line with the prior year.
Our Lights business continued to perform well during the quarter and despite the effects of steep price
increases for several raw materials, underlying operating profit grew notably attributable to the strong
performance for lighters.
In summary, while year-on-year earnings growth in the third quarter was lower than for the first six months of
the year, we reported record sales and operating profit from product segments. Our businesses generally
demonstrated strength and we are very pleased that we have been able to ramp up our investments for growth.
We expect the growing demand for modern smokefree products to continue in our core markets and through
innovation and market insight, building upon our strong platforms and trusted brands, we continue to take great
strides toward our vision of a world without cigarettes.
________________________________________________________________________ January-September 2021 3
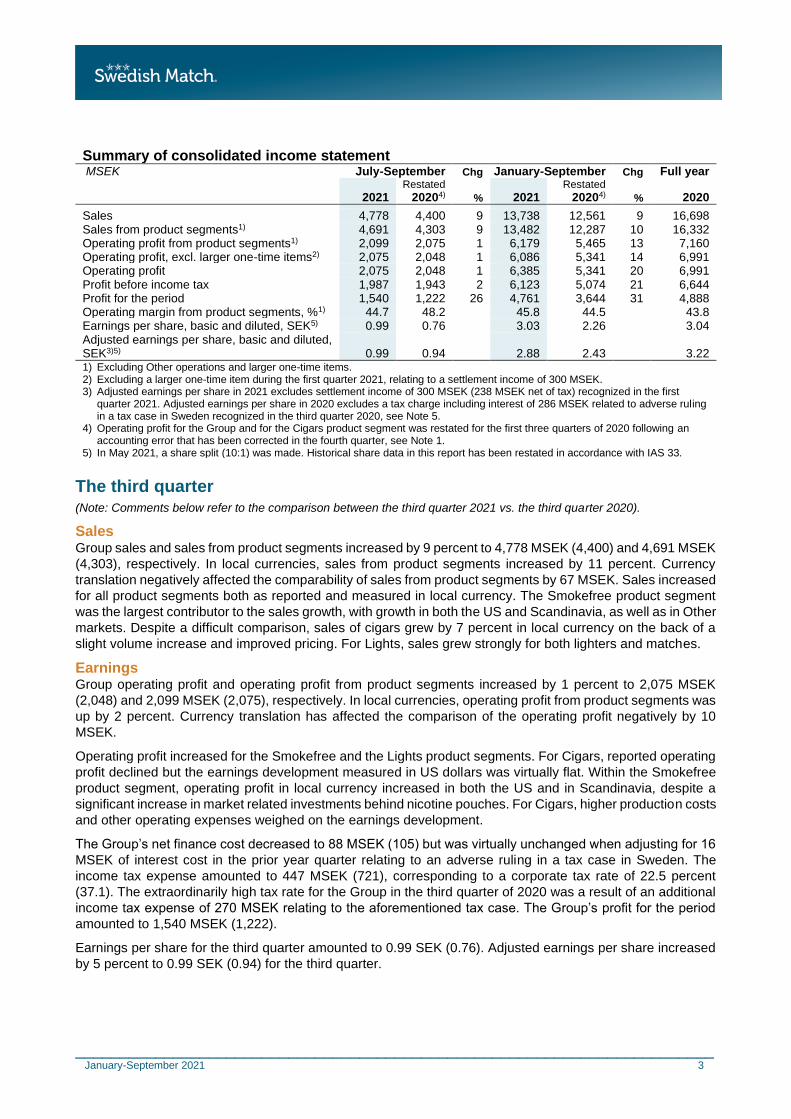
Summary of consolidated income statement MSEK July-September Chg January-September Chg Full year
2021 Restated
20204) % 2021 Restated
20204) % 2020
Sales 4,778 4,400 9 13,738 12,561 9 16,698 Sales from product segments1) 4,691 4,303 9 13,482 12,287 10 16,332 Operating profit from product segments1) 2,099 2,075 1 6,179 5,465 13 7,160 Operating profit, excl. larger one-time items2) 2,075 2,048 1 6,086 5,341 14 6,991 Operating profit 2,075 2,048 1 6,385 5,341 20 6,991 Profit before income tax 1,987 1,943 2 6,123 5,074 21 6,644 Profit for the period 1,540 1,222 26 4,761 3,644 31 4,888 Operating margin from product segments, %1) 44.7 48.2 45.8 44.5 43.8 Earnings per share, basic and diluted, SEK5) 0.99 0.76 3.03 2.26 3.04 Adjusted earnings per share, basic and diluted, SEK3)5) 0.99 0.94 2.88 2.43 3.22 1) Excluding Other operations and larger one-time items. 2) Excluding a larger one-time item during the first quarter 2021, relating to a settlement income of 300 MSEK. 3) Adjusted earnings per share in 2021 excludes settlement income of 300 MSEK (238 MSEK net of tax) recognized in the first
quarter 2021. Adjusted earnings per share in 2020 excludes a tax charge including interest of 286 MSEK related to adverse ruling in a tax case in Sweden recognized in the third quarter 2020, see Note 5.
4) Operating profit for the Group and for the Cigars product segment was restated for the first three quarters of 2020 following an accounting error that has been corrected in the fourth quarter, see Note 1.
5) In May 2021, a share split (10:1) was made. Historical share data in this report has been restated in accordance with IAS 33.
The third quarter (Note: Comments below refer to the comparison between the third quarter 2021 vs. the third quarter 2020).
Sales Group sales and sales from product segments increased by 9 percent to 4,778 MSEK (4,400) and 4,691 MSEK
(4,303), respectively. In local currencies, sales from product segments increased by 11 percent. Currency
translation negatively affected the comparability of sales from product segments by 67 MSEK. Sales increased
for all product segments both as reported and measured in local currency. The Smokefree product segment
was the largest contributor to the sales growth, with growth in both the US and Scandinavia, as well as in Other
markets. Despite a difficult comparison, sales of cigars grew by 7 percent in local currency on the back of a
slight volume increase and improved pricing. For Lights, sales grew strongly for both lighters and matches.
Earnings Group operating profit and operating profit from product segments increased by 1 percent to 2,075 MSEK
(2,048) and 2,099 MSEK (2,075), respectively. In local currencies, operating profit from product segments was
up by 2 percent. Currency translation has affected the comparison of the operating profit negatively by 10
MSEK.
Operating profit increased for the Smokefree and the Lights product segments. For Cigars, reported operating
profit declined but the earnings development measured in US dollars was virtually flat. Within the Smokefree
product segment, operating profit in local currency increased in both the US and in Scandinavia, despite a
significant increase in market related investments behind nicotine pouches. For Cigars, higher production costs
and other operating expenses weighed on the earnings development.
The Group’s net finance cost decreased to 88 MSEK (105) but was virtually unchanged when adjusting for 16
MSEK of interest cost in the prior year quarter relating to an adverse ruling in a tax case in Sweden. The
income tax expense amounted to 447 MSEK (721), corresponding to a corporate tax rate of 22.5 percent
(37.1). The extraordinarily high tax rate for the Group in the third quarter of 2020 was a result of an additional
income tax expense of 270 MSEK relating to the aforementioned tax case. The Group’s profit for the period
amounted to 1,540 MSEK (1,222).
Earnings per share for the third quarter amounted to 0.99 SEK (0.76). Adjusted earnings per share increased
by 5 percent to 0.99 SEK (0.94) for the third quarter.

________________________________________________________________________ January-September 2021 4
The first nine months (Note: Comments below refer to the comparison between the first nine months 2021 vs. the first nine months 2020).
Sales Group sales increased by 9 percent to 13,738 MSEK (12,561) and sales from product segments increased by
10 percent to 13,482 MSEK (12,287). In local currencies, sales from product segments increased by 18
percent, with double-digit increases for all three product segments. Currency translation negatively affected
the comparability of sales from product segments by 992 MSEK. The largest contributor to the sales growth
was the Smokefree product segment, with impressive performances in both the US and in Scandinavia.
Earnings Group operating profit increased by 20 percent to 6,385 MSEK (5,341) and included settlement income of 300
MSEK relating to a previously ongoing arbitration. Operating profit from product segments increased by 13
percent to 6,179 MSEK (5,465). In local currencies, operating profit from product segments was up by 21
percent with strong double-digit growth for all three segments. Currency translation has affected the
comparison of the operating profit negatively by 449 MSEK.
The Group’s net finance cost amounted to 262 MSEK (267). Excluding the above-mentioned interest cost of
16 MSEK relating to the adverse tax ruling in Sweden, net finance cost increased by 11 MSEK reflecting lower
financial returns on surplus cash and higher interest rates on debt. The income tax expense amounted to 1,362
MSEK (1,430), corresponding to a tax rate of 22.2 percent (28.2). The extraordinarily high tax rate for the
Group for the first nine months of 2020 was a result of the above-mentioned additional income tax expense.
When adjusted for associated companies and non-recurring items the underlying tax rate was 22.8 percent
(23.0). The Group’s profit for the period amounted to 4,761 MSEK (3,644).
Earnings per share for the first nine months amounted to 3.03 SEK (2.26). Adjusted earnings per share
amounted to 2.88 SEK (2.43).
US Smokefree pouches, from traditional to modern
Swedish Match offers smokefree pouches in a wide range, from traditional moist snuff, to
Swedish snus, to nicotine pouches without tobacco. Moist snuff is the largest smokefree
segment in the US and Swedish Match’s largest moist snuff brand is Longhorn. In the US,
the snus segment is small and the Company is present with its General brand. The demand
for nicotine pouches in the US has grown dramatically over the past several years and
Swedish Match’s ZYN brand is the leader within the nicotine pouch segment.

________________________________________________________________________ January-September 2021 5
Smokefree
Third quarter highlights:
• Sales and operating profit up by 10 and 3 percent respectively in local currencies.
• Increased operating profit in local currency in both the US and in Scandinavia despite higher marketing investments to support growth for nicotine pouches.
• In the US, continued momentum for ZYN nicotine pouches drove the operating profit growth while earnings for moist snuff and chewing tobacco were down on challenging comparisons.
• In Scandinavia, higher volumes for both snus and nicotine pouches in combination with better prices drove improved operating profit.
Key data MSEK July-September Chg January-September Chg Full year 2021 2020 % 2021 2020 % 2020
Sales 3,100 2,842 9 8,878 8,045 10 10,651 Operating profit 1,558 1,519 3 4,451 3,974 12 5,142 Operating margin, % 50.3 53.5 50.1 49.4 48.3 EBITDA 1,663 1,617 3 4,755 4,270 11 5,539 EBITDA margin, % 53.6 56.9 53.6 53.1 52.0 Depreciation, amortization and impairment -104 -98 -304 -296 -397 Capital expenditures 247 207 19 748 665 12 1,003
The third quarter
(Note: Comments below refer to the comparison between the third quarter 2021 vs. the third quarter 2020).
In local currencies, sales for the Smokefree product segment increased by 10 percent. Currency translation
affected the sales comparison negatively by 33 MSEK. Operating profit in local currencies increased by 3
percent, with increases in the US, in Scandinavia as well as in Other markets. Currency translation negatively
affected comparability of the operating profit by 8 MSEK.
The US
Key data, the US July-September Chg January-September Chg Full year 2021 2020 % 2021 2020 % 2020
Financials, MSEK Sales 1,708 1,566 9 4,900 4,457 10 5,818 Operating profit 813 816 0 2,433 2,187 11 2,802 Operating margin, % 47.6 52.1 49.7 49.1 48.2
Financials, MUSD Sales 197 176 12 577 474 22 632 Operating profit 94 91 3 287 233 23 304 Operating margin, % 47.5 51.9 49.7 49.1 48.2
Shipment volumes Moist snuff, million cans 31.5 36.2 -13 99.3 103.6 -4 133.3 Nicotine pouches, million cans 46.2 32.3 43 125.7 83.2 51 114.1 Chewing tobacco, thousands of pounds (excluding contract manufacturing volumes) 1,304 1,480 -12 4,056 4,450 -9 5,687

________________________________________________________________________ January-September 2021 6
Market shares, the US1)
Percent July-September Chg January-September Chg Full year 2021 2020 ppts 2021 2020 ppts 2020
Nicotine pouches 63.8 74.1 -10.3 64.1 75.2 -11.1 74.8 Moist snuff 8.8 9.2 -0.4 8.9 8.8 0.2 8.8 Chewing tobacco (excluding contract manufacturing volumes) 41.0 41.2 -0.2 40.7 41.1 -0.3 40.9 1) Based on MSA distributor shipments: 13 weeks and YTD to September 26, 2021 and September 27, 2020 respectively. Figures for
2020 have been restated to reflect changes in MSA store measurements.
The 12 percent growth in sales in local currency resulted from strong revenue growth for ZYN nicotine pouches,
partially offset by a notable volume-driven decline for traditional smokefree products in the quarter.
With year-on-year volume growth exceeding 40 percent and sequential volume growth of 9 percent relative to
the second quarter, ZYN shipments reached a new record high during the quarter. While the number of outlets
that sold ZYN increased both compared to the third quarter of the prior year and on a sequential basis, higher
velocities in existing stores were the predominant growth driver relative to both the prior year period and the
second quarter of 2021. Several competitors continued with broad-based deep price promotions for nicotine
pouches during the quarter. As part of the planned step-up in market investments for ZYN, certain targeted
promotions were deployed during the quarter resulting in net sales growing at a less pronounced rate than
shipment volumes. Despite the average retail selling price for ZYN remaining significantly above the levels of
the brands of the two major nicotine pouch competitors, ZYN’s market share in the quarter increased slightly
on a sequential basis compared to the second quarter based on distributor shipments to retail. The ramp-up
in ZYN marketing investments during the quarter comprised a wide array of consumer and trade activities
designed to drive awareness, engagement and loyalty. Marketing related expenses were significantly higher
than in the prior year and were also notably higher than during the second quarter. Despite these investments,
operating profit for ZYN grew at a double-digit rate in local currency compared to the prior year quarter.
Within traditional smokefree products, both moist snuff and chewing tobacco faced difficult comparisons with
these categories impacted by unusually strong demand in the prior year period, likely impacted by COVID-19
related effects. In addition, timing of promotions contributed to the relatively steep volume declines for the
moist snuff and chewing tobacco portfolios of Swedish Match. Improved pricing only partially offset the effects
of lower volumes and sales declined for both moist snuff and chewing tobacco. The lower sales and higher
production costs per unit, influenced by price increases on input materials, resulted in notable operating profit
declines for both product categories in the isolated quarter.
Scandinavia
Scandinavia refers to Sweden, Norway, and Denmark.
Key data, Scandinavia July-September Chg January-September Chg Full year 2021 2020 % 2021 2020 % 2020
Financials Sales, MSEK 1,341 1,240 8 3,857 3,458 12 4,675 Operating profit, MSEK 761 735 4 2,129 1,850 15 2,465 Operating margin, % 56.7 59.2 55.2 53.5 52.7
Shipment volumes Snus, million cans 65.3 63.9 2 187.7 180.8 4 243.6 Nicotine pouches, million cans 5.2 3.7 40 14.4 9.7 49 13.1 Chew bags and tobacco bits, million cans 0.9 1.1 -18 2.6 3.2 -17 4.4
________________________________________________________________________ January-September 2021 7
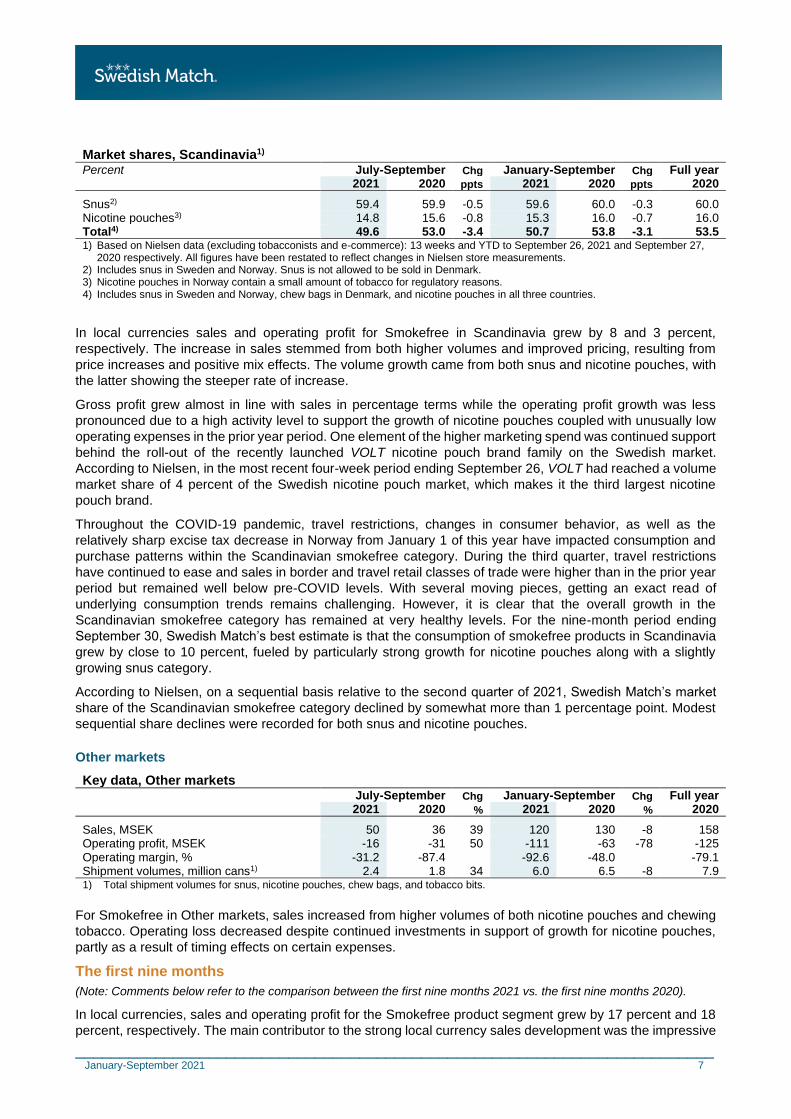
Market shares, Scandinavia1)
Percent July-September Chg January-September Chg Full year 2021 2020 ppts 2021 2020 ppts 2020
Snus2) 59.4 59.9 -0.5 59.6 60.0 -0.3 60.0 Nicotine pouches3) 14.8 15.6 -0.8 15.3 16.0 -0.7 16.0 Total4) 49.6 53.0 -3.4 50.7 53.8 -3.1 53.5 1) Based on Nielsen data (excluding tobacconists and e-commerce): 13 weeks and YTD to September 26, 2021 and September 27,
2020 respectively. All figures have been restated to reflect changes in Nielsen store measurements. 2) Includes snus in Sweden and Norway. Snus is not allowed to be sold in Denmark. 3) Nicotine pouches in Norway contain a small amount of tobacco for regulatory reasons. 4) Includes snus in Sweden and Norway, chew bags in Denmark, and nicotine pouches in all three countries.
In local currencies sales and operating profit for Smokefree in Scandinavia grew by 8 and 3 percent,
respectively. The increase in sales stemmed from both higher volumes and improved pricing, resulting from
price increases and positive mix effects. The volume growth came from both snus and nicotine pouches, with
the latter showing the steeper rate of increase.
Gross profit grew almost in line with sales in percentage terms while the operating profit growth was less
pronounced due to a high activity level to support the growth of nicotine pouches coupled with unusually low
operating expenses in the prior year period. One element of the higher marketing spend was continued support
behind the roll-out of the recently launched VOLT nicotine pouch brand family on the Swedish market.
According to Nielsen, in the most recent four-week period ending September 26, VOLT had reached a volume
market share of 4 percent of the Swedish nicotine pouch market, which makes it the third largest nicotine
pouch brand.
Throughout the COVID-19 pandemic, travel restrictions, changes in consumer behavior, as well as the
relatively sharp excise tax decrease in Norway from January 1 of this year have impacted consumption and
purchase patterns within the Scandinavian smokefree category. During the third quarter, travel restrictions
have continued to ease and sales in border and travel retail classes of trade were higher than in the prior year
period but remained well below pre-COVID levels. With several moving pieces, getting an exact read of
underlying consumption trends remains challenging. However, it is clear that the overall growth in the
Scandinavian smokefree category has remained at very healthy levels. For the nine-month period ending
September 30, Swedish Match’s best estimate is that the consumption of smokefree products in Scandinavia
grew by close to 10 percent, fueled by particularly strong growth for nicotine pouches along with a slightly
growing snus category.
According to Nielsen, on a sequential basis relative to the second quarter of 2021, Swedish Match’s market
share of the Scandinavian smokefree category declined by somewhat more than 1 percentage point. Modest
sequential share declines were recorded for both snus and nicotine pouches.
Other markets
Key data, Other markets July-September Chg January-September Chg Full year 2021 2020 % 2021 2020 % 2020
Sales, MSEK 50 36 39 120 130 -8 158 Operating profit, MSEK -16 -31 50 -111 -63 -78 -125 Operating margin, % -31.2 -87.4 -92.6 -48.0 -79.1 Shipment volumes, million cans1) 2.4 1.8 34 6.0 6.5 -8 7.9 1) Total shipment volumes for snus, nicotine pouches, chew bags, and tobacco bits.
For Smokefree in Other markets, sales increased from higher volumes of both nicotine pouches and chewing
tobacco. Operating loss decreased despite continued investments in support of growth for nicotine pouches,
partly as a result of timing effects on certain expenses.
The first nine months
(Note: Comments below refer to the comparison between the first nine months 2021 vs. the first nine months 2020).
In local currencies, sales and operating profit for the Smokefree product segment grew by 17 percent and 18
percent, respectively. The main contributor to the strong local currency sales development was the impressive
________________________________________________________________________ January-September 2021 8
performance in the US market where ZYN shipments grew by more than 40 percent. Revenue growth in
Scandinavia was also strong, up by 11 percent in local currencies, benefitting from strong underlying category
growth, timing effects on shipments, as well as favorable price/mix that resulted from price changes, product
mix effects and channel shifts. In Other markets, sales growth for nicotine pouches and snus was more than
offset by lower sales of chewing tobacco resulting primarily from regulatory changes in the German market.
In local currencies, operating profit for the Smokefree product segment increased by 18 percent. Earnings
grew strongly in both the US and in Scandinavia, but in Other markets operating profit declined, principally due
to increased market investments to support future growth.
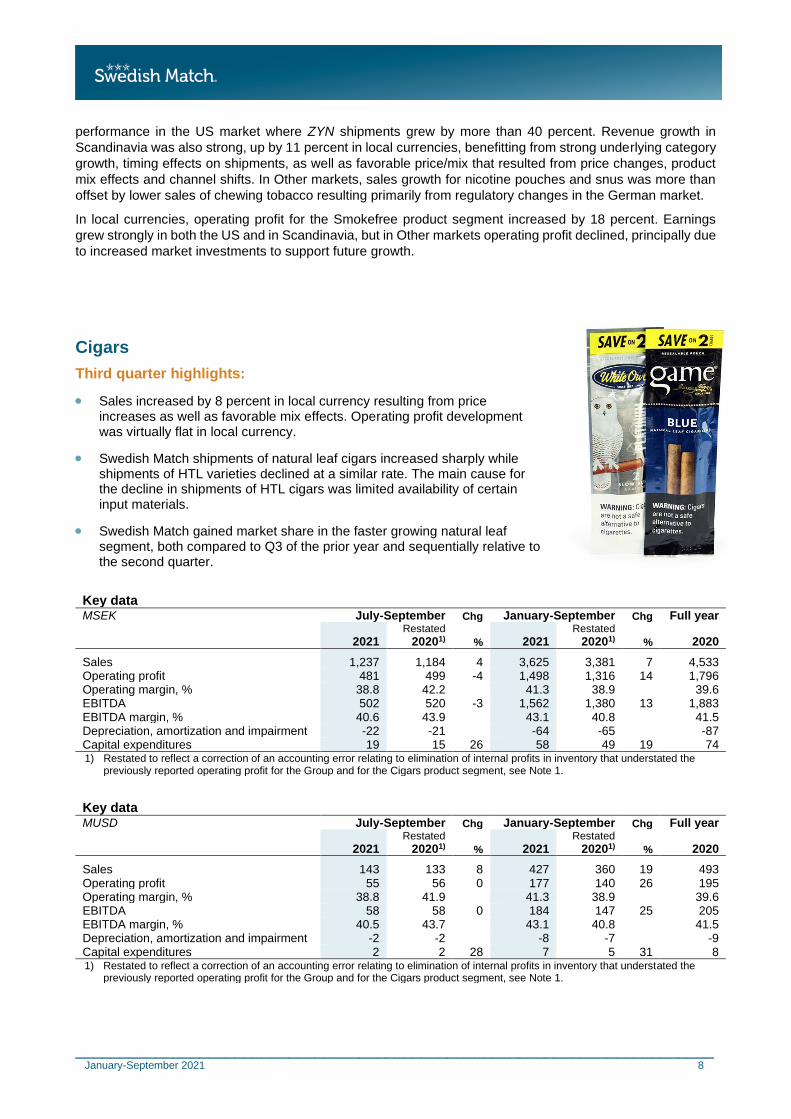
Cigars
Third quarter highlights:
• Sales increased by 8 percent in local currency resulting from price increases as well as favorable mix effects. Operating profit development was virtually flat in local currency.
• Swedish Match shipments of natural leaf cigars increased sharply while shipments of HTL varieties declined at a similar rate. The main cause for the decline in shipments of HTL cigars was limited availability of certain input materials.
• Swedish Match gained market share in the faster growing natural leaf segment, both compared to Q3 of the prior year and sequentially relative to the second quarter.
Key data MSEK July-September Chg January-September Chg Full year
2021 Restated
20201) % 2021 Restated
20201) % 2020
Sales 1,237 1,184 4 3,625 3,381 7 4,533 Operating profit 481 499 -4 1,498 1,316 14 1,796 Operating margin, % 38.8 42.2 41.3 38.9 39.6 EBITDA 502 520 -3 1,562 1,380 13 1,883 EBITDA margin, % 40.6 43.9 43.1 40.8 41.5 Depreciation, amortization and impairment -22 -21 -64 -65 -87 Capital expenditures 19 15 26 58 49 19 74 1) Restated to reflect a correction of an accounting error relating to elimination of internal profits in inventory that understated the
previously reported operating profit for the Group and for the Cigars product segment, see Note 1.
Key data MUSD July-September Chg January-September Chg Full year
2021 Restated
20201) % 2021 Restated
20201) % 2020
Sales 143 133 8 427 360 19 493 Operating profit 55 56 0 177 140 26 195 Operating margin, % 38.8 41.9 41.3 38.9 39.6 EBITDA 58 58 0 184 147 25 205 EBITDA margin, % 40.5 43.7 43.1 40.8 41.5 Depreciation, amortization and impairment -2 -2 -8 -7 -9 Capital expenditures 2 2 28 7 5 31 8 1) Restated to reflect a correction of an accounting error relating to elimination of internal profits in inventory that understated the
previously reported operating profit for the Group and for the Cigars product segment, see Note 1.

________________________________________________________________________ January-September 2021 9
The third quarter
(Note: Comments below refer to the comparison between the third quarter 2021 vs. the third quarter 2020).
The Cigars product segment derives its sales and profit almost exclusively from the US operations.
The 8 percent increase in local currency sales was driven by higher average price per cigar as a result of both
price increases and a favorable portfolio mix, with very limited shipments of value priced offerings and a higher
share of natural leaf varieties. Shipments of natural leaf cigars grew sharply as a result of strong segment
growth and continued progress in addressing production constraints brought on by the COVID-19 situation, in
turn resulting in market share improvement within the segment. Swedish Match shipment volumes of HTL
varieties declined at a more accelerated pace than the decline for the overall HTL segment, to a large extent
due to limited availability of certain raw materials. While we work diligently to mitigate production related
challenges, restrictions on certain input materials, in particular, are likely to continue limiting our ability to fully
meet expected strong cigar demand for some time ahead.
Despite the increase in sales, gross profit in local currency increased only marginally as the unit cost of
production was unfavorable due to production mix, higher raw material costs, as well as employee costs
relating to restoring and enhancing capacity levels in the Dominican manufacturing facility. Other operating
expenses increased slightly, partly due to timing of certain activities, resulting in flat operating profit
development in local currency.
Based on MSA measures of distributor shipments to retail, total mass market cigar category volumes
(excluding little cigars) declined by 3 percent in the quarter versus the prior year period with continued good
growth for natural leaf cigars not fully offsetting declines for HTL varieties. On a sequential basis, relative to
the second quarter, Swedish Match’s market share of the cigar category (excluding little cigars) improved
slightly, driven by a notable increase within the growing natural leaf segment.
Shipment volumes, the US Million sticks July-September Chg January-September Chg Full year 2021 2020 % 2021 2020 % 2020
Homogenized tobacco leaf (HTL) cigars 147 238 -38 599 617 -3 838 Natural leaf cigars 366 272 35 960 788 22 1,065
Cigars total 513 509 1 1,559 1,405 11 1,903
Market shares, the US1)
Percent July-September Chg January-September Chg Full year 2021 2020 ppts 2021 2020 ppts 2020
Homogenized tobacco leaf (HTL) cigars 12.5 16.9 -4.4 14.2 14.6 -0.4 14.8 Natural leaf cigars 37.0 33.9 3.1 35.0 37.4 -2.5 37.2 Cigars total 22.4 23.0 -0.7 22.2 22.4 -0.2 22.5 1) Based on MSA distributor shipments: Mass market cigars (excluding little cigars) 13 weeks and YTD to September 26, 2021 and
September 27, 2020 respectively. Figures for 2020 have been restated to reflect changes in MSA store measurements.
The first nine months
(Note: Comments below refer to the comparison between the first nine months 2021 vs. the first nine months 2020).
For the first nine months, sales grew by 19 percent in local currency attributable to improved pricing and
double-digit volume growth, driven by natural leaf varieties. Operating profit in local currency increased by 26
percent reflecting the benefits of improved pricing as well as the leveraging effect of higher volumes.
Based on MSA measures of distributor shipments to retail, total mass market cigar category volumes
(excluding little cigars) increased by 6 percent in the nine-month period, with Swedish Match growing at a
marginally slower pace.
________________________________________________________________________ January-September 2021 10
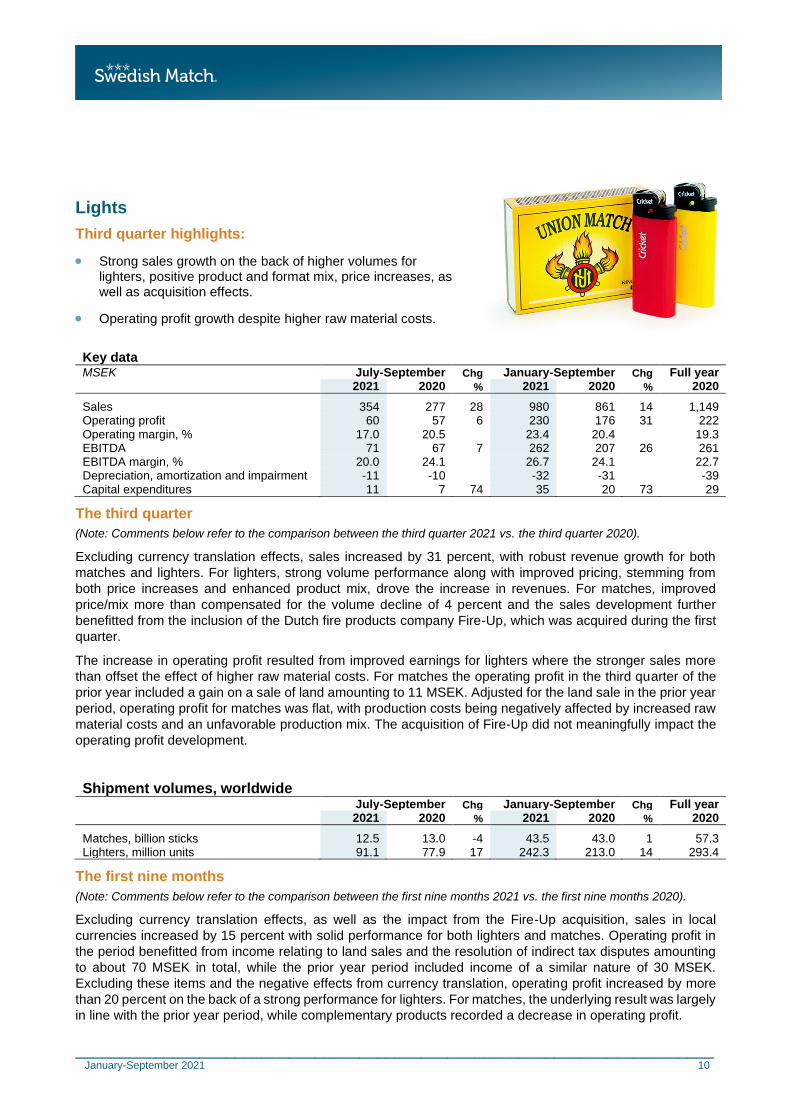
Lights
Third quarter highlights:
• Strong sales growth on the back of higher volumes for lighters, positive product and format mix, price increases, as well as acquisition effects.
• Operating profit growth despite higher raw material costs.
Key data MSEK July-September Chg January-September Chg Full year 2021 2020 % 2021 2020 % 2020
Sales 354 277 28 980 861 14 1,149 Operating profit 60 57 6 230 176 31 222 Operating margin, % 17.0 20.5 23.4 20.4 19.3 EBITDA 71 67 7 262 207 26 261 EBITDA margin, % 20.0 24.1 26.7 24.1 22.7 Depreciation, amortization and impairment -11 -10 -32 -31 -39 Capital expenditures 11 7 74 35 20 73 29
The third quarter
(Note: Comments below refer to the comparison between the third quarter 2021 vs. the third quarter 2020).
Excluding currency translation effects, sales increased by 31 percent, with robust revenue growth for both
matches and lighters. For lighters, strong volume performance along with improved pricing, stemming from
both price increases and enhanced product mix, drove the increase in revenues. For matches, improved
price/mix more than compensated for the volume decline of 4 percent and the sales development further
benefitted from the inclusion of the Dutch fire products company Fire-Up, which was acquired during the first
quarter.
The increase in operating profit resulted from improved earnings for lighters where the stronger sales more
than offset the effect of higher raw material costs. For matches the operating profit in the third quarter of the
prior year included a gain on a sale of land amounting to 11 MSEK. Adjusted for the land sale in the prior year
period, operating profit for matches was flat, with production costs being negatively affected by increased raw
material costs and an unfavorable production mix. The acquisition of Fire-Up did not meaningfully impact the
operating profit development.
Shipment volumes, worldwide July-September Chg January-September Chg Full year 2021 2020 % 2021 2020 % 2020
Matches, billion sticks 12.5 13.0 -4 43.5 43.0 1 57.3 Lighters, million units 91.1 77.9 17 242.3 213.0 14 293.4
The first nine months
(Note: Comments below refer to the comparison between the first nine months 2021 vs. the first nine months 2020).
Excluding currency translation effects, as well as the impact from the Fire-Up acquisition, sales in local
currencies increased by 15 percent with solid performance for both lighters and matches. Operating profit in
the period benefitted from income relating to land sales and the resolution of indirect tax disputes amounting
to about 70 MSEK in total, while the prior year period included income of a similar nature of 30 MSEK.
Excluding these items and the negative effects from currency translation, operating profit increased by more
than 20 percent on the back of a strong performance for lighters. For matches, the underlying result was largely
in line with the prior year period, while complementary products recorded a decrease in operating profit.

________________________________________________________________________ January-September 2021 11
Cash flow and financing Cash flow from operating activities for the first nine months of 2021 amounted to 4,766 MSEK (4,220). The
improved cash flow was driven by the stronger EBITDA development, the above-mentioned settlement income
of 300 MSEK and lower tax payments, partly offset by negative changes in cash flow from working capital,
mainly due to timing effects.
Investments in property, plant and equipment increased to 859 MSEK (747) principally benefitting the
Smokefree product segment. Cash flow used in investing activities reflects an acquisition of Fire-Up, a small
European manufacturer of sustainable firelighters and related products (see Note 4).
The Group’s net finance cost amounted to 262 MSEK (267). Excluding interest costs of 16 MSEK relating to
the adverse tax ruling in Sweden in the prior year period, net finance cost increased by 11 MSEK reflecting
lower financial returns on surplus cash and higher interest rates on debt.
During the first nine months, new bond loans of 1,813 MSEK were issued, repayments of maturing bond loans
amounted to 1,553 MSEK, and early repayment of short-term bond loans amounted to 716 MSEK. As of
September 30, 2021, Swedish Match had 14,704 MSEK of interest-bearing debt excluding retirement benefit
obligations but including the recognition of lease liabilities of 275 MSEK. The Group’s interest-bearing debt at
December 31, 2020 amounted to 15,523 MSEK. For further detail on the maturity profile of the debt portfolio,
please see the Company’s website. Net retirement benefit obligations decreased to 1,183 MSEK as of
September 30, 2021, from 1,411 MSEK at December 31, 2020 due to positive remeasurements effects from
higher discount rates and higher return on plan assets.
As of September 30, 2021, Swedish Match had 1,500 MSEK in unutilized committed credit lines. Cash and
cash equivalents amounted to 2,243 MSEK at the end of the period, compared to 3,411 MSEK at December
31, 2020.
The net debt as of September 30, 2021 amounted to 13,644 MSEK compared to 13,523 MSEK at December
31, 2020 and 13,346 MSEK at September 30, 2020.
Shareholder distributions and the share In the first nine months of 2021, Swedish Match paid dividends of 2,369 MSEK to its shareholders. During the
same period, Swedish Match repurchased 29.9 million shares for 2,232 MSEK at an average price of 74.73
SEK, following authorization from the Annual General Meetings held in 2020 and 2021. Total shares bought
back by Swedish Match since the buyback program started have been repurchased at an average price of
15.49 SEK. As per September 30, 2021, Swedish Match held 25.8 million shares, corresponding to 1.63
percent of the total number of shares. The number of shares outstanding, net, as per September 30, 2021,
amounted to 1.554 billion.
In May 2021, the number of shares and votes in Swedish Match AB (publ) increased as a result of the share
split (ratio 10:1) that was resolved by Swedish Match AB’s Annual General Meeting on April 13, 2021, through
which each existing share was divided into ten shares. The record date for the share split was May 10, 2021.
Following the share split, the total number of shares in the Company amounts to 1,580,000,000 shares
(previously 158,000,000 shares).
Effects from COVID-19 While longer-term effects from the pandemic are uncertain, the negative commercial, operational and financial
consequences to Swedish Match have thus far been limited. Just as in the previous year, for the nine-month
period ending September 30, 2021, the Scandinavian smokefree business has likely benefitted financially from
favorable channel mix effects that have been brought on by COVID-19 restrictions related to travel. For Cigars,
since the on-set of the pandemic, consumer demand is likely to have been elevated as a consequence of
changed consumption patterns. However, it is challenging to identify and quantify any such potential effects
and Swedish Match has faced production constraints in its cigar operations, partly as a consequence of the
COVID-19 situation, which has led to an inability to fully meet demand. Swedish Match, like many other
companies, has experienced higher costs and some difficulties in sourcing certain input materials. These
challenges in relation to input materials may have been caused, at least to some extent, by direct or indirect
consequences of the pandemic.
No material governmental subsidies or concessions related to COVID-19 have been sought or received by
Swedish Match during the first nine months of 2021.

________________________________________________________________________ January-September 2021 12
Swedish Match is closely monitoring the current situation including governmental guidelines and advice from
public health authorities in every country where we operate. We are proactively taking the steps that we believe
are appropriate to mitigate potential impacts to our employees, our customers and our business, as well as to
society.
Other events during the quarter
Nominating Committee In accordance with the instructions adopted by the Annual General Meeting 2021, a Nominating Committee
has been appointed. In addition to Conny Karlsson (Chairman of the Board), the following (in alphabetical
order) have been appointed members of the Nominating Committee: Mads Eg Gensmann (Nordflint Capital
Partners Fondsmaeglerselskab A/S), Filippa Gerstädt (Nordea Funds), Roseanna Ivory (Aberdeen Standard
Investments), and Dan Juran (Framtiden Management Company, LLC). Filippa Gerstädt serves as Chairman
of the Nominating Committee.
Full year 2021 outlook Swedish Match expects that the trend of increased interest from consumers, industry participants and
regulators in less harmful alternatives to cigarettes will continue. Our ambition is to create value for both
shareholders and society by providing products that are recognized as safer alternatives to cigarettes.
For the full year of 2021, Swedish Match expects continued market growth for smokefree products, most
notably driven by rapid growth of nicotine pouches. Swedish Match expects that the attractive prospects of the
nicotine pouch category will further elevate competitive activity.
For 2021, Swedish Match expects increased investments in marketing, distribution and sales efforts in both
existing and new markets to actively participate in growth opportunities. Continued capital investments by
Swedish Match to further expand nicotine pouch production capacity are expected to result in capital
expenditures in 2021 above the 2020 level.
While Swedish Match expects that the COVID-19 pandemic will remain a serious public health issue for the
remaining part of 2021, Swedish Match expects its business to remain largely resilient to material negative
COVID-19 related effects.
The effective underlying corporate tax rate in 2021, excluding associated companies, is expected to be around
23 percent.
The Company remains committed to returning cash not needed in operations to shareholders.
Risk factors Swedish Match faces intense competition in all of its markets and for each of its products and such competition
may increase in the future. To remain successful, the Group must develop products and brands that resonate
with changing consumer trends, and price and promote its brands competitively. Restrictions on advertising
and promotion may, however, make it more difficult to counteract any loss of consumer loyalty. Competitors
may develop and promote new products which could be successful, and could thereby have an adverse effect
on Swedish Match results of operations.
Swedish Match has substantial sales in the US, with products sourced from local US production facilities and
imports from Swedish Match’s production facilities in the Dominican Republic and in Sweden. Swedish Match
also has operations in Brazil, Denmark, Norway, the Philippines and EMU member countries. Consequently,
changes in import duties as well as in exchange rates of the euro, Norwegian krone, Danish krone, Brazilian
real, the Dominican peso and in particular the US dollar may adversely affect the Group’s results of operations,
cash flow, financial condition or relative price competitiveness in the future. Such effects may occur both in
local currencies and when such local currencies are translated into Swedish currency for purposes of financial
reporting.
Regulatory developments and fiscal changes related to tobacco and other nicotine products, corporate income
and other taxes, as well as to the marketing, sale and consumption of tobacco products and other products
________________________________________________________________________ January-September 2021 13
containing nicotine in the countries where the Group is operating may have an adverse effect on Swedish
Match financial results.
For a further description of risk factors affecting Swedish Match, see the Effects from COVID-19 above as well
as the Risk and risk management section in the Report of the Board of Directors in the Swedish Match annual
report for 2020, available on swedishmatch.com.
Swedish Match AB (publ) Swedish Match AB (publ) is the Parent Company of the Swedish Match Group. The main sources of income
for the Parent Company are dividends and Group contributions from subsidiaries.
Revenue from the Parent Company for the first nine months of 2021 amounted to 23 MSEK (19). Profit before
income tax amounted to 887 MSEK (2,075) and net profit for the first nine months amounted to 975 MSEK
(2,169). The lower profit before income tax compared to previous year was primarily related to participation in
Group companies.
Part of the Group’s treasury operations are within the operations of the Parent Company, including the major
part of the Group’s external borrowings. Substantially all of these loans have been hedged to fixed interest
rates.
Repayment of bond loans amounted to 2,270 MSEK during the first nine months and new bond loans of 1,813
MSEK were issued.
During the second quarter of 2021 it was resolved to split each of the Company's shares into ten shares (ratio
10:1). All references to shares and earnings per share in this document have been restated to reflect this split.
During the first nine months, the Parent Company made share repurchases of 29.9 million (34.9) shares for
2,232 MSEK (2,183).
A dividend of 2,369 MSEK (2,020) has been paid during the period.
Forward-looking information This report contains forward-looking information based on the current expectation of the Swedish Match
Group’s management. Although management deems that the expectations presented by such forward-looking
information are reasonable, no guarantee can be given that these expectations will prove correct. Accordingly,
the actual future outcome could vary considerably compared to that stated in the forward-looking information,
due to such factors as changed market conditions for Swedish Match’s products and more general factors
such as business cycles, markets and competition, unforeseen commercial or operational implications
attributable to COVID-19, changes in legal requirements or other political measures, and fluctuations in
exchange rates.
Additional information This report has not been reviewed by the Company’s auditors. The full year 2021 report will be released on
February 16, 2022.
Stockholm, October 27, 2021
Lars Dahlgren President and CEO

________________________________________________________________________ January-September 2021 14
Product segments summary and key ratios
Sales MSEK July-September Chg January-September Chg Full year 2021 2020 % 2021 2020 % 2020
Smokefree 3,100 2,842 9 8,878 8,045 10 10,651 Cigars 1,237 1,184 4 3,625 3,381 7 4,533 Lights 354 277 28 980 861 14 1,149
Sales from product segments 4,691 4,303 9 13,482 12,287 10 16,332 Other operations 87 97 -11 255 275 -7 366
Sales 4,778 4,400 9 13,738 12,561 9 16,698
Operating profit MSEK July-September Chg January-September Chg Full year
2021 Restated
2020 % 2021 Restated
2020 % 2020
Smokefree 1,558 1,519 3 4,451 3,974 12 5,142 Cigars 481 499 -4 1,498 1,316 14 1,796 Lights 60 57 6 230 176 31 222
Operating profit from product segments 2,099 2,075 1 6,179 5,465 13 7,160
Other operations -24 -28 -93 -124 -169 Settlement income - - 300 - -
Operating profit 2,075 2,048 1 6,385 5,341 20 6,991
Operating margin by product segment
Percent July-September January-September Full year
2021 Restated
2020 2021 Restated
2020
2020
Smokefree 50.3 53.5 50.1 49.4 48.3 Cigars 38.8 42.2 41.3 38.9 39.6 Lights 17.0 20.5 23.4 20.4 19.3 Operating margin from product segments 44.7 48.2 45.8 44.5 43.8
EBITDA by product segment
MSEK July-September Chg January-September Chg Full year
2021 Restated
2020 % 2021 Restated
2020
2020
Smokefree 1,663 1,617 3 4,755 4,270 11 5,539 Cigars 502 520 -3 1,562 1,380 13 1,883 Lights 71 67 7 262 207 26 261
EBITDA from product segments 2,236 2,204 1 6,579 5,858 12 7,684
EBITDA margin by product segment
Percent July-September January-September Full year
2021 Restated
2020 2021 Restated
2020
2020
Smokefree 53.6 56.9 53.6 53.1 52.0 Cigars 40.6 43.9 43.1 40.8 41.5 Lights 20.0 24.1 26.7 24.1 22.7 EBITDA margin from product segments 47.7 51.2 48.8 47.7 47.0
________________________________________________________________________ January-September 2021 15
Key ratios January-September 12 months Full year
2021 Restated
2020 ended
Sep 30, 2021 2020
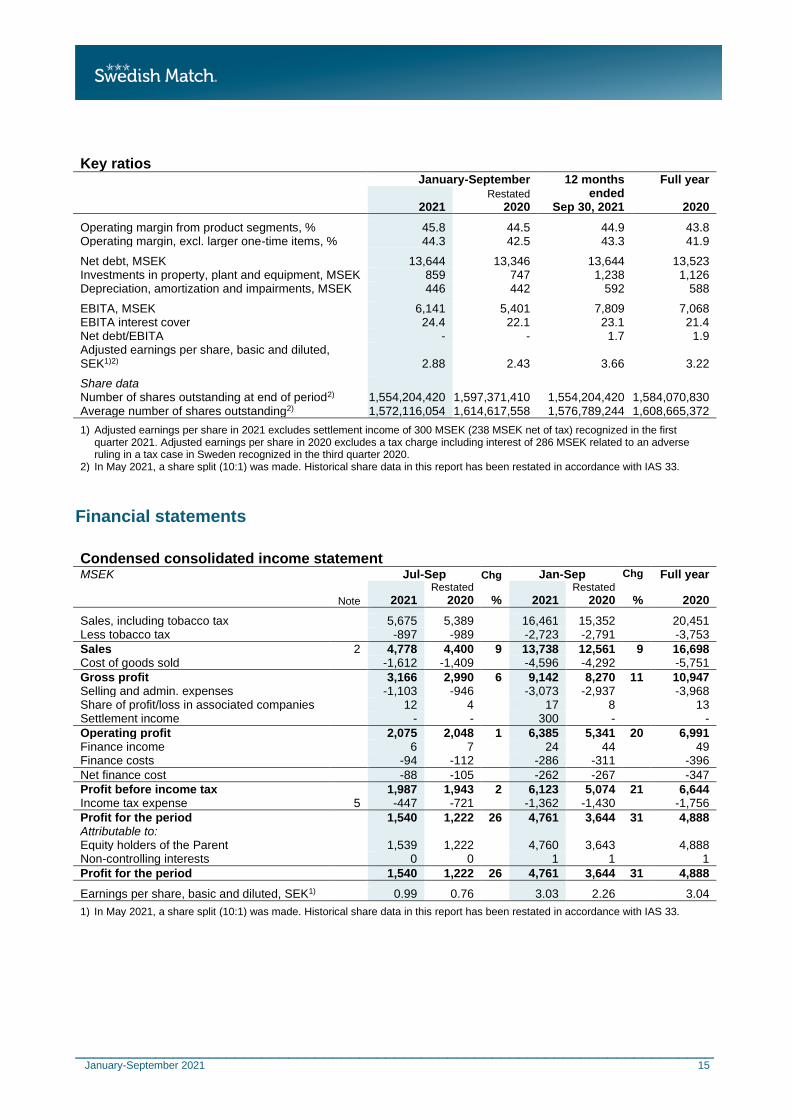
Operating margin from product segments, % 45.8 44.5 44.9 43.8 Operating margin, excl. larger one-time items, % 44.3 42.5 43.3 41.9
Net debt, MSEK 13,644 13,346 13,644 13,523 Investments in property, plant and equipment, MSEK 859 747 1,238 1,126 Depreciation, amortization and impairments, MSEK 446 442 592 588
EBITA, MSEK 6,141 5,401 7,809 7,068 EBITA interest cover 24.4 22.1 23.1 21.4 Net debt/EBITA - - 1.7 1.9 Adjusted earnings per share, basic and diluted, SEK1)2)
2.88
2.43 3.66 3.22
Share data Number of shares outstanding at end of period2) 1,554,204,420 1,597,371,410 1,554,204,420 1,584,070,830 Average number of shares outstanding2) 1,572,116,054 1,614,617,558 1,576,789,244 1,608,665,372
1) Adjusted earnings per share in 2021 excludes settlement income of 300 MSEK (238 MSEK net of tax) recognized in the first quarter 2021. Adjusted earnings per share in 2020 excludes a tax charge including interest of 286 MSEK related to an adverse ruling in a tax case in Sweden recognized in the third quarter 2020.
2) In May 2021, a share split (10:1) was made. Historical share data in this report has been restated in accordance with IAS 33.
Financial statements
Condensed consolidated income statement MSEK Jul-Sep Chg Jan-Sep Chg Full year
Note 2021 Restated
2020 % 2021 Restated
2020 % 2020
Sales, including tobacco tax 5,675 5,389 16,461 15,352 20,451 Less tobacco tax -897 -989 -2,723 -2,791 -3,753
Sales 2 4,778 4,400 9 13,738 12,561 9 16,698 Cost of goods sold -1,612 -1,409 -4,596 -4,292 -5,751
Gross profit 3,166 2,990 6 9,142 8,270 11 10,947 Selling and admin. expenses -1,103 -946 -3,073 -2,937 -3,968 Share of profit/loss in associated companies 12 4 17 8 13 Settlement income - - 300 - -
Operating profit 2,075 2,048 1 6,385 5,341 20 6,991 Finance income 6 7 24 44 49 Finance costs -94 -112 -286 -311 -396
Net finance cost -88 -105 -262 -267 -347
Profit before income tax 1,987 1,943 2 6,123 5,074 21 6,644 Income tax expense 5 -447 -721 -1,362 -1,430 -1,756
Profit for the period 1,540 1,222 26 4,761 3,644 31 4,888 Attributable to: Equity holders of the Parent 1,539 1,222 4,760 3,643 4,888 Non-controlling interests 0 0 1 1 1
Profit for the period 1,540 1,222 26 4,761 3,644 31 4,888
Earnings per share, basic and diluted, SEK1) 0.99 0.76 3.03 2.26 3.04
1) In May 2021, a share split (10:1) was made. Historical share data in this report has been restated in accordance with IAS 33.

________________________________________________________________________ January-September 2021 16
Condensed consolidated statement of comprehensive income MSEK Jul-Sep Jan-Sep Full year
2021 Restated
2020 2021 Restated
2020 2020
Profit for the period 1,540 1,222 4,761 3,644 4,888 Other comprehensive income that may be reclassified to the income statement Translation differences related to foreign operations 231 -267 497 -401 -1,120 Effective portion of changes in fair value of cash flow hedges 38 6 76 -32 -51 Income tax relating to reclassifiable components of other comprehensive income -8 -1 -16 7 11
Sub-total, net of tax for the period 261 -263 558 -426 -1,160
Other comprehensive income that will not be reclassified to the income statement Actuarial gains/losses attributable to pensions, incl. payroll tax 34 162 404 -256 -132 Income tax relating to non-reclassifiable components of other comprehensive income -8 -41 -97 60 33
Sub-total, net of tax for the period 25 122 307 -196 -99
Total comprehensive income for the period 1,826 1,081 5,625 3,022 3,629
Attributable to: Equity holders of the Parent 1,826 1,081 5,624 3,022 3,628 Non-controlling interests 0 0 1 0 0
Total comprehensive income for the period 1,826 1,081 5,625 3,022 3,629
Condensed consolidated balance sheet MSEK Note September 30, 2021 December 31, 2020
Intangible assets 2,280 2,237 Property, plant and equipment 4,305 3,633 Right-of-use assets 263 278 Investments in associated companies 51 42 Other non-current assets and operating receivables 25 20 Other non-current financial assets and receivables 3,6 1,779 1,556
Total non-current assets 8,704 7,765
Other current financial receivables 3,6 300 219 Current operating assets and receivables 3 4,315 3,732 Cash and cash equivalents 3 2,243 3,411
Total current assets 6,858 7,362
Assets held for sale1) - 28
Total assets 15,562 15,155
Equity attributable to equity holders of the Parent -6,791 -7,814 Non-controlling interests 17 16
Total equity -6,773 -7,798
Non-current financial provisions 1,259 1,268 Non-current loans 3 14,117 13,514 Other non-current financial liabilities 3,6 1,649 1,926 Other non-current operating liabilities 3 470 485
Total non-current liabilities 17,495 17,194
Current loans 3 988 1,850 Other current financial liabilities 3,6 355 653 Other current operating liabilities 3 3,498 3,257
Total current liabilities 4,840 5,759
Total liabilities 22,335 22,953
Total equity and liabilities 15,562 15,155
1) Assets held for sale in 2020 refers to land and forestry assets.

________________________________________________________________________ January-September 2021 17
Condensed consolidated cash flow statement MSEK January-September
2021 Restated
2020
Operating activities Profit before income taxes 6,123 5,074 Share of profit/loss in associated companies -17 -8 Dividend received from associated companies 9 10 Adjustments for non-cash items etc.1) 358 511 Income tax paid -1,403 -1,524
Cash flow from operating activities before changes in working capital 5,069 4,063 Changes in working capital -303 157
Net cash generated from operating activities 4,766 4,220
Investing activities Purchase of property, plant and equipment -859 -747 Proceeds from sale of property, plant and equipment 49 20 Purchase of intangible assets -7 -39 Acquisition of subsidiaries2) -39 -32 Changes in financial receivables etc. 5 9
Net cash used in investing activities -851 -789
Financing activities Proceeds from borrowings 1,813 3,175 Repayment of borrowings -2,270 -500 Dividend paid to equity holders of the Parent -2,369 -2,020 Repurchase of own shares -2,232 -2,183 Lease payments -65 -61 Realized exchange gain/losses on financial instruments -95 -318 Other -0 -
Net cash used in financing activities -5,218 -1,906
Net decrease/increase in cash and cash equivalents -1,303 1,524 Cash and cash equivalents at the beginning of the period 3,411 2,370 Effect of exchange rate fluctuations on cash and cash equivalents 134 -134
Cash and cash equivalents at the end of the period 2,243 3,760
1) Non-cash items etc. mainly refer to depreciation, amortization and accrued interest. 2) Acquisition of subsidiaries in 2021 includes consideration paid relating to the acquisition of Fire-Up International B.V. (see Note 4)
and in 2020 refers to the remaining consideration related to the acquisition of Gotlandssnus in 2018.

________________________________________________________________________ January-September 2021 18
Condensed consolidated statement of changes in equity MSEK
Equity attributable to holders of
the Parent
Non-controlling
interests Total equity
Equity at January 1, 2020 -6,324 16 -6,308
Profit for the period 3,643 1 3,644 Other comprehensive income, net of tax for the period -622 0 -622
Total comprehensive income for the period 3,022 0 3,022
Dividend -2,020 0 -2,020 Repurchase of own shares -2,183 - -2,183 Cancellation of shares -18 - -18 Bonus issues 18 - 18
Restated equity at September 30, 2020 -7,505 16 -7,489
Equity at January 1, 2021 -7,814 16 -7,798
Profit for the period 4,760 1 4,761 Other comprehensive income, net of tax for the period 864 0 865
Total comprehensive income for the period 5,624 1 5,625
Dividend -2,369 0 -2,369 Repurchase of own shares -2,232 - -2,232 Cancellation of shares -10 - -10 Bonus issues 10 - 10
Equity at September 30, 2021 -6,791 17 -6,773
Objectives, policies and processes for managing capital The basis for determining dividends and repurchasing of own shares is the equity of the Parent Company.
Total equity in the Parent Company as per September 30, 2021 amounted to 8,279 MSEK and distributable
earnings amounted to 7,936 MSEK.
In addition, before any distribution of capital to shareholders is determined, the financial position of the Group
is carefully analyzed. As part of this analysis, the Board of Directors of Swedish Match has adopted certain
financial guidelines and risk management procedures to ensure that the Parent Company and the Group
maintain adequate liquidity to meet reasonably foreseeable requirements taking into account the maturity
profile of debt obligations.
The dividend policy of the Company is a pay-out ratio of 40 to 60 percent of the earnings per share, subject to
adjustments for larger one-time items. The Board has further determined that the financial policy should be,
for the Group, to strive to maintain a net debt that does not exceed 3 times EBITA. The Board continually
reviews the financial position of the Company, and the actual level of net debt is assessed against anticipated
future profitability and cash flow, investment and expansion plans, acquisition opportunities as well as the
development of interest rates and credit markets. Excess funds are returned to shareholders through dividends
and share repurchases. For further information on distribution of capital to the shareholders during the period
see section Shareholder distributions and the share in this report.
________________________________________________________________________ January-September 2021 19
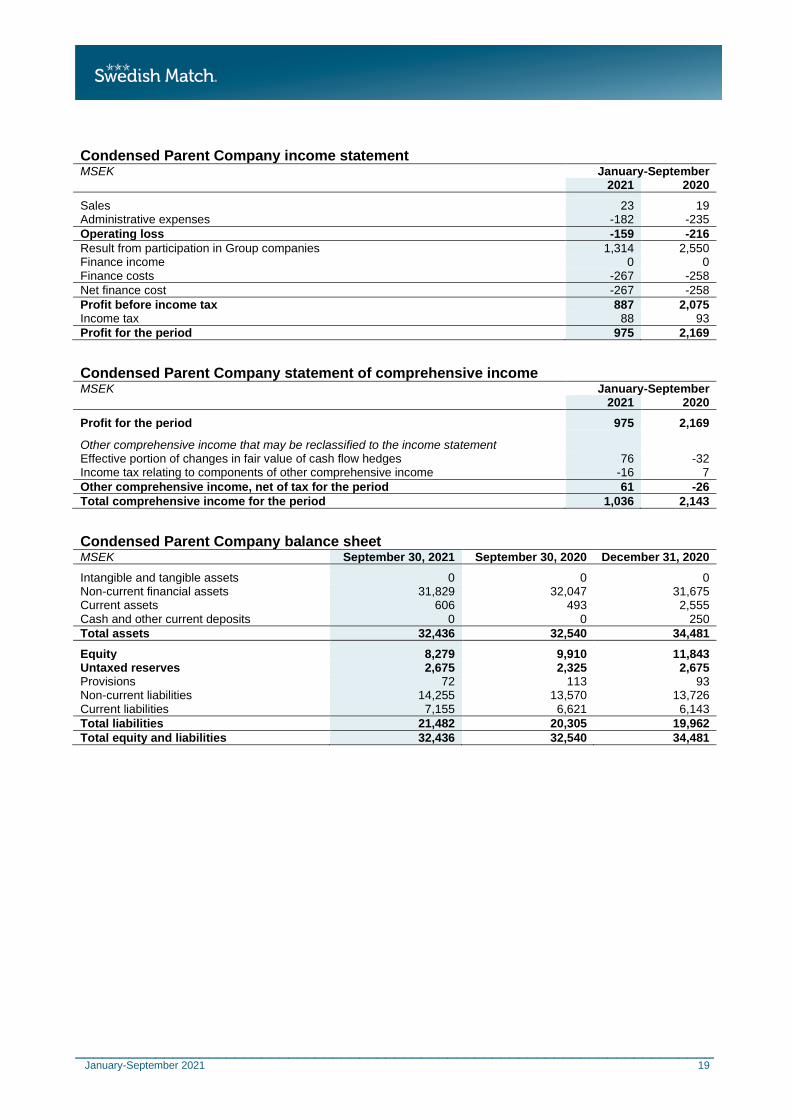
Condensed Parent Company income statement MSEK January-September 2021 2020
Sales 23 19 Administrative expenses -182 -235
Operating loss -159 -216
Result from participation in Group companies 1,314 2,550 Finance income 0 0 Finance costs -267 -258
Net finance cost -267 -258
Profit before income tax 887 2,075 Income tax 88 93
Profit for the period 975 2,169
Condensed Parent Company statement of comprehensive income MSEK January-September 2021 2020
Profit for the period 975 2,169
Other comprehensive income that may be reclassified to the income statement Effective portion of changes in fair value of cash flow hedges 76 -32 Income tax relating to components of other comprehensive income -16 7
Other comprehensive income, net of tax for the period 61 -26
Total comprehensive income for the period 1,036 2,143
Condensed Parent Company balance sheet
MSEK September 30, 2021 September 30, 2020 December 31, 2020
Intangible and tangible assets 0 0 0 Non-current financial assets 31,829 32,047 31,675 Current assets 606 493 2,555 Cash and other current deposits 0 0 250
Total assets 32,436 32,540 34,481
Equity 8,279 9,910 11,843 Untaxed reserves 2,675 2,325 2,675 Provisions 72 113 93 Non-current liabilities 14,255 13,570 13,726 Current liabilities 7,155 6,621 6,143
Total liabilities 21,482 20,305 19,962
Total equity and liabilities 32,436 32,540 34,481

________________________________________________________________________ January-September 2021 20
Note 1 – Accounting principles This report for the Group is prepared in accordance with the Accounting Standard IAS 34 Interim Financial
Reporting and applicable rules in the Annual Accounts Act. The report for the Parent Company for the same
period is prepared in accordance with the Annual Accounts Act, Chapter 9 and RFR 2. Additional disclosures
as required under IAS 34.16A may be found within the financial statements and related notes and in the
narrative text of the interim financial report.
There are no changes to IFRS standards, amendments and interpretations of existing standards applicable as
of January 1, 2021 that have had an effect on the Group’s financial result or position. The accounting principles
and basis of calculation in this report are the same as in the annual report for 2020.
Restatement of prior period financial information
During 2020, COVID-19-related implications on the cigar supply chain resulted in unusually low inventory
levels of cigars manufactured and shipped from the production facility in the Dominican Republic. In
conjunction with the 2020 year end reconciliation processes, an accounting error relating to elimination of
internal profits in inventory that understated the previously reported operating profit for the Group and for the
product segment Cigars amounting to 63 MSEK (7 MUSD) for the first nine months of 2020 was discovered
and corrected. Operating profits for the Group and for the product segment Cigars have been restated for Q1
through Q3 2020 and the corrected operating profits exceeded the previously reported levels by 7 MSEK for
the first quarter, by 26 MSEK for the second quarter and by 30 MSEK for the third quarter. Periods before 2020
were not affected by the accounting error and consequently have not been restated. Restated quarterly
financials affected by the adjustments are presented on pages 27-28 in this report.
Note 2 – Disaggregation of revenue The main revenue streams for the Swedish Match Group arise from sale of goods manufactured by the Group.
Within Lights, a small portion of the revenue also pertains to the distribution of third party products. Revenue
within Other operations mainly pertains to income from logistics services for delivery of third party products to
retail customers. Revenue for the sale of goods and logistics services are recognized at the point when the
control of the promised good or service is transferred to the customer at the expected consideration to be
received for such delivery. The expected consideration recognized reflects estimates of potential outcome of
variable considerations as well as expected reimbursements for product returns.
Sales – July to September MSEK Segments
Other operations Group
Smokefree Cigars Lights
Total segments
Primary geographical Jul-Sep Jul-Sep Jul-Sep Jul-Sep Jul-Sep Jul-Sep markets 2021 2020 2021 2020 2021 2020 2021 2020 2021 2020 2021 2020
The US 1,708 1,566 1,237 1,184 63 25 3,009 2,775 - - 3,009 2,775 Scandinavia 1,341 1,240 - - 15 13 1,356 1,254 87 97 1,442 1,350 Other markets 50 36 - - 277 239 327 275 - - 327 275
Total sales 3,100 2,842 1,237 1,184 354 277 4,691 4,303 87 97 4,778 4,400
Sales – January to September MSEK Segments
Other operations Group
Smokefree Cigars Lights
Total segments
Primary geographical Jan-Sep Jan-Sep Jan-Sep Jan-Sep Jan-Sep Jan-Sep markets 2021 2020 2021 2020 2021 2020 2021 2020 2021 2020 2021 2020
The US 4,900 4,457 3,625 3,381 142 72 8,667 7,910 - - 8,667 7,910 Scandinavia 3,857 3,458 - - 39 35 3,896 3,492 255 275 4,152 3,767 Other markets 121 130 - - 799 754 920 885 - - 920 885
Total sales 8,878 8,045 3,625 3,381 980 861 13,482 12,287 255 275 13,738 12,561

________________________________________________________________________ January-September 2021 21
Note 3 – Carrying value and fair value of financial assets and liabilities Swedish Match applies IFRS 9 to classify and measure financial instruments.
The following valuation techniques of the fair value hierarchy are used in determining the fair values of the
financial instruments:
Level 1 - Quoted prices (unadjusted) in active markets
Level 2 - Inputs other than quoted prices included within level 1 that are observable, either directly or
indirectly
Level 3 - Inputs that are not based on observable market data
The following table shows carrying value and fair value for financial instruments per September 30, 2021.
Carrying value and fair value MSEK
Financial instruments measured at
FVTPL
Financial assets
measured at amortized
cost
Other financial liabilities
Cash flow hedges
measured at FVOCI
Other receivables
and liabilities
Total carrying
value Estimated fair value
Trade receivables - 1,819 - - - 1,819 1,819
Other non-current financial receivables - 36 - 626 561 1,224 1,224
Other current assets and financial receivables 82 98 - 42 170 392 392
Prepaid expenses and accrued income1) - - - 1 152 153 153
Cash and cash equivalents - 2,243 - - - 2,243 2,243
Total assets 82 4,196 - 669 883 5,831 5,831
Loans and borrowings - - 15,105 - - 15,105 15,482
Other non-current financial liabilities - - 192 138 41 372 372
Other current liabilities 0 - 83 - 1,654 1,737 1,737
Accrued expenses and deferred income1) - - 109 39 836 984 984
Trade payables - - 511 - - 511 511
Total liabilities 0 - 16,000 177 2,531 18,709 19,086
1) Accrued interest income on cash flow hedges is reported in the balance sheet as Prepaid expenses and accrued income and accrued interest expense on cash flow hedges is reported as Accrued expenses and deferred income.
Fair value measurement by level MSEK Level 1 Level 2 Level 3 Total
Derivative financial assets - 751 - 751
Derivative financial liabilities - 177 - 177

________________________________________________________________________ January-September 2021 22
The following table shows carrying value and fair value for financial instruments per December 31, 2020.
Carrying value and fair value MSEK
Financial instruments measured at
FVTPL
Financial assets
measured at amortized
cost
Other financial liabilities
Cash flow hedges
measured at FVOCI
Other receivables
and liabilities
Total carrying
value Estimated fair value
Trade receivables - 1,577 - - - 1,577 1,577
Other non-current financial receivables - 3 - 459 473 935 935
Other current assets and financial receivables 1 69 - - 246 315 315
Prepaid expenses and accrued income1) - - - 1 115 117 117
Cash and cash equivalents - 3,411 - - - 3,411 3,411
Total assets 1 5,060 - 460 834 6,355 6,355
Loans and borrowings - - 15,364 - - 15,364 15,713
Other non-current financial liabilities - - 208 213 45 466 466
Other current liabilities 258 - 77 - 1,617 1,952 1,952
Accrued expenses and deferred income1) - - 122 46 850 1,018 1,018
Trade payables - - 409 - - 409 409
Total liabilities 258 - 16,180 259 2,512 19,209 19,558
1) Accrued interest income on cash flow hedges is reported in the balance sheet as Prepaid expenses and accrued income and accrued interest expense on cash flow hedges is reported as Accrued expenses and deferred income.
Fair value measurement by level MSEK Level 1 Level 2 Level 3 Total
Derivative financial assets - 461 - 461
Derivative financial liabilities - 517 - 517
No transfer in or out of level 2 has been made during the third quarter 2021. The recognized amounts are
regarded as reasonable estimates for all items measured at carrying value in the balance sheet, except for
loans and borrowings, as these amounts have a long time to maturity. The fair value of loans and borrowings
differ from their carrying value as a consequence of changes in the market interest rates. Items not valued at
fair value in the balance sheet are measured at amortized cost. The total nominal amount of outstanding
derivatives was 15,600 MSEK (14,035) of which 10,493 MSEK (9,991) was in cash flow hedges consisting of
cross currency and interest rate swaps related to bond loans. The remaining 5,107 MSEK (4,044) consisted
of currency swaps mainly related to the conversion of surplus cash in US dollars to Swedish kronor.
Methodologies utilized in the valuation of financial instruments can be found in Note 1 in the annual report for
2020.
________________________________________________________________________ January-September 2021 23
Note 4 – Business combinations On February 3, 2021, Svenska Tändsticksbolaget Försäljningsaktiebolag (a subsidiary of Swedish Match AB)
acquired 100 percent of the shares in Fire-Up International B.V., a Dutch company, which produces ecological
firelighters (used for stoves, fireplaces, barbecues, etc.) and trades in a variety of fire-related products mainly
in Europe. The company’s annual revenues amounts to approximately 80 MSEK. The acquired net assets
amounted to 15 MSEK and the preliminary acquisition fair value adjustments consisted of goodwill and
trademarks. Complete IFRS 3 disclosures are not provided as the acquisition is not deemed to materially
impact the Group’s statement of income or financial position.
Note 5 – Tax related contingencies
Tax audits in Sweden
During 2017, the Swedish Tax Agency performed tax audits in a number of Swedish Match’s Swedish group
companies. After completing the audits, the Swedish Tax Agency decided to deny certain cost deductions in
two cases. Both cases were appealed by Swedish Match but the cases were ruled in favor of the Tax Agency
by the County Administrative Court in Stockholm in May 2019 and January 2020 respectively. Swedish Match
subsequently appealed to the Administrative Court of Appeals in both cases. In August 2020 one of the cases
was ruled in favor of the Tax Agency by the Administrative Court of Appeals and the tax charges of in total 270
MSEK and related interest costs of 16 MSEK has been paid and debited in the 2020 accounts. Swedish Match
applied for leave to appeal and the leave was granted in June 2021 by the Supreme Administrative Court. In
the other case (in which the tax charge amounts to 43 MSEK excluding interest), the Court of Appeal decided
to hold the judgment pending the judgment of a similar case which may constitute a precedent by the Supreme
Administrative Court and in June 2021 the Supreme Administrative Court decided in favor of the taxpayer in
that case.
Resolution of indirect tax disputes in Brazil
In May 2021, Swedish Match received favorable decisions on the court-cases related to indirect taxes in Brazil
(principally value added taxes), including a new calculation methodology prescribed by the Brazilian tax
authority. Swedish Match has assessed its recovery rights for duplicative indirect taxes under the Supreme
court’s decision to 37 MSEK (24 MSEK, net of taxes on income). The amount has been recognized as
operating income in the Lights product segment in the second quarter 2021. In 2020, an operating income of
16 MSEK (11 MSEK, net of taxes on income) relating to additional indirect tax recoveries was recognized
within the Lights product segment based on the calculation methodology issued by the Brazil tax authority at
the time.

________________________________________________________________________ January-September 2021 24
Note 6 – Alternative performance measures Swedish Match presents several financial measures that are outside IFRS definitions (Alternative performance measures, according to ESMA’s guidelines) with the aim of enabling effective evaluation of the Group’s financial position and performance for investors and for the Group’s management. This means that these measures are not always comparable with measures used by other companies and shall therefore be considered as a complement to measures defined according to IFRS. Swedish Match applies these alternative key ratios consistently over time. The key ratios are alternative performance measures according to ESMA guidelines unless otherwise stated.
KEY RATIO DEFINITION/CALCULATION PURPOSE SALES FROM PRODUCT SEGMENTS
Sales from reportable segments, which excludes Other operations
Used as a measure of sales performance of the core commercial businesses of Swedish Match, excluding the impact of Other operations (incl. Swedish distribution function).
OPERATING PROFIT/LOSS (EBIT) FROM PRODUCT SEGMENTS
Operating profit from reportable segments, excluding Other operations and larger one-time items
Used as a measure of operating performance of the core commercial businesses of Swedish Match, excluding the impact of Other operations (incl. Swedish distribution function) and items which impact comparability between periods
OPERATING MARGIN FROM PRODUCT SEGMENTS (%)
100 × Operating profit from product segments ÷ Sales from product segments
Used as a measure of operational profitability of the core commercial businesses of Swedish Match excluding the impact of Other operations (incl. Swedish distribution function).
LARGER ONE-TIME ITEMS Larger one-time items are separately disclosed non-recurring income and cost which usually refer to larger capital gains or losses on divestments, larger asset impairments and restructuring costs and other larger non-recurring income and costs recognized during the period
Used to provide information regarding items which impact comparability between periods.
EBITDA Profit for the period excluding larger one-time items, net finance cost, income tax, depreciation, amortization and impairments of tangible, intangible and right-of-use assets
Used as an alternative measure of operating performance that is not impacted by historical investments and the related accounting treatment of such investments as well as items which impact comparability between periods.
EBITDA FROM PRODUCT SEGMENTS
Operating profit from product segments excluding depreciation, amortization and impairments of tangible, intangible and right-of-use assets
Used as an alternative measure of operating performance for the core commercial businesses of Swedish Match, that is not impacted by historical investments and the related accounting treatment of such investments as well as items which impact comparability between periods.
EBITDA MARGIN (%) 100 × EBITDA ÷ Sales Used as an alternative measure of operating profitability.
EBITDA MARGIN FROM PRODUCT SEGMENTS (%)
100 × EBITDA from product segments ÷ Sales from product segments
Used as an alternative measure of operating profitability for the core commercial businesses of Swedish Match.
PROFIT FOR THE PERIOD EXCLUDING LARGER ONE-TIME ITEMS
Profit for the period excluding larger one-time items
Used as an alternative measure of profit for the period of the ongoing business which is not affected by items which impact comparability between periods.
EBITA Profit for the period excluding larger one-time items, net finance cost, tax, amortization and impairments of intangible assets
Used as a measure of operating performance relative to the financial obligations of the Group.
EBITA 12 months rolling The aggregated profit excluding larger one-time items, net finance cost, tax, amortization and impairments of intangible assets for the 12-month period preceding the closing date
Used as a measure of operating performance relative to the financial obligations of the Group.
EBITA INTEREST COVER EBITA ÷ (Interest income - interest expense) Used as a measure of the ability to fund interest expense.
NET DEBT Current and non-current loans, adjusted for components of derivatives (assets and liabilities) relating to these loans + net provisions for pensions and similar obligations + current and non-current lease liabilities – cash and cash equivalents and other short-term investments
Used as a measure of net financial obligations.
NET DEBT/EBITA Net debt ÷ EBITA 12 months rolling Used as an indication of the duration (in years) required to fund existing net financial obligations with free cash flows from the ongoing business.
ADJUSTED EARNINGS PER SHARE
Profit for the period excluding larger one-time items net of tax ÷ Average number of shares outstanding
Used as an alternative measure of earnings per share which is not affected by items which impact comparability between periods.
________________________________________________________________________ January-September 2021 25
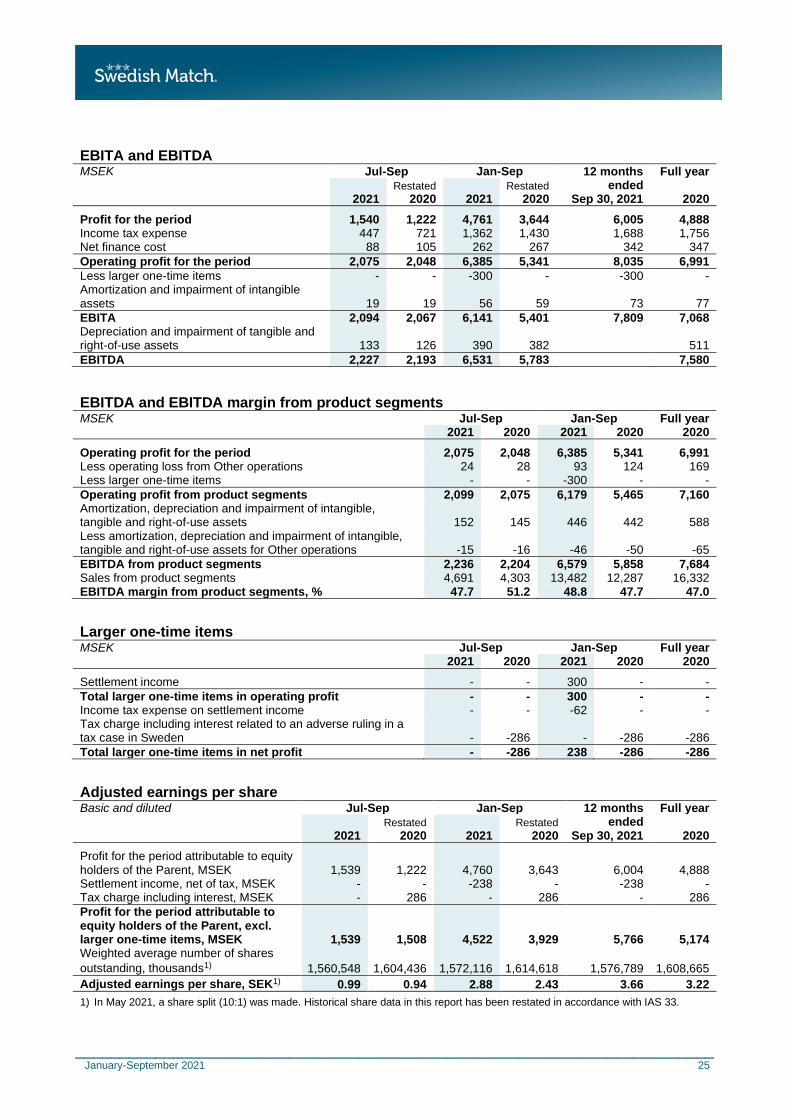
EBITA and EBITDA MSEK Jul-Sep Jan-Sep 12 months Full year
2021 Restated
2020 2021 Restated
2020 ended
Sep 30, 2021 2020
Profit for the period 1,540 1,222 4,761 3,644 6,005 4,888 Income tax expense 447 721 1,362 1,430 1,688 1,756 Net finance cost 88 105 262 267 342 347
Operating profit for the period 2,075 2,048 6,385 5,341 8,035 6,991
Less larger one-time items - - -300 - -300 - Amortization and impairment of intangible assets 19 19 56 59 73 77
EBITA 2,094 2,067 6,141 5,401 7,809 7,068 Depreciation and impairment of tangible and right-of-use assets 133 126 390 382 511
EBITDA 2,227 2,193 6,531 5,783 7,580
EBITDA and EBITDA margin from product segments MSEK Jul-Sep Jan-Sep Full year 2021 2020 2021 2020 2020
Operating profit for the period 2,075 2,048 6,385 5,341 6,991 Less operating loss from Other operations 24 28 93 124 169 Less larger one-time items - - -300 - -
Operating profit from product segments 2,099 2,075 6,179 5,465 7,160 Amortization, depreciation and impairment of intangible, tangible and right-of-use assets 152 145 446 442 588 Less amortization, depreciation and impairment of intangible, tangible and right-of-use assets for Other operations -15 -16 -46 -50 -65
EBITDA from product segments 2,236 2,204 6,579 5,858 7,684 Sales from product segments 4,691 4,303 13,482 12,287 16,332 EBITDA margin from product segments, % 47.7 51.2 48.8 47.7 47.0
Larger one-time items MSEK Jul-Sep Jan-Sep Full year 2021 2020 2021 2020 2020
Settlement income - - 300 - -
Total larger one-time items in operating profit - - 300 - - Income tax expense on settlement income - - -62 - - Tax charge including interest related to an adverse ruling in a tax case in Sweden - -286 - -286 -286
Total larger one-time items in net profit - -286 238 -286 -286
Adjusted earnings per share Basic and diluted Jul-Sep Jan-Sep 12 months Full year
2021 Restated
2020 2021 Restated
2020 ended
Sep 30, 2021 2020
Profit for the period attributable to equity holders of the Parent, MSEK 1,539 1,222 4,760 3,643 6,004 4,888 Settlement income, net of tax, MSEK - - -238 - -238 - Tax charge including interest, MSEK - 286 - 286 - 286
Profit for the period attributable to equity holders of the Parent, excl. larger one-time items, MSEK 1,539 1,508 4,522 3,929 5,766 5,174 Weighted average number of shares
outstanding, thousands1) 1,560,548 1,604,436 1,572,116 1,614,618 1,576,789 1,608,665
Adjusted earnings per share, SEK1) 0.99 0.94 2.88 2.43 3.66 3.22
1) In May 2021, a share split (10:1) was made. Historical share data in this report has been restated in accordance with IAS 33.
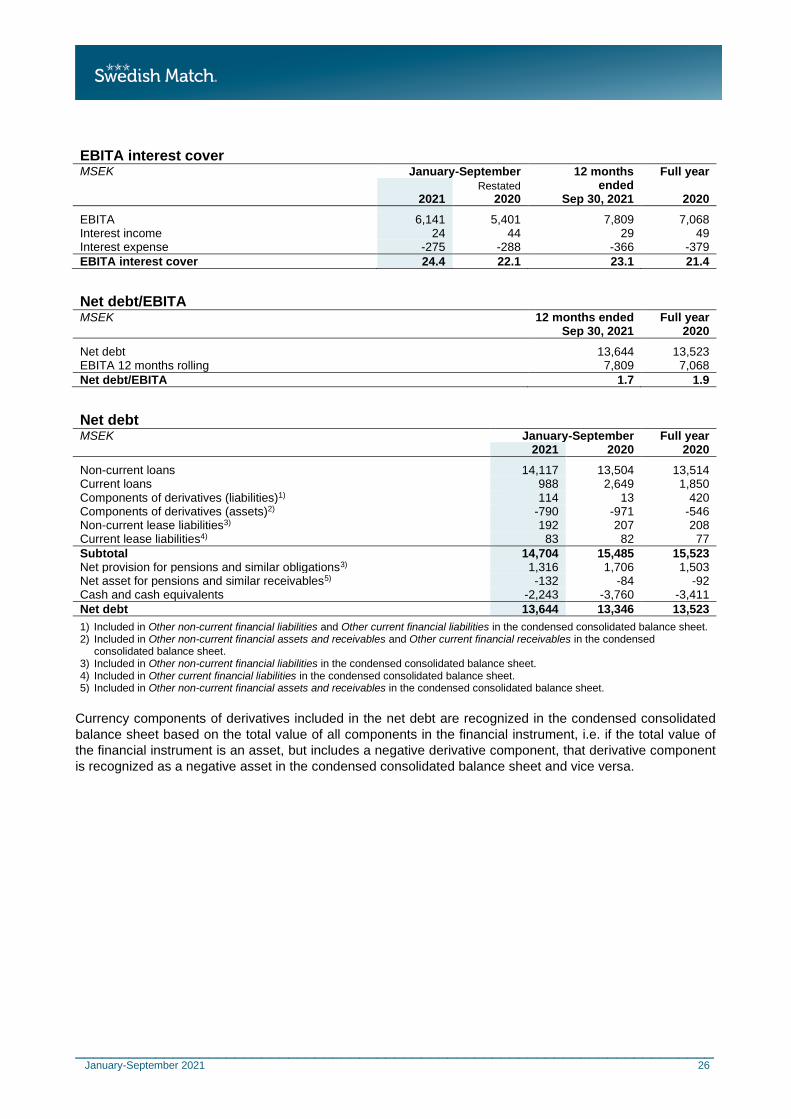
________________________________________________________________________ January-September 2021 26
EBITA interest cover MSEK January-September 12 months Full year
2021 Restated
2020 ended
Sep 30, 2021 2020
EBITA 6,141 5,401 7,809 7,068 Interest income 24 44 29 49 Interest expense -275 -288 -366 -379
EBITA interest cover 24.4 22.1 23.1 21.4
Net debt/EBITA MSEK 12 months ended Full year Sep 30, 2021 2020
Net debt 13,644 13,523 EBITA 12 months rolling 7,809 7,068
Net debt/EBITA 1.7 1.9
Net debt MSEK January-September Full year 2021 2020 2020
Non-current loans 14,117 13,504 13,514 Current loans 988 2,649 1,850 Components of derivatives (liabilities)1) 114 13 420 Components of derivatives (assets)2) -790 -971 -546 Non-current lease liabilities3) 192 207 208 Current lease liabilities4) 83 82 77
Subtotal 14,704 15,485 15,523 Net provision for pensions and similar obligations3) 1,316 1,706 1,503 Net asset for pensions and similar receivables5) -132 -84 -92 Cash and cash equivalents -2,243 -3,760 -3,411
Net debt 13,644 13,346 13,523
1) Included in Other non-current financial liabilities and Other current financial liabilities in the condensed consolidated balance sheet. 2) Included in Other non-current financial assets and receivables and Other current financial receivables in the condensed
consolidated balance sheet. 3) Included in Other non-current financial liabilities in the condensed consolidated balance sheet. 4) Included in Other current financial liabilities in the condensed consolidated balance sheet. 5) Included in Other non-current financial assets and receivables in the condensed consolidated balance sheet.
Currency components of derivatives included in the net debt are recognized in the condensed consolidated
balance sheet based on the total value of all components in the financial instrument, i.e. if the total value of
the financial instrument is an asset, but includes a negative derivative component, that derivative component
is recognized as a negative asset in the condensed consolidated balance sheet and vice versa.

________________________________________________________________________ January-September 2021 27
Quarterly data
Quarterly data for the third quarter of 2020 have been restated (see Note 1).
Consolidated income statement in summary MSEK Q3/21 Q2/21 Q1/21 Q4/20 Q3/20
Sales, including tobacco tax 5,675 5,403 5,383 5,099 5,389 Less tobacco tax -897 -898 -928 -962 -989
Sales 4,778 4,505 4,455 4,136 4,400 Cost of goods sold -1,612 -1,514 -1,469 -1,460 -1,409
Gross profit 3,166 2,990 2,986 2,677 2,990
Selling and administrative expenses -1,103 -1,037 -933 -1,031 -946 Share of net profit/loss in associated companies 12 3 2 4 4 Settlement income - - 300 - -
Operating profit 2,075 1,956 2,354 1,650 2,048
Finance income 6 7 11 13 7 Finance costs -94 -92 -100 -92 -112
Net finance cost -88 -85 -89 -80 -105
Profit before income tax 1,987 1,871 2,265 1,570 1,943 Income tax expense -447 -430 -485 -326 -721
Profit for the period 1,540 1,441 1,780 1,244 1,222
Attributable to: Equity holders of the Parent 1,539 1,441 1,779 1,244 1,222 Non-controlling interests 0 0 0 0 0
Profit for the period 1,540 1,441 1,780 1,244 1,222
Quarterly data by product segment
Quarterly data by product segment for the third quarter of 2020 have been restated (see Note 1).
Sales MSEK Q3/21 Q2/21 Q1/21 Q4/20 Q3/20
Smokefree 3,100 2,955 2,823 2,606 2,842 Cigars 1,237 1,138 1,249 1,152 1,184 Lights 354 321 305 288 277
Sales from product segments 4,691 4,414 4,376 4,045 4,303 Other operations 87 90 78 91 97
Sales 4,778 4,505 4,455 4,136 4,400
Operating profit MSEK Q3/21 Q2/21 Q1/21 Q4/20 Q3/20
Smokefree 1,558 1,428 1,465 1,168 1,519 Cigars 481 458 560 481 499 Lights 60 103 67 46 57
Operating profit from product segments 2,099 1,988 2,092 1,695 2,075
Other operations -24 -32 -37 -45 -28 Settlement income - - 300 - -
Operating profit 2,075 1,956 2,354 1,650 2,048
Operating margin by product segment
Percent Q3/21 Q2/21 Q1/21 Q4/20 Q3/20
Smokefree 50.3 48.3 51.9 44.8 53.5 Cigars 38.8 40.3 44.8 41.7 42.2 Lights 17.0 31.9 22.0 16.0 20.5 Operating margin from product segments 44.7 45.0 47.8 41.9 48.2
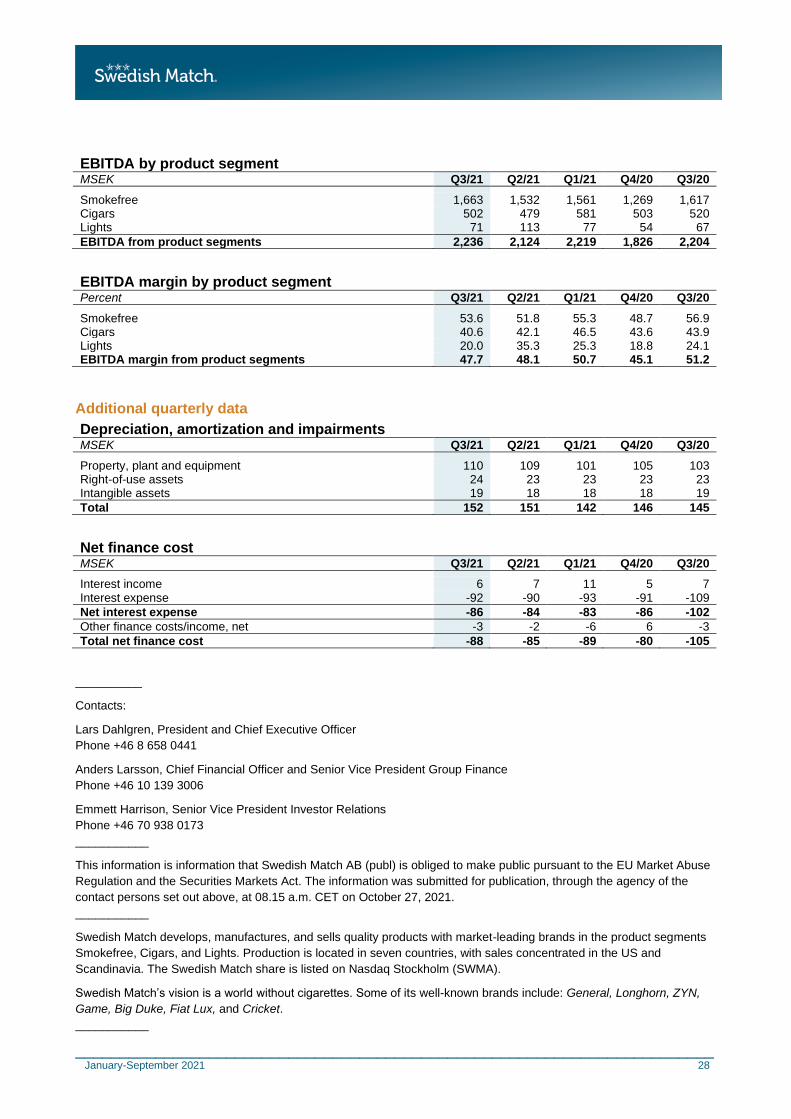
________________________________________________________________________ January-September 2021 28
EBITDA by product segment
MSEK Q3/21 Q2/21 Q1/21 Q4/20 Q3/20
Smokefree 1,663 1,532 1,561 1,269 1,617 Cigars 502 479 581 503 520 Lights 71 113 77 54 67
EBITDA from product segments 2,236 2,124 2,219 1,826 2,204
EBITDA margin by product segment Percent Q3/21 Q2/21 Q1/21 Q4/20 Q3/20
Smokefree 53.6 51.8 55.3 48.7 56.9 Cigars 40.6 42.1 46.5 43.6 43.9 Lights 20.0 35.3 25.3 18.8 24.1 EBITDA margin from product segments 47.7 48.1 50.7 45.1 51.2
Additional quarterly data
Depreciation, amortization and impairments MSEK Q3/21 Q2/21 Q1/21 Q4/20 Q3/20
Property, plant and equipment 110 109 101 105 103 Right-of-use assets 24 23 23 23 23 Intangible assets 19 18 18 18 19
Total 152 151 142 146 145
Net finance cost MSEK Q3/21 Q2/21 Q1/21 Q4/20 Q3/20
Interest income 6 7 11 5 7 Interest expense -92 -90 -93 -91 -109
Net interest expense -86 -84 -83 -86 -102
Other finance costs/income, net -3 -2 -6 6 -3
Total net finance cost -88 -85 -89 -80 -105
__________
Contacts:
Lars Dahlgren, President and Chief Executive Officer
Phone +46 8 658 0441
Anders Larsson, Chief Financial Officer and Senior Vice President Group Finance
Phone +46 10 139 3006
Emmett Harrison, Senior Vice President Investor Relations
Phone +46 70 938 0173
___________
This information is information that Swedish Match AB (publ) is obliged to make public pursuant to the EU Market Abuse
Regulation and the Securities Markets Act. The information was submitted for publication, through the agency of the
contact persons set out above, at 08.15 a.m. CET on October 27, 2021.
___________
Swedish Match develops, manufactures, and sells quality products with market-leading brands in the product segments
Smokefree, Cigars, and Lights. Production is located in seven countries, with sales concentrated in the US and
Scandinavia. The Swedish Match share is listed on Nasdaq Stockholm (SWMA).
Swedish Match’s vision is a world without cigarettes. Some of its well-known brands include: General, Longhorn, ZYN,
Game, Big Duke, Fiat Lux, and Cricket.
___________

________________________________________________________________________ January-September 2021 29
Swedish Match AB (publ), SE-118 85 Stockholm, Sweden
Visiting address: Sveavägen 44, 8th Floor. Telephone: +46 10 13 93 000
Corporate Identity Number: 556015-0756
swedishmatch.com