q3 and 9m 2018 revenues - vivendi.com · pour insérer la notice, cliquez sur le bouton « formes...
TRANSCRIPT
Pour insérer la notice, cliquez sur le bouton « Formes » puis double-cliquez sur la version EN ou FR
dans le dossier 02. Mentions & Tags
Nov. 15,
2018
Q3 AND 9M 2018 REVENUES
IMPORTANT NOTICE:
Unaudited and prepared under IFRS
Investors are strongly urged to read the important disclaimer at the end of this presentation
SUMMARY
2
Q3 and 9M 2018 revenues - Nov. 15, 2018
Q3 2018 Key Highlights
Q3 and 9M Consolidated Revenues
Business Unit Performances
Conclusion
Appendices
1
2
3
4
5
3
Q3 2018 Key Highlights

Q3 HIGHLIGHTS (1/2)
Very solid performances of our three main businesses in Q3 2018
▪ Group revenues are up 5.6%* (9M: +4.6%*)
Update on the progress of the sale of part of Universal Music Group’s share capital
▪ The bank selection process is underway:
▪ The Management Board has shortlisted fifteen banks that could help Vivendi identify potential
strategic partners for UMG
▪ The end goal is to select five to seven banks and set the terms of engagement and fees before the
end of fall
▪ UMG’s 2018 financial results, which will be released on February 14, 2019, will serve as a basis for
the discussions with potential partners
▪ Proceeds may be used for a significant share repurchase program through a tender offer and
for potential acquisitions
1
Q3 and 9M 2018 revenues - Nov. 15, 2018
4
2
* At constant currency and perimeter. See details on page 7
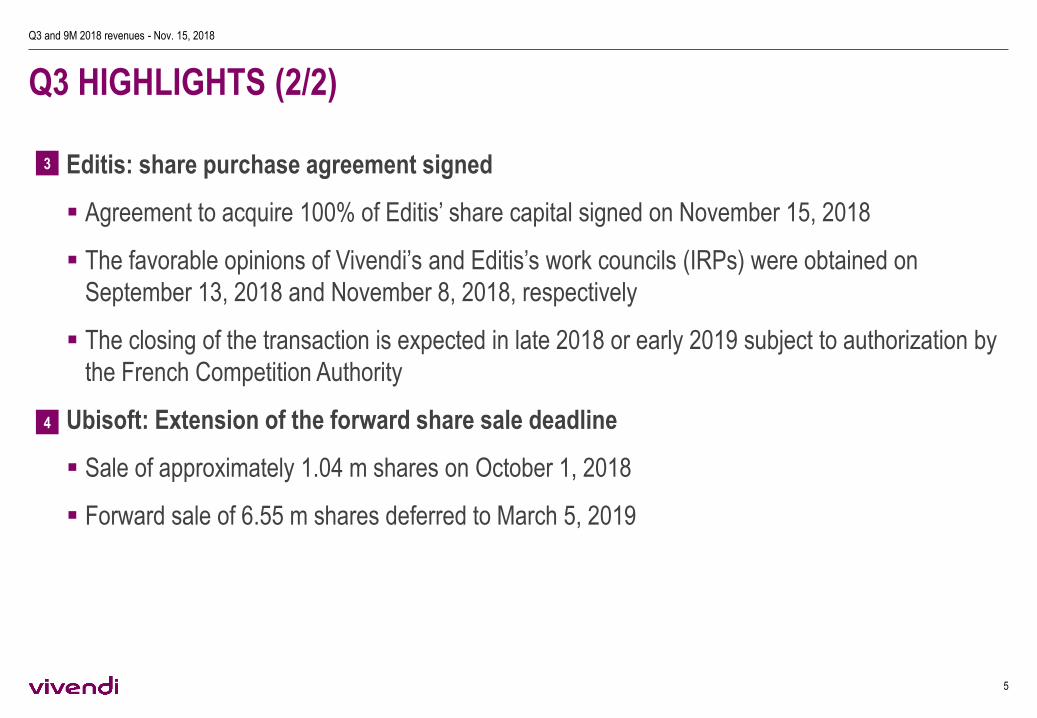
Q3 HIGHLIGHTS (2/2)
Editis: share purchase agreement signed
▪ Agreement to acquire 100% of Editis’ share capital signed on November 15, 2018
▪ The favorable opinions of Vivendi’s and Editis’s work councils (IRPs) were obtained on
September 13, 2018 and November 8, 2018, respectively
▪ The closing of the transaction is expected in late 2018 or early 2019 subject to authorization by
the French Competition Authority
Ubisoft: Extension of the forward share sale deadline
▪ Sale of approximately 1.04 m shares on October 1, 2018
▪ Forward sale of 6.55 m shares deferred to March 5, 2019
3
Q3 and 9M 2018 revenues - Nov. 15, 2018
5
4
6
Q3 and 9M Consolidated Revenues
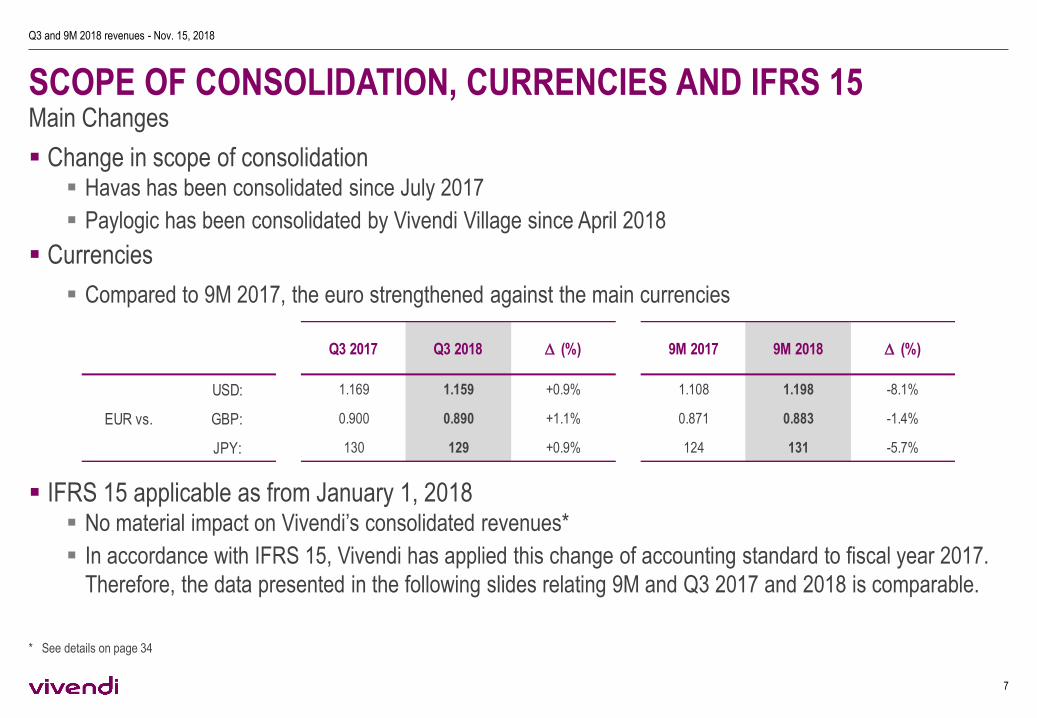
SCOPE OF CONSOLIDATION, CURRENCIES AND IFRS 15
▪ Change in scope of consolidation▪ Havas has been consolidated since July 2017
▪ Paylogic has been consolidated by Vivendi Village since April 2018
▪ Currencies
▪ Compared to 9M 2017, the euro strengthened against the main currencies
▪ IFRS 15 applicable as from January 1, 2018▪ No material impact on Vivendi’s consolidated revenues*
▪ In accordance with IFRS 15, Vivendi has applied this change of accounting standard to fiscal year 2017.
Therefore, the data presented in the following slides relating 9M and Q3 2017 and 2018 is comparable.
Main Changes
* See details on page 34
Q3 and 9M 2018 revenues - Nov. 15, 2018
7
Q3 2017 Q3 2018 D (%) 9M 2017 9M 2018 D (%)
USD: 1.169 1.159 +0.9% 1.108 1.198 -8.1%
EUR vs. GBP: 0.900 0.890 +1.1% 0.871 0.883 -1.4%
JPY: 130 129 +0.9% 124 131 -5.7%
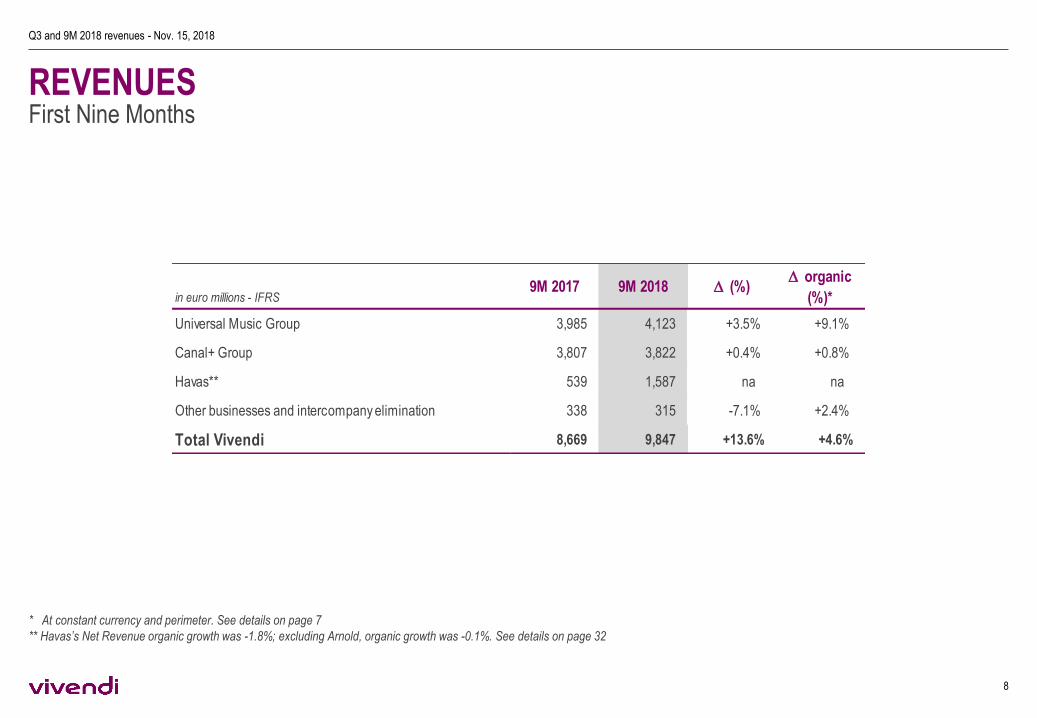
REVENUESFirst Nine Months
* At constant currency and perimeter. See details on page 7
** Havas’s Net Revenue organic growth was -1.8%; excluding Arnold, organic growth was -0.1%. See details on page 32
Q3 and 9M 2018 revenues - Nov. 15, 2018
8
in euro millions - IFRS9M 2017 9M 2018 D (%)
D organic
(%)*
Universal Music Group 3,985 4,123 +3.5% +9.1%
Canal+ Group 3,807 3,822 +0.4% +0.8%
Havas** 539 1,587 na na
Other businesses and intercompany elimination 338 315 -7.1% +2.4%
Total Vivendi 8,669 9,847 +13.6% +4.6%

SEQUENTIAL CHANGES IN MAIN BUSINESSES
* At constant currency and perimeter. See details on page 7** Net revenues correspond to revenues less pass-through costs rebilled to customers.
Including Arnold, Havas organic net revenue growth was -2.9% in H1 2018, +0.3% in Q3 2018, and -1.8% in 9M 2018
Q3 and 9M 2018 revenues - Nov. 15, 2018
9
Organic growth* (in %)H1 2018 Q3 2018 9M 2018
Universal Music Group +6.8% +13.5% +9.1%
Canal+ Group +1.3% -0.2% +0.8%
Havas - Net Revenues (excluding Arnold)** -1.4% +2.5% -0.1%
Other businesses and intercompany elimination -0.2% +8.7% +2.4%
Total Vivendi +4.0% +5.6% +4.6%

10
Business Unit Performances

11
Universal Music Group
Streaming and subscriptions
56%
Other digital sales**
11%
Physical sales17%
License and Other 16%
12
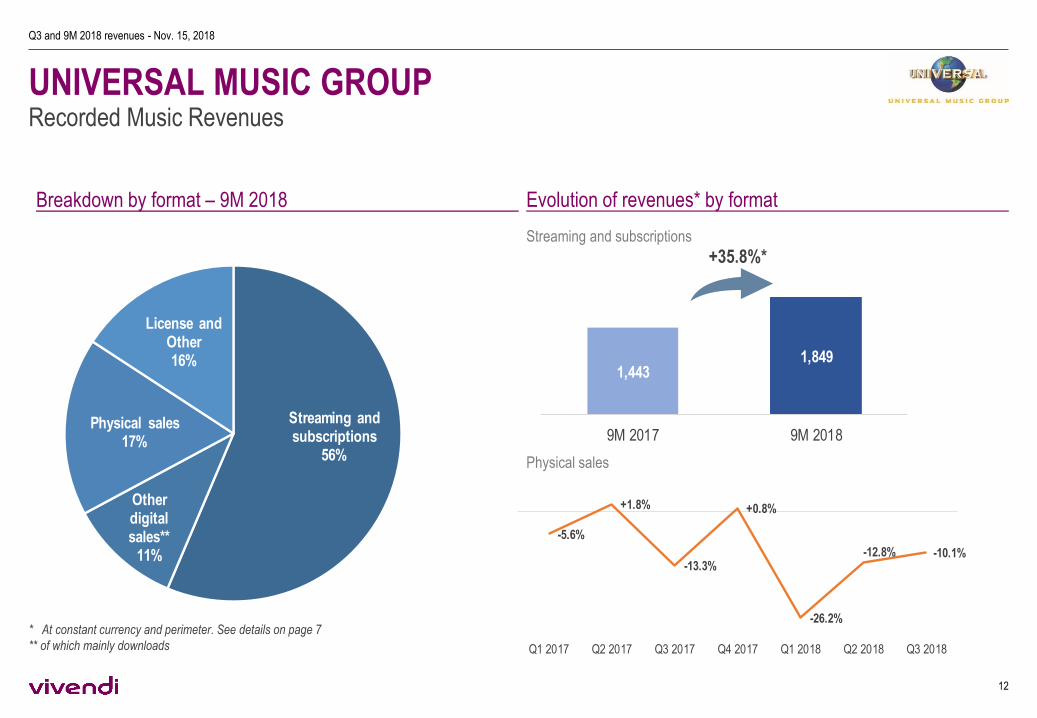
UNIVERSAL MUSIC GROUPRecorded Music Revenues
Q3 and 9M 2018 revenues - Nov. 15, 2018
* At constant currency and perimeter. See details on page 7
** of which mainly downloads
Breakdown by format – 9M 2018 Evolution of revenues* by format
Streaming and subscriptions
Physical sales
1,4431,849
9M 2017 9M 2018
+35.8%*
-5.6%
+1.8%
-13.3%
+0.8%
-26.2%
-12.8% -10.1%
Q1 2017 Q2 2017 Q3 2017 Q4 2017 Q1 2018 Q2 2018 Q3 2018

UNIVERSAL MUSIC GROUPFirst Nine Months Revenues
* At constant currency and perimeter. See details on page 7
Q3 and 9M 2018 revenues - Nov. 15, 2018
13
in euro millions - IFRS9M 2017 9M 2018
D organic
(%)*
Recorded music 3,143 3,282 +10.2%
Streaming and subscriptions 1,443 1,849 +35.8%
Other digital sales (mainly downloads) 500 353 -24.5%
Physical sales 700 563 -16.3%
License and Other 500 517 +8.2%
Music Publishing 642 675 +10.6%
Merchandising and Other 216 180 -13.4%
Intercompany elimination (16) (14)
Revenues - Universal Music Group 3,985 4,123 +9.1%

UNIVERSAL MUSIC GROUPOrganic revenue growth* per quarter
* At constant currency and perimeter. See details on page 7
Q3 and 9M 2018 revenues - Nov. 15, 2018
14
in %Q1 2018 Q2 2018 Q3 2018
Recorded music +5.9% +8.7% +16.2%
Streaming and subscriptions +31.5% +37.0% +38.6%
Other digital sales (mainly downloads) -12.0% -36.7% -21.4%
Physical sales -26.2% -12.8% -10.1%
License and Other -5.7% +11.9% +19.1%
Music Publishing +3.9% +19.8% +9.8%
Merchandising and Other -18.7% -13.7% -9.7%
Revenues - Universal Music Group +4.5% +9.0% +13.5%

15
Canal + Group
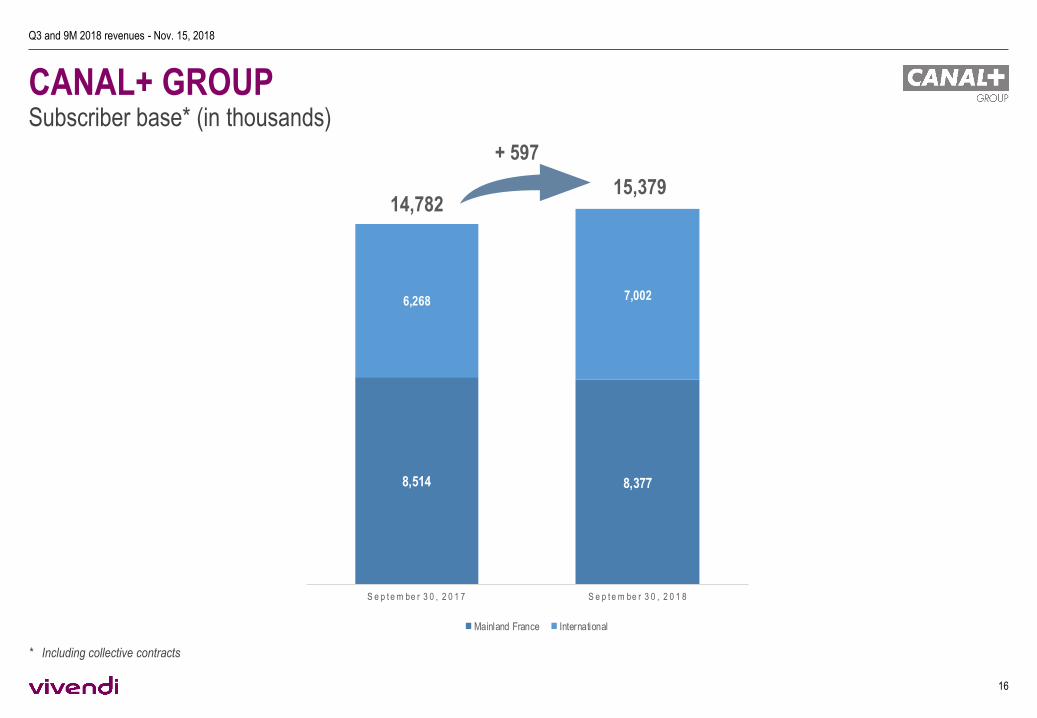
CANAL+ GROUPSubscriber base* (in thousands)
* Including collective contracts
Q3 and 9M 2018 revenues - Nov. 15, 2018
16
8,514 8,377
6,268 7,002
S e p t e m be r 3 0 , 2 0 1 7 S e p t e m be r 3 0 , 2 0 1 8
Mainland France International
14,78215,379
+ 597
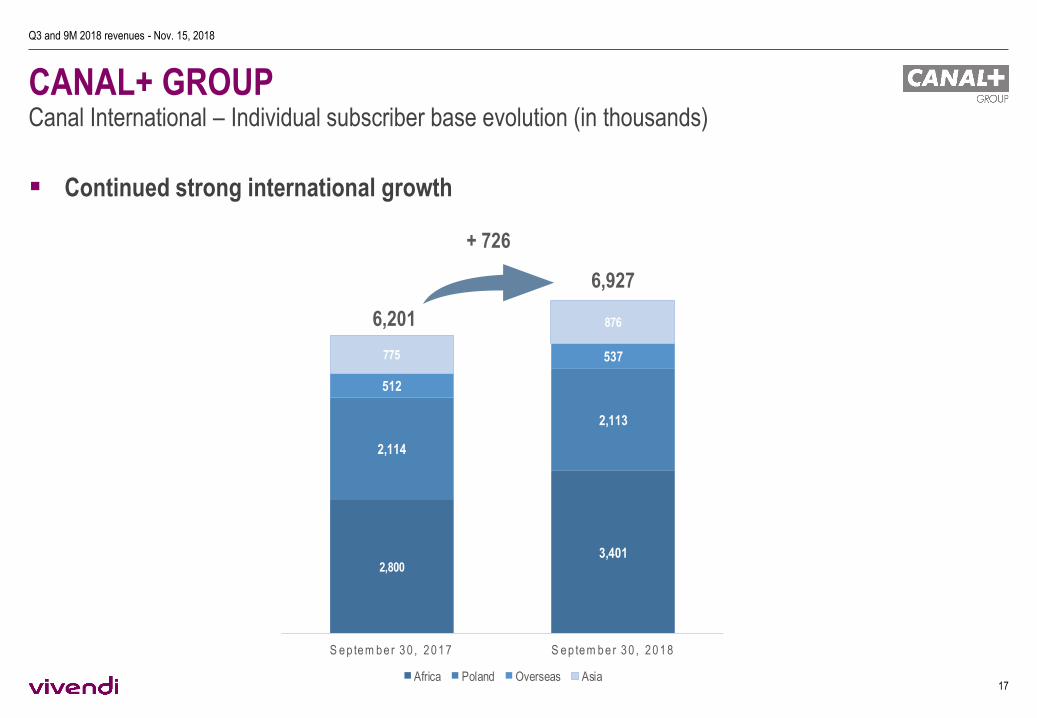
CANAL+ GROUPCanal International – Individual subscriber base evolution (in thousands)
▪ Continued strong international growth
Q3 and 9M 2018 revenues - Nov. 15, 2018
17
2,8003,401
2,114
2,113
512
537775
876
S ep tem be r 30 , 2017 S ep tem be r 30 , 2018
Africa Poland Overseas Asia
6,927
6,201
+ 726

CANAL+ GROUPCanal+ in mainland France – Individual subscriber base evolution (in thousands)
Q3 and 9M 2018 revenues - Nov. 15, 2018
18
7,807 7,708
201 158
September 30, 2017 September 30, 2018
Mainland France excluding Canalplay Canalplay
8,008 7,866
-99k
o/w +227k on Canal+ channel

CANAL+ GROUPFirst Nine Months Revenues
* At constant currency and perimeter. See details on page 7
Q3 and 9M 2018 revenues - Nov. 15, 2018
19
in euro millions - IFRS9M 2017 9M 2018 D (%)
D organic
(%)*
TV mainland France 2,440 2,358 -3.3% -3.3%
TV International 1,105 1,177 +6.5% +7.8%
Studiocanal 262 287 +9.5% +10.3%
Revenues - Canal+ Group 3,807 3,822 +0.4% +0.8%

20
Havas

HAVASNet Revenues excluding Arnold
▪ Significant improvement in organic growth* during Q3 2018
* Net Revenues correspond to revenues less pass-through costs rebilled to customers. At constant currency and perimeter, see details on page 7, and excluding Arnold** Including Arnold, Havas organic Net Revenue growth amounted to -2.9% in H1 2018 and, +0.3% in Q3 2018 (see details on page 31)*** Including Arnold, North America organic Net Revenue growth amounted to -0,6% in H1 2018, and +0.5% in Q3 2018 (see details on page 31)
Q3 and 9M 2018 revenues - Nov. 15, 2018
21
in % H1 2018 Q3 2018
Net Revenues - Havas** -1.4% +2.5%
Europe -5.7% +0.6%
o/w France -10.0% -0.6%
o/w UK -2.3% +10.5%
North America*** +4.5% +7.3%
APAC and Africa +1.2% +0.6%
Latin America +3.9% -4.4%
HAVASKey wins in Q3 2018
Q3 and 9M 2018 revenues - Nov. 15, 2018
22
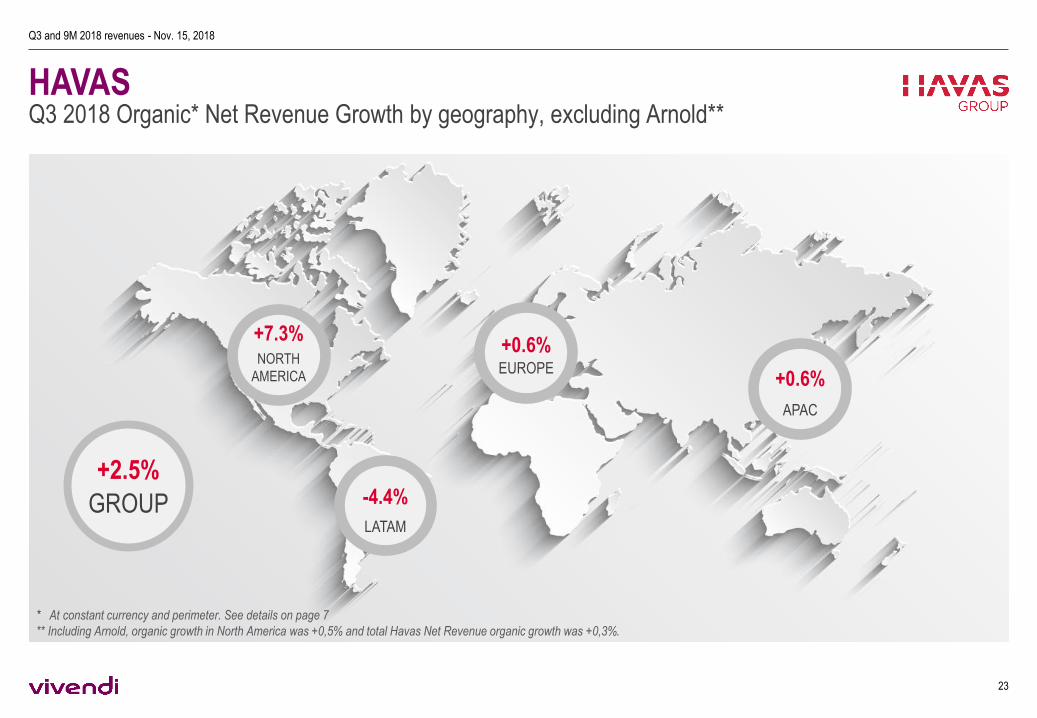
HAVASQ3 2018 Organic* Net Revenue Growth by geography, excluding Arnold**
+7.3%NORTH
AMERICA
-4.4%
LATAM
+0.6%EUROPE
+0.6%
APAC
+2.5%
GROUP
Q3 and 9M 2018 revenues - Nov. 15, 2018
23
* At constant currency and perimeter. See details on page 7
** Including Arnold, organic growth in North America was +0,5% and total Havas Net Revenue organic growth was +0,3%.
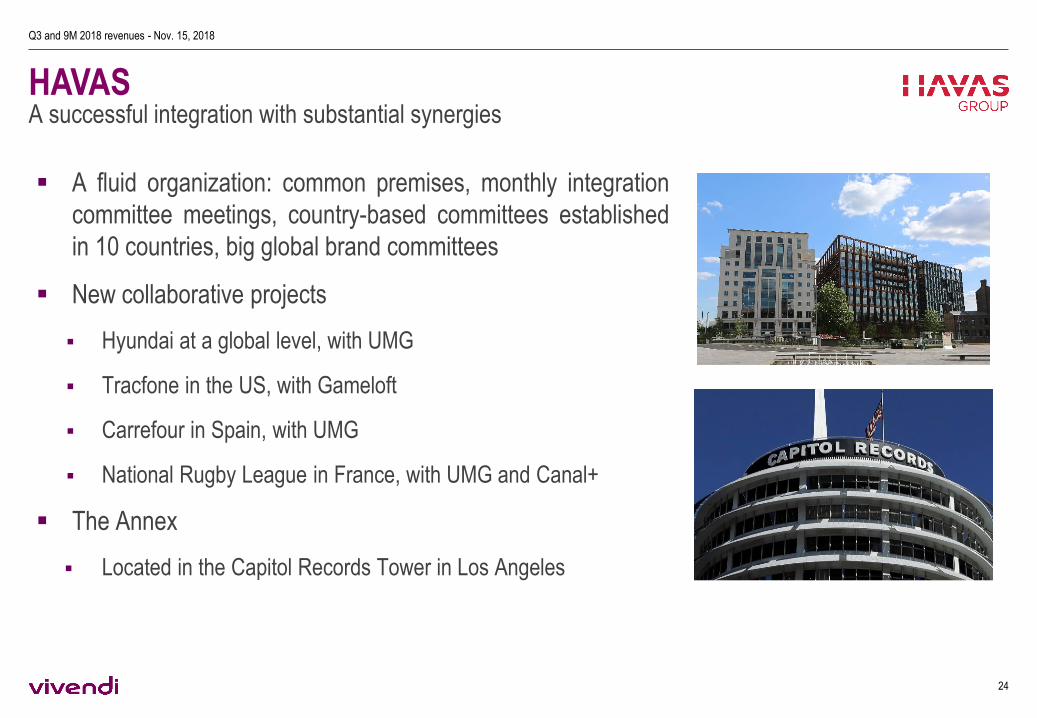
HAVASA successful integration with substantial synergies
▪ A fluid organization: common premises, monthly integration
committee meetings, country-based committees established
in 10 countries, big global brand committees
▪ New collaborative projects
▪ Hyundai at a global level, with UMG
▪ Tracfone in the US, with Gameloft
▪ Carrefour in Spain, with UMG
▪ National Rugby League in France, with UMG and Canal+
▪ The Annex
▪ Located in the Capitol Records Tower in Los Angeles
Q3 and 9M 2018 revenues - Nov. 15, 2018
24

25
Conclusion
CONCLUSION
26
▪Very solid performances achieved in the first nine months of 2018
▪For FY 2018, Canal+ Group is close to achieving the objectives set. Television
activities will achieve their goals. StudioCanal may end the year slightly behind
despite the success of “Le Grand Bain”
▪As previously announced, Havas expects better organic net revenue growth for
the second half of 2018, thanks to major account wins in the first half of the year
Q3 and 9M 2018 revenues - Nov. 15, 2018

27
Appendices

REVENUESThird Quarter
* At constant currency and perimeter. See details on page 7
** Havas’s Net Revenue growth was +0,3%; excluding Arnold, it was +2,5%. See details on page 31
Q3 and 9M 2018 revenues - Nov. 15, 2018
28
in euro millions - IFRSQ3 2017 Q3 2018 D (%)
D organic
(%)*
Universal Music Group 1,319 1,495 +13.3% +13.5%
Canal+ Group 1,252 1,247 -0.5% -0.2%
Havas** 539 535 -0.6% na
Other businesses and intercompany elimination 97 107 +10.3% +8.7%
Total Vivendi 3,207 3,384 +5.5% +5.6%

UNIVERSAL MUSIC GROUPKey Performance Indicators
* At constant currency and perimeter. See details on page 7** Based on revenues*** Selected release schedule, subject to change**** Albums already released as of November 15, 2018
Q4 2018 RELEASES***
Q3 and 9M 2018 revenues - Nov. 15, 2018
29
9M 2017 9M 2018
Kendrick Lamar Drake
Drake Post Malone
The Weeknd Kendrick Lamar
Luis Fonsi XXXTENTACION
Moana OST Migos
Recorded music: Best sellers**
in euro millions - IFRSQ3 2017 Q3 2018
D organic
(%)*
Recorded music 1,002 1,161 +16.2%
Streaming and subscriptions 481 662 +38.6%
Other digital sales (mainly downloads) 147 116 -21.4%
Physical sales 216 194 -10.1%
License and Other 158 189 +19.1%
Music Publishing 242 266 +9.8%
Merchandising and Other 81 73 -9.7%
Intercompany elimination (6) (5)
Revenues - Universal Music Group 1,319 1,495 +13.5%
in euro millions9M 2017 9M 2018
D organic
(%)*
North America 1,493 1,551 +11.8%
Europe 997 1,040 +5.7%
Asia 403 415 +8.3%
Latin America 111 111 +16.2%
Rest of the world 139 165 +25.4%
Recorded music revenues 3,143 3,282 +10.2%
A Star Is Born OST****
Gregory Porter
Herbert Gronemeyer****
Imagine Dragons****
Jonas Blue****
Kris Wu****
Mary Poppins Returns OST
Masaharu Fukayama
Michel Polnareff
Mumford & Sons
The 1975
The Beatles – White Album
(remastered)****

CANAL+ GROUPKey Performance Indicators
* Data excluding contracts with the freedom to cancel (Liberté D’Annuler or “LDA”)
** Churn per individual retail subscriber with commitement over a 12-month period, excluding wholesale customers and customers benefitting from a LDA option
Q3 and 9M 2018 revenues - Nov. 15, 2018
30
in thousands
September
30, 2017
September
30, 2018D
Individual subscribers 14,209 14,793 +584
Mainland France 4,990 4,757 -233
Wholesale customers 3,018 3,109 +91
International 6,201 6,927 +726
Collective contracts 573 586 +13
Total 14,782 15,379 +597
Evolution of the subscriber base Continuous churn improvement */**
17.4%15.8%
14.2% 13.3% 13.4%
September 30,2017
December 31,2017
March 31, 2018 June 30, 2018 September 30,2018

HAVASNet Revenues Q3 – Organic growth by geographic region
*At constant currency and perimeter. See details on page 7
▪ Q3 2018 growth:
▪ Forex: -1.2%
▪ Acquisitions: +1.0 %
▪ Organic growth: +0.3%
Q3 and 9M 2018 revenues - Nov. 15, 2018
31
in euro millions
Q3 2017 Q3 2018D organic
(%)*
D organic
exclud. Arnold
(%)
Revenues 539 535 na na
Net Revenues - Havas 525 525 +0.3% +2.5%
Europe 256 260 +0.6% +0.6%
o/w France 99 100 -0.6% -0.6%
o/w UK 56 65 +10.5% +10.5%
North America 185 188 +0.5% +7.3%
APAC 48 47 +0.6% +0.6%
Latin America 36 30 -4.4% -4.4%
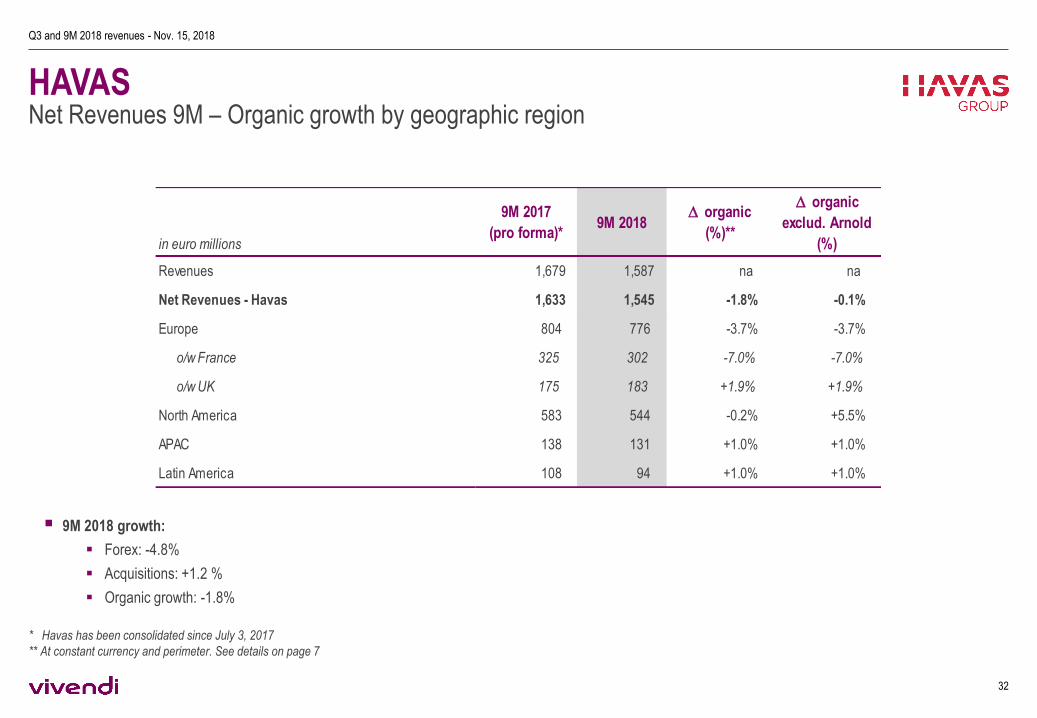
HAVASNet Revenues 9M – Organic growth by geographic region
* Havas has been consolidated since July 3, 2017
** At constant currency and perimeter. See details on page 7
▪ 9M 2018 growth:
▪ Forex: -4.8%
▪ Acquisitions: +1.2 %
▪ Organic growth: -1.8%
Q3 and 9M 2018 revenues - Nov. 15, 2018
32
in euro millions
9M 2017
(pro forma)*9M 2018
D organic
(%)**
D organic
exclud. Arnold
(%)
Revenues 1,679 1,587 na na
Net Revenues - Havas 1,633 1,545 -1.8% -0.1%
Europe 804 776 -3.7% -3.7%
o/w France 325 302 -7.0% -7.0%
o/w UK 175 183 +1.9% +1.9%
North America 583 544 -0.2% +5.5%
APAC 138 131 +1.0% +1.0%
Latin America 108 94 +1.0% +1.0%

OTHER BUSINESSESRevenues
* At constant currency and perimeter. See details on page 7
Q3 and 9M 2018 revenues - Nov. 15, 2018
33
in euro millions - IFRS
Q3 2017 Q3 2018D organic
(%)*
Gameloft 77 75 -3.3%
Vivendi Village 25 36 +39.5%
New Initiatives 11 15 +39.6%
Intercompany Elimination (16) (19)
Revenues - Other businesses 97 107 +8.7%
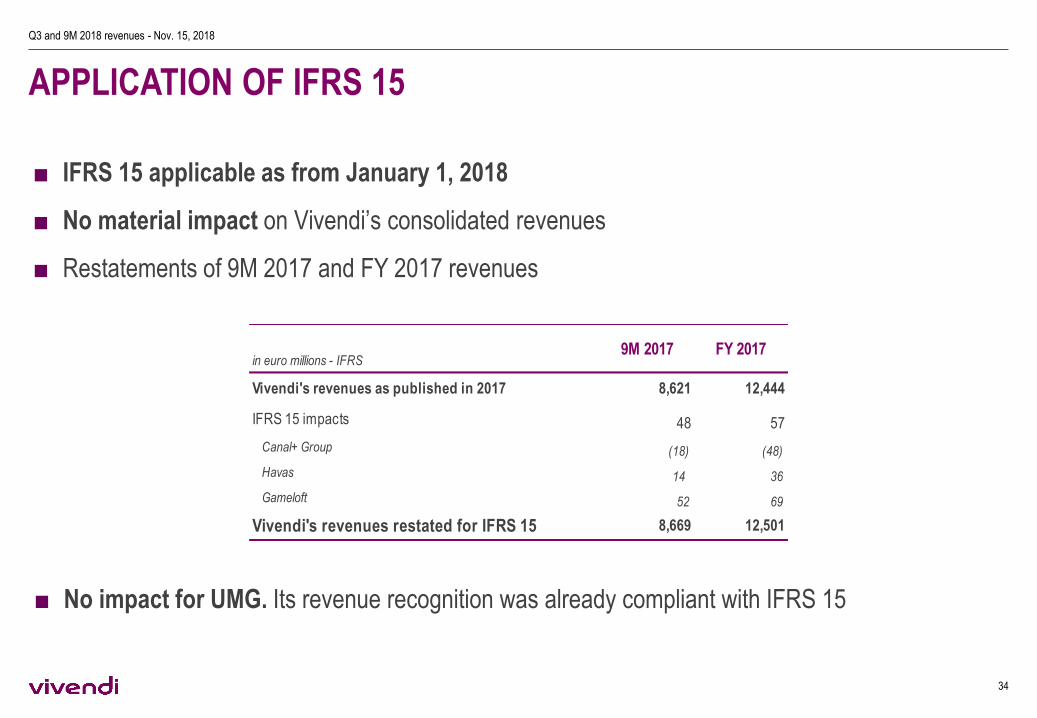
APPLICATION OF IFRS 15
■ IFRS 15 applicable as from January 1, 2018
■ No material impact on Vivendi’s consolidated revenues
■ Restatements of 9M 2017 and FY 2017 revenues
■ No impact for UMG. Its revenue recognition was already compliant with IFRS 15
Q3 and 9M 2018 revenues - Nov. 15, 2018
34
in euro millions - IFRS9M 2017 FY 2017
Vivendi's revenues as published in 2017 8,621 12,444
IFRS 15 impacts 48 57
Canal+ Group (18) (48)
Havas 14 36
Gameloft 52 69
Vivendi's revenues restated for IFRS 15 8,669 12,501

35
IMPORTANT LEGAL DISCLAIMER / CONTACTSCautionary Note Regarding Forward-Looking Statements
This presentation contains forward-looking statements with respect to Vivendi's financial condition, results of operations, business, strategy, plans, and outlook of
Vivendi, including the impact of certain transactions and the payment of dividends and distributions as well as share repurchases. Although Vivendi believes that such
forward-looking statements are based on reasonable assumptions, such statements are not guarantees of future performance. Actual results may differ materially from
the forward-looking statements as a result of a number of risks and uncertainties, many of which are outside Vivendi’s control, including, but not limited to, the risks
related to antitrust and other regulatory approvals as well as any other approvals which may be required in connection with certain transactions and the risks described in
the documents of the group filed by Vivendi with the Autorité des Marchés Financiers (French securities regulator) and its press releases, if any, which are also available
in English on Vivendi's website (www.vivendi.com). Investors and security holders may obtain a free copy of documents filed by Vivendi with the Autorité des Marchés
Financiers at www.amf-france.org, or directly from Vivendi. Accordingly, readers of this presentation are cautioned against relying on these forward-looking statements.
These forward-looking statements are made as of the date of this presentation. Vivendi disclaims any intention or obligation to provide, update or revise any forward-
looking statements, whether as a result of new information, future events or otherwise.
Unsponsored ADRs
Vivendi does not sponsor an American Depositary Receipt (ADR) facility in respect of its shares. Any ADR facility currently in existence is “unsponsored” and has no ties
whatsoever to Vivendi. Vivendi disclaims any liability in respect of any such facility.
Investor Relations Team
Xavier Le Roy +33.1.71.71.18.77 [email protected]
Nathalie Pellet +33.1.71.71.11.24 [email protected]
Delphine Maillet +33.1.71.71.17.20 [email protected]
For all financial or business information, please refer to our Investor Relations website at: http://www.vivendi.com
Q3 and 9M 2018 revenues - Nov. 15, 2018