q3 financial results call
TRANSCRIPT

© 2021 Amplitude Inc. All Rights Reserved.
Q3 Financial Results Call
2:00 pm PSTNovember 9, 2021

© 2021 Amplitude Inc. All rights reserved.
Disclaimer
This presentation and the accompanying oral presentation have been prepared by Amplitude, Inc. (the “Company”).
Certain statements in this presentation and the accompanying oral commentary are forward-looking statements. These statements relate to the Company’s financial outlook for the fourth quarter of 2021 and full year 2021, as well as its business strategy and plans and objectives for future operations, and are subject to a number of known and unknown risks, uncertainties and other factors that may cause the actual results, levels of activity, performance or achievements of the Company or its industry to be materially different from those expressed or implied by any forward-looking statements. In some cases, forward-looking statements can be identified by words such as “may,” “should,” “could,” “predict,” “potential,” “believe,” “expect,” “continue,” “will,” “anticipate,” “seek,” “estimate,” “intend,” “plan,” “projection,” “would,” and “outlook,” or the negative version of those words or phrases or other comparable words or phrases of a future or forward-looking nature. These forward-looking statements are not statements of historical fact, and are based on current expectations, estimates, and projections about the Company's industry as well as certain assumptions made by management, many of which, by their nature, are inherently uncertain and beyond the Company's control. While the Company believes that these expectations, assumptions, estimates and projections are reasonable, such forward-looking statements are only predictions and involve known and unknown risk and uncertainties, and so you are cautioned not to give undue weight to such forward-looking statements. Moreover, the Company operates in a competitive, new and rapidly changing market, and new risks may emerge from time to time. It is not possible for the Company to predict all risks, nor can it assess the impact of all factors on its business or the extent to which any factor, or combination of factors, may cause actual results or outcomes to differ materially from those contained in any forward-looking statements it may make. The forward-looking statements in this presentation are made only as of the date hereof. Except to the extent required by law, the Company assumes no obligation and does not intend to update any of these forward-looking statements after the date of this presentation or to conform these statements to actual results or revised expectations.
This presentation also contains estimates and other statistical data made by independent parties and by the Company relating to market size and growth and other data about the Company’s industry. These estimates and other statistical data involve a number of assumptions and limitations, and you are cautioned not to give undue weight to such estimates and other statistical data. The Company has not independently verified the statistical and other industry data generated by independent parties and contained in this presentation and, accordingly, it cannot guarantee their accuracy or completeness. In addition, expectations, assumptions, estimates and projections of the Company’s future performance and the future performance of the markets in which the Company operates are necessarily subject to a high degree of uncertainty and risk.
This presentation also includes certain non-GAAP financial measures (including on a forward-looking basis) such as Free Cash Flow, Free Cash Flow Margin, non-GAAP Gross Margin, non-GAAP Loss From Operations, non-GAAP Sales and Marketing Expenses, non-GAAP Research and Development Expenses, non-GAAP General and Administrative Expenses, and non-GAAP Net Loss Per Share. These non-GAAP financial measures are in addition to, and not as a substitute for or superior to measures of financial performance prepared in accordance with GAAP. There are a number of limitations related to the use of these non-GAAP financial measures versus their nearest GAAP equivalents. For example, other companies may calculate non-GAAP financial measures differently or may use other measures to evaluate their performance, all of which could reduce the usefulness of the Company’s non-GAAP financial measures as tools for comparison. The Company has provided a reconciliation of those historic measures to the most directly comparable GAAP measures, which is available in the appendix to this presentation.
All third-party brand names and logos appearing in this presentation are trademarks or registered trademarks of their respective holders. Any such appearance does not necessarily imply any endorsement of the Company.
2

Spenser Skates
CEO and Co-Founder

© 2021 Amplitude Inc. All rights reserved. 4
Q3 Financial Results Highlights
$45.5M Revenue increased by
72% Y/Y
121%Dollar-based net retention
rate (across paying customers)
1,417Customers increased by
54% Y/Y

© 2021 Amplitude Inc. All Rights Reserved.
Great Products are Built with Amplitude
5
Understand customer
behavior in a new way
Instacart informs product
strategy to help make online
shopping effortless.
Measure and optimize
the value of your business
Intuit analyzes upticks and drop-offs in
product usage and customer retention
in minutes.
Predict which actions
lead to business outcomes
Walmart predicts when product growth
spikes will happen and how key events
play into long-term retention to plan
retention strategy and timing.
Walmart
Adapt each experience
to maximize impact
BEES, an e-commerce and SaaS
company created by Anhesuer-Busch
Inbev, prompts customers with
recommended orders based on
purchase history and market insight.

© 2021 Amplitude Inc. All rights reserved. 6
Amplitude Powers Product Led Growth
Sales Marketing Product

© 2021 Amplitude Inc. All rights reserved.
Amplitude Behavioral Graph
Data Management
Digital Optimization System
7
DIGITAL CHANNELS | DIGITAL PRODUCTS | DIGITAL DATA WAREHOUSES
Amplitude
Analytics
Amplitude
Recommend
Amplitude
Experiment

© 2021 Amplitude Inc. All rights reserved.
Amplitude Digital Optimization System Powers Building Better Products
Purpose builtdatabase
ActionableInsights
ContinuousOptimization
#1 Ranked Product Analytics Solution for the 5th Time (G2.com)
8

© 2021 Amplitude Inc. All rights reserved.
New Snowflake Partnership + Product Integration
+
© 2021 Amplitude Inc. All rights reserved. 10
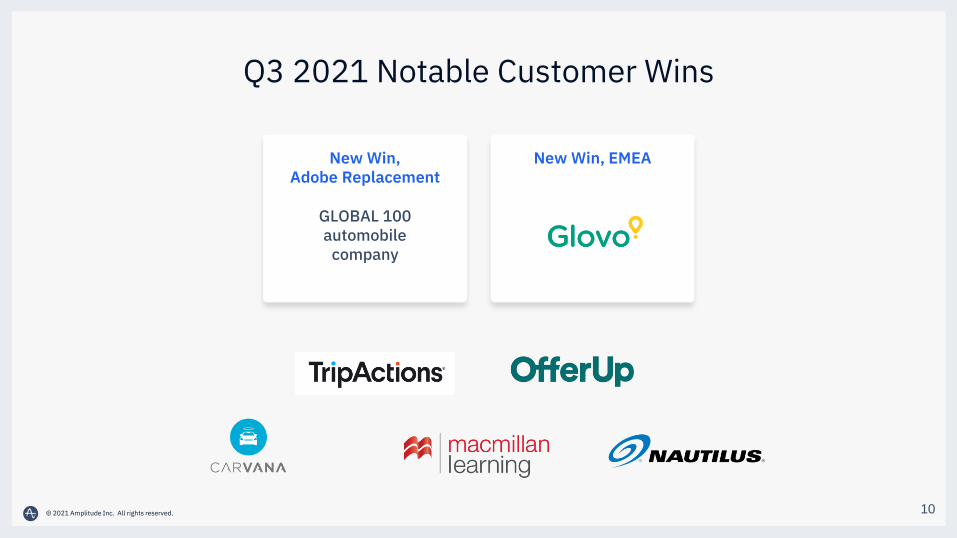
Q3 2021 Notable Customer Wins
New Win, Adobe Replacement
GLOBAL 100automobile
company
New Win, EMEA

© 2021 Amplitude Inc. All rights reserved. 11
Q3 2021 Customer Highlights
Expansion + Experiment
Expansion + Recommend
Volume-based Upsell

© 2021 Amplitude Inc. All rights reserved.
Amplitude Launches New
Data Centre in Germany to
Support Customer Growth in EU
Q3 Amplitude News
Inaugural Product
Report Launch

Hoang Vuong
CFO

© 2021 Amplitude Inc. All rights reserved.
Strong Revenue and Customer Metrics
14
Q3 2021 Result
Revenue $45.5M +72% Y/Y
Total Paying Customers 1,417+54% Y/Y
Dollar-Based Net Retention Rate (NRR) 121%

© 2021 Amplitude Inc. All rights reserved.
Q3 2021 Revenue Geographic Mix
15
$15.9M+68% Y/Y
35% of Total Revenue
International Revenue
$29.6M+75% Y/Y
65% of Total Revenue
US Revenue
© 2021 Amplitude Inc. All rights reserved.
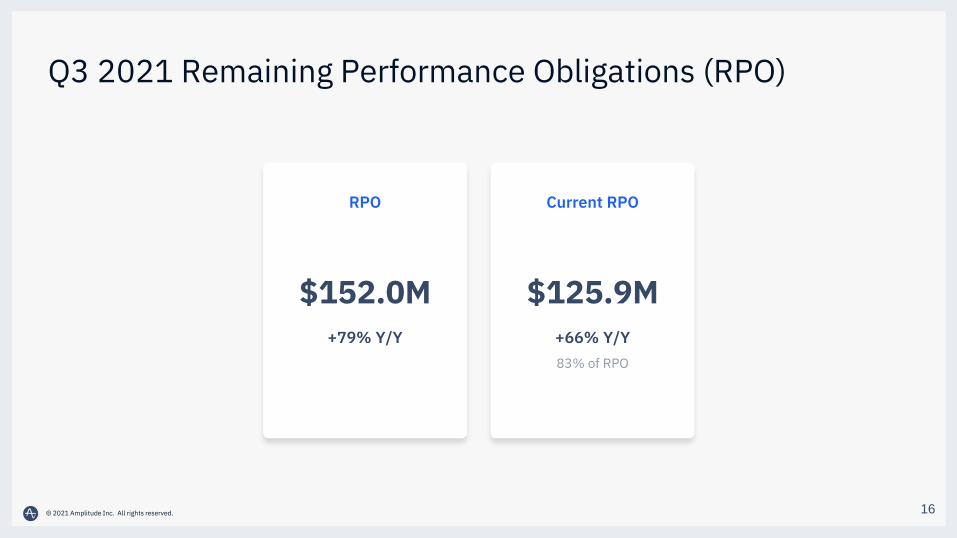
Q3 2021 Remaining Performance Obligations (RPO)
16
$152.0M+79% Y/Y
RPO
$125.9M+66% Y/Y
Current RPO
83% of RPO

© 2021 Amplitude Inc. All rights reserved.
Non-GAAP Financial Results
17
Q3 2021 Result
Gross Margin 71.3%
Operating Margin (5%)
Net Loss Per Share $(0.05)39.3 million shares
Free Cash Flow Margin (35%)
Cash and Cash Equivalents (GAAP) $317.8M
* Unless otherwise noted, all metrics are non-GAAP. Gross margin, operating margin and free cash flow margin are calculated as gross margin, operating margin and free cash flow, respectively, divided by total revenue. A reconciliation of GAAP to non-GAAP results is available in the appendix of this presentation
*

© 2021 Amplitude Inc. All rights reserved.
Guidance (As of November 9, 2021)
18
Q4 2021 FY 2021
Revenue $46 - $47M+53% to +56% Y/Y
$163.8 - $164.8M+60% to 61% Y/Y
Non-GAAP Loss from Operations $(9.2M) - $(8.2M) $(18.5) - $(17.5M)
Non-GAAP Net Loss Per Share $(0.08) - $(0.07) $(0.37) - $(0.35)
Weighted Average Shares Outstanding 108.5M shares 51.5M shares
1 A reconciliation to GAAP loss from operations and GAAP net loss per share has not been provided as the quantification of certain items included in the calculation of GAAP loss from operations and GAAP net loss per share cannot be reasonably calculated or predicted at this time without unreasonable efforts. For example, the non-GAAP adjustment for stock-based compensation expense requires additional inputs such as the number and value of awards granted that are not currently ascertainable, and the non-GAAP adjustment for amortization of acquired intangible assets depends on the timing and value of intangible assets acquired that cannot be accurately forecasted.
e

Sellside Analyst Q&A

GAAP-to-Non-GAAP Reconciliation

© 2021 Amplitude Inc. All rights reserved.
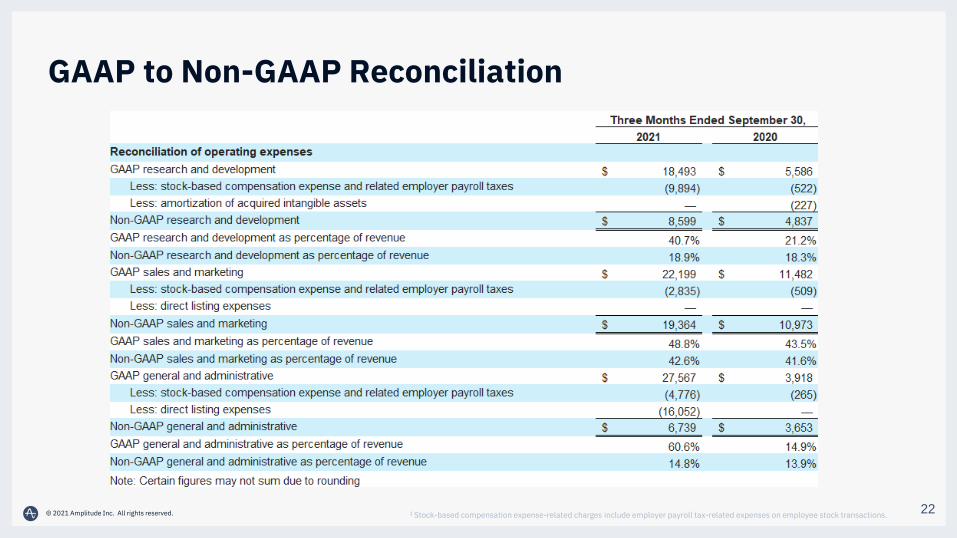
GAAP to Non-GAAP Reconciliation
211 Stock-based compensation expense-related charges include employer payroll tax-related expenses on employee stock transactions.
2 Margin represents percentage of GAAP revenue
© 2021 Amplitude Inc. All rights reserved.
GAAP to Non-GAAP Reconciliation
221 Stock-based compensation expense-related charges include employer payroll tax-related expenses on employee stock transactions.

© 2021 Amplitude Inc. All rights reserved.
GAAP Cash Flows from Operations to Free Cash Flow
231 Margin represents percentage of GAAP revenue

© 2021 Amplitude Inc. All Rights Reserved.