q3 results 2004/05 10 th february 2005 growth through transformation - four quarters running
TRANSCRIPT

Q3 Results 2004/0510th February 2005
Growth through transformation - four quarters running

Q3 Results 2004/05Ben Verwaayen CEO
Growth through transformation - four quarters running

Forward-looking statements - cautionCertain statements in this presentation are forward-looking and are made in reliance on the safe harbour provisions of the US Private Securities Litigation Reform Act of 1995. These statements include, without limitation, those concerning: continued growth in new wave turnover from broadband, ICT and mobility solutions growth; turnover transformation and underlying revenue trend; expectations regarding broadband DSL line connections; implementation of BT’s 21st century network; and expectations regarding cost transformation, capital expenditure and cost efficiency delivering EPS growth.
Although BT believes that the expectations reflected in these forward-looking statements are reasonable, it can give no assurance that these expectations will prove to have been correct. Because these statements involve risks and uncertainties, actual results may differ materially from those expressed or implied by these forward-looking statements.
Factors that could cause differences between actual results and those implied by the forward-looking statements include, but are not limited to: material adverse changes in economic conditions in the markets served by BT; future regulatory actions and conditions in BT’s operating areas, including competition from others; selection by BT and its lines of business of the appropriate trading and marketing models for its products and services; fluctuations in foreign currency exchange rates and interest rates; technological innovations, including the cost of developing new products, networks and solutions and the need to increase expenditures for improving the quality of service; prolonged adverse weather conditions resulting in a material increase in overtime, staff or other costs; developments in the convergence of technologies; the anticipated benefits and advantages of new technologies, products and services, including broadband and other new wave initiatives, not being realised; and general financial market conditions affecting BT’s performance. BT undertakes no obligation to update any forward-looking statements whether as a result of new information, future events or otherwise.

Key deliverables
• Build on network centric ICT capability
• Deliver on BROADBAND
• Create convergent MOBILITY solutions
• Defend TRADITIONAL business vigorously
• Drive for COST LEADERSHIP

Q3 04/05 - Turnover transformation
+ 35%
- 4% *
New wave New wave
Traditional Traditional
TotalRevenue
£bn
New wave : BT Retail and Wholesale new wave plus C&SI and Solutions revenue* adjusted for the impact of mobile termination cut
+ 3.2% *

Underlying* revenue trend improving
2003/04 2004/052002/03
* 2002/3 is adjusted to take account of Concert unwind. 2003/04 and 2004/05 adjusted for the impact of mobile termination cut

Q3 04/05 : turnover by customer group
New Wave proportion for Q3
04/05 03/04Consumer 8% 4%
Business 19% 13%
Major Corporate 49% 42%
Wholesale/Carrier 17% 10%
TOTAL 25% 18%
Consumer
32%
Business
13%
Major Corporate
31%
Wholesale / Carrier
24%
Q3 Turnover growth*Segmented turnover
* excluding the impact of the mobile termination rate reduction

Strong New Wave growth
2003/04
+ 23%+ 25%
+ 31%
+ 38%
+ 20%
+ 32%
2004/05
+ 36% + 35%

ICT
Mobility
Broadband
Other
Q3 04/05 - New Wave turnover£m
Q3 04/05Q3 03/04
+ £127m
+ £125m+ £29m + £16m
+ 98% + 22%+ 112%+ 21%
+ 35%
£838
m
£1,1
35 m

* Sales Order Value of contracts won by Solutions and C&SI
ICT - building for the future
Q3 Total Order intake £1.2bn *
• Key wins include– Barclays 7 years, WAN & LAN services over IP network
– Thales Group (France) 5 years management of all fixed voice and data network services in 42 countries
– NATO HQ (Belgium) 5 years, data & voice in 28 countries
– Registers of Scotland 10 years, range of IT service delivery projects
• Including 47 Solutions wins each worth between £1m & £2m

ICT - acquisition update
Albacom• Acquired for €116m
• Received EC clearance, January 31st
• Deal completed on February 4th
Infonet• US antitrust and EU clearance received
• Shareholders vote at EGM on February 23rd
• Expected annual synergy savings of £80m from year three

Broadband - BT Wholesale
Wholesale end user connections as at end Dec ‘04 - 4.1m
Q3 net additions > 800,000Another Record
Trials of 8Mb and ADSL2+ to begin in April
2003/042002/03 2004/05
Wholesale DSL end users

Broadband - BT Retail
Q3 1.5m DSL subscribers at end of December 80% higher than prior year
Market share of DSL 36%
Record quarterly net additions 208k
BUT market share of Q3 net adds 26%
2003/042002/03 2004/05

Broadband - BT Retail,today’s announcement
• Consumer– Changing the landscape for value– Four times the speed– Up to 2Mb for most customers– At no extra cost
• Business– 2Mb as standard for all business customers from 1st April– New service level guarantees on premium products– Already profitable

Mobility
• Q3 Mobility revenues grew 112% to £55m– MVNO operational for both Business and Consumer
• Service Provision connections base grew 36k in Q3 to 341k (post pay)– PLUS 62k own use mobiles
• Laying the foundations for fixed mobile convergence– Bluephone target launch – Spring 05

Traditional turnover* - rate of decline slowing
2003/04
- 2.4%
- 4.5%
- 6.5%- 5.8%
- 1.0%
- 4.9%
2004/05
- 4.6%- 4.0%
* adjusted for the impact of mobile termination cut

No effect on profit
next slide
Q3 04/05 -Traditional turnover
£m
£3,7
40 m
Q3 04/05Q3 03/04
- £141m
- £23m- £192m
Mobile Termination
PrivateCircuits Calls Lines Other
+ £13m+ £52m
+ WLR+ Interconnect- Payphones
Adj’d Q3 03/04
- 7% - 18% + 1% + 4%
- 4% *
DSL & WLR substitution offset by
re-balancing
£3,5
99 m
£3,4
49 m
* adjusted for the impact of mobile termination cut

Q3 04/05 - Call revenues - £192m decrease year on year
* BT estimates based on latest Ofcom data - Local, national, international and non-geographic voice minutes
Rebalancingto lines and
other servicesMarket share*:- Business down 0.5%- Consumer down 1.3%
£54m
£42m
£68m
Fixed voice market*Volume and price
reductions£28m
Dial IPBroadbandsubstitution

• Trials – VOICE
• Voice trialists connected via MSANs and Core routers• First end to end IP voice call made on January 7th
– FIBRE• First fibre connections live - serving more than 200 premises with 2Mbit/s
broadband and voice– ADSL 2+
• Using MSANs which are already in place to trial up to 18Mb from April
• Consult21– Continuing industry engagement to offer fair access to 21CN
21st Century Network
MSAN MSANMetroNode
MetroNode
IP/MPLS coreBexleyheath Woolwich

Regulation, a step change
• BT to set up an Access Services division to provide transparent and equal access to BT’s local network
• BT to cut a range of wholesale broadband prices and introduce faster services
• BT reaffirms its commitment to LLU and proposes a further price cut (subject to the completion of other consultations)
• BT to increase the commercial attractiveness of WLR
• BT to offer fair access to 21CN
• OFCOM to rollback regulation and red tape and provide assurances that investment will be rewarded appropriately

Cost Leadership
Savings in Traditional areas £300m year to date
– Reducing field visits
• Using more remote testing and automation of provision activities
– More effective fault diagnostics in Broadband
– Customer facing employees up-skilled to deal with a wider range of enquiries
– More use of agile working and better utilisation accommodation
– Negotiating better tariffs with other carriers globally
– Continued overhead reductions

Underlying earnings per share*
* before leaver costs, goodwill and exceptionals

Q3 - Delivering on our strategy
Grow the business • Revenue +3%*• Fourth consecutive quarter of growth
Transform the mix • New wave now 25% of revenues• Global revenue +10%• ICT revenue +21%
Change whatcustomers buy
• More broadband lines than ISDN• Broadband now up to 4x faster• MPLS revenues up 32%
Take out costs • Savings £300m year to date
Build long termshareholder value
• EPS** +9% to 4.8p in Q3
* adjusted for the impact of mobile termination rate cut** before exceptional items and goodwill

Q3 Results 2004/05Hanif Lalani Group Finance Director
Growth through transformation - four quarters running

Q3 04/05 – Financial headlines
Group turnover £4.6bn 3.2%* / 0.1%
Free cashflow £387m £0.3bn
Net debt £7.9bn £0.9bn
Earnings per share ** 4.8p 9%
Profit before tax ** £545m 4%
*adjusted for the impact of mobile termination rate cut**before exceptional items and goodwill

Q3 04/05 - BT Retail
• Turnover declined by 1%* year on year– Traditional down 9%*
– New wave up 38%
• Gross margin down 1.4 percentage points– Changing revenue mix
• SG&A £11m** lower– Ongoing reduction in Traditional offset by investment in New Wave
• Operating Profit down 15%**
*adjusted for the impact of mobile termination rate cut**before exceptional items and goodwill

Q3 04/05 - BT Wholesale
• External turnover up 21%* year on year
– Traditional up 13%* and New wave up 80%
• Internal turnover down 3% year on year
• Network and SG&A costs reduced by £14m**
• EBITDA £982m** up 4%
• Operating profit £510m** up 9%
*adjusted for the impact of mobile termination rate cut**before exceptional items and goodwill

Q3 04/05 - BT Global Services
• Turnover up 10% at £1,543m – Global Solutions up 17%
– Consulting & Systems Integration up 27%
– Global Products up 3%
– Global Carrier down 3%
• EBITDA up 11% at £148m**
• Operating PROFIT £9m**– Improvements in all business units
• Operating free cash flow £2m
**before exceptional items and goodwill

YTD 04/05 - Group P&L
Turnover
Cost of sales
Gross marginGross margin %
SG&A
Other operating income
Total SG&A
SG&A %
EBITDA pre leaversDepreciation
Total costs (pre leavers & oth. op. income)
Operating Profit pre leaversOperating margin pre leavers %
13,75313,753
(6,329)(6,329)
7,4247,42454.0%54.0%
(3,213)(3,213)
132132
(3,081)(3,081)
22.4%22.4%
4,3434,343(2,096) (2,096)
(11,638)(11,638)
2,2472,24716.3%16.3%
13,75313,753
(6,329)(6,329)
7,4247,42454.0%54.0%
(3,213)(3,213)
132132
(3,081)(3,081)
22.4%22.4%
4,3434,343(2,096) (2,096)
(11,638)(11,638)
2,2472,24716.3%16.3%
YTDYTD03/04 £m03/04 £m
YTDYTD03/04 £m03/04 £m
YTDYTD04/05 £m04/05 £m
YTDYTD04/05 £m04/05 £m
Better / Better / (Worse) £m(Worse) £m
Better / Better / (Worse) £m(Worse) £m
2121
(200)(200)
(179)(179)
6969
(1)(1)
6868
(111)(111)8787
(44)(44)
(24)(24)
2121
(200)(200)
(179)(179)
6969
(1)(1)
6868
(111)(111)8787
(44)(44)
(24)(24)
13,73213,732
(6,129)(6,129)
7,6037,60355.4%55.4%
(3,282)(3,282)
133133
(3,149)(3,149)
22.9%22.9%
4,4544,454(2,183)(2,183)
(11,594)(11,594)
2,2712,27116.5%16.5%
13,73213,732
(6,129)(6,129)
7,6037,60355.4%55.4%
(3,282)(3,282)
133133
(3,149)(3,149)
22.9%22.9%
4,4544,454(2,183)(2,183)
(11,594)(11,594)
2,2712,27116.5%16.5%
All numbers are before exceptional items and goodwill

Other Op costs
Pay
Pay
POLOs
YTD 04/05 - Group operating costs
Other Op costs
£m+ £61m - £156m
- £87m
+ £295m
YTD 04/05YTD 03/04
Depreciation
£44m increase year on year*
- £114m
£11,
638
m
£11,
594
m+ £45m
Cost of Sales + £200m
SG&A - £69m
*before leaver costs and other operating income

Q3 04/05 - Group capital expenditure
Group capex £770m, up 10% year on year
Solutions, Retail & non-UK up 42%
Backhaul transmission spending up to support broadband rollout
£m
} Network related
+ 42%
+ 7%
- 25%
+ 8%
+ 13%
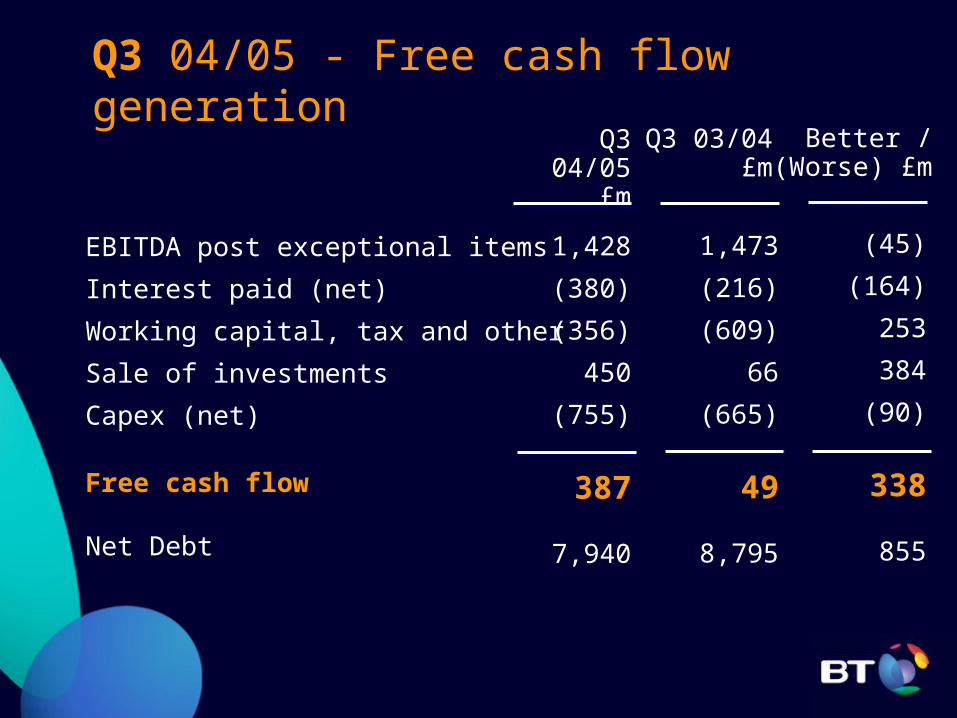
EBITDA post exceptional items
Interest paid (net)
Working capital, tax and other
Sale of investments
Capex (net)
Free cash flow
Net Debt
Q3 04/05 - Free cash flow generation
Q3 04/05 £m
1,428
(380)
(356)
450
(755)
387
7,940
Q3 03/04 £m
1,473
(216)
(609)
66
(665)
49
8,795
Better /(Worse) £m
(45)
(164)
253
384
(90)
338
855

International Accounting Standards
BT timeframe / process
• Accounting policy review complete
• 2003/4 and 2004/5 impact quantified
• Analysts presentation will be held in mid March
• Restated 2004/5 accounts to be published in June
• 2005/6 first full year under IFRS

Delivering results while transforming the business• FOUR consecutive quarters of turnover * growth
– New wave now 25% of Group revenue
– Broadband revenues annualised > £1bn
• Cost savings & reinvestment– Continue to extract efficiency in traditional areas
– Reinvestment in new wave businesses
• Transformation accelerating– Growing credibility as an ICT services provider
– Acquisitions strengthen capabilities and deliver synergies
– Building foundations for fixed mobile convergence
• ELEVEN consecutive quarters of growth in EPS **
* adjusted for the impact of mobile termination rate cut** before leavers, exceptional items and goodwill

Q3 Results 2004/0510th February 2005
Growth through transformation - four quarters running