q3/20 results october 30, 2020 - investor relations
TRANSCRIPT
Q3/20 Results October 30, 2020

22
Forward Looking Statements
This presentation contains forward-looking statements that are based on our management’s beliefs and assumptions and on information currently available to our management. Although we
believe that the expectations reflected in these forward-looking statements are reasonable, these statements relate to future events or our future financial performance, and involve known and
unknown risks, uncertainties and other factors that may cause our actual results, levels of activity, performance or achievements to be materially different from any future results, levels of activity,
performance or achievements expressed or implied by these forward-looking statements. In some cases, you can identify forward-looking statements by terminology such as “may,” “will,” “should,”
“expects,” “intends,” “plans,” “anticipates,” “believes,” “estimates,” “predicts,” “potential,” “continue” or the negative of these terms or other comparable terminology. These statements are only
predictions. You should not place undue reliance on forward-looking statements because they involve known and unknown risks, uncertainties and other factors, which are, in some cases, beyond
our control and which could materially affect results. Factors that may cause actual results to differ materially from current expectations include, among other things, the risks described below. If one
or more of these or other risks or uncertainties occur, or if our underlying assumptions prove to be incorrect, actual events or results may vary significantly from those implied or projected by the
forward-looking statements. No forward-looking statement is a guarantee of future performance. You should read this press release completely and with the understanding that our actual future
results may be materially different from any future results expressed or implied by these forward-looking statements.
In particular, forward-looking statements in this press release may include statements about: the ultimate duration of the COVID-19 pandemic and its short-term and long-term impact on our business
and the global economy; anticipated trends, conditions and investor sentiment in the global markets and ETPs; anticipated levels of inflows into and outflows out of our ETPs; our ability to deliver
favorable rates of return to investors; competition in our business; our ability to develop new products and services; our ability to maintain current vendors or find new vendors to provide services to us
at favorable costs; our ability to successfully operate and expand our business in non-U.S. markets; and the effect of laws and regulations that apply to our business.
Our business is subject to many risks and uncertainties, including without limitation:
• Declining prices of securities, gold and other precious metals and other commodities can adversely affect our business by reducing the market value of the assets we manage or causing
WisdomTree ETP investors to sell their fund shares and trigger redemptions.
• Fluctuations in the amount and mix of our AUM, whether caused by disruptions in the financial markets or otherwise including but not limited to a pandemic event such as COVID-19, may
negatively impact revenues and operating margins, and may impede our ability to refinance our debt upon maturity, increase the cost of borrowing or result in our debt being called prior to
maturity.
• Competitive pressures could reduce revenues and profit margins.
• We derive a substantial portion of our revenues from a limited number of products, and as a result, our operating results are particularly exposed to investor sentiment toward investing in the
products’ strategies, our ability to maintain the AUM of these products, the performance of these products and market-specific and political and economic risk.
• A significant portion of our AUM is held in products with exposure to U.S. and international developed markets and we therefore have exposure to domestic and foreign market conditions and
are subject to currency exchange rate risks.
• Withdrawals or broad changes in investments in our ETPs by investors with significant positions may negatively impact revenues and operating margins.
• Over the last few years, we have expanded our business globally. This expansion subjects us to increased operational, regulatory, financial and other risks.
• Many of our ETPs have a limited track record, and poor investment performance could cause our revenues to decline.
• We depend on third parties to provide many critical services to operate our business and our ETPs. The failure of key vendors to adequately provide such services could materially affect our
operating business and harm WisdomTree ETP investors.
Other factors, such as general economic conditions, including currency exchange rate fluctuations, also may have an effect on the results of our operations. For a more complete description of the
risks noted above and other risks that could cause our actual results to differ from our current expectations, please see the section entitled “Risk Factors” in our Annual Report on Form 10-K for the
fiscal year ended December 31, 2019 and Quarterly Reports on Form 10Q for the quarters ended March 31, 2020 and June 30, 2020.
The forward-looking statements in this press release represent our views as of the date of this presentation. We anticipate that subsequent events and developments may cause our views to
change. However, while we may elect to update these forward-looking statements at some point in the future, we have no current intention of doing so except to the extent required by applicable
law. Therefore, these forward-looking statements do not represent our views as of any date other than the date of this presentation.
WisdomTree – Q3/20 Results

33
AUM rebound continued in Q3/20
WisdomTree – Q3/20 Results
(1) AUM & QTD flows through 10/23/20
➢ Quarter-end AUM of $60.7 billion – up +5.3% sequentially driven by positive
market move partially offset by modest outflows. Q4/20 QTD AUM(1) up +4.0%
➢ Net outflows of ($468) million in Q3/20 – U.S. listed product inflows were
more than offset by energy driven Europe listed product outflows. Q4/20(1) off to
a strong start with +$1.0 billion of inflows
➢ U.S. listed ETFs generated Q3/20 inflows of +$575 million representing
7% annualized organic growth driven by accelerated gross sales
+ Positive flows in all 3 months of the quarter with momentum back to pre-
pandemic levels
+ Flows driven by funds previously highlighted as well positioned – DGRW
(+$843m), XSOE (+$404m), WCLD (+$334m), AGGY (+$103m)
+ Continue to battle market sentiment headwinds with nearly 40% of AUM in
the bottom 15 flowing Morningstar categories (out of 97 categories)
➢ Europe listed ETPs endured Q3/20 outflows of ($1.0) billion driven by
a reversal in energy product demand
+ Outflows led by Energy ($817m) and physical Gold ($523m) while other
physical precious metals (Silver, Platinum, Palladium) generated inflows
(+$160m)
+ Q4/20(1) off to a solid start with +$854m of inflows driven by physical Gold
$40
$45
$50
$55
$60
$65
$70
De
c-1
9
Ja
n-2
0
Fe
b-2
0
Ma
r-2
0
Ap
r-2
0
Ma
y-2
0
Ju
n-2
0
Ju
l-2
0
Au
g-2
0
Se
p-2
0
AU
M (
$ in
bill
ion
s)
(698)
390
(536)
126
(468)
1,030
Q3/19 Q4/19 Q1/20 Q2/20 Q3/20 Q4/20
QTD
AUM Trends (1)
Net Flow Trends (1)
($ in millions)
44
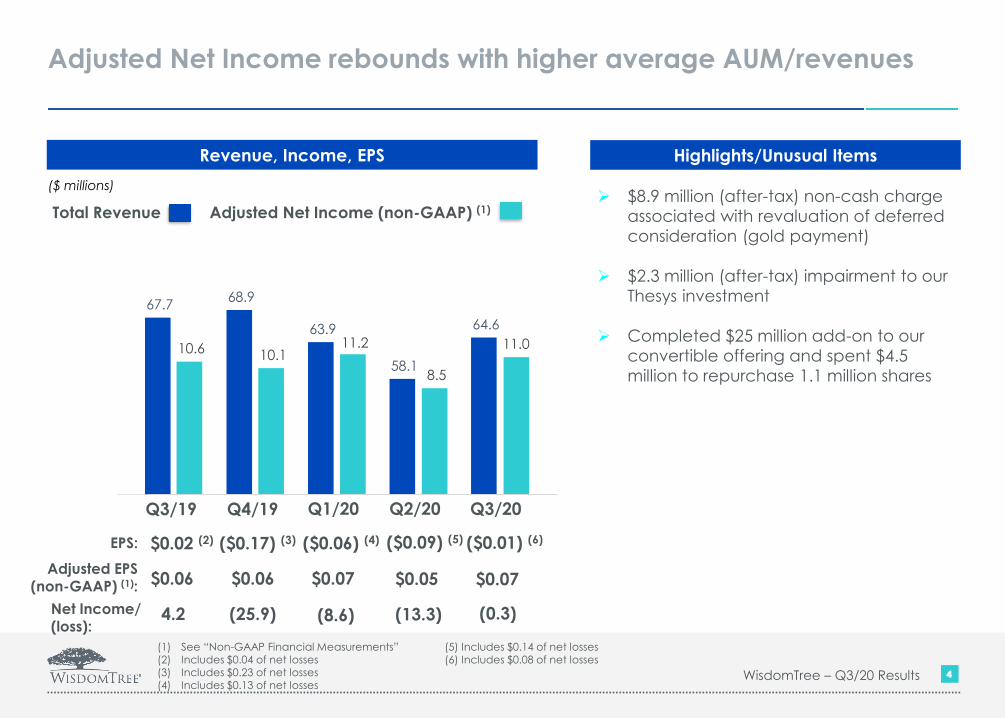
67.7 68.9
63.9
58.1
64.6
10.6 10.1 11.2
8.5
11.0
Adjusted Net Income rebounds with higher average AUM/revenues
WisdomTree – Q3/20 Results
Revenue, Income, EPS
($ millions)
Highlights/Unusual Items
EPS: $0.02 (2) ($0.17) (3) ($0.06) (4) ($0.09) (5)
(1) See “Non-GAAP Financial Measurements” (5) Includes $0.14 of net losses(2) Includes $0.04 of net losses (6) Includes $0.08 of net losses(3) Includes $0.23 of net losses(4) Includes $0.13 of net losses
($0.01) (6)
Net Income/(loss):
4.2 (25.9) (8.6) (13.3) (0.3)
Total Revenue Adjusted Net Income (non-GAAP) (1)➢ $8.9 million (after-tax) non-cash charge
associated with revaluation of deferred
consideration (gold payment)
➢ $2.3 million (after-tax) impairment to our
Thesys investment
➢ Completed $25 million add-on to our
convertible offering and spent $4.5
million to repurchase 1.1 million shares
Adjusted EPS(non-GAAP) (1): $0.06 $0.06 $0.07 $0.05 $0.07
Q3/19 Q4/19 Q1/20 Q2/20 Q3/20
55
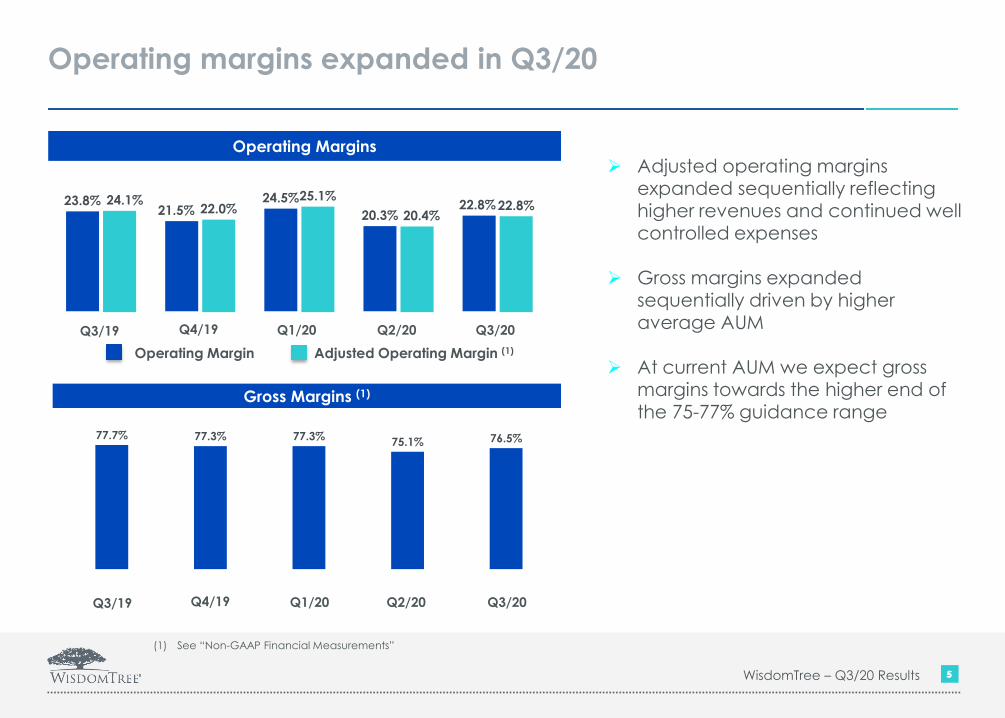
77.7% 77.3% 77.3%75.1% 76.5%
Operating margins expanded in Q3/20
WisdomTree – Q3/20 Results
Gross Margins (1)
Operating Margins
➢ Adjusted operating margins expanded sequentially reflecting higher revenues and continued well controlled expenses
➢ Gross margins expanded sequentially driven by higher average AUM
➢ At current AUM we expect gross margins towards the higher end of the 75-77% guidance range
(1) See “Non-GAAP Financial Measurements”
Q3/19 Q4/19 Q1/20 Q2/20 Q3/20
24.1%22.0%
25.1%
20.4%22.8%23.8%
21.5%24.5%
20.3%22.8%
Q3/19 Q4/19 Q1/20 Q2/20 Q3/20
Operating Margin Adjusted Operating Margin (1)
66
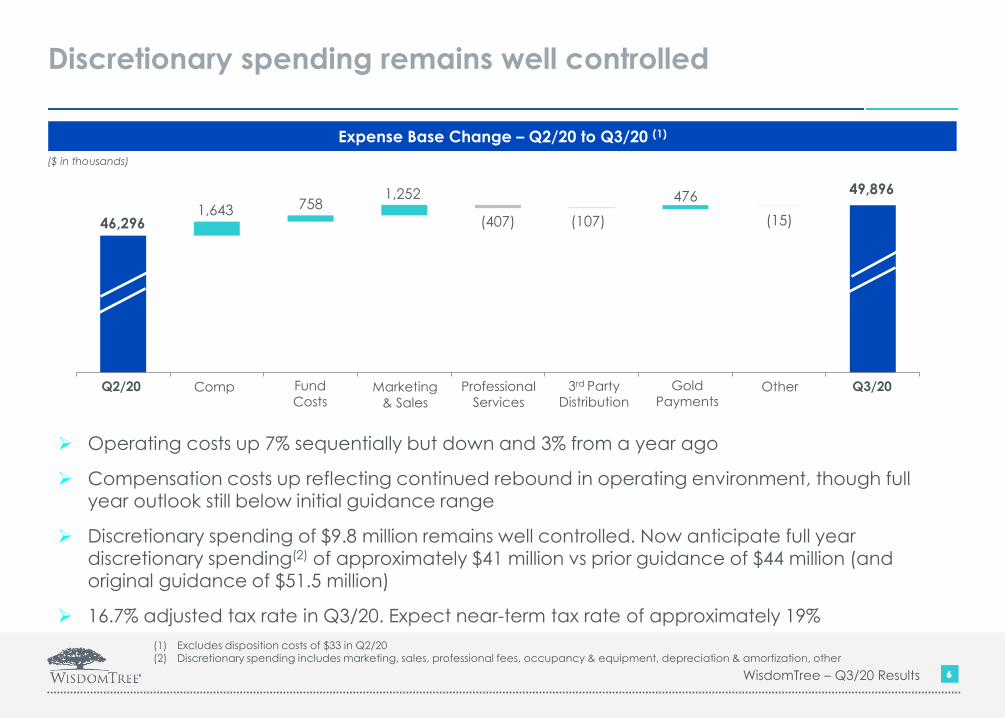
46,296
49,896
1,643 7581,252
(407) (107)
476
(15)
(1) Excludes disposition costs of $33 in Q2/20(2) Discretionary spending includes marketing, sales, professional fees, occupancy & equipment, depreciation & amortization, other
Discretionary spending remains well controlled
WisdomTree – Q3/20 Results
Expense Base Change – Q2/20 to Q3/20 (1)
➢ Operating costs up 7% sequentially but down and 3% from a year ago
➢ Compensation costs up reflecting continued rebound in operating environment, though full year outlook still below initial guidance range
➢ Discretionary spending of $9.8 million remains well controlled. Now anticipate full year discretionary spending(2) of approximately $41 million vs prior guidance of $44 million (and original guidance of $51.5 million)
➢ 16.7% adjusted tax rate in Q3/20. Expect near-term tax rate of approximately 19%
Q2/20 Marketing
& Sales
Professional
ServicesOther Q3/20Comp Fund
Costs3rd Party
Distribution
($ in thousands)
Gold
Payments
77
2.7
1.4 1.2 1.9 1.9
2.4
(2.6)
(1.6)
(2.4)
(3.1)(3.4)
(1.9)
Q1 Q2 Q3
(1,500)
(1,250)
(1,000)
(750)
(500)
(250)
0
250
500
Se
pt
Oc
t
No
v
De
c
Ja
n
Fe
b
Ma
r
Ap
r
Ma
y
Jun
e
July
Au
g
Se
pt
U.S. gross sales & net flow momentum continues to build
WisdomTree – Q3/20 Results
(1) Gross sales/redemptions represent the daily aggregate of funds with net creations/redemptions
Gross Sales/Redemptions (1) U.S. Listed Net Flows
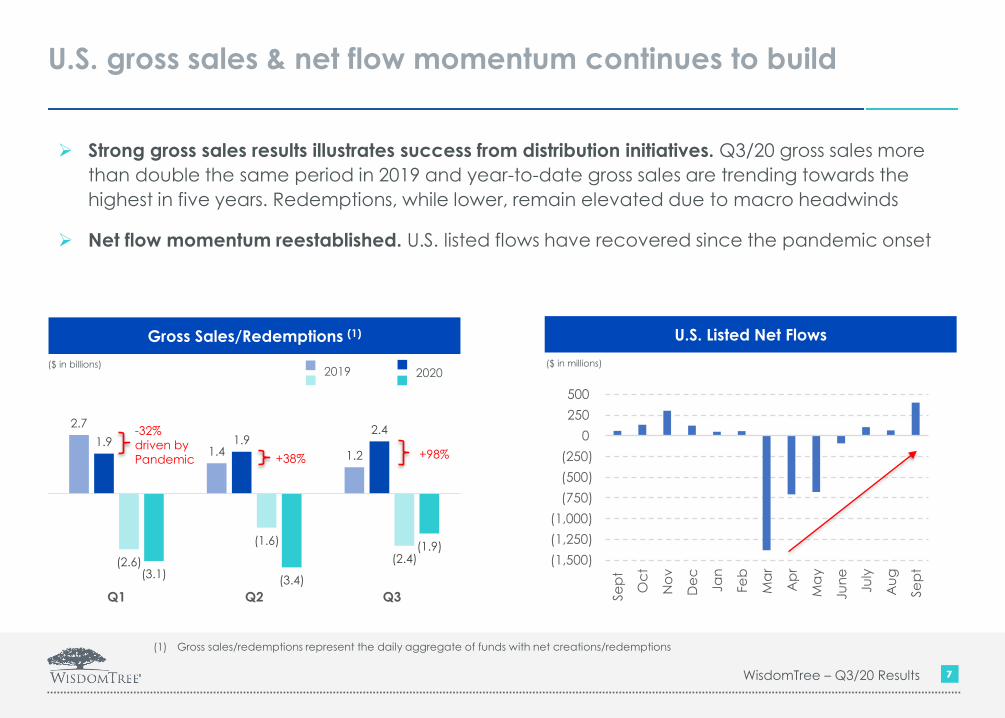
➢ Strong gross sales results illustrates success from distribution initiatives. Q3/20 gross sales more
than double the same period in 2019 and year-to-date gross sales are trending towards the
highest in five years. Redemptions, while lower, remain elevated due to macro headwinds
➢ Net flow momentum reestablished. U.S. listed flows have recovered since the pandemic onset
($ in millions)($ in billions)
-32%
driven by
Pandemic +98%+38%
20202019
88
Europe listed flow headwinds in Q3/20 poised for reversal
WisdomTree – Q3/20 Results
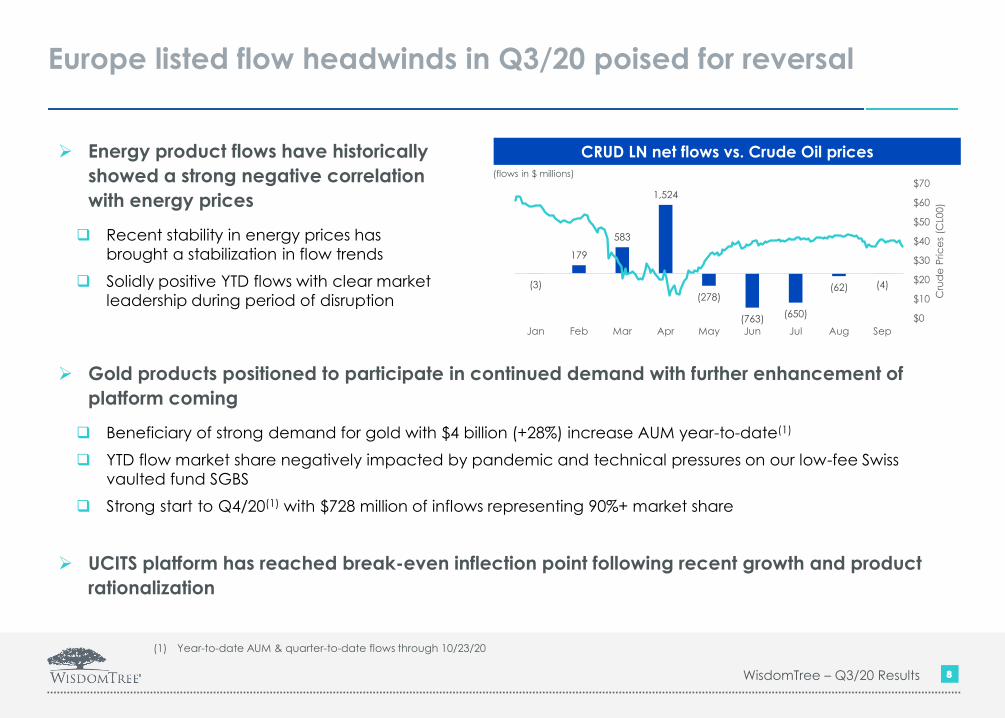
➢ Energy product flows have historically
showed a strong negative correlation
with energy prices
❑ Recent stability in energy prices has
brought a stabilization in flow trends
❑ Solidly positive YTD flows with clear market
leadership during period of disruption(3)
179
583
1,524
(278)
(763)(650)
(62) (4)
$0
$10
$20
$30
$40
$50
$60
$70
(1,000)
(500)
0
500
1,000
1,500
2,000
Jan Feb Mar Apr May Jun Jul Aug Sep
Cru
de
Pric
es
(CL0
0)
CRUD LN net flows vs. Crude Oil prices
(flows in $ millions)
➢ Gold products positioned to participate in continued demand with further enhancement of
platform coming
❑ Beneficiary of strong demand for gold with $4 billion (+28%) increase AUM year-to-date(1)
❑ YTD flow market share negatively impacted by pandemic and technical pressures on our low-fee Swiss
vaulted fund SGBS
❑ Strong start to Q4/20(1) with $728 million of inflows representing 90%+ market share
➢ UCITS platform has reached break-even inflection point following recent growth and product
rationalization
(1) Year-to-date AUM & quarter-to-date flows through 10/23/20
99
Takeaways & additional highlights
WisdomTree – Q3/20 Results
➢ Momentum in the business is building and execution has been strong
+ U.S. and European product sets both well positioned for growth
➢ Planning for a “remote first” work environment
+ Aim to reduce office footprint with anticipated annual savings of $3-4 million
beginning in late 2021 or early 2022
➢ Tokenization initiative is progressing
+ Products will enhance user experience through blockchain technology
+ Focus on regulatory compliance is the right strategy and aligns with SEC principles

10
Appendix
1111
57.6
60.7
(0.5)
3.6 575
(1,043)
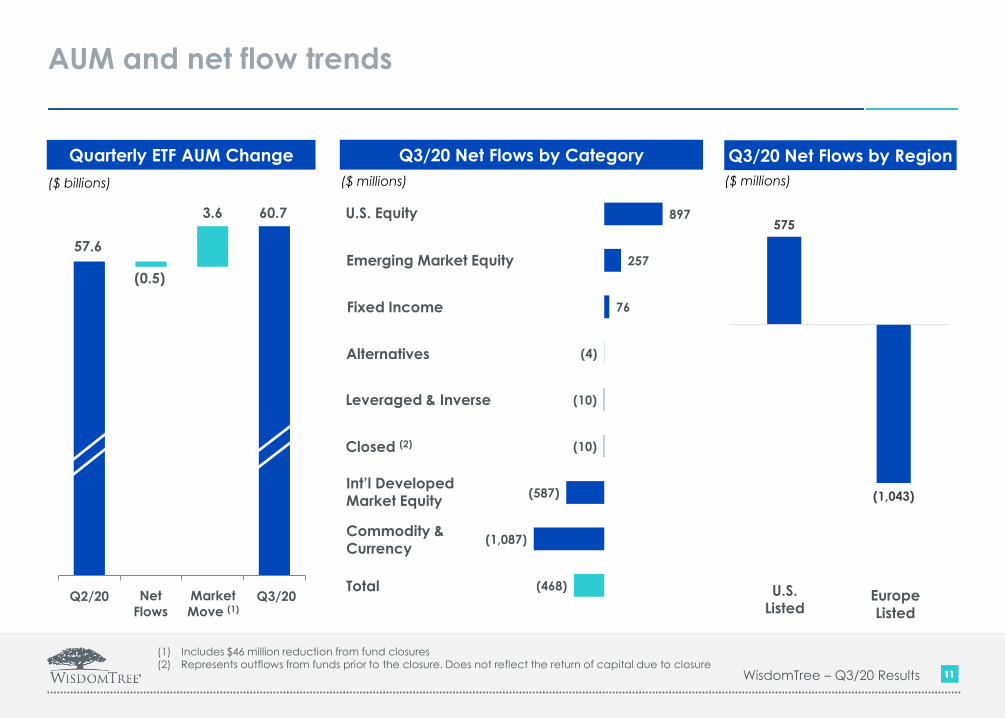
AUM and net flow trends
WisdomTree – Q3/20 Results
Q2/20 Q3/20Net
Flows
Market
Move (1)
Quarterly ETF AUM Change
($ billions)
Q3/20 Net Flows by Category
($ millions)
(468)
(1,087)
(587)
(10)
(10)
(4)
76
257
897
Fixed Income
Leveraged & Inverse
Alternatives
Closed (2)
U.S. Equity
Emerging Market Equity
Commodity & Currency
Total
Q3/20 Net Flows by Region
U.S.Listed
Europe
Listed
($ millions)
Int’l DevelopedMarket Equity
(1) Includes $46 million reduction from fund closures(2) Represents outflows from funds prior to the closure. Does not reflect the return of capital due to closure

1212
Industry U.S. listed ETF flows
WisdomTree – Q3/20 Results
U.S. ETF Industry Net Inflows Industry Net Inflows by Category Q3/20
Source: Bloomberg, ICI, Morningstar, WisdomTree
(1.1)
(0.1)
1.0
2.0
15.0
19.3
19.3
57.1
Int'l FX Hedged Equity
Other
EM Equity
Alternatives
Gold / Commodity
U.S. Equity
Int'l Equity
Fixed Income
84.6
126.5
72.5
133.6
112.5
Q3/19 Q4/19 Q1/20 Q2/20 Q3/20
$ in billions $ in billions
1313
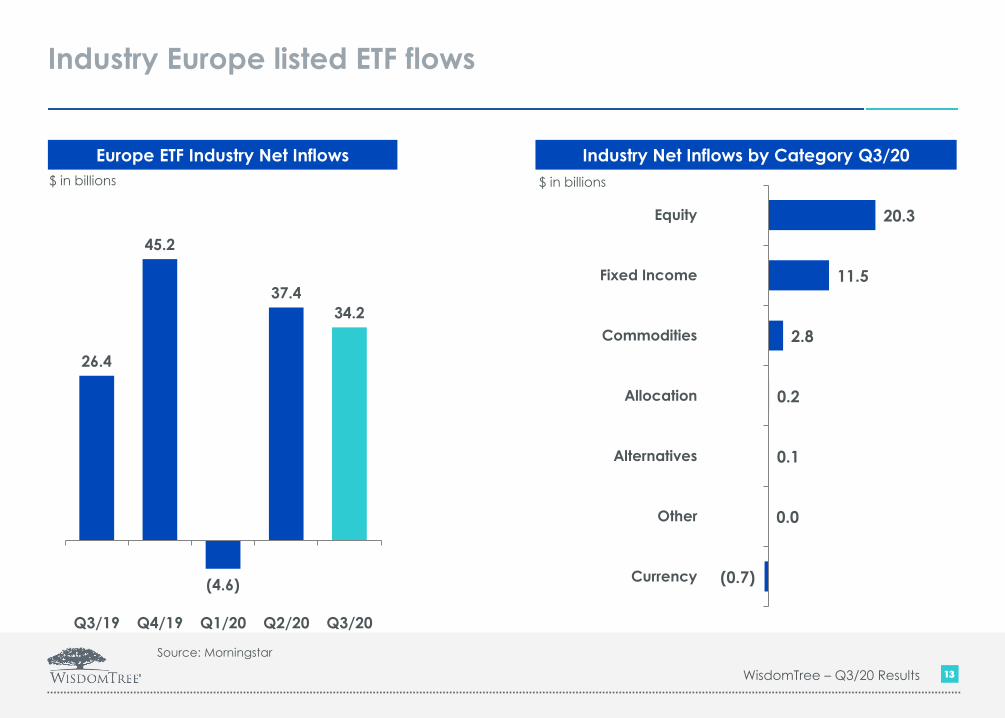
(0.7)
0.0
0.1
0.2
2.8
11.5
20.3
Currency
Other
Alternatives
Allocation
Commodities
Fixed Income
Equity
Industry Europe listed ETF flows
WisdomTree – Q3/20 Results
Europe ETF Industry Net Inflows Industry Net Inflows by Category Q3/20
Source: Morningstar
$ in billions $ in billions
26.4
45.2
(4.6)
37.4
34.2
Q3/19 Q4/19 Q1/20 Q2/20 Q3/20

1414
109.2
96.6
15.6
(15.2)
(31.0)(3.8)
12.4
9.4
Balance Sheet
WisdomTree – Q3/20 Results
Balance Sheet
($ millions)
(1) Includes securities owned and securities held to maturity
(2) Includes note receivable associated with AdvisorEngine at 12/31/19
9M/20 Change in Cash & Securities (1)
Dec-19 Sep-20OperatingCash Flow
Dividends ShareBuybacks
Other
($ millions)Sep. 30, Dec. 31,
2020 2019
Assets
Cash and securities (1) $96.6 $109.2
Investments (2) 8.1 39.4
Accounts receivable 26.2 26.8
Deferred tax asset, net 7.1 7.4
Fixed assets, net 7.7 8.1
Goodwill and intangibles 687.1 689.2
Other assets 22.7 55.1
Total assets $855.5 $935.2
Liabilities
Fund management and administration $22.4 $22.0
Compensation and benefits 13.9 26.5
Accounts payable and other liabilities 10.4 12.9
Long-term debt 165.8 176.0
Deferred consideration (gold payments) 207.7 173.0
Lease Liabilities 17.8 22.7
Other non-current liabilities 3.2 32.1
Total liabilities 441.2 465.2
Preferred stock 132.6 132.6
Stockholders' equity 281.7 337.4
Total liabilities and stockholders' equity $855.5 $935.2
Debt Reduction
Divestitures
1515
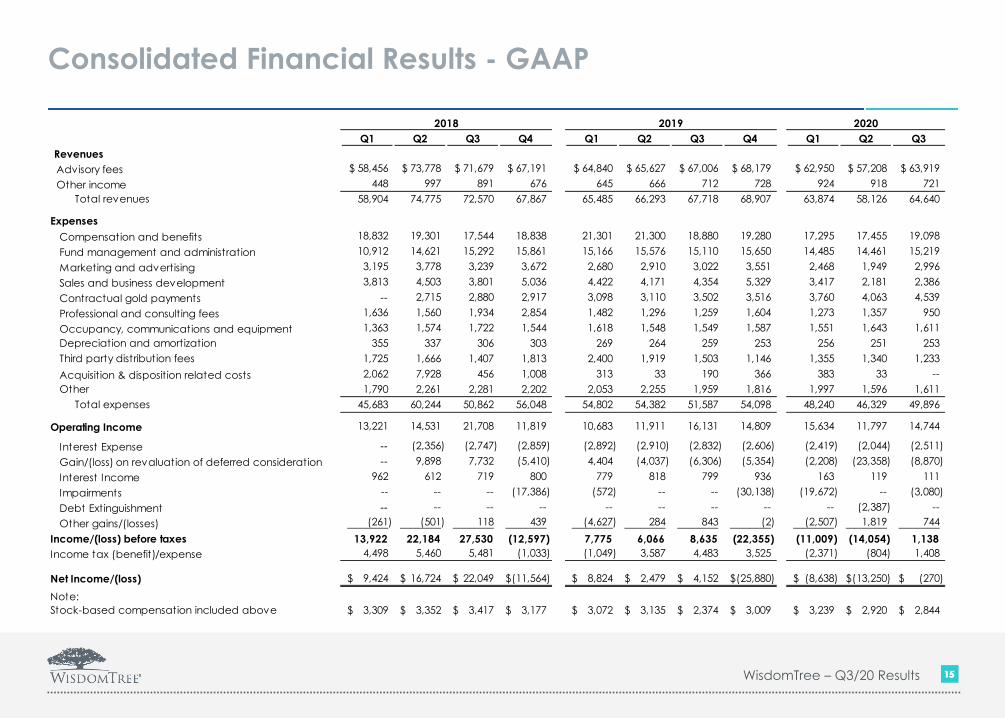
Consolidated Financial Results - GAAP
WisdomTree – Q3/20 Results
2018 2019 2020
Q1 Q2 Q3 Q4 Q1 Q2 Q3 Q4 Q1 Q2 Q3
Revenues
Advisory fees 58,456$ 73,778$ 71,679$ 67,191$ 64,840$ 65,627$ 67,006$ 68,179$ 62,950$ 57,208$ 63,919$
Other income 448 997 891 676 645 666 712 728 924 918 721
Total revenues 58,904 74,775 72,570 67,867 65,485 66,293 67,718 68,907 63,874 58,126 64,640
Expenses
Compensation and benefits 18,832 19,301 17,544 18,838 21,301 21,300 18,880 19,280 17,295 17,455 19,098
Fund management and administration 10,912 14,621 15,292 15,861 15,166 15,576 15,110 15,650 14,485 14,461 15,219
Marketing and advertising 3,195 3,778 3,239 3,672 2,680 2,910 3,022 3,551 2,468 1,949 2,996
Sales and business development 3,813 4,503 3,801 5,036 4,422 4,171 4,354 5,329 3,417 2,181 2,386
Contractual gold payments -- 2,715 2,880 2,917 3,098 3,110 3,502 3,516 3,760 4,063 4,539
Professional and consulting fees 1,636 1,560 1,934 2,854 1,482 1,296 1,259 1,604 1,273 1,357 950
Occupancy, communications and equipment 1,363 1,574 1,722 1,544 1,618 1,548 1,549 1,587 1,551 1,643 1,611
Depreciation and amortization 355 337 306 303 269 264 259 253 256 251 253
Third party distribution fees 1,725 1,666 1,407 1,813 2,400 1,919 1,503 1,146 1,355 1,340 1,233
Acquisition & disposition related costs 2,062 7,928 456 1,008 313 33 190 366 383 33 --
Other 1,790 2,261 2,281 2,202 2,053 2,255 1,959 1,816 1,997 1,596 1,611
Total expenses 45,683 60,244 50,862 56,048 54,802 54,382 51,587 54,098 48,240 46,329 49,896
Operating Income 13,221 14,531 21,708 11,819 10,683 11,911 16,131 14,809 15,634 11,797 14,744
Interest Expense -- (2,356) (2,747) (2,859) (2,892) (2,910) (2,832) (2,606) (2,419) (2,044) (2,511)
Gain/(loss) on revaluation of deferred consideration -- 9,898 7,732 (5,410) 4,404 (4,037) (6,306) (5,354) (2,208) (23,358) (8,870)
Interest Income 962 612 719 800 779 818 799 936 163 119 111
Impairments -- -- -- (17,386) (572) -- -- (30,138) (19,672) -- (3,080)
Debt Extinguishment -- -- -- -- -- -- -- -- -- (2,387) --
Other gains/(losses) (261) (501) 118 439 (4,627) 284 843 (2) (2,507) 1,819 744
Income/(loss) before taxes 13,922 22,184 27,530 (12,597) 7,775 6,066 8,635 (22,355) (11,009) (14,054) 1,138
Income tax (benefit)/expense 4,498 5,460 5,481 (1,033) (1,049) 3,587 4,483 3,525 (2,371) (804) 1,408
Net Income/(loss) 9,424$ 16,724$ 22,049$ (11,564)$ 8,824$ 2,479$ 4,152$ (25,880)$ (8,638)$ (13,250)$ (270)$
Note:
Stock-based compensation included above 3,309$ 3,352$ 3,417$ 3,177$ 3,072$ 3,135$ 2,374$ 3,009$ 3,239$ 2,920$ 2,844$
1616
Non-GAAP Financial Measurements
WisdomTree – Q3/20 Results
In an effort to provide additional information regarding our results as determined by GAAP, we also disclose certain non-GAAP information which we believe provides useful and meaningful information.
Our management reviews these non-GAAP financial measurements when evaluating our financial performance and results of operations; therefore, we believe it is useful to provide information with
respect to these non-GAAP measurements so as to share this perspective of management. Non-GAAP measurements do not have any standardized meaning, do not replace nor are superior to GAAP
financial measurements and are unlikely to be comparable to similar measures presented by other companies. These non-GAAP financial measurements should be considered in the context with our
GAAP results. The non-GAAP financial measurements contained in this release include:
• Adjusted operating income, operating expenses, income before income taxes, income tax expense, net income and diluted earnings per share. We disclose adjusted operating income, operating
expenses, income before income taxes, income tax expense, net income and diluted earnings per share as non-GAAP financial measurements in order to report our results exclusive of items that are
non-recurring or not core to our operating business. We believe presenting these non-GAAP financial measures provides investors with a consistent way to analyze our performance. These non-GAAP
financial measures exclude the following:
• Unrealized gains or losses on the revaluation of deferred consideration: Deferred consideration is an obligation we assumed in connection with the ETFS acquisition that is carried at fair value.
This item represents the present value of an obligation to pay fixed ounces of gold into perpetuity and is measured using forward-looking gold prices. Changes in the forward-looking price of
gold may have a material impact on the carrying value of the deferred consideration and our reported financial results. We exclude this item when calculating our non-GAAP financial
measurements as it is not core to our operating business. The item is not adjusted for income taxes as the obligation was assumed by a wholly-owned subsidiary of ours that is based in Jersey,
a jurisdiction where we are subject to a zero percent tax rate.
• Tax shortfalls and windfalls upon vesting and exercise of stock-based compensation awards: GAAP requires the recognition of tax windfalls and shortfalls within income tax expense. These
items arise upon the vesting and exercise of stock-based compensation awards and the magnitude is directly correlated to the number of awards vesting/exercised as well as the difference
between the price of our stock on the date the award was granted and the date the award vested or was exercised. We exclude these items when calculating our non-GAAP financial
measurements as they introduce volatility in earnings and are not core to our operating business.
• Interest expense from the amortization of discount arising from the bifurcation of the conversion option embedded in the convertible notes: GAAP requires convertible instruments to be
separated into their liability and equity components by allocating the issuance proceeds to each of those components. The liability component for convertible instruments that qualify for a
derivative scope exception (applicable to our convertible notes) is allocated proceeds equal to the estimated fair value of similar debt without the conversion option. The difference
between the gross proceeds received from the issuance of the convertible instrument and the proceeds allocated to the liability component represents the residual amount that is classified in
equity. The discount arising from the recognition of the residual amount classified in equity is amortized as interest expense over the life of instrument. We exclude this item when calculating
our non-GAAP financial measurements as it is non-cash and distorts our actual cost of borrowing. In addition, in August 2020, the FASB issued ASU 2020-06 Debt – Debt with Conversion and
Other Options, Cash Conversion which includes the elimination of the requirement to bifurcate conversion options qualifying for a derivative scope exception. Once effective, this interest
expense will no longer be recognized.
• Other items: Loss on extinguishment of debt, the release of a deferred tax asset valuation allowance recognized on interest carryforwards arising from our debt previously outstanding in the
United Kingdom, a gain arising from an adjustment to the estimated fair value of consideration received from the exit of our investment in AdvisorEngine, impairment charges, a gain
recognized upon sale of our Canadian ETF business and acquisition and disposition-related costs are excluded when calculating our non-GAAP financial measurements.
• Adjusted effective income tax rate. We disclose our adjusted effective income tax rate as a non-GAAP financial measurement in order to report our effective income tax rate exclusive of items that
are non-recurring or not core to our operating business. We believe reporting our adjusted effective income tax rate provides investors with a consistent way to analyze our income taxes. Our
adjusted effective income tax rate is calculated by dividing adjusted income tax expense by adjusted income before income taxes. See above for information regarding the items that are excluded.
• Gross margin and gross margin percentage. We disclose our gross margin and gross margin percentage as non-GAAP financial measurements because we believe they provide investors with a
consistent way to analyze the amount we retain after paying third-party service providers to operate our ETPs. These ratios also assist us in analyzing the profitability of our products. We define gross
margin as total operating revenues less fund management and administration expenses. Gross margin percentage is calculated as gross margin divided by total operating revenues.
• Adjusted operating income margin. We disclose adjusted operating income margin as a non-GAAP financial measurement in order to report our operating income margin exclusive of items that are
non-recurring or not core to our operating business.
1717
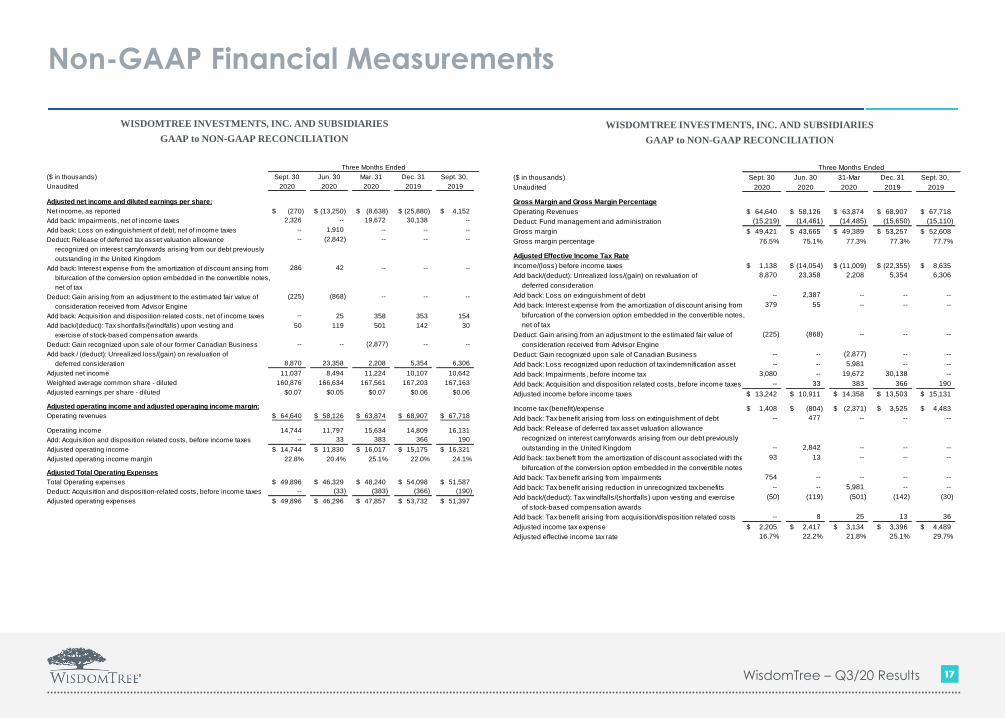
Non-GAAP Financial Measurements
WisdomTree – Q3/20 Results
WISDOMTREE INVESTMENTS, INC. AND SUBSIDIARIES
GAAP to NON-GAAP RECONCILIATION
Three Months Ended
($ in thousands) Sept. 30 Jun. 30 31-Mar Dec. 31 Sept. 30,
Unaudited 2020 2020 2020 2019 2019
Gross Margin and Gross Margin Percentage
Operating Revenues 64,640$ 58,126$ 63,874$ 68,907$ 67,718$
Deduct: Fund management and administration (15,219) (14,461) (14,485) (15,650) (15,110)
Gross margin 49,421$ 43,665$ 49,389$ 53,257$ 52,608$
Gross margin percentage 76.5% 75.1% 77.3% 77.3% 77.7%
Adjusted Effective Income Tax Rate
Income/(loss) before income taxes 1,138$ (14,054)$ (11,009)$ (22,355)$ 8,635$
Add back/(deduct): Unrealized loss/(gain) on revaluation of 8,870 23,358 2,208 5,354 6,306
deferred consideration
Add back: Loss on extinguishment of debt -- 2,387 -- -- --
Add back: Interest expense from the amortization of discount arising from 379 55 -- -- --
bifurcation of the conversion option embedded in the convertible notes,
net of tax
Deduct: Gain arising from an adjustment to the estimated fair value of (225) (868) -- -- --
consideration received from Advisor Engine
Deduct: Gain recognized upon sale of Canadian Business -- -- (2,877) -- --
Add back: Loss recognized upon reduction of tax indemnification asset -- -- 5,981 -- --
Add back: Impairments, before income tax 3,080 -- 19,672 30,138 --
Add back: Acquisition and disposition related costs, before income taxes -- 33 383 366 190
Adjusted income before income taxes 13,242$ 10,911$ 14,358$ 13,503$ 15,131$
Income tax (benefit)/expense 1,408$ (804)$ (2,371)$ 3,525$ 4,483$
Add back: Tax benefit arising from loss on extinguishment of debt -- 477 -- -- --
Add back: Release of deferred tax asset valuation allowance
recognized on interest carryforwards arising from our debt previously
outstanding in the United Kingdom -- 2,842 -- -- --
Add back: tax beneft from the amortization of discount associated with the 93 13 -- -- --
bifurcation of the conversion option embedded in the convertible notes
Add back: Tax benefit arising from impairments 754 -- -- -- --
Add back: Tax benefit arising reduction in unrecognized tax benefits -- -- 5,981 -- --
Add back/(deduct): Tax windfalls/(shortfalls) upon vesting and exercise (50) (119) (501) (142) (30)
of stock-based compensation awards
Add back: Tax benefit arising from acquisition/disposition related costs -- 8 25 13 36
Adjusted income tax expense 2,205$ 2,417$ 3,134$ 3,396$ 4,489$
Adjusted effective income tax rate 16.7% 22.2% 21.8% 25.1% 29.7%
WISDOMTREE INVESTMENTS, INC. AND SUBSIDIARIES
GAAP to NON-GAAP RECONCILIATION
Three Months Ended
($ in thousands) Sept. 30 Jun. 30 Mar. 31 Dec. 31 Sept. 30,
Unaudited 2020 2020 2020 2019 2019
Adjusted net income and diluted earnings per share:
Net income, as reported (270)$ (13,250)$ (8,638)$ (25,880)$ 4,152$
Add back: Impairments, net of income taxes 2,326 -- 19,672 30,138 --
Add back: Loss on extinguishment of debt, net of income taxes -- 1,910 -- -- --
Deduct: Release of deferred tax asset valuation allowance -- (2,842) -- -- --
recognized on interest carryforwards arising from our debt previously
outstanding in the United Kingdom
Add back: Interest expense from the amortization of discount arising from 286 42 -- -- --
bifurcation of the conversion option embedded in the convertible notes,
net of tax
Deduct: Gain arising from an adjustment to the estimated fair value of (225) (868) -- -- --
consideration received from Advisor Engine
Add back: Acquisition and disposition related costs, net of income taxes -- 25 358 353 154
Add back/(deduct): Tax shortfalls/(windfalls) upon vesting and 50 119 501 142 30
exercise of stock-based compensation awards
Deduct: Gain recognized upon sale of our former Canadian Business -- -- (2,877) -- --
Add back / (deduct): Unrealized loss/(gain) on revaluation of
deferred consideration 8,870 23,358 2,208 5,354 6,306
Adjusted net income 11,037 8,494 11,224 10,107 10,642
Weighted average common share - diluted 160,876 166,634 167,561 167,203 167,163
Adjusted earnings per share - diluted $0.07 $0.05 $0.07 $0.06 $0.06
Adjusted operating income and adjusted operaging income margin:
Operating revenues 64,640$ 58,126$ 63,874$ 68,907$ 67,718$
Operating income 14,744 11,797 15,634 14,809 16,131
Add: Acquisition and disposition related costs, before income taxes -- 33 383 366 190
Adjusted operating income 14,744$ 11,830$ 16,017$ 15,175$ 16,321$
Adjusted operating income margin 22.8% 20.4% 25.1% 22.0% 24.1%
Adjusted Total Operating Expenses
Total Operating expenses 49,896$ 46,329$ 48,240$ 54,098$ 51,587$
Deduct: Acquisition and disposition-related costs, before income taxes -- (33) (383) (366) (190)
Adjusted operating expenses 49,896$ 46,296$ 47,857$ 53,732$ 51,397$