q3/2015 quarterly report
TRANSCRIPT

July - September 2015
Q3/2015 Quarterly Report
October 28, 2015

Q3/2015 Quarterly Report
2
Wholesale market Summary
Average wholesale electricity prices in Q3/2015 have set yet another all-time low. Wholesale electricity this quarter averaged $26.09/MWh ($17.41/MWh Ext. Off Peak, $30.28/ Ext. On Peak).
This translates to approximately 3.0 ¢/kWh for residential customers who are on floating rates (excluding any retailer margin).
The recent price environment is unprecedented in Alberta’s electricity market. Of the ten lowest priced months since 2001, seven have occurred in the last 12 months. Furthermore, at $37/MWh, 2015 is the lowest year-to-date price since the market’s inception (2001).
Supply/Demand Fundamentals
Since the beginning of 2014, over a thousand megawatts of natural gas-fired generation has been added to the electricity system. Furthermore, the existing fleet has remained available at levels roughly consistent with historical levels. Finally, growth in electricity demand has slowed from more than 2% per year to less than 1% in the first half of this year, and 1.2% in Q3.
8,5
00 1
3,50
0
2008 2009 2010 2011 2012 2013 2014 2015
MW
Generation Capability, Demand (AIL) Maximum CapabilityPeak Available CapabilityPeak Demand
2014 2015 Change
Average Pool Price ($/MWh)
Jul 122.54 23.15 -81.1%
Aug 45.20 34.11 -24.5%
Sep 23.98 20.85 -13.0%
Q3 64.34 26.09 -59.4%
Average Supply
Cushion (MW)
Jul 1,985 2,296 +15.7%
Aug 1,705 2,107 +23.6%
Sep 1,854 2,284 +23.2%
Q3 1,848 2,229 +20.6%
Average Demand
(MW, AIL)
Jul 9,036 9,163 +1.4%
Aug 8,847 9,100 +2.9%
Sep 8,724 8,670 -0.6%
Q3 8,871 8,981 +1.2%
Average Wind
Generation (MW)
Jul 303 319 +5.3%
Aug 236 342 +45.0%
Sep 392 455 +16.3%
Q3 309 371 +20.0%
Average BC/MATL Combined ATC (MW)
Jul 581 825 +42.0%
Aug 605 824 +36.3%
Sep 303 810 +167.7%
Q3 498 820 +64.6%
Average Natural
Gas Price ($/GJ)
Jul 3.90 2.71 -30.6%
Aug 3.74 2.80 -25.2%
Sep 3.78 2.75 -27.3%
Q3 3.81 2.75 -27.7%

Q3/2015 Quarterly Report
3
ATC in Q3/15
The ATC values in the summary table presented on the first page may be higher than what could have been scheduled in real-time since current AESO procedures assume full contracted LSSi availability unless high import schedules materialize and the actual offered LSSi or unanticipated transmission constraints become limiting factors. The accuracy of ATC postings is something the MSA commented upon in its Q4/14 report. Recently, the AESO held a meeting with stakeholders concerning the accuracy of ATC postings and possible improvements. It has proposed a number of enhancements to be implemented in the near future.1
Imports/Exports
During Q3/2015 Alberta was a net exporter of electricity due in large part to relatively low pool prices in Alberta. Alberta has been a net importer of electricity for several years.
1 http://www.aeso.ca/downloads/Cover_Letter_for_Sept_1_Workshop_Comment_Matrix.pdf
-0.8% -0.3%
-1.5%
+2.3%
+1.0%
+2.6% +3.1%
+3.7%
+5.2%
+0.9%
+3.7%
+0.6%
+1.5%
+3.0%
+1.7%
+4.5%
+2.3% +2.9%
+2.0%
+2.7%
+4.4%
+2.8% +3.3%
+2.3%
+0.4% +0.8%
+1.2%
Qtr
1Q
tr2
Qtr
3Q
tr4
Qtr
1Q
tr2
Qtr
3Q
tr4
Qtr
1Q
tr2
Qtr
3Q
tr4
Qtr
1Q
tr2
Qtr
3Q
tr4
Qtr
1Q
tr2
Qtr
3Q
tr4
Qtr
1Q
tr2
Qtr
3Q
tr4
Qtr
1Q
tr2
Qtr
3
2009 2010 2011 2012 2013 2014 2015
Change in Demand (AIL) Year-over-Year
-500
050
01,
000
1,50
0
Qtr
1Q
tr2
Qtr
3Q
tr4
Qtr
1Q
tr2
Qtr
3Q
tr4
Qtr
1Q
tr2
Qtr
3Q
tr4
Qtr
1Q
tr2
Qtr
3Q
tr4
Qtr
1Q
tr2
Qtr
3Q
tr4
Qtr
1Q
tr2
Qtr
3Q
tr4
Qtr
1Q
tr2
Qtr
3Q
tr4
Qtr
1Q
tr2
Qtr
3
2008 2009 2010 2011 2012 2013 2014 2015
GW
h
Net Imports (GWh), 2008 - 2015

Q3/2015 Quarterly Report
4
Imports and exports generally follow a predictable pattern each day. During a typical day Alberta imports electricity in on-peak hours and exports electricity in off-peak hours. Off-peak prices are typically much less than on-peak prices in Alberta. The character of imports and exports from Alberta is a result of the differing generation technologies available. With hydro generation stations and associated reservoir storage, jurisdictions such as British Columbia are often able to sell electricity to Alberta when pool prices are relatively high and buy electricity from Alberta when pool prices are relatively low. This cycle benefits consumers in Alberta because it provides them access to cheaper imports when the pool price is high without having to pay for the construction of the hydro stations or reservoirs. Generators in Alberta benefit by accessing higher priced markets outside Alberta when the pool price is low.
High Price Event: August 10 and 11
In a quarter characterized by low prices, the period from August 10 to 11 was an exception, with an average price during extended on-peak hours of $242.10/MWh. Average supply cushion during those hours was in excess of 1,300 MW, the lowest value being around 800 MW. During hours when the pool price exceeded $100/MWh, one market participant controlled an average of over 55% (approximately 700 MW) of the undispatched supply remaining in the merit order. Overall, this brief period of high prices did not contribute a significant amount to the quarterly average. Excluding August 10 and 11, Q3 averaged $22.95/MWh, or approximately $3/MWh less.
AUC Proceeding 3110
Following the release of AUC Decision 3110-D01-2015 in July 2015, the MSA filed an application with the Alberta Utilities Commission (AUC) on September 30, 2015 requesting the issuance of a Consent Order that would conclude the proceeding. On October 21, 2015 the AUC issued a letter stating that it has sufficient information to proceed without further submissions or an oral hearing. The AUC will issue its decision in due course.
-300
-200
-100
010
020
030
040
0
1 2 3 4 5 6 7 8 9 10 11 12 13 14 15 16 17 18 19 20 21 22 23 24
Expo
rts
----
Im
port
s (M
W)
Hour Ending
2015 Q32014 Q3
Average Net Imports by Hour of the Day, Q3 2014/2015

Q3/2015 Quarterly Report
5
Joint Venture Agreements – Potential Contravention of the Fair, Efficient and Open Competition Regulation
In June 2015 the MSA became aware of an agreement between two joint venture partners that appeared to allow discussions of future offer strategy and forward sales. If such sharing of information occurred, it would likely contravene section 3 of the FEOC Regulation. The parties submitted to the MSA that the agreement provided a general requirement to comply with applicable laws and that offer information had not been shared. Based on a review of relevant records obtained through a targeted information request, the MSA was satisfied that no sharing of competitively sensitive information had occurred. In addition, the MSA tested potential theories of harm and was satisfied that the offer quantities and prices did not provide evidence of coordinated behaviour.
The MSA remained concerned, however, that an agreement with language that allowed or appeared to allow conduct inconsistent with a competitive market was in force. The parties agreed to modify the agreement to address the MSA’s concerns. The modified agreement commits the parties to compliance with relevant laws and regulations and to investigate and report any instances of non-compliance. The MSA did not proceed to a formal investigation because it was satisfied that the parties had not contravened the FEOC Regulation and that the revised agreement would support fair, efficient and open competition in the market on an ongoing basis.
The MSA encourages all market participants to regularly review all agreements to ensure compliance with all current laws and regulations. The agreement at issue in this case pre-dated the FEOC Regulation, but had not been modified after the introduction of the regulation. It is the MSA’s view that, irrespective of whether the written agreement or policy is followed in practice, all agreements and policies should promote compliance with relevant regulations and laws.

Q3/2015 Quarterly Report
6

Q3/2015 Quarterly Report
7
Forward market Liquidity is down significantly compared to Q2/15, and down somewhat from Q3/14. Q2/15 featured a relatively high number of annual trades, much higher than in other quarters. The volumes involved in annual trades are typically very large. Effectively, the uptick in market liquidity observed in Q2/15 was not sustained.
Volume Traded by Contract Term (TWh) Daily Monthly Quarterly Yearly Other Total
2014
Qtr1 0.3 8.4 1.0 2.0 0.7 12.4 Qtr2 0.2 6.8 0.7 3.6 0.2 11.6 Qtr3 0.3 6.9 2.4 3.4
13.1
Qtr4 0.3 6.7 1.9 1.5 10.4
2015 Qtr1 0.5 9.0 0.5 1.7 0.3 12.1 Qtr2 0.8 9.4 1.0 13.0
24.3
Qtr3 0.3 5.8 0.5 3.0 9.6
As of the end of Q3/15, the price outlook in the forward market remained at historical lows. Q4/15 monthly contracts averaged $37/MWh, while 2016 monthly contracts averaged $39/MWh for the year.

Q3/2015 Quarterly Report
8
Retail market Regulated Retail Rates
July and August Regulated Retail Option (RRO) rates were higher than May and June because the forward prices on which RRO rates are based were higher in July and August than in the earlier months.
The RRO rates provided by Direct Energy and ENMAX in July and August were particularly high compared to those provided by EPCOR (including in the FortisAlberta service zone). This is because the RRO rates provided by EPCOR are based on forward market prices in the 120-day window leading into the month while the RRO rates provided by Direct Energy and ENMAX are based on forward market prices in the 45-day window leading into the month. As such, the RRO rates provided by Direct Energy and ENMAX were affected relatively more by high forward prices for July and August in the 45 days leading into each month.
34
56
78
910
1112
Oct-13 Jan-14 Apr-14 Jul-14 Oct-14 Jan-15 Apr-15 Jul-15 Oct-15
¢/kW
h
Month / Year
DirectENMAXEPCORFortisAlberta

Q3/2015 Quarterly Report
9
For both September and October, the relatively flat trend of forward prices across the 120 days leading into each month largely explains why the RRO rates for these months were similar across providers.
Status of Energy Price Setting Plans
On March 10, 2015 the AUC reached a decision in Proceeding 2941 regarding generic Energy Price Setting Plans (EPSPs). On May 8, 2015 Direct Energy Regulated Services (DERS) and EPCOR Energy Alberta GP Inc. (EPCOR) applied to the AUC seeking review and variance of the decision; on June 10, 2015 the Utilities Consumer Advocate (UCA) similarly sought review and variance of the decision. On September 3 and 11, respectively, the AUC denied each request.
Looking forward, the MSA will continue to follow the status of the EPSP in preparation for implementation as part of our on-going retail market monitoring programme.
Code of Conduct transition from MSA to AUC
The new Code of Conduct Regulation (CoC Regulation) (AR58/2015) transfers certain responsibilities related to the administration of the electricity code from the MSA to the AUC. The new CoC Regulation enters into force on January 1, 2016 and provides one year to complete the transition. The MSA is pleased to be actively working with the AUC to ensure an orderly transition.

Q3/2015 Quarterly Report
10
Operating reserves The total cost of operating reserves in Q3/15 fell by almost seventy percent compared with the same quarter last year – roughly in line with the quarter-over-quarter drop in pool prices. Similar to Q2/15, the noteworthy item in Q3/15 is the high cost of activating standby spinning and supplemental reserves. The average cost of these products was in excess of $200/MWh; the same situation as occurred last quarter. The total cost of these products rose from <1% of total OR cost in Q3/14 to 23% in Q3/15.
Standby reserves are activated for many different reasons mainly to do with unavailability of contracted active reserves and differences between day-ahead and real time in the supply demand conditions. When the AESO forecasts a likelihood of significant volumes of imports for a number of hours in the next day it will increase the amount of active contingency reserves in anticipation. When less certain or when the need is expected to be for just a few hours, it will buy more standby contingency reserves. In real time, if required and if available, system controllers will activate standby contingency reserves to support high levels of imports.
There are potentially two issues here. One is the pricing mechanism for standby reserves that can yield seemingly inefficient outcomes on occasion. In 2015, approximately 70% of standby reserve (by volume) had an activation price higher than the prevailing pool price. The second issue is the use of these standby reserves to enable higher volumes of imports in the current operating procedures. We will look briefly
Total Cost of Operating Reserves ($ Millions) Q3 2014 Q3 2015 Change Active Procured 69.9 15.4 -77.9%
RR 15.3 7.0 -54.0% SR 30.4 5.8 -81.1% SUP 24.1 2.6 -89.1%
Standby Activated 0.9 5.7 +549.9% RR 0.3 0.2 -35.6% SR 0.4 3.6 +703.8% SUP 0.1 2.0 +1248.0%
Standby Premiums 4.3 2.8 -35.8% RR 1.1 1.0 -3.8% SR 2.5 1.4 -42.5% SUP 0.8 0.3 -59.3%
Total 75.1 23.9 -68.1%
Total Volume of Operating Reserves (GWh) Q3 2014 Q3 2015 Change Active Procured 1,542.5 1,304.6 -15.4%
RR 346.7 346.1 -0.2% SR 597.8 479.5 -19.8% SUP 598.0 479.1 -19.9%
Standby Activated 13.8 26.2 +90.1% RR 1.8 1.5 -19.3% SR 8.5 15.5 +81.3% SUP 3.4 9.3 +169.1%
Standby Premiums 545.0 540.1 -0.9% RR 219.8 219.9 +0.1% SR 231.2 237.2 +2.6% SUP 93.9 83.0 -11.6%
Total 2,101.2 1,870.9 -11.0%
Average Operating Reserves Costs ($/MWh) Q3 2014 Q3 2015 Change Active Procured 45.29 11.82 -73.9%
RR 44.18 20.35 -53.9% SR 50.90 12.02 -76.4% SUP 40.32 5.47 -86.4%
Standby Activated 63.80 218.11 +241.9% RR 160.95 128.43 -20.2% SR 52.10 231.04 +343.4% SUP 42.05 210.59 +400.9%
Standby Premiums 7.94 5.15 -35.2% RR 4.92 4.73 -3.8% SR 10.75 6.03 -43.9% SUP 8.11 3.73 -54.0%
Total 35.72 12.78 -64.2%
Q3/2015 Quarterly Report
11
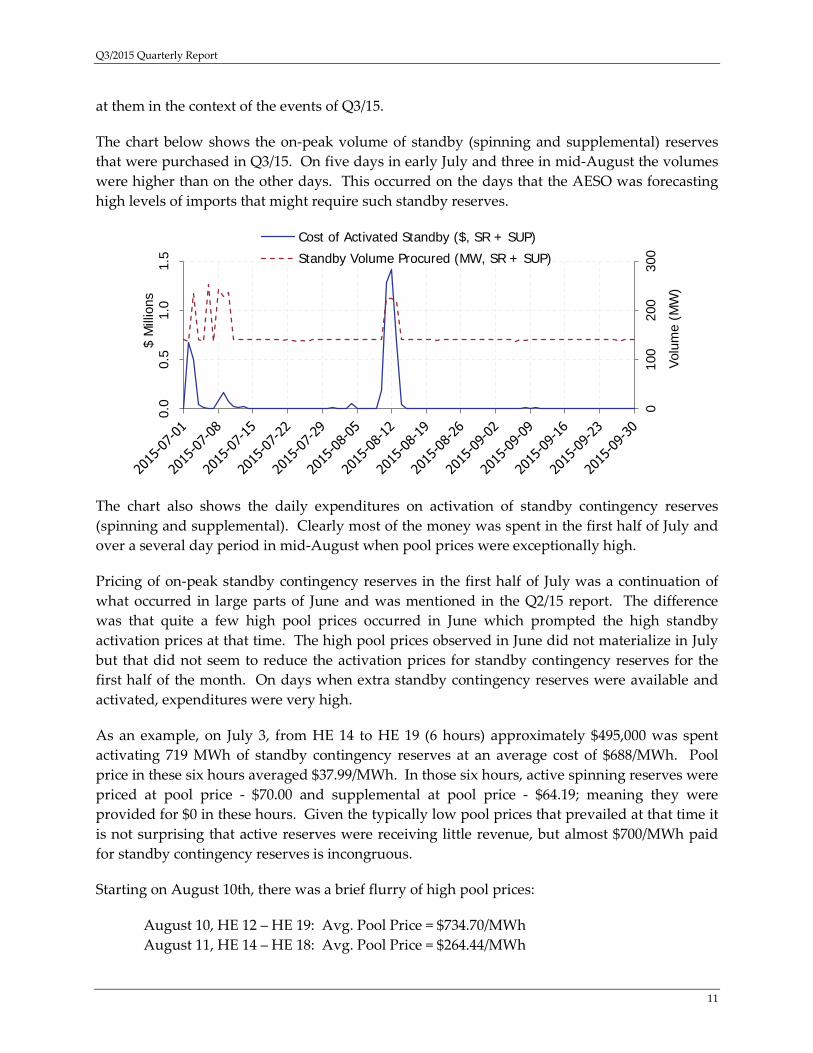
at them in the context of the events of Q3/15.
The chart below shows the on-peak volume of standby (spinning and supplemental) reserves that were purchased in Q3/15. On five days in early July and three in mid-August the volumes were higher than on the other days. This occurred on the days that the AESO was forecasting high levels of imports that might require such standby reserves.
The chart also shows the daily expenditures on activation of standby contingency reserves (spinning and supplemental). Clearly most of the money was spent in the first half of July and over a several day period in mid-August when pool prices were exceptionally high.
Pricing of on-peak standby contingency reserves in the first half of July was a continuation of what occurred in large parts of June and was mentioned in the Q2/15 report. The difference was that quite a few high pool prices occurred in June which prompted the high standby activation prices at that time. The high pool prices observed in June did not materialize in July but that did not seem to reduce the activation prices for standby contingency reserves for the first half of the month. On days when extra standby contingency reserves were available and activated, expenditures were very high.
As an example, on July 3, from HE 14 to HE 19 (6 hours) approximately $495,000 was spent activating 719 MWh of standby contingency reserves at an average cost of $688/MWh. Pool price in these six hours averaged $37.99/MWh. In those six hours, active spinning reserves were priced at pool price - $70.00 and supplemental at pool price - $64.19; meaning they were provided for $0 in these hours. Given the typically low pool prices that prevailed at that time it is not surprising that active reserves were receiving little revenue, but almost $700/MWh paid for standby contingency reserves is incongruous.
Starting on August 10th, there was a brief flurry of high pool prices:
August 10, HE 12 – HE 19: Avg. Pool Price = $734.70/MWh August 11, HE 14 – HE 18: Avg. Pool Price = $264.44/MWh
010
020
030
0
0.0
0.5
1.0
1.5
Volu
me
(MW
)
$ M
illio
ns
Cost of Activated Standby ($, SR + SUP)
Standby Volume Procured (MW, SR + SUP)

Q3/2015 Quarterly Report
12
August 12, HE 17: Avg. Pool Price = $347.77/MWh
Activation prices for standby reserves rose significantly on August 10th and continued until August 14th. On August 11th, 12th and 13th the AESO purchased additional standby reserves in anticipation of increased imports. Over those three days, standby activations due to the BC/MATL Interconnection becoming the single largest contingency occurred in the following hours:
August 11, HE 12 – HE 20 August 12, HE 11 – HE 21 August 13, HE 13 – HE 17
The activations occurred in high and moderate pool price environments. The prices paid for these activations were exceptionally high – mostly well over $500/MWh. In most hours this price was higher than the prevailing pool price (pool price averaged $89.80/MWh over these 25 hours). Active spinning and supplemental reserves meanwhile were paid a discount to pool price over the applicable hours.
Over this period, high activation prices indicates sellers were anticipating high pool prices.. Most of the time, pool prices were not high at the time of the activations. Further, for several days, extra standby was purchased and activated at the high prevailing prices to enable increased imports when the BC/MATL Interconnection was the largest contingency.

Q3/2015 Quarterly Report
13
Compliance From January 1st to September 30th, 2015, the MSA closed out 314 ISO Rules compliance matters. In this period, 30 notices of specified penalty were issued totaling a financial amount of $32,500.
For Alberta Reliability Standards, the MSA closed 47 matters year-to-date. Two notices of specified penalty were paid and considered closed as of the end of Q3 2015 with a total financial amount of $6,500. One additional notice of specified penalty was issued but remains open at the end of the quarter pending completion of a mitigation plan.
010
2030
4050
6070
8090
201.
320
1.4
201.
720
2.4
203.
120
3.3
203.
420
3.6
205.
320
5.4
205.
520
5.6
205.
83.
6.2
301.
230
3.1
304.
430
6.4
306.
530
6.6
502.
150
2.8
505.
350
5.4
6.5.
39.
1.5
OPP
401
OPP
403
UnresolvedNSPForbearance
010
2030
4050
6070
8090
BAL-
004-
AB-1
BAL-
005-
AB-0
.2b
CIP-
001-
AB1-
1
COM
-001
-AB1
-1.1
COM
-002
-AB1
-2a
EOP-
001-
AB-2
b
FAC-
003-
AB1-
1
INT-
009-
AB-1
IRO
-005
-AB-
3.1a
PRC-
001-
AB1-
1
PRC-
023-
AB-2
VAR-
001-
AB-1
aUnresolved
NSP
Forberance

Q3/2015 Quarterly Report
14
MSA activities and releases • Application for Consent Order 3110 (2015-09-30)
• Notice re MSA Stakeholder Meeting (2015-09-18)
• Notice re Employment Opportunity - Legal Counsel / Senior Legal Counsel (2015-09-02)
• MSA 2015 Second Quarter Report (2015-09-02)
• Notice re: Phase 2 AUC (2015-08-04)
• Forbearance Letter re AESO Compliance per ISO Rule Section 205.4 (2015-07-31)
• AUC Decision 3110-D01-2015 (2015-07-28)

The Market Surveillance Administrator is an independent enforcement agency that protects and promotes the fair, efficient and openly competitive operation of Alberta’s wholesale electricity markets and its retail electricity and natural gas markets. The MSA also works to ensure that market participants comply with the Alberta Reliability Standards and the Independent System Operator’s rules.