q3/9m 2018 results presentation - the navigator...
TRANSCRIPT
October 30th 2018
Q3/9M 2018
Results Presentation
1
<<
Executive Directors
Diogo da Silveira
António Redondo
Fernando Araújo
Nuno Santos
João Paulo Oliveira
Investor Relations Joana Appleton
PARTICIPATION
Q3/9M 2018 RESULTS PRESENTATION
OutlookMarket Outlook
Main Highlights
Group Performance
01 02 03 04
<<
2
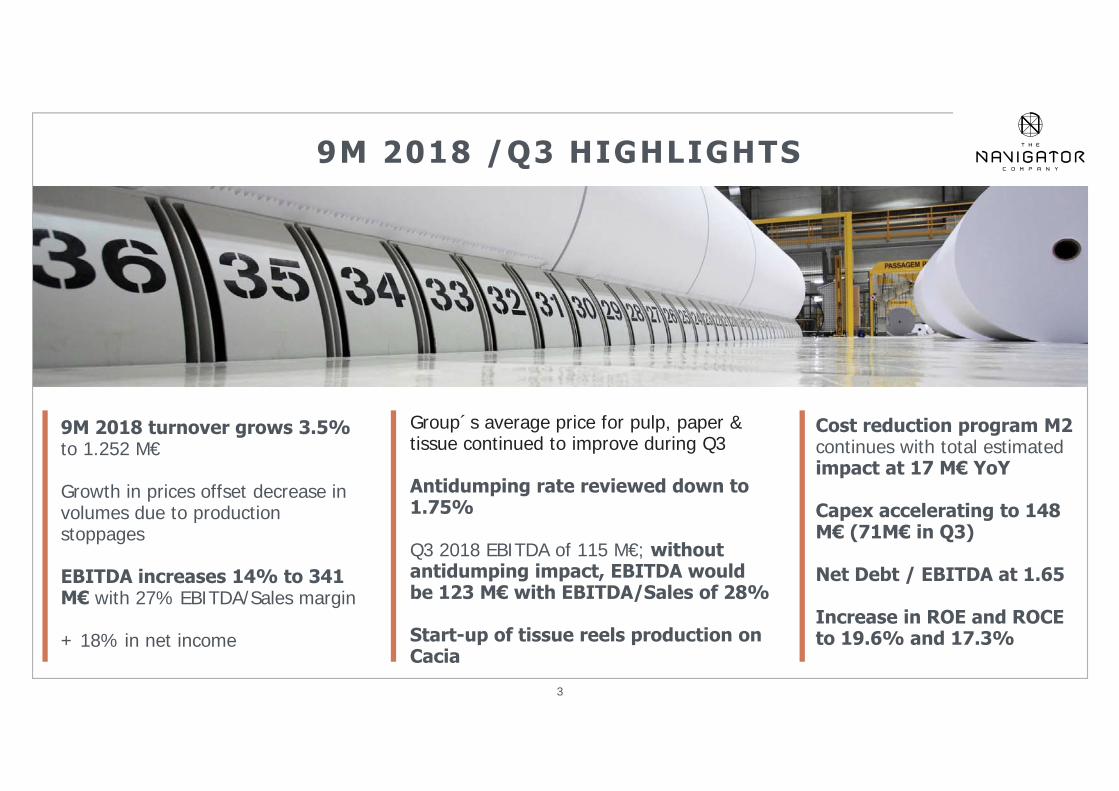
9M 2018 turnover grows 3.5% to 1.252 M€
Growth in prices offset decrease in volumes due to production stoppages
EBITDA increases 14% to 341 M€ with 27% EBITDA/Sales margin
+ 18% in net income
Group´s average price for pulp, paper & tissue continued to improve during Q3
Antidumping rate reviewed down to 1.75%
Q3 2018 EBITDA of 115 M€; without antidumping impact, EBITDA would be 123 M€ with EBITDA/Sales of 28%
Start-up of tissue reels production on Cacia
Cost reduction program M2 continues with total estimated impact at 17 M€ YoY
Capex accelerating to 148 M€ (71M€ in Q3)
Net Debt / EBITDA at 1.65
Increase in ROE and ROCE to 19.6% and 17.3%
3
9M 2018 /Q3 HIGHLIGHTS <<
OutlookMarket Outlook
Main Highlights
Group Performance
01 02 03 04
<<
4
Q3/9M 2018 RESULTS PRESENTATION
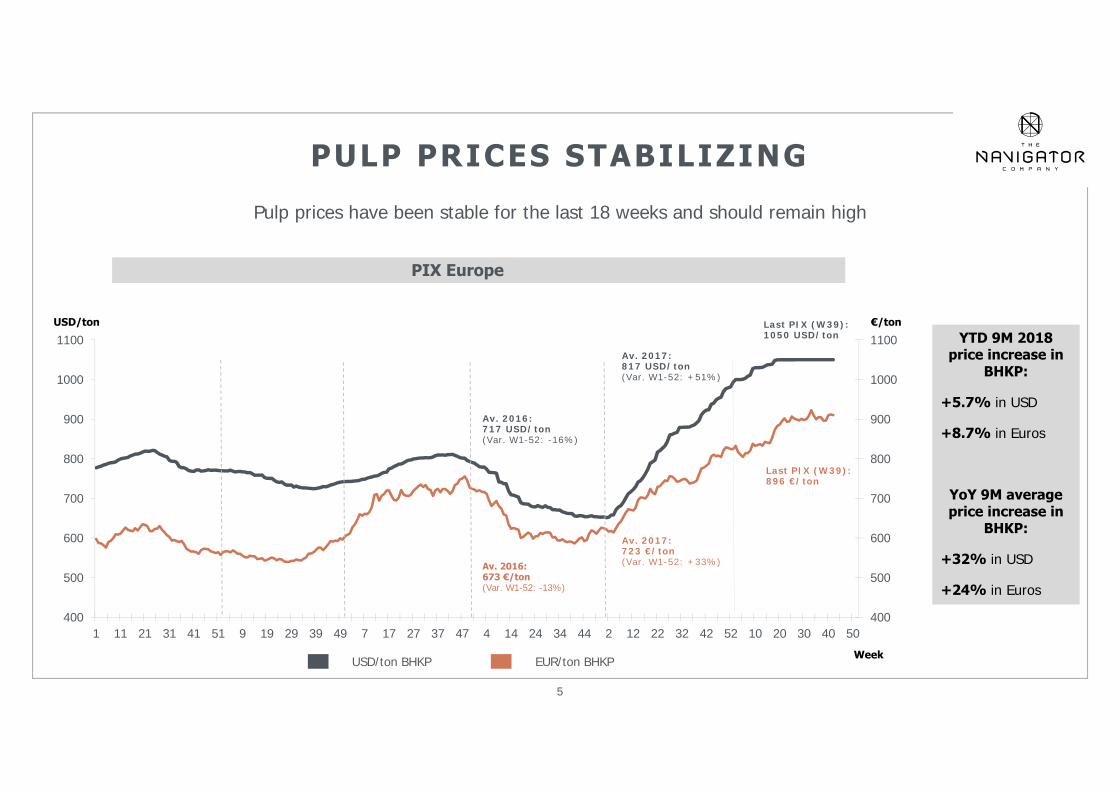
PIX Europe
400
500
600
700
800
900
1000
1100
400
500
600
700
800
900
1000
1100
1 11 21 31 41 51 9 19 29 39 49 7 17 27 37 47 4 14 24 34 44 2 12 22 32 42 52 10 20 30 40 50
USD/ton BHKP EUR/ton BHKP
USD/ton €/ton
Av. 2016:673 €/ton(Var. W1-52: -13%)
Av. 2017:723 €/ton(Var. W1-52: +33%)
Last PIX (W39):896 €/ton
Av. 2016:717 USD/ton(Var. W1-52: -16%)
Av. 2017:817 USD/ton(Var. W1-52: +51%)
Last PIX (W39):1050 USD/ton
Week
5
<<PULP PRICES STABILIZING
YTD 9M 2018 price increase in
BHKP:
+5.7% in USD
+8.7% in Euros
YoY 9M average price increase in
BHKP:
+32% in USD
+24% in Euros
Pulp prices have been stable for the last 18 weeks and should remain high
6
<<
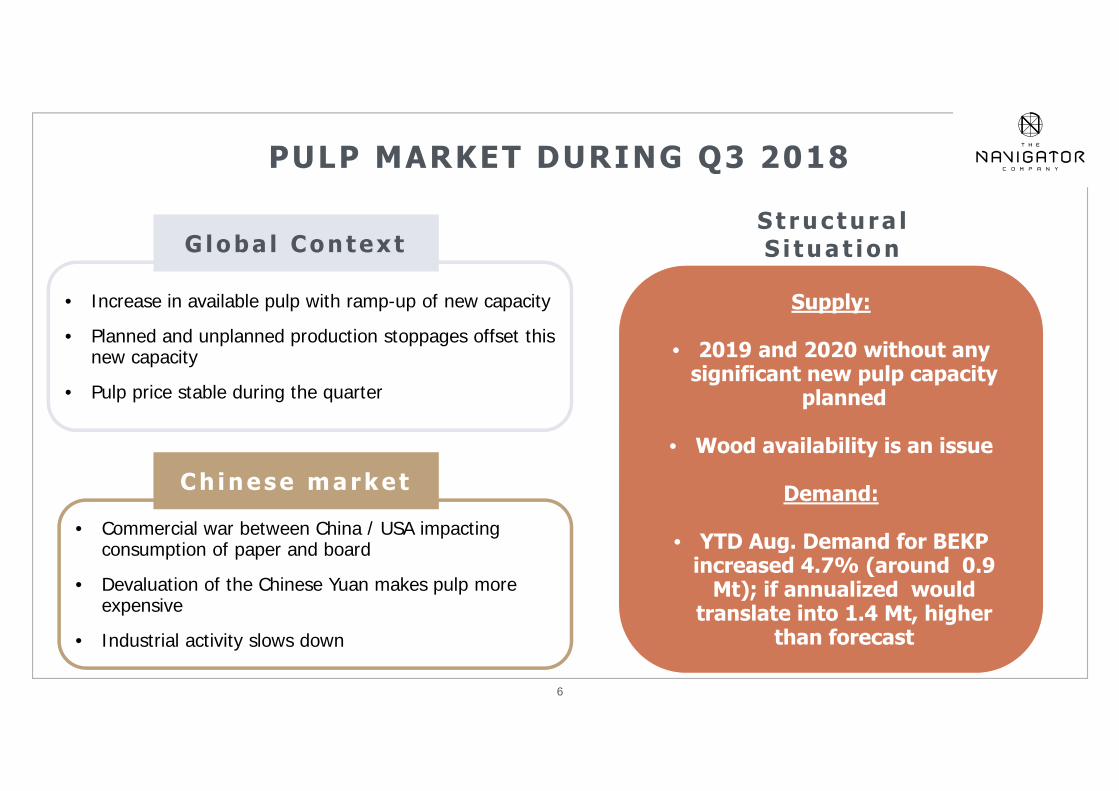
• Commercial war between China / USA impacting consumption of paper and board
• Devaluation of the Chinese Yuan makes pulp more expensive
• Industrial activity slows down
C h i n e s e m a r k e t
• Increase in available pulp with ramp-up of new capacity
• Planned and unplanned production stoppages offset this new capacity
• Pulp price stable during the quarter
G l o b a l C o n t e x t
Supply:
• 2019 and 2020 without anysignificant new pulp capacity
planned
• Wood availability is an issue
Demand:
• YTD Aug. Demand for BEKP increased 4.7% (around 0.9
Mt); if annualized wouldtranslate into 1.4 Mt, higher
than forecast
S t r u c t u r a l S i t u a t i o n
PULP MARKET DURING Q3 2018
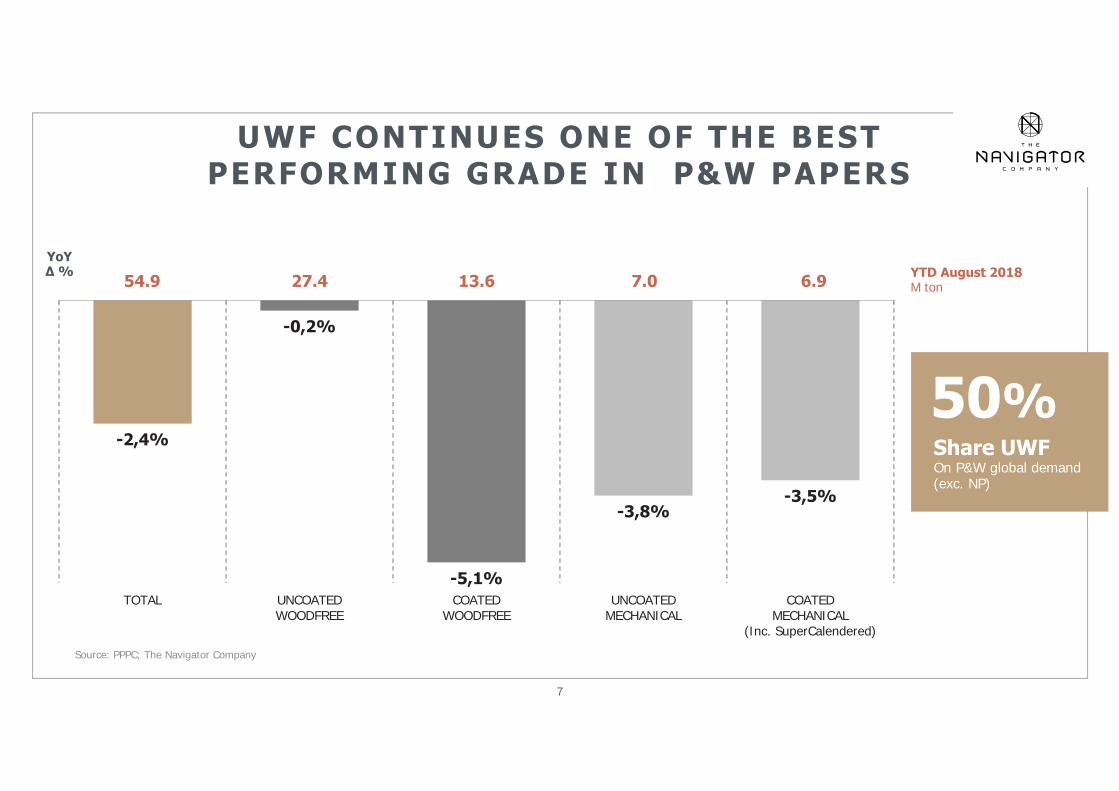
Source: PPPC; The Navigator Company
Share UWF On P&W global demand (exc. NP)
50%
Source: PPPC; The Navigator Company
7
<<UWF CONTINUES ONE OF THE BEST PERFORMING GRADE IN P&W PAPERS
-2,4%
-0,2%
-5,1%
-3,8%-3,5%
TOTAL UNCOATEDWOODFREE
COATEDWOODFREE
UNCOATEDMECHANICAL
COATEDMECHANICAL
(Inc. SuperCalendered)
54.9 27.4 13.6 7.0 6.9 YTD August 2018M ton
YoY∆ %
<<
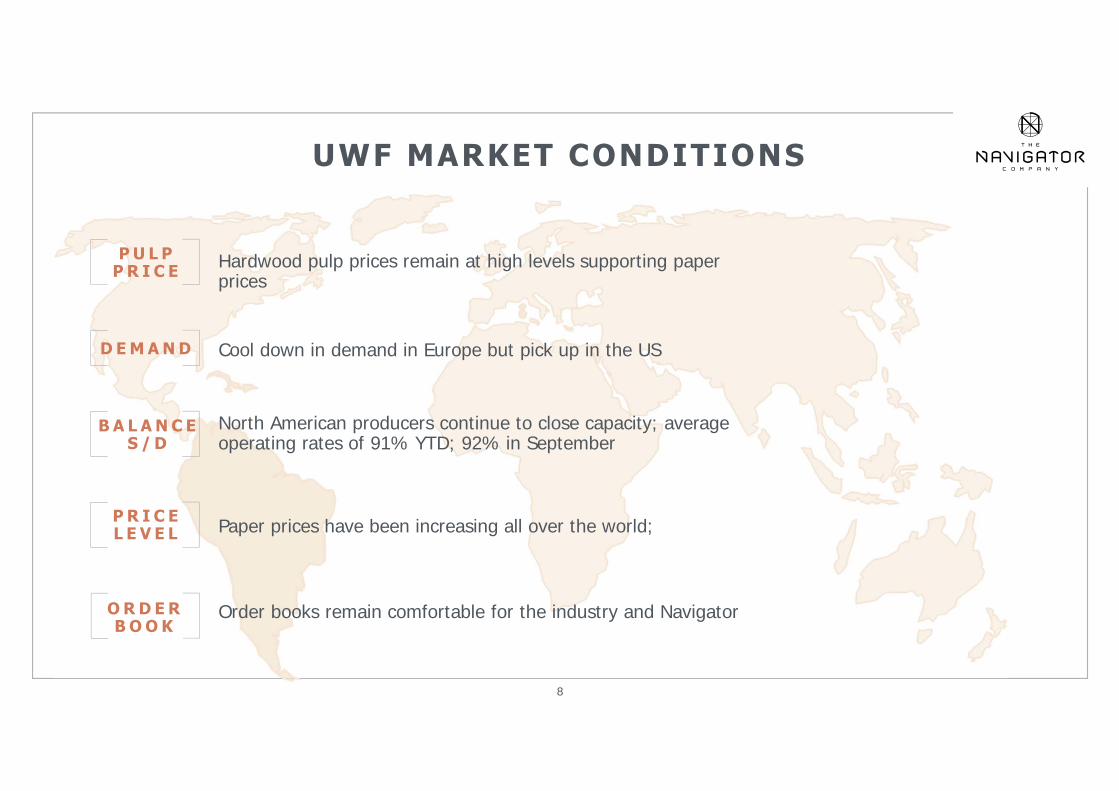
8
UWF MARKET CONDITIONS
D E M A N D
P U L P P R I C E
Cool down in demand in Europe but pick up in the US
Hardwood pulp prices remain at high levels supporting paper prices
North American producers continue to close capacity; average operating rates of 91% YTD; 92% in September
Paper prices have been increasing all over the world;
B A L A N C ES / D
P R I C EL E V E L
Order books remain comfortable for the industry and NavigatorO R D E R B O O K
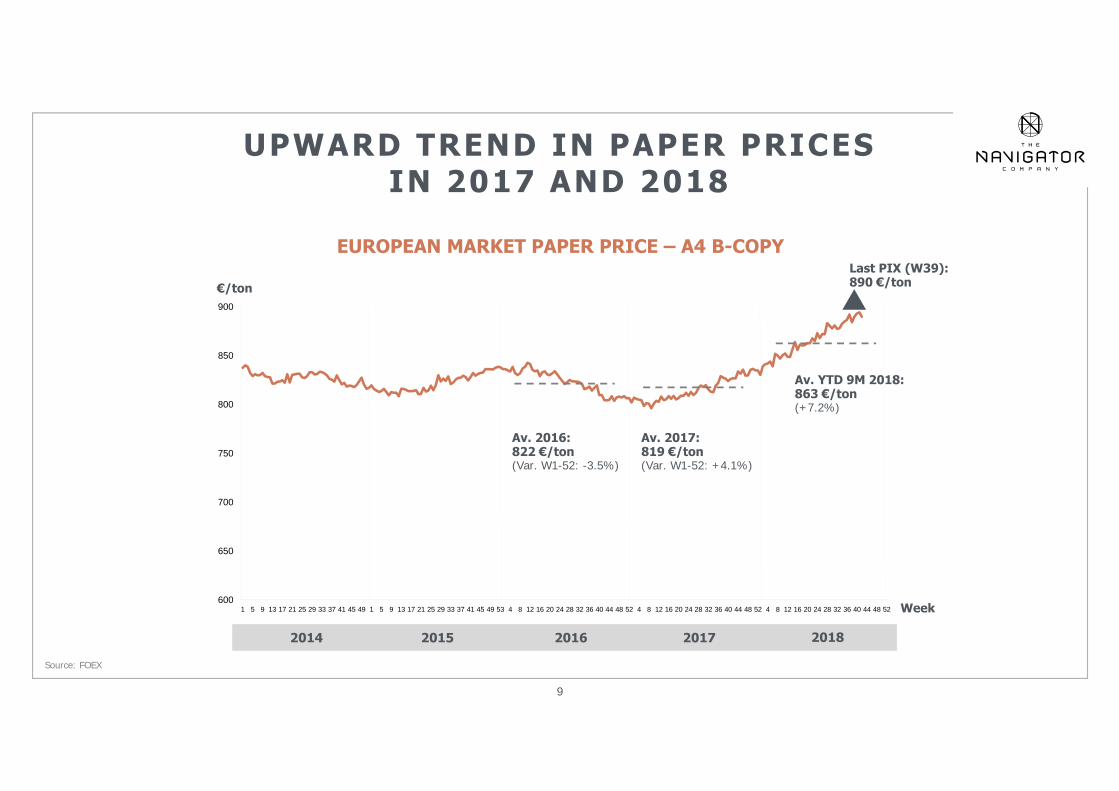
Source: FOEX
EUROPEAN MARKET PAPER PRICE – A4 B-COPY
2014 20162015 2017 2018
600
650
700
750
800
850
900
1 5 9 13 17 21 25 29 33 37 41 45 49 1 5 9 13 17 21 25 29 33 37 41 45 49 53 4 8 12 16 20 24 28 32 36 40 44 48 52 4 8 12 16 20 24 28 32 36 40 44 48 52 4 8 12 16 20 24 28 32 36 40 44 48 52
€/ton
Week
Last PIX (W39):890 €/ton
Av. 2016:822 €/ton(Var. W1-52: -3.5%)
Av. 2017:819 €/ton(Var. W1-52: +4.1%)
Av. YTD 9M 2018:863 €/ton(+7.2%)
9
<<UPWARD TREND IN PAPER PRICES IN 2017 AND 2018
OultookMarket Outlook
Main Highlights
Group Performance
01 02 03 04
<<
10
Q3/9M 2018 RESULTS PRESENTATION
11
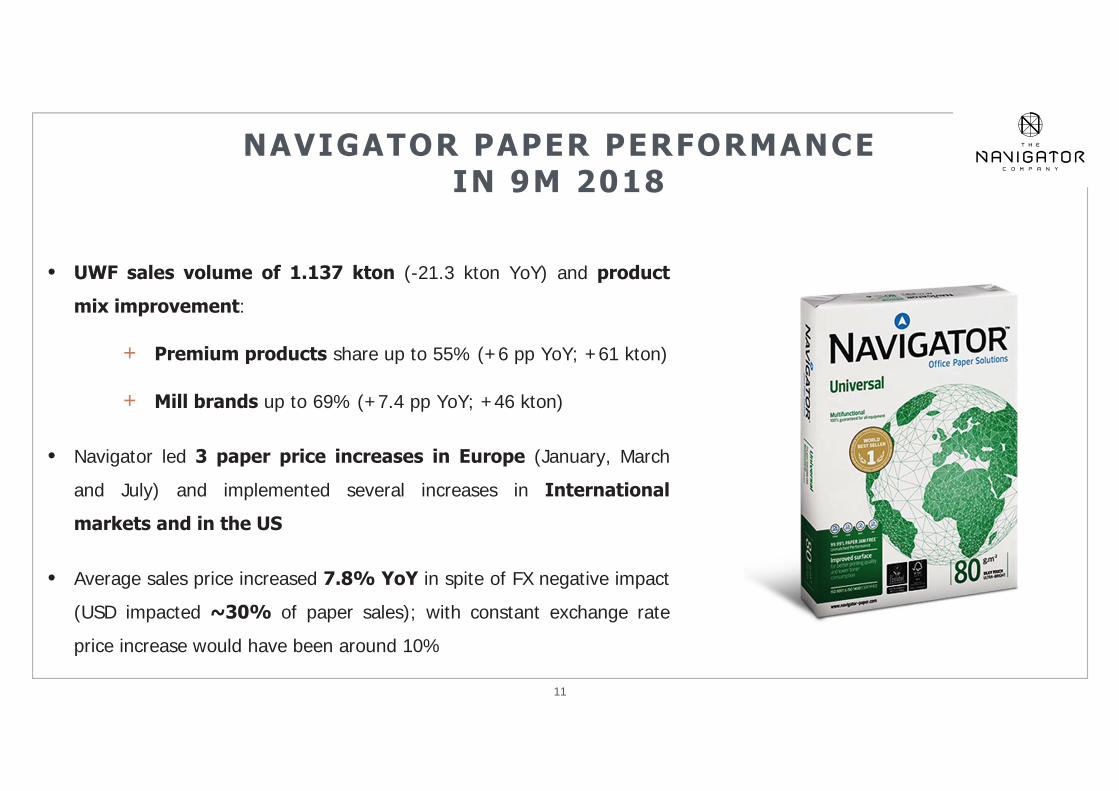
<<NAVIGATOR PAPER PERFORMANCE IN 9M 2018
• UWF sales volume of 1.137 kton (-21.3 kton YoY) and product
mix improvement:
+ Premium products share up to 55% (+6 pp YoY; +61 kton)
+ Mill brands up to 69% (+7.4 pp YoY; +46 kton)
• Navigator led 3 paper price increases in Europe (January, March
and July) and implemented several increases in International
markets and in the US
• Average sales price increased 7.8% YoY in spite of FX negative impact
(USD impacted ~30% of paper sales); with constant exchange rate
price increase would have been around 10%
12
<<PULP TURNOVER IMPACTED BY REDUCTION IN VOLUME
• Pulp sales in volume of 177 kton, 74 kton less YoY due to
decreased availability of pulp:
+ Start of the year with no pulp stocks available
+ Maintenance downtime at Setúbal pulp mill in Q1
+ Extensive downtime for planned maintenance and
capacity increase in Figueira da Foz in Q2, with the
need to build up inventory
• Navigator’s net price in 9M 2018 increased +24% YoY
• Improvement in the weight of Decor and Special paper sales in
Europe, high contribution segments, from 57% to 76% YOY
13
<<
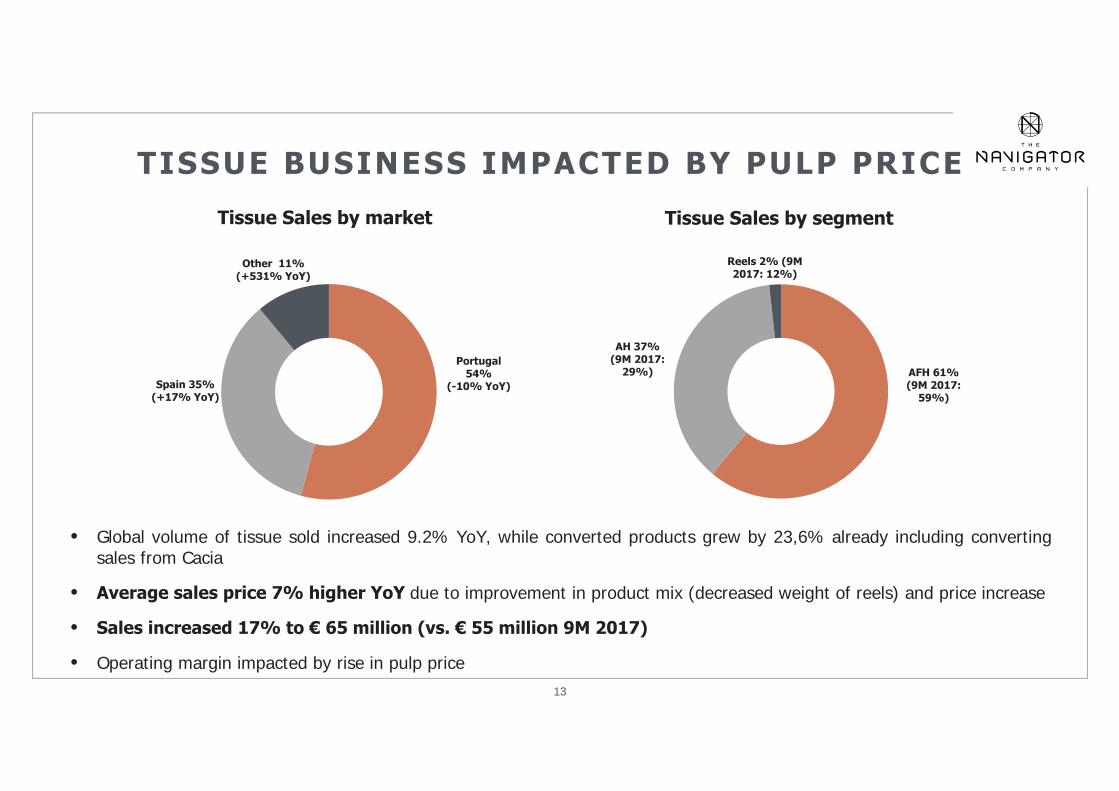
TISSUE BUSINESS IMPACTED BY PULP PRICE
• Global volume of tissue sold increased 9.2% YoY, while converted products grew by 23,6% already including convertingsales from Cacia
• Average sales price 7% higher YoY due to improvement in product mix (decreased weight of reels) and price increase
• Sales increased 17% to € 65 million (vs. € 55 million 9M 2017)
• Operating margin impacted by rise in pulp price
AFH 61%(9M 2017:
59%)
AH 37%(9M 2017:
29%)
Reels 2% (9M 2017: 12%)
Tissue Sales by segment
Portugal 54%
(-10% YoY)Spain 35%(+17% YoY)
Other 11%(+531% YoY)
Tissue Sales by market
Note
14
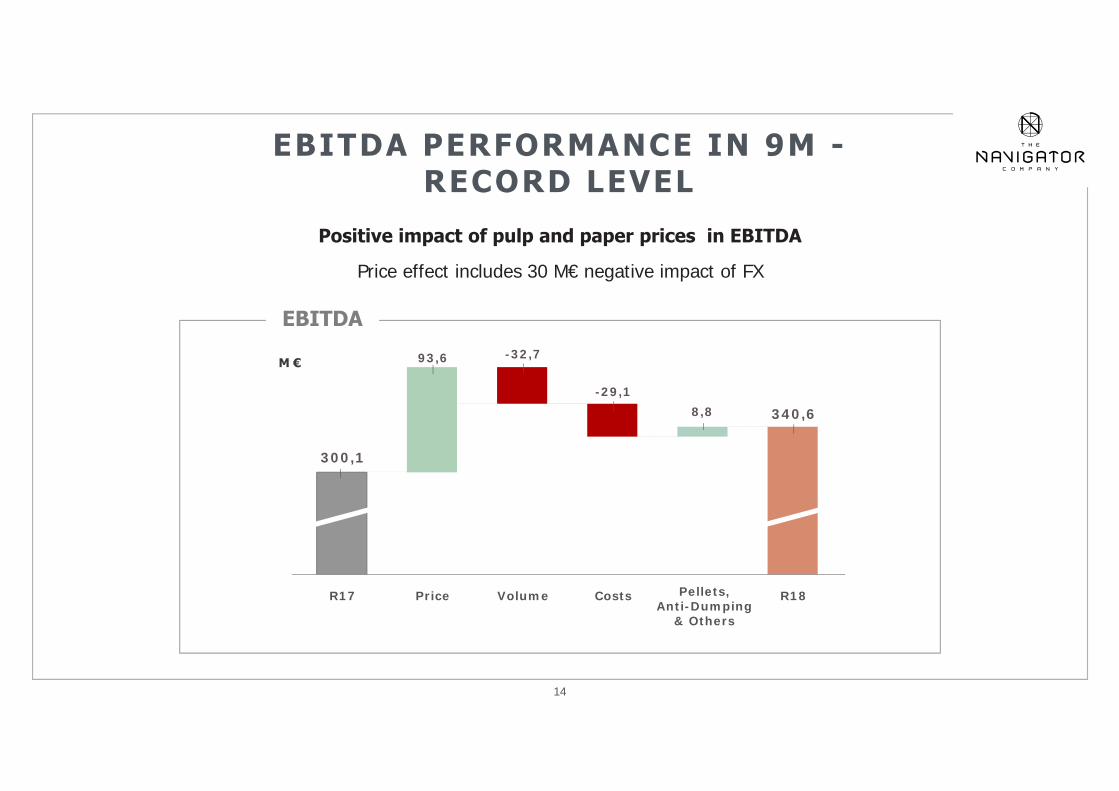
<<EBITDA PERFORMANCE IN 9M -RECORD LEVEL
Positive impact of pulp and paper prices in EBITDA
Price effect includes 30 M€ negative impact of FX
93,6
8,8
Volume
300,1
R17 Price
-32,7
-29,1
Costs Pellets, Anti-Dumping
& Others
340,6
R18
EBITDA
M €
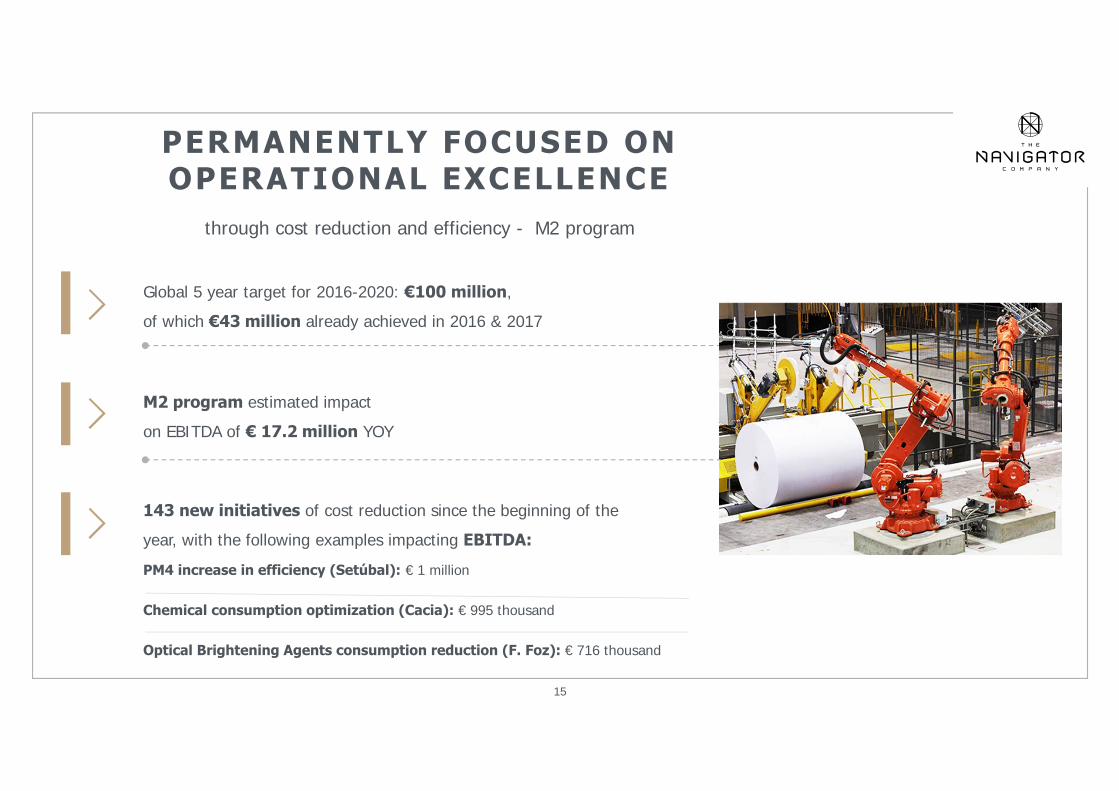
PERMANENTLY FOCUSED ON OPERATIONAL EXCELLENCE
through cost reduction and efficiency - M2 program
Global 5 year target for 2016-2020: €100 million,
of which €43 million already achieved in 2016 & 2017
M2 program estimated impact
on EBITDA of € 17.2 million YOY
143 new initiatives of cost reduction since the beginning of the
year, with the following examples impacting EBITDA:
PM4 increase in efficiency (Setúbal): € 1 million
Chemical consumption optimization (Cacia): € 995 thousand
Optical Brightening Agents consumption reduction (F. Foz): € 716 thousand
15
<<
16
<<
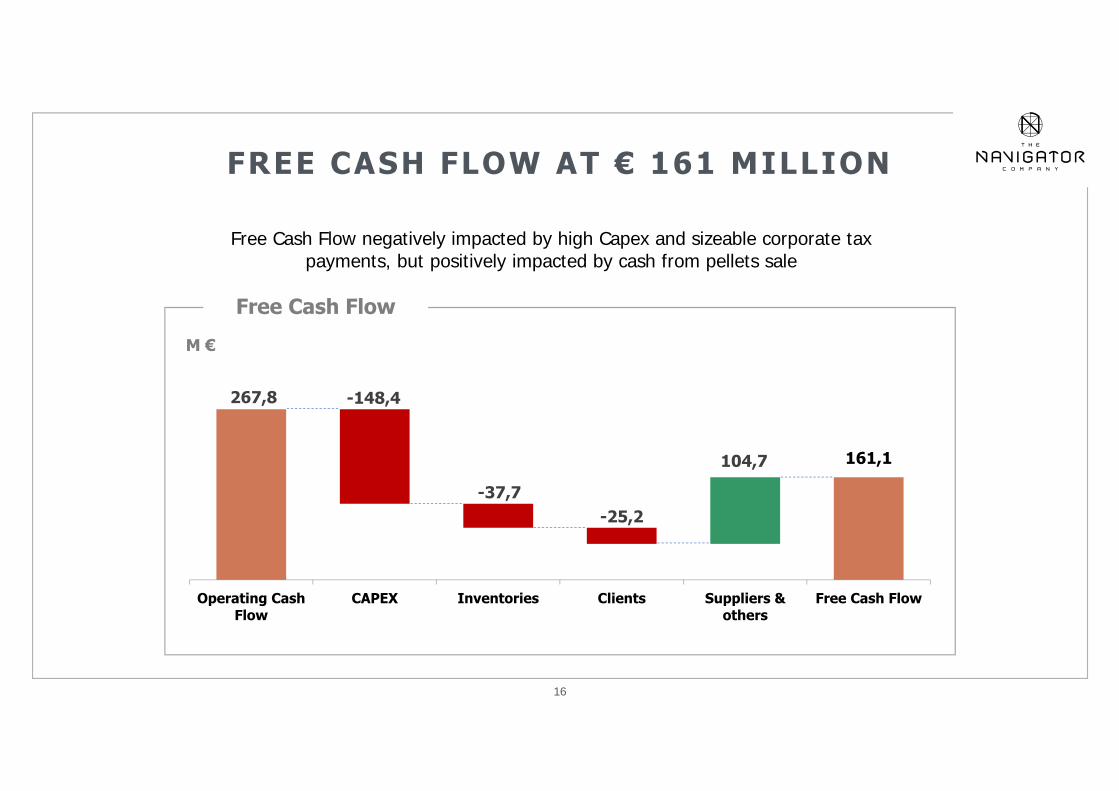
FREE CASH FLOW AT € 161 MILLION
Free Cash Flow negatively impacted by high Capex and sizeable corporate tax payments, but positively impacted by cash from pellets sale
267,8
161,1
-148,4
-37,7-25,2
104,7
Operating CashFlow
CAPEX Inventories Clients Suppliers &others
Free Cash Flow
M €
Free Cash Flow
17
<<
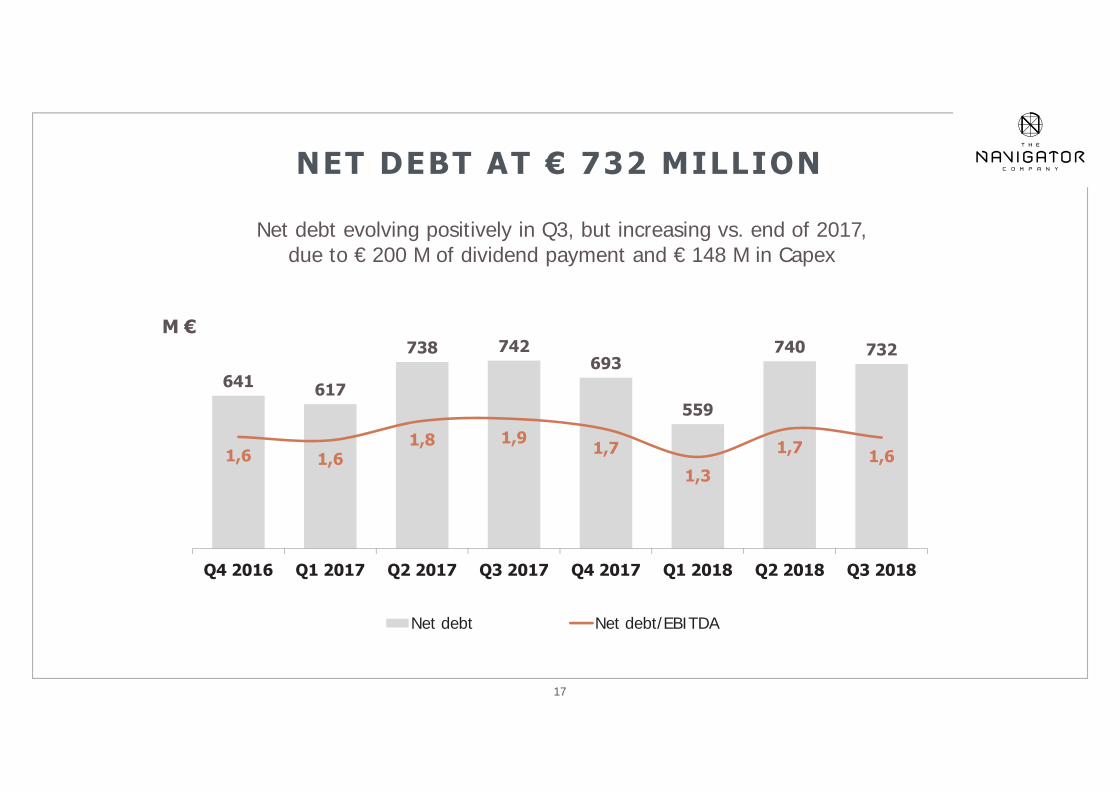
NET DEBT AT € 732 MILLION
Net debt evolving positively in Q3, but increasing vs. end of 2017, due to € 200 M of dividend payment and € 148 M in Capex
641 617
738 742693
559
740 732
1,6 1,61,8 1,9 1,7
1,3
1,7 1,6
Q4 2016 Q1 2017 Q2 2017 Q3 2017 Q4 2017 Q1 2018 Q2 2018 Q3 2018
Net debt Net debt/EBITDA
M €
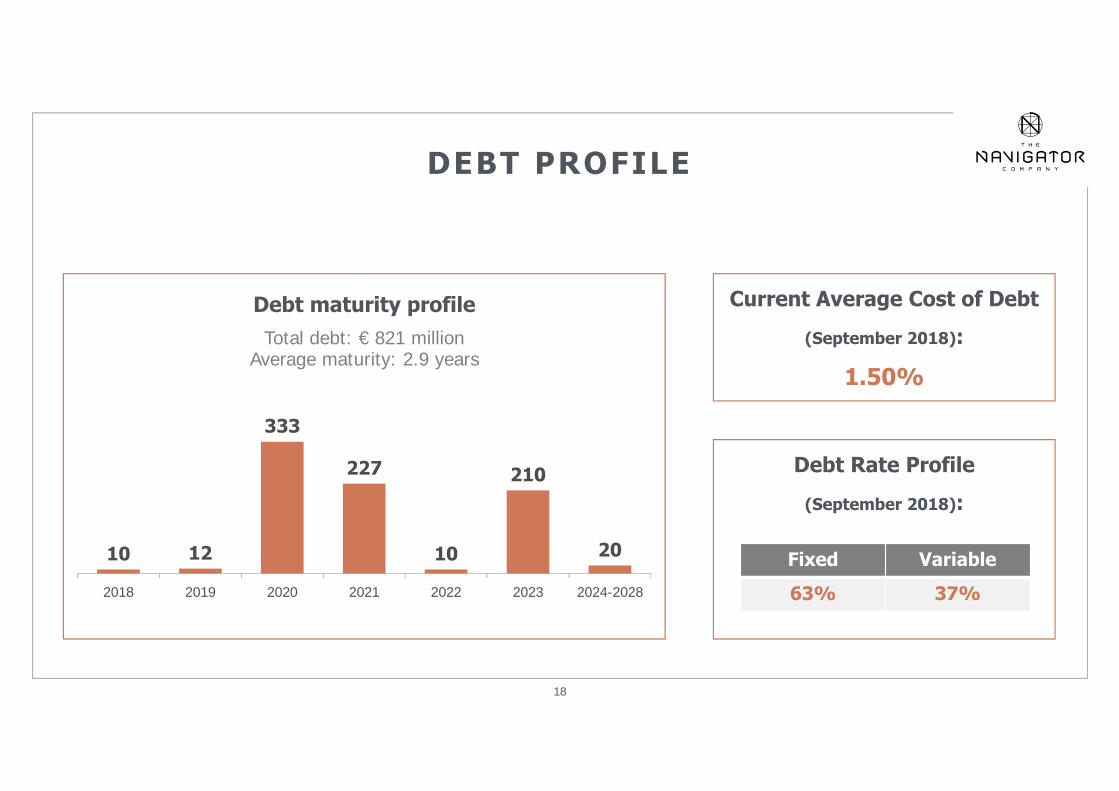
Current Average Cost of Debt
(September 2018):
1.50%
Debt maturity profileTotal debt: € 821 million
Average maturity: 2.9 years
18
10 12
333
227
10
210
20
2018 2019 2020 2021 2022 2023 2024-2028
<<
DEBT PROFILE
Debt Rate Profile
(September 2018):
Fixed Variable
63% 37%
19
<<
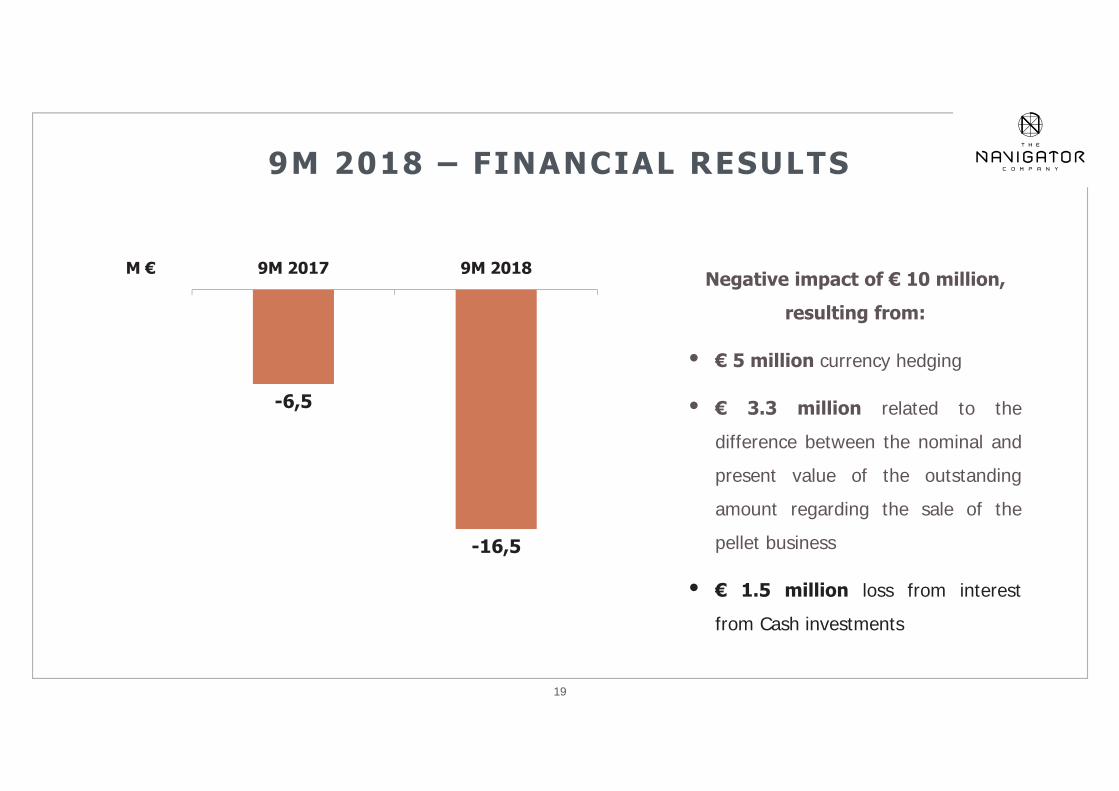
9M 2018 – FINANCIAL RESULTS
-6,5
-16,5
9M 2017 9M 2018Negative impact of € 10 million,
resulting from:
• € 5 million currency hedging
• € 3.3 million related to the
difference between the nominal and
present value of the outstanding
amount regarding the sale of the
pellet business
• € 1.5 million loss from interest
from Cash investments
M €
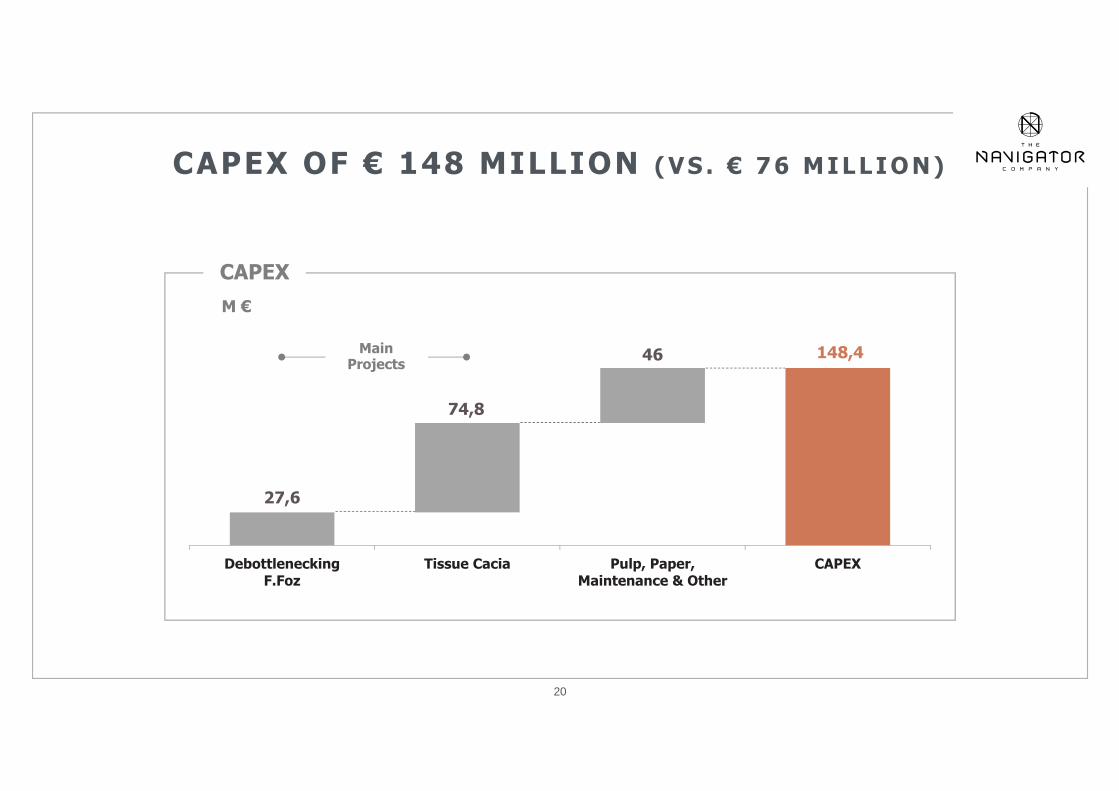
27,6
148,4
74,8
46
DebottleneckingF.Foz
Tissue Cacia Pulp, Paper,Maintenance & Other
CAPEX
20
<<
CAPEX OF € 148 MILLION ( V S . € 7 6 M I L L I O N )
M €
YoBMain
Projects
CAPEX

OutlookMarket Outlook
Main Highlights
Group Performance
01 02 03 04
<<
21
Q3/9M 2018 RESULTS PRESENTATION
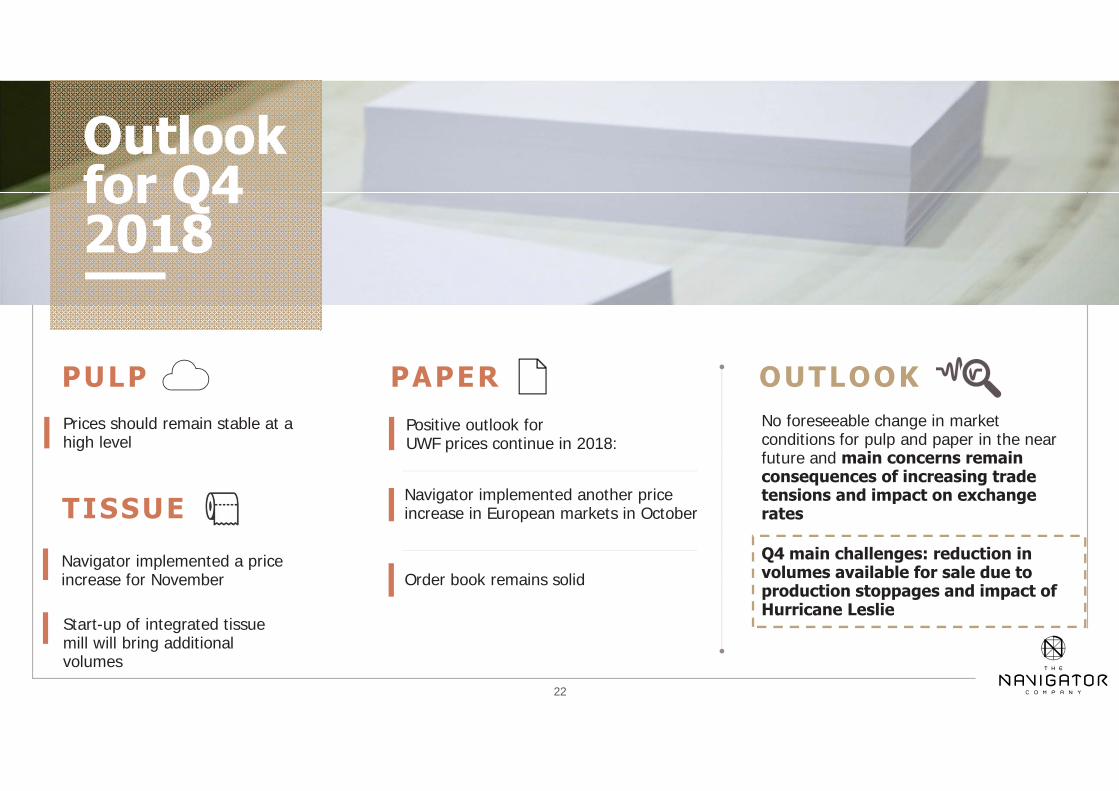
Outlook for Q4 2018
PULP PAPERPositive outlook forUWF prices continue in 2018:
No foreseeable change in market conditions for pulp and paper in the near future and main concerns remain consequences of increasing trade tensions and impact on exchange rates
Prices should remain stable at a high level
Navigator implemented another price increase in European markets in October
Order book remains solid
Q4 main challenges: reduction in volumes available for sale due to production stoppages and impact of Hurricane Leslie
TISSUE
Navigator implemented a price increase for November
OUTLOOK
22
<<
Start-up of integrated tissue mill will bring additional volumes
This unexpected stoppage represented a loss of 6 thousand tons of pulp and 10 thousand tons of paper.
23
<<
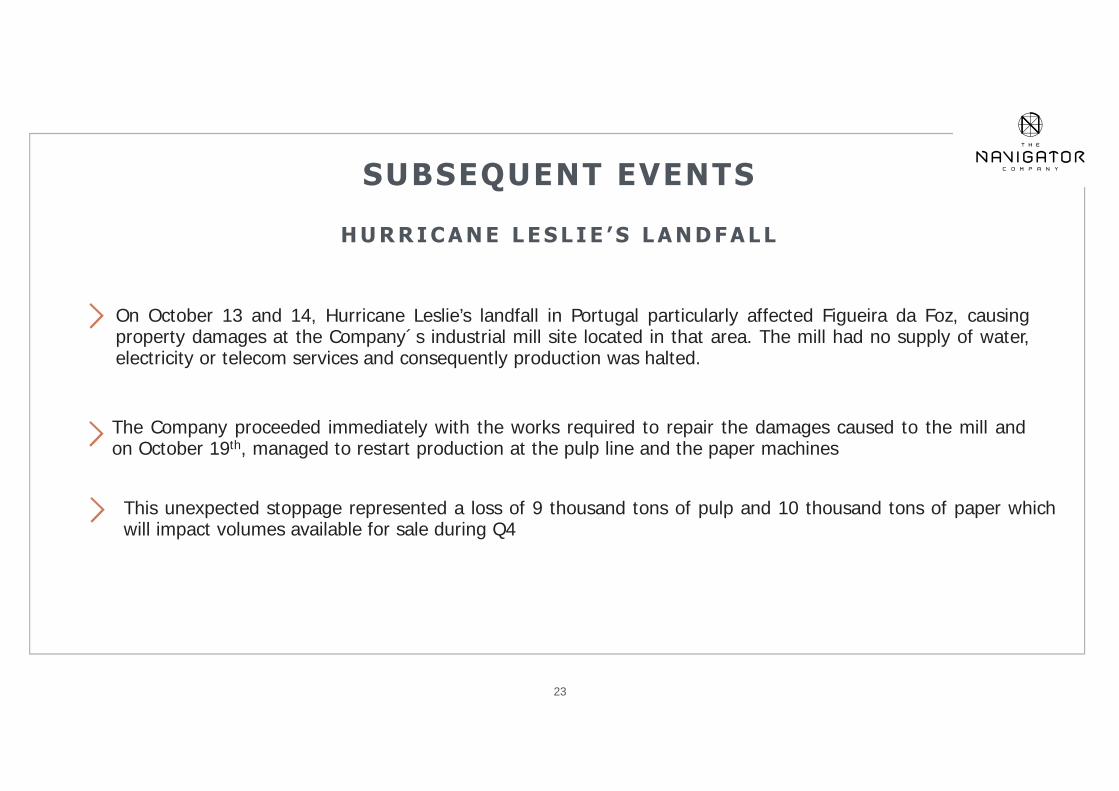
SUBSEQUENT EVENTS
On October 13 and 14, Hurricane Leslie’s landfall in Portugal particularly affected Figueira da Foz, causingproperty damages at the Company´s industrial mill site located in that area. The mill had no supply of water,electricity or telecom services and consequently production was halted.
H U R R I C A N E L E S L I E ’ S L A N D F A L L
The Company proceeded immediately with the works required to repair the damages caused to the mill andon October 19th, managed to restart production at the pulp line and the paper machines
This unexpected stoppage represented a loss of 9 thousand tons of pulp and 10 thousand tons of paper whichwill impact volumes available for sale during Q4


Bacj
<<
25
Q3/9M 2018 RESULTS PRESENTATION
Back-up sl ides
26
<<
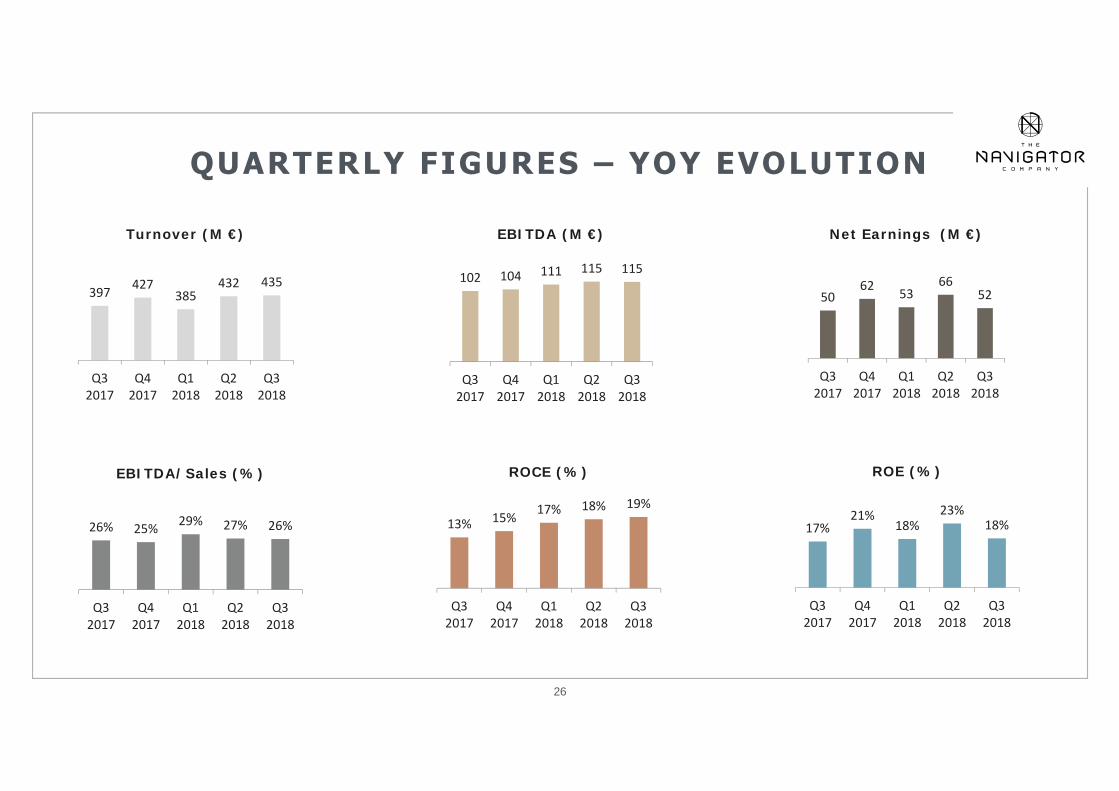
QUARTERLY FIGURES – YOY EVOLUTION
397 427385
432 435
Q32017
Q42017
Q12018
Q22018
Q32018
Turnover (M €)
102 104 111 115 115
Q32017
Q42017
Q12018
Q22018
Q32018
EBITDA (M €)
5062 53
6652
Q32017
Q42017
Q12018
Q22018
Q32018
Net Earnings (M €)
26% 25% 29% 27% 26%
Q32017
Q42017
Q12018
Q22018
Q32018
EBITDA/Sales (%)
13% 15% 17% 18% 19%
Q32017
Q42017
Q12018
Q22018
Q32018
ROCE (%)
17%21%
18%23%
18%
Q32017
Q42017
Q12018
Q22018
Q32018
ROE (%)
<<
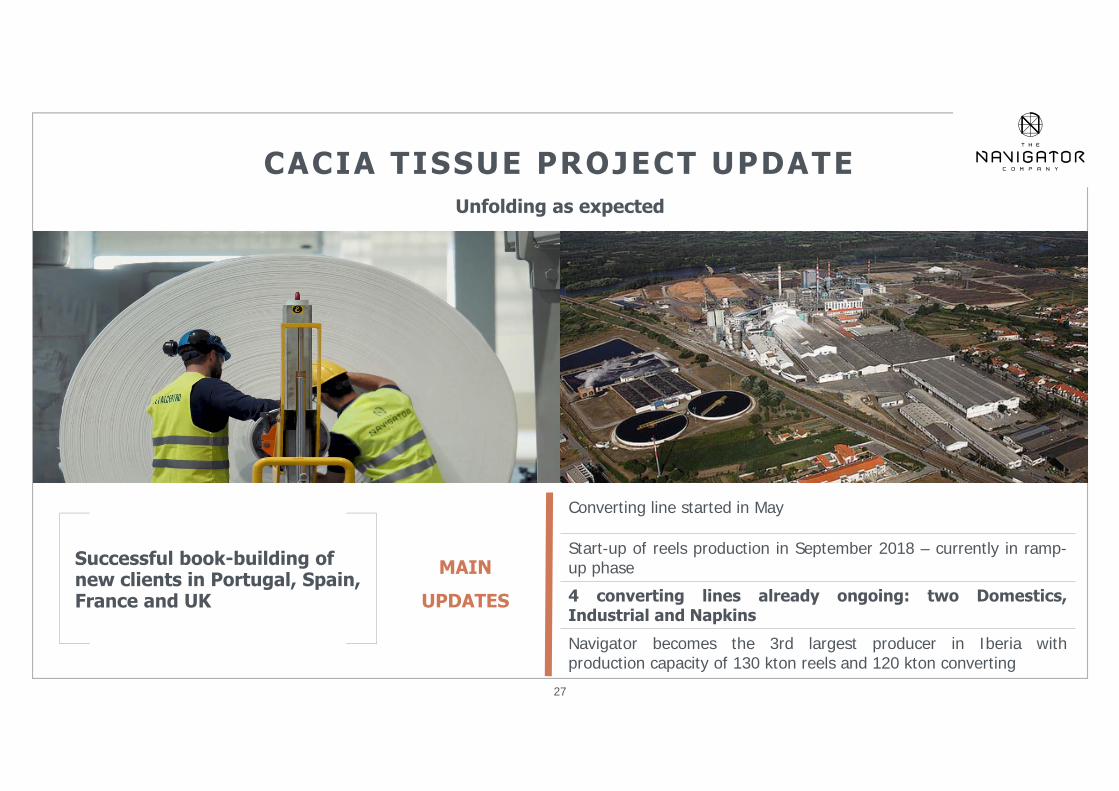
CACIA TISSUE PROJECT UPDATE
Successful book-building of new clients in Portugal, Spain, France and UK
27
MAIN
UPDATES
Converting line started in May
Start-up of reels production in September 2018 – currently in ramp-up phase
4 converting lines already ongoing: two Domestics,Industrial and Napkins
Navigator becomes the 3rd largest producer in Iberia withproduction capacity of 130 kton reels and 120 kton converting
Unfolding as expected
<<
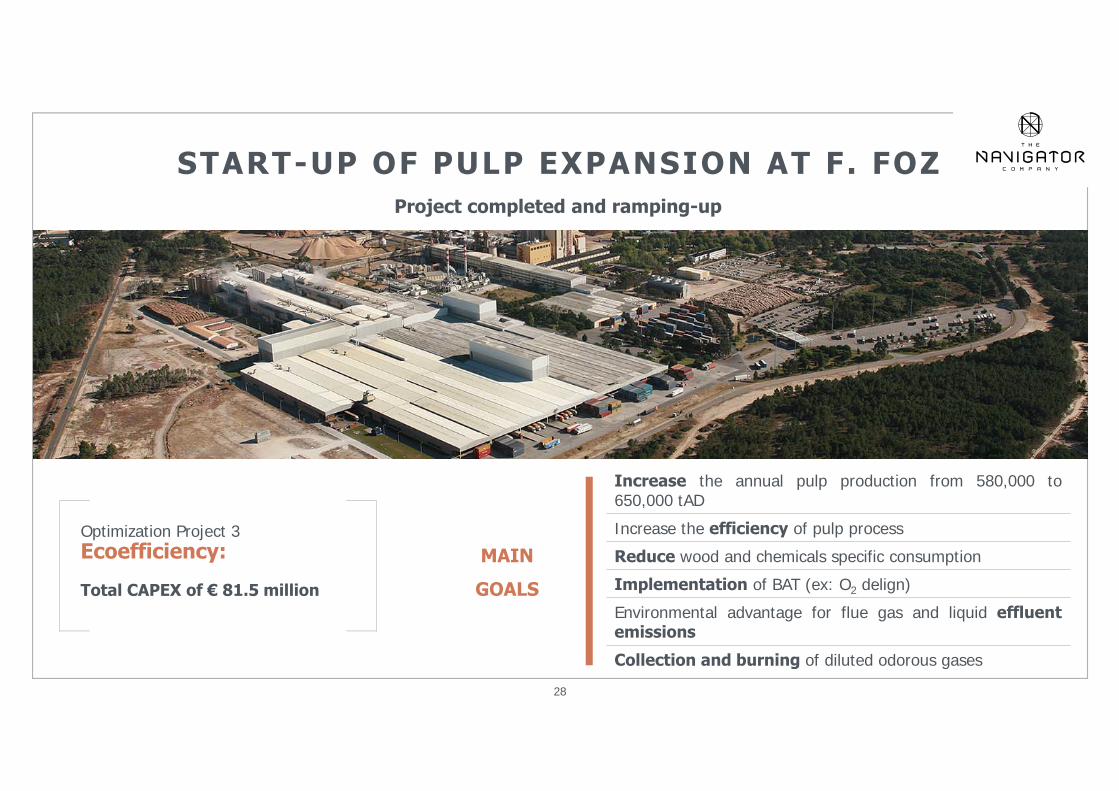
START-UP OF PULP EXPANSION AT F. FOZ
Optimization Project 3 Ecoefficiency:
Total CAPEX of € 81.5 million
Project completed and ramping-up
MAIN
GOALS
28
Increase the annual pulp production from 580,000 to650,000 tAD
Increase the efficiency of pulp process
Reduce wood and chemicals specific consumption
Implementation of BAT (ex: O2 delign)
Environmental advantage for flue gas and liquid effluentemissions
Collection and burning of diluted odorous gases
This presentation is intended to provide a general overview of The Navigator Company S.A.’s businessand does not purport to deal with all aspects and details regarding The Navigator Company S.A..Accordingly, no representation, undertaking or warranty, expressed or implied, is given by The NavigatorCompany S.A. or any of its subsidiaries’ undertakings, affiliates, directors, officers, employees oradvisors or any other person as to the fairness, accuracy, completeness or correctness of theinformation or opinions contained in this presentation or of the views given or implied or any othermaterial discussion in connection with this presentation.
This presentation has been prepared by The Navigator Company S.A. for information purposes only. TheNavigator Company S.A. or any of its affiliates, directors, officers, employees or advisers or any otherperson shall not have any liability whatsoever (including in case of omission, negligence or otherwise)for any losses, errors or omissions howsoever arising, directly or indirectly, from any use of thispresentation or its contents or otherwise arising in connection therewith or with respect to their relianceupon the completeness and accuracy of any such information, as well as any damages resulting hereof.
DISCLAIMER
29