q4 2014 partners trust real estate market report
DESCRIPTION
Partners Trust Q4 2014 Market Report Statistics and analysis covering the Los Angeles real estate market including units sold and sale price.TRANSCRIPT

Q4 2014 MARKET STATSREAL ESTATE REPORT


Q4 2014 MARKET STATSREAL ESTATE REPORT
INTRODUCTION ............................................................. 3
Los Angeles & WestsideCOASTAL COMMUNITIES ............................................ 7
THE HILLS ........................................................................ 9
WESTSIDE ........................................................................ 11
HOLLYWOOD HILLS & MIDCITY ................................ 13
WESTSIDE / SOUTH ...................................................... 15
METRO LOS ANGELES ................................................. 17
San Fernando ValleySAN FERNANDO VALLEY- WEST OF 405 ............. 21
SAN FERNANDO VALLEY- EAST OF 405 .............. 23
San Gabriel ValleyPASADENA ...................................................................... 27
LA CAÑADA FLINTRIDGE ............................................. 29
NORTH EAST LOS ANGELES ....................................... 31
SAN GABRIEL VALLEY EAST ..................................... 33


3PARTNERS TRUST 2014 Q4 MARKET STATS REPORT |
INTRODUCTION
The Los Angeles real estate market reflects a city that continues to be in growth mode. Foreign investment from all around the globe and especially the Asian and Euro-pean markets has fueled a high level of in-terest and excitement in owning Southern California real estate.
For Q4 the Los Angeles real estate market overall saw sales drop from 2013 as limited inventory continues to restrict the choices available. The luxury market continues to show increasing strength and at Partners Trust we have seen heightened activity at the higher-end of the Los Angeles market. Many luxury homes received multiple offers although overall we are seeing the volume of multiple offers slightly diminished.
Prices were up across Los Angeles but by a smaller amount than was registered in pre-vious quarters. This points to an ongoing “normalizing” of the market that provides ample opportunities for both buyers and sellers.
Specific areas of strength include Brent-wood, which saw a 22% sales increase year over year with an average sale price of over $3 million. The Beverlywood area, which has been identified as one of the neighbor-hoods to watch in 2015, also showed strong growth (8%). On the Eastside prices rose dramatically. Pasadena’s average sale price rose 13% to $971,531. In La Cañada Flintridge, site of one of the offices we added in 2014, the average sale price rose 30% year over year with an average of $1,886,170.
An early look at Q1
While it’s impossible to predict with cer-tainty how the market will shift, early in-dicators are showing that the table is set for a robust year. December’s uptick in sales may carry through to a strong start to the year. Recent consumer confidence numbers show that overall people are feeling more sanguine about the econ-omy. In Los Angeles County, the unem-ployment rate has dipped below 8% for the first time since mid-2008.
Mortgage rates have remained lower and mortgage applications for both purchase and refinancing surged during Janu-ary. Also lending conditions continue to ease, providing more opportunities for buyers to find a loan to suit their needs.
We anticipate some price increases es-pecially in communities where demand is particularly high but overall the rate of increase should be far slower than in the last several years.
If you have any questions regarding your property or specific real estate needs, please reach out to your Partners Trust Associate who can provide specific tar-geted data for your home and neighbor-hood.


LOS ANGELES& WESTSIDE
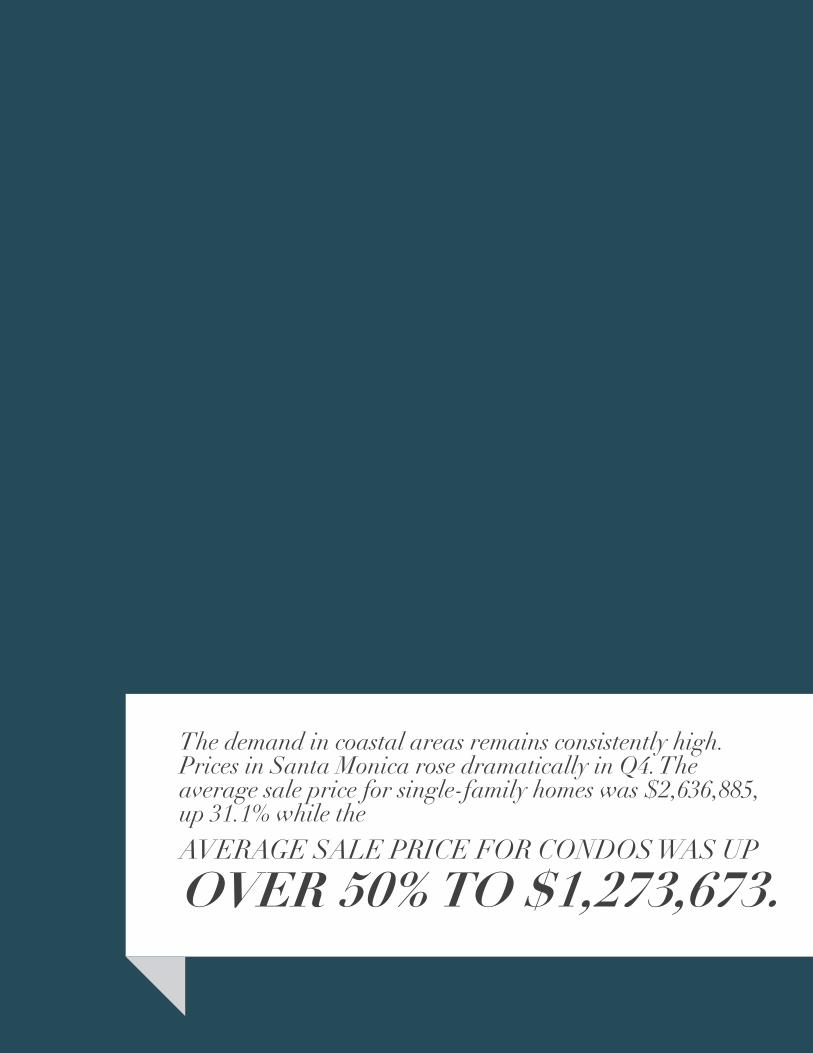
The demand in coastal areas remains consistently high. Prices in Santa Monica rose dramatically in Q4. The average sale price for single-family homes was $2,636,885, up 31.1% while theAVERAGE SALE PRICE FOR CONDOS WAS UP
OVER 50% TO $1,273,673.

7PARTNERS TRUST 2014 Q4 MARKET STATS REPORT |
# SALES AVERAGE SOLD PRICE DAYS ON MARKET
TYPE Q42013
Q42014 % CHANGE Q4
2013Q4
2014 % CHANGE Q42013
Q42014 % CHANGE
MALIBU SFR 55 46 -16.36% $2,743,135 $2,691,526 -1.88% 151 169 11.92%
CONDO 7 7 0.00% $864,571 $920,857 6.51% 83 74 -10.84%
MALIBU BEACH SFR 11 9 -18.18% $7,215,284 $8,010,247 11.02% 213 145 -31.92%
CONDO 1 10 900.00% $830,000 $1,065,168 28.33% 249 150 -39.76%
MARINA DEL REY SFR 11 12 9.09% $1,602,877 $1,507,667 -5.94% 54 56 3.70%
CONDO 84 100 19.05% $757,631 $804,938 6.24% 75 86 14.67%
PACIFIC PALISADES SFR 63 55 -12.70% $2,866,229 $2,815,492 -1.77% 65 62 -4.62%
CONDO 16 16 0.00% $929,340 $830,411 -10.65% 92 68 -26.09%
SANTA MONICA SFR 64 67 4.69% $2,011,323 $2,636,885 31.10% 55 54 -1.82%
CONDO 110 134 21.82% $846,392 $1,273,673 50.48% 48 49 2.08%
COASTALCOMMUNITIESSanta Monica & Adjacent Communities
# SALES AVERAGE SOLD PRICE DAYS ON MARKET
TYPE Q42013
Q42014 % CHANGE Q4
2013Q4
2014 % CHANGE Q42013
Q42014 % CHANGE
MARINA DEL REY SFR 11 12 9.09% $1,602,877 $1,507,667 -5.94% 54 56 3.70%
CONDO 84 100 19.05% $757,631 $804,938 6.24% 75 86 14.67%
PLAYA VISTA SFR 2 6 200.00% $1,345,000 $1,510,433 12.30% 35 54 54.29%
CONDO 36 29 -19.44% $655,134 $806,786 23.15% 64 70 9.38%
VENICE SFR 62 55 -11.29% $1,589,901 $2,015,748 26.78% 68 63 -7.35%
CONDO 16 8 -50.00% $1,013,656 $981,563 -3.17% 66 91 37.88%
WESTCHESTER SFR 91 77 -15.38% $832,335 $942,799 13.27% 44 51 15.91%
CONDO 12 9 -25.00% $369,242 $456,333 23.59% 83 58 -30.12%
PALMS - MAR VISTA
SFR 96 96 0.00% $1,077,552 $1,236,297 14.73% 40 57 42.50%
CONDO 33 35 6.06% $475,530 $592,257 24.55% 52 60 15.38%
2014 MLS/CLAW DATA.

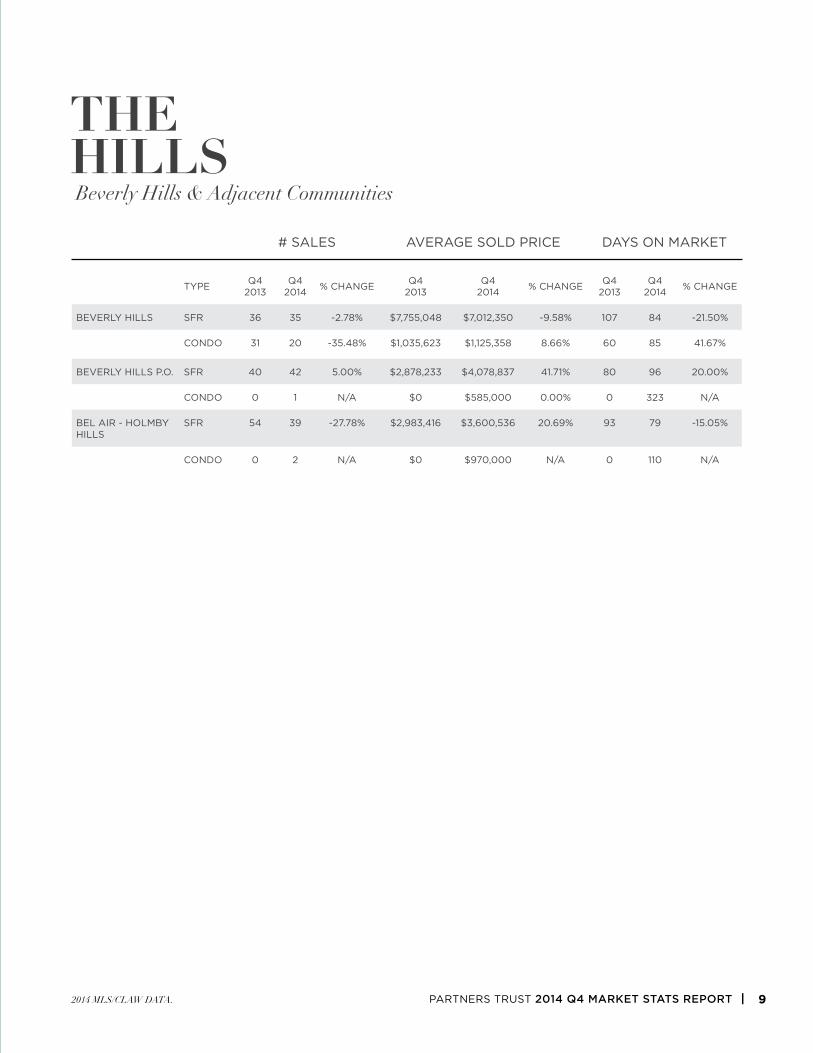
The Beverly Hills Post Office area outperformed surrounding areas, notching up 5% sales growth year over year and a nearly
42% INCREASE IN AVERAGE SALES PRICE TO $4,078,837 FOR SINGLE-FAMILY RESIDENCES.
9PARTNERS TRUST 2014 Q4 MARKET STATS REPORT |
# SALES AVERAGE SOLD PRICE DAYS ON MARKET
TYPE Q42013
Q42014 % CHANGE Q4
2013Q4
2014 % CHANGE Q42013
Q42014 % CHANGE
BEVERLY HILLS SFR 36 35 -2.78% $7,755,048 $7,012,350 -9.58% 107 84 -21.50%
CONDO 31 20 -35.48% $1,035,623 $1,125,358 8.66% 60 85 41.67%
BEVERLY HILLS P.O. SFR 40 42 5.00% $2,878,233 $4,078,837 41.71% 80 96 20.00%
CONDO 0 1 N/A $0 $585,000 0.00% 0 323 N/A
BEL AIR - HOLMBY HILLS
SFR 54 39 -27.78% $2,983,416 $3,600,536 20.69% 93 79 -15.05%
CONDO 0 2 N/A $0 $970,000 N/A 0 110 N/A
THEHILLSBeverly Hills & Adjacent Communities
2014 MLS/CLAW DATA.

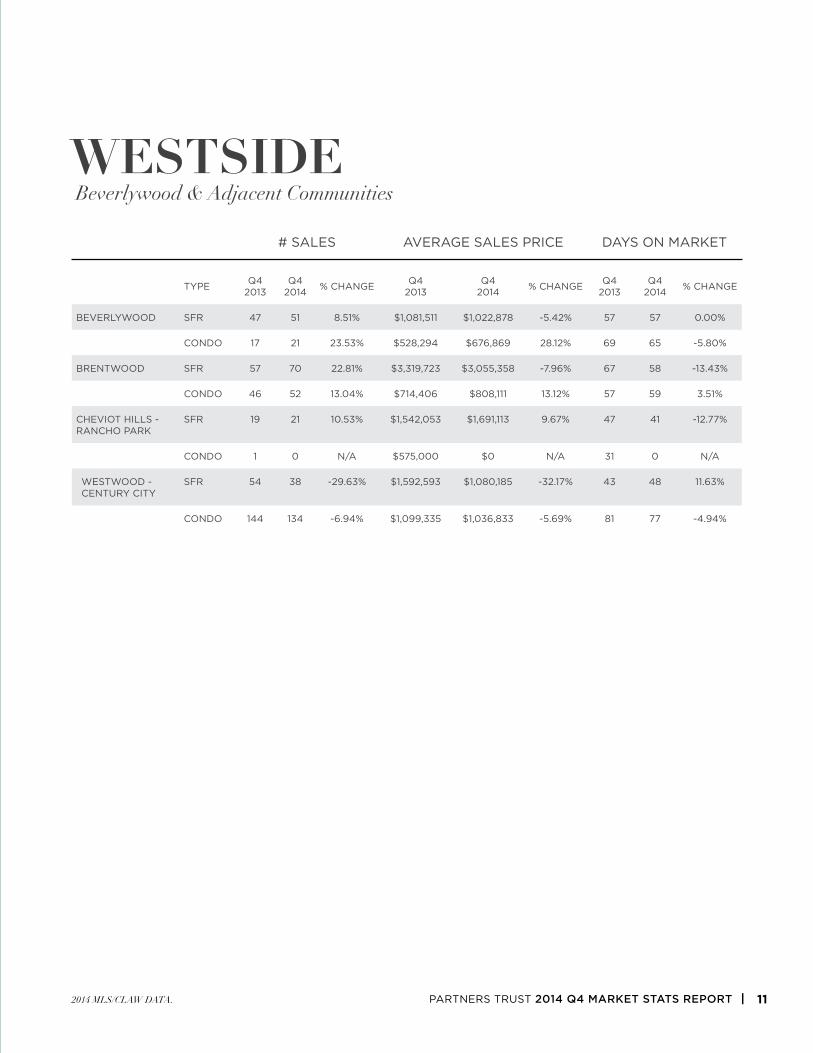
Close-knit communities with great shopping, restaurants, and recreation make the Westside highly desirable.
Brentwood sales boomed in the last quarter of 2014 with
SALES OF SINGLE-FAMILY RESIDENCES UP NEARLY 23% AND CONDO SALES UP 13%.
11PARTNERS TRUST 2014 Q4 MARKET STATS REPORT |
# SALES AVERAGE SALES PRICE DAYS ON MARKET
TYPE Q42013
Q42014 % CHANGE Q4
2013Q4
2014 % CHANGE Q42013
Q42014 % CHANGE
BEVERLYWOOD SFR 47 51 8.51% $1,081,511 $1,022,878 -5.42% 57 57 0.00%
CONDO 17 21 23.53% $528,294 $676,869 28.12% 69 65 -5.80%
BRENTWOOD SFR 57 70 22.81% $3,319,723 $3,055,358 -7.96% 67 58 -13.43%
CONDO 46 52 13.04% $714,406 $808,111 13.12% 57 59 3.51%
CHEVIOT HILLS - RANCHO PARK
SFR 19 21 10.53% $1,542,053 $1,691,113 9.67% 47 41 -12.77%
CONDO 1 0 N/A $575,000 $0 N/A 31 0 N/A
WESTWOOD - CENTURY CITY
SFR 54 38 -29.63% $1,592,593 $1,080,185 -32.17% 43 48 11.63%
CONDO 144 134 -6.94% $1,099,335 $1,036,833 -5.69% 81 77 -4.94%
WESTSIDEBeverlywood & Adjacent Communities
2014 MLS/CLAW DATA.

The glamour of the Hollywood Hills attracts buyers from around the city and around the world. The Sunset Strip area saw strong price in-creases in Q4 with prices of single-family residences rising nearly 25% to an
AVERAGE SALE PRICE OF $2,467,936 WHILE CONDOS ROSE OVER 28% TO AN AVERAGE PRICE $706,975.

13PARTNERS TRUST 2014 Q4 MARKET STATS REPORT |
# SALES AVERAGE SOLD PRICE DAYS ON MARKET
TYPE Q42013
Q42014 % CHANGE Q4
2013Q4
2014 % CHANGE Q42013
Q42014 % CHANGE
HOLLYWOOD HILLS EAST
SFR 41 37 -9.76% $1,177,496 $1,411,407 19.87% 54 67 24.07%
CONDO 11 12 9.09% $387,455 $405,042 4.54% 43 103 139.53%
SUNSET STRIP - HOLLYWOOD HILLS WEST
SFR 100 104 4.00% $1,977,419 $2,467,936 24.81% 66 78 18.18%
CONDO 27 20 -25.93% $550,644 $706,975 28.39% 59 77 30.51%
# SALES AVERAGE SOLD PRICE DAYS ON MARKET
TYPE Q42013
Q42014 % CHANGE Q4
2013Q4
2014 % CHANGE Q42013
Q42014 % CHANGE
BEVERLY CENTER - MIRACLE MILE
SFR 47 50 6.38% $1,399,210 $1,535,736 9.76% 62 62 0.00%
CONDO 42 20 -52.38% $727,161 $671,050 -7.72% 67 61 -8.96%
HANCOCK PARK - WILSHIRE
SFR 83 76 -8.43% $1,729,000 $1,790,376 3.55% 54 54 0.00%
CONDO 50 34 -32.00% $483,030 $646,174 33.78% 69 79 14.49%
WEST HOLLY-WOOD
SFR 31 31 0.00% $1,486,276 $1,367,031 -8.02% 56 56 0.00%
CONDO 94 87 -7.45% $721,564 $655,628 -9.14% 65 62 -4.62%
HOLLYWOOD HILLS& MIDCITYHollywood Hills & Adjacent Communities
2014 MLS/CLAW DATA.

Culver City has seen increased interest from those moving eastward from the Silicon Beach area. Sales for single-family homes were up 8% while the average sales price rose nearly 10%. CONDO GROWTH WAS ESPECIALLY STRONG WITH A
36% INCREASE IN SALES AND A NEARLY 19% INCREASE IN AVERAGE SALE PRICE.

15PARTNERS TRUST 2014 Q4 MARKET STATS REPORT |
WESTSIDE /SOUTHCulver City & Adjacent Communities
2014 MLS/CLAW DATA.
# SALES AVERAGE SOLD PRICE DAYS ON MARKET
TYPE Q42013
Q42014 % CHANGE Q4
2013Q4
2014 % CHANGE Q42013
Q42014 % CHANGE
CULVER CITY SFR 50 54 8.00% $844,703 $927,111 9.76% 45 45 0.00%
CONDO 44 60 36.36% $406,828 $483,226 18.78% 43 47 9.30%
PARK HILLS HEIGHTS
SFR 90 91 1.11% $488,432 $493,492 1.04% 57 53 -7.02%
CONDO 15 11 -26.67% $251,733 $297,636 18.23% 35 66 88.57%
INGLEWOOD SFR 88 69 -21.59% $325,055 $382,233 17.59% 52 66 26.92%
CONDO 47 41 -12.77% $181,810 $211,354 16.25% 59 70 18.64%
LADERA HEIGHTS SFR 12 19 58.33% $772,984 $845,843 9.43% 58 56 -3.45%
CONDO 2 0 N/A $340,750 $0 N/A 69 0 N/A
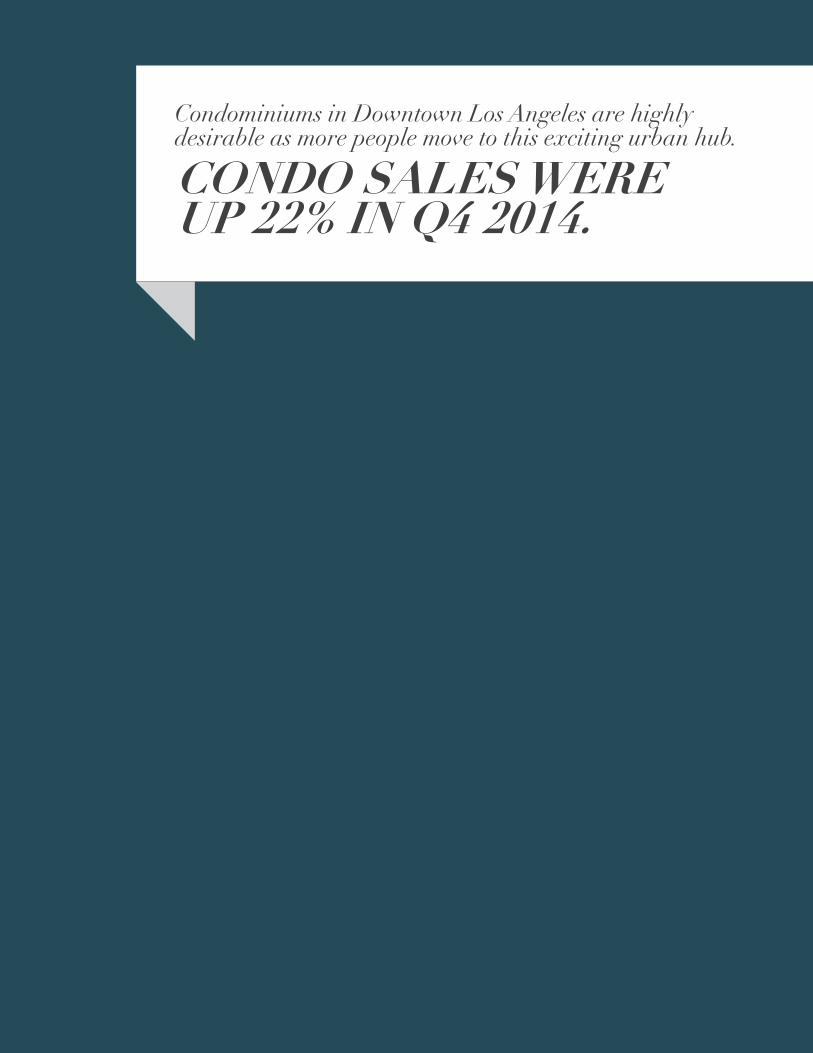
Condominiums in Downtown Los Angeles are highly desirable as more people move to this exciting urban hub.
CONDO SALES WERE UP 22% IN Q4 2014.

17PARTNERS TRUST 2014 Q4 MARKET STATS REPORT |
# SALES AVERAGE SOLD PRICE DAYS ON MARKET
TYPE Q42013
Q42014 % CHANGE Q4
2013Q4
2014 % CHANGE Q42013
Q42014 % CHANGE
DOWNTOWN L.A. SFR 34 15 -55.88% $267,610 $248,614 -7.10% 37 43 16.22%
CONDO 89 107 20.22% $583,056 $608,182 4.31% 62 65 4.84%
HOLLYWOOD SFR 21 35 66.67% $547,440 $823,928 50.51% 64 58 -9.38%
CONDO 30 27 -10.00% $611,167 $626,444 2.50% 63 99 57.14%
LOS FELIZ SFR 52 58 11.54% $1,589,251 $1,571,999 -1.09% 50 65 30.00%
CONDO 9 6 -33.33% $542,122 $493,667 -8.94% 27 35 29.63%
SILVER LAKE - ECHO PARK
SFR 93 84 -9.68% $820,768 $981,453 19.58% 51 51 0.00%
CONDO 12 7 -41.67% $452,732 $514,271 13.59% 65 68 4.62%
METROLOS ANGELESDowntown Los Angeles & Adjacent Communities
2014 MLS/CLAW DATA.

SAN FERNANDOVALLEY

The West San Fernando Valley draws many people looking for a more suburban lifestyle and larger homes.
THE AVERAGE PRICE OF A SINGLE FAMILY HOME IN CALABASAS ROSE OVER 14% YEAR OVER YEAR IN Q4.

21PARTNERS TRUST 2014 Q4 MARKET STATS REPORT |
# SALES AVERAGE SOLD PRICE DAYS ON MARKET
TYPE Q42013
Q42014 % CHANGE Q4
2013Q4
2014 % CHANGE Q42013
Q42014 % CHANGE
AGOURA SFR 104 92 -11.54% $897,653 $946,070 5.39% 68 95 39.71%
CONDO 43 56 30.23% $375,762 $379,505 1.00% 62 69 11.29%
CALABASAS SFR 76 57 -25.00% $1,597,284 $1,822,368 14.09% 78 100 28.21%
CONDO 12 25 108.33% $369,913 $412,434 11.49% 52 82 57.69%
CHATSWORTH SFR 80 93 16.25% $624,856 $731,774 17.11% 62 76 22.58%
CONDO 40 49 22.50% $322,036 $344,833 7.08% 64 62 -3.13%
ENCINO SFR 133 147 10.53% $1,135,448 $1,261,731 11.12% 62 65 4.84%
CONDO 58 74 27.59% $410,570 $363,927 -11.36% 48 78 62.50%
HIDDEN HILLS SFR 9 9 0.00% $2,949,722 $3,552,778 20.44% 164 107 -34.76%
CONDO 0 0 N/A $0 $0 N/A 0 0 N/A
# SALES AVERAGE SOLD PRICE DAYS ON MARKET
TYPE Q42013
Q42014 % CHANGE Q4
2013Q4
2014 % CHANGE Q42013
Q42014 % CHANGE
NORTHRIDGE SFR 255 257 0.78% $595,677 $614,198 3.11% 47 68 44.68%
CONDO 46 57 23.91% $368,061 $375,056 1.90% 39 67 71.79%
TARZANA SFR 86 74 -13.95% $840,806 $972,730 15.69% 56 76 35.71%
CONDO 68 59 -13.24% $288,260 $319,945 10.99% 52 57 9.62%
WESTLAKE VIL-LAGE
SFR 118 120 1.69% $1,424,857 $1,359,027 -4.62% 92 106 15.22%
CONDO 63 50 -20.63% $585,046 $556,338 -4.91% 57 60 5.26%
WOODLAND HILLS SFR 224 213 -4.91% $738,905 $759,027 2.72% 64 65 1.56%
CONDO 77 55 -28.57% $346,005 $357,662 3.37% 44 66 50.00%
SAN FERNANDO VALLEYWEST OF 405Agoura & Adjacent Communities
2014 MLS/CLAW DATA.

The East San Fernando Valley has seen a heightened profile with more high-profile restaurants and businesses enlivening the area.
IN STUDIO CITY, PRICES CONTINUE TO
RISE BY 11% ACROSS THE BOARD.

23PARTNERS TRUST 2014 Q4 MARKET STATS REPORT |
# SALES AVERAGE SOLD PRICE DAYS ON MARKET
TYPE Q42013
Q42014 % CHANGE Q4
2013Q4
2014 % CHANGE Q42013
Q42014 % CHANGE
BURBANK SFR 214 182 -14.95% $625,564 $717,545 14.70% 45 48 6.67%
CONDO 65 61 -6.15% $408,195 $435,059 6.58% 42 65 54.76%
SHERMAN OAKS SFR 206 228 10.68% $919,853 $975,912 6.09% 55 57 3.64%
CONDO 107 104 -2.80% $410,045 $441,784 7.74% 48 65 35.42%
STUDIO CITY SFR 119 108 -9.24% $1,210,547 $1,340,599 10.74% 63 74 17.46%
CONDO 59 41 -30.51% $461,827 $514,535 11.41% 56 69 23.21%
TOLUCA LAKE SFR 30 28 -6.67% $1,181,000 $1,110,904 -5.94% 70 71 1.43%
CONDO 17 21 23.53% $475,056 $437,667 -7.87% 68 64 -5.88%
SAN FERNANDO VALLEYEAST OF 405Sherman Oaks & Adjacent Communities
2014 MLS/CLAW DATA.


SAN GABRIELVALLEY

Pasadena continues to draw entrepreneurs in technology and other fields leading to a dynamic and vibrant commu-nity culture. Home prices were up year over year,
UP OVER 13% FOR SINGLE-FAMILY RESIDENCES AND NEARLY 5% FOR CONDOS.

27PARTNERS TRUST 2014 Q4 MARKET STATS REPORT |
# SALES AVERAGE SOLD PRICE DAYS ON MARKET
TYPE Q42013
Q42014 % CHANGE Q4
2013Q4
2014 % CHANGE Q42013
Q42014 % CHANGE
ALHAMBRA SFR 64 70 9.38% $553,791 $576,713 4.14% 46 50 8.70%
CONDO 28 26 -7.14% $388,278 $421,021 8.43% 50 44 -12.00%
ALTADENA SFR 145 130 -10.34% $691,654 $720,500 4.17% 35 52 48.57%
CONDO 1 1 0.00% $250,000 $265,000 6.00% 21 67 219.05%
PASADENA SFR 332 260 -21.69% $857,394 $971,531 13.31% 43 43 0.00%
CONDO 149 120 -19.46% $574,830 $601,925 4.71% 58 61 5.17%
SAN GABRIEL SFR 103 111 7.77% $687,670 $754,772 9.76% 41 37 -9.76%
CONDO 10 9 -10.00% $420,680 $423,125 0.58% 44 48 9.09%
SAN MARINO SFR 53 36 -32.08% $2,375,191 $2,741,073 15.40% 36 35 -2.78%
CONDO 0 0 N/A $0 $0 N/A 0 0 N/A
SOUTH PASADENA SFR 41 46 12.20% $1,097,945 $1,217,713 10.91% 32 42 31.25%
CONDO 10 12 20.00% $498,400 $583,458 17.07% 29 37 27.59%
PASADENAPasadena & Adjacent Communities
2014 PFAR DATA.

THE SAME TREND THAT SAW LA CAÑADA FLINTRIDGE PRICES RISE OVER 30% also impacted nearby communities include the La Crescenta/Montrose area which saw prices rise nearly 14%.

29PARTNERS TRUST 2014 Q4 MARKET STATS REPORT |
LA CAÑADAFLINTRIDGELa Cañada Flintridge & Adjacent Communities
2014 PFAR DATA.
# SALES AVERAGE SOLD PRICE DAYS ON MARKET
TYPE Q42013
Q42014 % CHANGE Q4
2013Q4
2014 % CHANGE Q42013
Q42014 % CHANGE
GLENDALE SFR 182 181 -0.55% $777,541 $847,552 9.00% 40 45 12.50%
CONDO 80 97 21.25% $363,327 $385,636 6.14% 35 41 17.14%
LA CANADA FLINTRIDGE
SFR 76 69 -9.21% $1,449,772 $1,886,170 30.10% 55 60 9.09%
CONDO 0 0 N/A $0 $0 N/A 0 0 N/A
LA CRESCENTA/GLENDALE/ MONTROSE/SPARR HEIGHTS
SFR 132 119 -9.85% $642,375 $729,255 13.52% 44 49 11.36%
CONDO 8 8 0.00% 0 $360,500 N/A 0 50 N/A
SUNLAND/TU-JUNGA
SFR 140 127 -9.29% $424,718 $484,164 14.00% 44 48 9.09%
CONDO 13 2 -84.62% $277,040 $397,500 43.48% 48 29 -39.58%

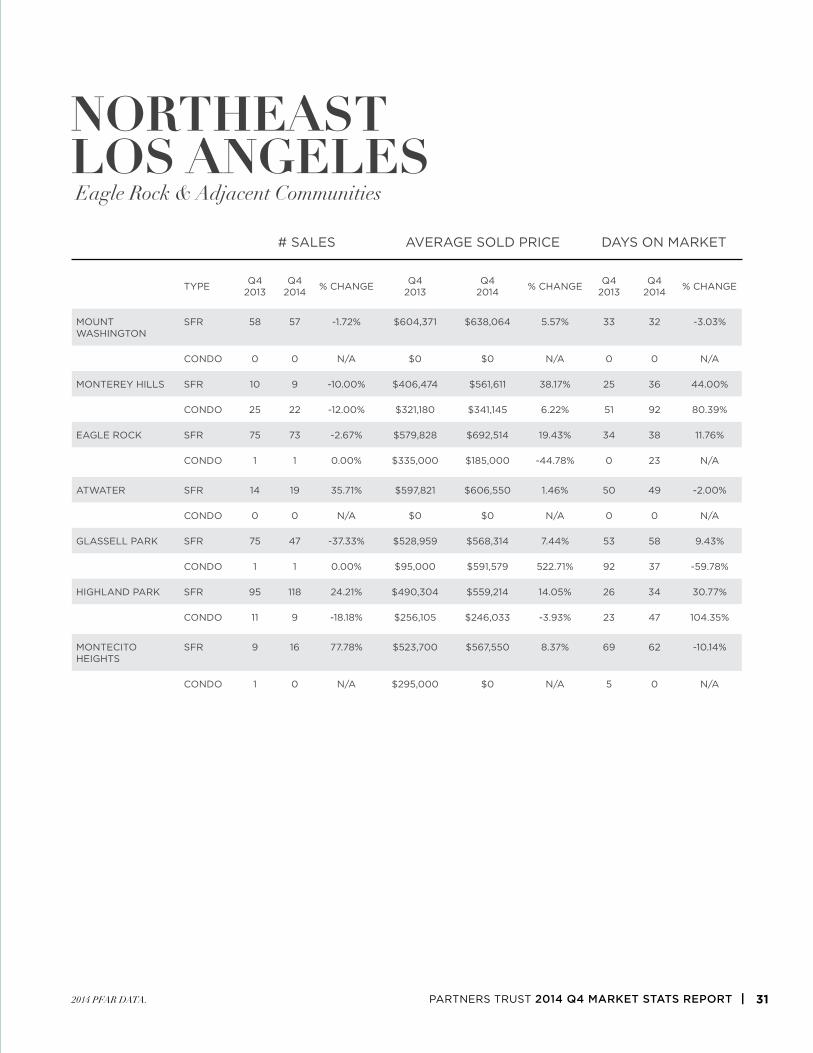
Eagle Rock and Highland Park have been named two of the trendiest neighborhoods in Los Angeles and home prices reflect this.
EAGLE ROCK PRICES WERE UP OVER 19% YEAR OVER YEAR, WHILE HIGHLAND PARK PRICES ROSE 14%.
31PARTNERS TRUST 2014 Q4 MARKET STATS REPORT |
NORTHEASTLOS ANGELESEagle Rock & Adjacent Communities
2014 PFAR DATA.
# SALES AVERAGE SOLD PRICE DAYS ON MARKET
TYPE Q42013
Q42014 % CHANGE Q4
2013Q4
2014 % CHANGE Q42013
Q42014 % CHANGE
MOUNT WASHINGTON
SFR 58 57 -1.72% $604,371 $638,064 5.57% 33 32 -3.03%
CONDO 0 0 N/A $0 $0 N/A 0 0 N/A
MONTEREY HILLS SFR 10 9 -10.00% $406,474 $561,611 38.17% 25 36 44.00%
CONDO 25 22 -12.00% $321,180 $341,145 6.22% 51 92 80.39%
EAGLE ROCK SFR 75 73 -2.67% $579,828 $692,514 19.43% 34 38 11.76%
CONDO 1 1 0.00% $335,000 $185,000 -44.78% 0 23 N/A
ATWATER SFR 14 19 35.71% $597,821 $606,550 1.46% 50 49 -2.00%
CONDO 0 0 N/A $0 $0 N/A 0 0 N/A
GLASSELL PARK SFR 75 47 -37.33% $528,959 $568,314 7.44% 53 58 9.43%
CONDO 1 1 0.00% $95,000 $591,579 522.71% 92 37 -59.78%
HIGHLAND PARK SFR 95 118 24.21% $490,304 $559,214 14.05% 26 34 30.77%
CONDO 11 9 -18.18% $256,105 $246,033 -3.93% 23 47 104.35%
MONTECITO HEIGHTS
SFR 9 16 77.78% $523,700 $567,550 8.37% 69 62 -10.14%
CONDO 1 0 N/A $295,000 $0 N/A 5 0 N/A

Prices saw a more modest gain in the East San Gabriel Valley, which contributed to increased sales activity.
SALES OF SINGLE-FAMILY HOMES IN BOTH THE ROSEMEAD AND AZUSA AR-EAS WERE UP NEARLY 30%.

33PARTNERS TRUST 2014 Q4 MARKET STATS REPORT |
EAST SANGABRIEL VALLEYArcadia & Adjacent Communities
2014 PFAR DATA.
# SALES AVERAGE SOLD PRICE DAYS ON MARKET
TYPE Q42013
Q42014 % CHANGE Q4
2013Q4
2014 % CHANGE Q42013
Q42014 % CHANGE
MONROVIA SFR 92 94 2.17% $570,978 $677,026 18.57% 51 42 -17.65%
CONDO 7 19 171.43% $330,514 $415,592 25.74% 49 36 -26.53%
ARCADIA SFR 153 147 -3.92% $1,671,234 $1,755,683 5.05% 35 42 20.00%
CONDO 43 28 -34.88% $535,535 $612,739 14.42% 33 30 -9.09%
SIERRA MADRE SFR 39 42 7.69% $919,010 $977,265 6.34% 38 39 2.63%
CONDO 6 2 -66.67% $481,500 $505,000 4.88% 66 39 -40.91%
BRADBURY SFR 5 7 40.00% $3,346,000 $1,795,714 -46.33% 32 30 -6.25%
CONDO 0 0 N/A $0 $0 N/A 0 0 N/A
AZUSA SFR 78 101 29.49% $408,528 $406,215 -0.57% 32 42 31.25%
CONDO 34 33 -2.94% $263,125 $285,660 8.56% 23 42 82.61%
MONTEREY PARK SFR 77 76 -1.30% $603,894 $607,236 0.55% 34 38 11.76%
CONDO 16 27 68.75% $359,594 $383,011 6.51% 95 55 -42.11%

THEPARTNERSTRUST.COMBeverly Hills | Brentwood | La Cañada Flintridge | Malibu | Ocean Park | Pasadena | Santa Monica | Shanghai