q4-2017 earnings releasefiles.shareholder.com/downloads/wabco/6322011177x0x... · wabco does not...
TRANSCRIPT

WABCO Confidential and Proprietary
Q4-2017 EARNINGS RELEASEFEBRUARY 16, 2018
JACQUES ESCULIERChairman & Chief Executive Officer
ALEXANDER DE BOCKInterim Chief Financial Officer

WABCO Confidential and Proprietary
FORWARD LOOKING STATEMENTS AND NON-GAAP FINANCIAL MEASURES
Comments in this document contain certain forward-looking statements, which are based on management’s good faith expectations and beliefs concerning future developments. Actual results may differ materially from these expectations as a result of many factors. These factors include, but are not limited to, the risks and uncertainties described in the “Risk Factors” section and the “Forward Looking Statements” section of WABCO’s Form 10-K, as well as in the “Management’s Discussion and Analysis of Financial Condition and Results of Operations - Information Concerning Forward Looking Statements” section of WABCO’s Form 10-K Report. WABCO does not undertake any obligation to update such forward-looking statements. All market and industry data are based on Company estimates.
This presentation contains certain non-GAAP financial measures as that term is defined by the SEC. Sales, gross profit, operating expenses and operating income, which are adjusted to exclude the effects of foreign exchange and are denoted by the word “adjusted” in the line item, as well as EBIT and pre-tax income attributable to company, are non-GAAP financial measures. Additionally, gross profit, operating expenses, operating income, operating income margin, EBIT, tax rate, pre-tax income attributable to company, net income attributable to company and net income attributable to company per diluted share on a “performance basis” are non-GAAP financial measures that exclude items for separation, streamlining, acquisitions, discrete and one-time tax items, and other items that management believes may mask the underlying operating results of the company, as applicable. Our tax rate guidance for the full year is presented only on a performance basis as reconciliation to an expected tax rate on a reported basis would not be meaningful due to the complex nature of such an estimate. Management believes that presenting these non-GAAP measures is useful to shareholders because it enhances their understanding of how management assesses the operating performance of the Company's business.
Free cash flow presents our net cash provided by operating activities less net purchases of property, plant, equipment and computer software. Performance free cash flow presents our net cash provided by operating activities less net purchases of property, plant, equipment and computer software; and excludes streamlining, separation and acquisition related payments. Management believes that presenting free cash flow and performance free cash flow is useful to shareholders because it demonstrates our ability to generate cash and the health of our business. Free cash flow and performance free cash flow does not represent residual cash flow available for discretionary purposes since it may not include a deduction for mandatory debt service requirements and other non-discretionary expenditures.
All of the Non-GAAP financial measures presented herein should be considered in addition to, not as a substitute for, GAAP measures. These measures may not be comparable to similar measures of other companies as not all companies calculate these measures in the same manner. Certain non-GAAP measures may be used, in part, to determine incentive compensation for current employees. Reconciliations of the non-GAAP financial measures to the most comparable GAAP measures are included herein and are available in WABCO’s quarterly results presentations posted on the company’s website.
2

WABCO Confidential and Proprietary
Q4 AND FY 2017 PERFORMANCE SUMMARY
Sales of $934.1M up 24.3% in local currencies; Up 30.9% reported
Performance operating income(1) of $144.2M vs. $105.7M in Q4’16; Reported operating income of $124.9M vs. $97.7M in Q4’16
Performance EPS(2) of $2.00 vs. $1.47 in Q4’16; Reported EPS of $3.12 vs. $1.15 in Q4’16
Sales of $3,304.2M; Up 16.0% in local currencies; Up 17.6% reported
Performance operating income(1) of $492.1M vs. $411.7M in ’16; Reported operating income of $435.0M vs. $381.9M in ’16
Performance EPS(2) of $6.86 vs. $5.80 in ’16; Reported EPS of $7.50 vs. $3.98 in ’16
Performance Free Cash Flow(6) of $361M equivalent to 97% conversion rate
Strategic acquisitions supporting the technology path to autonomous driving and strengthening market position in North America and Africa
Fourth Quarter 2017
Full Year 2017
3

WABCO Confidential and Proprietary
Q4 2017 SALES & TRUCK AND BUS MARKET OUTPERFORMANCEQ4 2017 YoY Sales Growth (4) By Channel
OE 37%• T&B markets very strong in all key regions• Strong content per vehicle growth• Acquisitions contributing 18%
Aftermarket 19%• Double-digit growth in APAC, CEE and India• Continued market headwinds from Middle East • Acquisitions contributing 15%
2017 YoY T&B Sales Growth (4) vs. Estimated Production Growth by Region
WABCO Est. Production Comments
Europe 11% 13%
North America 107% 21%
South America 40% 28%
Japan/Thailand/Korea 19% 3%
China 25% 11%
India 40% 26%
• Europe: Phase-out of prior generation AMT at major gearbox supplier
• N. America: Increasing content per vehicle from AMT and ESC; Acquisitions contributing 64%
• S. America: Increased penetration of AMT and Tristop
• Japan: Further ramp up of recent product launches including EBS and ADB at key customers
• China: Penetration increase of ABS, ECAS, EBS and ADB
• India: Increased content per vehicle and gain in market share
4
Refer to Slide #16 for Footnotes
Q4 2017 Sales Bridge
2016 2017
Organic Translational
FX
713.7
934.1
105.4
14.8%
in $
Mill
ions
47.2
6.6%
67.8
9.5%
Acquisitions

WABCO Confidential and Proprietary
2017 SALES & TRUCK AND BUS MARKET OUTPERFORMANCE2017 YoY Sales Growth (4) By Channel
OE 20%• Strong sales growth in all customer segments• T&B markets solidly up• Acquisitions contributing 5%
Aftermarket 9%
• Double-digit growth in emerging markets, strong market headwinds from Middle East partially offset by one-time replacement of competitor products
• Acquisitions contributing 4%
Sales to JVs (6)% • Completed buy out of Meritor WABCO
2017 YoY T&B Sales Growth (4) vs. Estimated Production Growth by Region
WABCO Est. Production Comments
Europe 6% 8%
North America 33% 9%
South America 27% 25%
Japan/Thailand/Korea 14% 9%
China 45% 37%
India 13% 1%
• Europe: Phase-out of prior generation AMT at major gearbox supplier
• N. America: Increasing content per vehicle from AMT and ESC; Acquisitions contributing 15%
• S. America: Increased penetration of AMT and Tristop
• Japan/Korea: Various product launches in Japan and favorable vehicle model mix in Korea
• China: Benefits from ABS mandate on LD & MD trucks and SOM gain for Air Compressors
• India: Increased content per vehicle and gain in market share
5
Refer to Slide #16 for Footnotes
2017 Sales Bridge
2016 2017
OrganicTranslational
FX
2,810.0
3,304.2376.8
13.4%
43.8
1.6%
in $
Mill
ions
73.6
2.6%
Acquisitions
WABCO Confidential and Proprietary
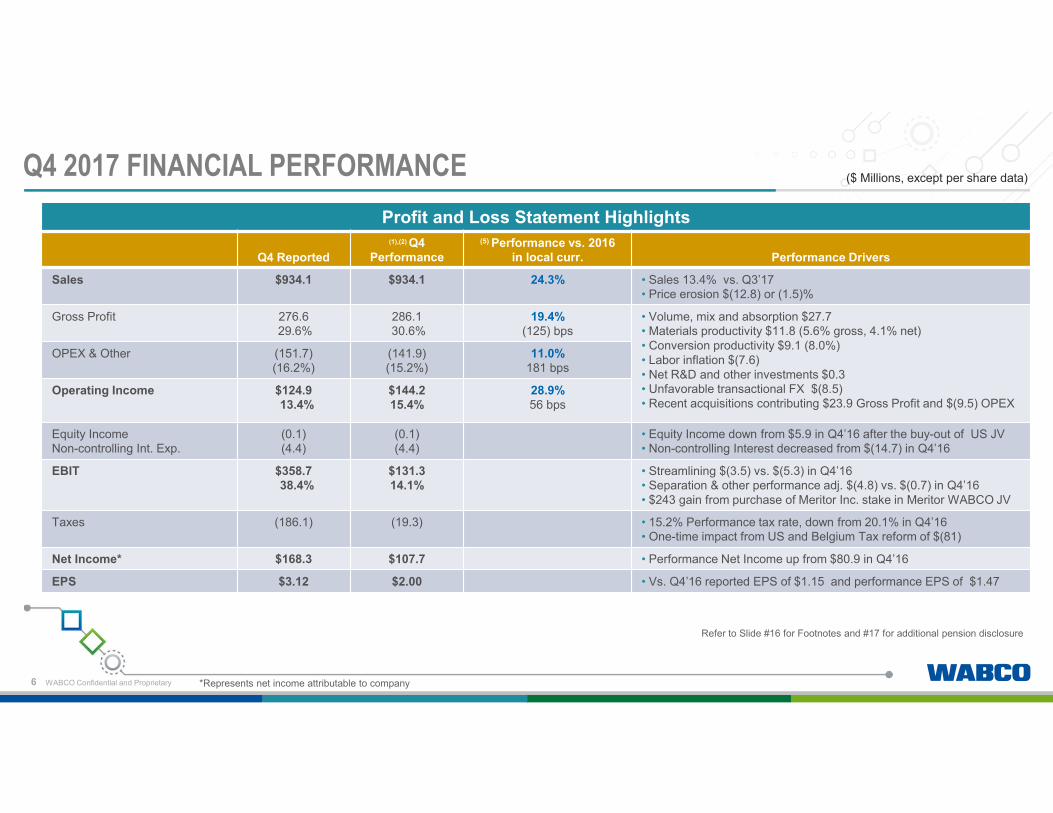
Profit and Loss Statement Highlights
Q4 Reported
(1),(2) Q4Performance
(5) Performance vs. 2016 in local curr. Performance Drivers
Sales $934.1 $934.1 24.3% • Sales 13.4% vs. Q3’17• Price erosion $(12.8) or (1.5)%
Gross Profit 276.629.6%
286.130.6%
19.4%(125) bps
• Volume, mix and absorption $27.7• Materials productivity $11.8 (5.6% gross, 4.1% net)• Conversion productivity $9.1 (8.0%)• Labor inflation $(7.6)• Net R&D and other investments $0.3• Unfavorable transactional FX $(8.5)• Recent acquisitions contributing $23.9 Gross Profit and $(9.5) OPEX
OPEX & Other (151.7)(16.2%)
(141.9)(15.2%)
11.0%181 bps
Operating Income $124.913.4%
$144.215.4%
28.9%56 bps
Equity IncomeNon-controlling Int. Exp.
(0.1)(4.4)
(0.1)(4.4)
• Equity Income down from $5.9 in Q4’16 after the buy-out of US JV• Non-controlling Interest decreased from $(14.7) in Q4’16
EBIT $358.738.4%
$131.314.1%
• Streamlining $(3.5) vs. $(5.3) in Q4’16• Separation & other performance adj. $(4.8) vs. $(0.7) in Q4’16• $243 gain from purchase of Meritor Inc. stake in Meritor WABCO JV
Taxes (186.1) (19.3) • 15.2% Performance tax rate, down from 20.1% in Q4’16• One-time impact from US and Belgium Tax reform of $(81)
Net Income* $168.3 $107.7 • Performance Net Income up from $80.9 in Q4’16
EPS $3.12 $2.00 • Vs. Q4’16 reported EPS of $1.15 and performance EPS of $1.47
*Represents net income attributable to company
($ Millions, except per share data)
Refer to Slide #16 for Footnotes and #17 for additional pension disclosure
Q4 2017 FINANCIAL PERFORMANCE
6

WABCO Confidential and Proprietary
Profit and Loss Statement Highlights
FY Reported
(1),(2) FY Performance
(5) Performance vs. 2016 in local curr. Performance Drivers
Sales $3,304.2 $3,304.2 16.0% • Price erosion $(51.6) or (1.6)%
Gross Profit 1,013.830.7%
1,028.931.1%
13.8%(61) bps
• Volume, mix and absorption $110.4• Materials productivity $46.9 (5.3% gross, 4.3% net)• Conversion productivity $36.3 (8.1%)• Labor inflation $(28.1)• Net R&D and other investments $(25.5)• Unfavorable transactional FX $(15.4)• Recent acquisitions contributing $24.8 Gross Profit and $(9.9) OPEX
OPEX & Other (578.8)(17.5%)
(536.8)(16.2%)
10.2%86 bps
Operating Income 435.013.2%
492.114.9%
18.0%25 bps
Equity IncomeNon-controlling Int. Exp.
23.1(16.8)
23.1(16.8)
• Equity Income down from $24.8 in 2016• Non-controlling Interest decreased from $(24.3) in 2016
EBIT $651.819.7%
$464.714.1%
• Non-cash pension expense up $13.0 from 2016• Streamlining $(11.9) vs. $(15.8) in 2016• Separation & other performance adj. $(20.2) vs. $(4.0) in 2016• $243 gain from purchase of Meritor Inc. stake in Meritor WABCO JV
Taxes (229.7) (77.1) • 17.2% Performance tax rate, up from 16.9% in 2016• One-time impact from US and Belgium Tax reform of $(81)
Net Income* $406.1 $371.6 • Performance Net Income up from $324.6 in 2016
EPS $7.50 $6.86 • Vs. 2016 reported EPS of $3.98 and performance EPS of $5.80
*Represents net income attributable to company
($ Millions, except per share data)
Refer to Slide #16 for Footnotes and #17 for additional pension disclosure
2017 FINANCIAL PERFORMANCE
7

WABCO Confidential and Proprietary
CASH FLOW SUMMARY 2017
8
Free Cash Flow (in $ Millions)
Cash Provided by Operating Activities:
• Net Income including non-controlling interest 422.9
• Depreciation & amortization 107.1
• Working capital (74.9)
• Changes in other assets & liabilities (33.6)
Net Cash Provided by Operating Activities 421.5
Net Purchases of PP&E, Tooling & Computer Software (110.5)
Free Cash Flow(3) reported 311.0
Streamlining, separation & acquisition related payments 49.5
Performance Free Cash Flow(6) 360.5
Refer to Slide #16 for Footnotes
• Converting 97% of performance net income into cash
• Working capital increase below sales growth
• Share buyback on hold in second half of 2017 after two strategic acquisitions; intend to restart in Q1 2018
• Capex investments maintained just above depreciation despite volume increase

WABCO Confidential and Proprietary
TAX REFORMS IN US AND BELGIUM
2017Performance Rate
TransitionTax
Deferred TaxRemeasurement
Deferred TaxRemeasurement
Other 2017US GAAP Rate
17.2%
24.0%
(7.8%) 3.4 %(1.6 %)
35.2%
$ 32M$ 14M
• Expecting 20% GAAP and performance tax rate in 2018
• 2018 cash tax will be impacted by $31M of transition tax payments
• Global tax environment (BEPS) is expected to lead to further upward pressure on the rate to mid twenties in medium term
$100M• Transition tax of $196M offset by $96M accrued in prior years
• Reduction of deferred tax liability on the gain of our share of the
former Meritor WABCO JV
• Belgium tax rate down from 34% to 30% in 2018 and 25% in 2020
• Reduction of deferred tax asset reflecting future tax rate decrease
2017
FUTURE
9

WABCO Confidential and Proprietary
MARKET DYNAMICS SHOWING POSITIVE TREND %
% of WABCOSales
2017 Global T&B Production
2016 2017
• Production up 21% in Q4 vs. a weak Q4 ’16
• Total year 2017 production was up 9% with Heavy Duty up 12%
• Further acceleration of GDP growth expected
• 2018 production outlook +8% to +13% with stronger growth in Class 8
North America
• New registrations of EU heavy trucks up 1% in Q4 and 1% for FYvs. 2016
• Total Europe Q4 ’17 T&B production up 13%; FY up 8% vs. 2016
• 2018 EU new registrations expected to be flattish; Expected continued increase in exports
• 2018 production outlook flat to +5%
Europe
• Q4 ’17 production up 11% vs. a strong Q4 ’16
• Total year 2017 production up 37% vs. 2016
• Growth supported by enforcement of overloading regulation and strength in the economy
• 2018 production outlook -25% to -15%
China
• Q4 ’17 T&B production up 26% vs. Q4 ’16
• Total year 2017 production up 1% vs. 2016
• Strong second half 2017 due to enforcement of load restrictions as well as increased demand from construction and mining
• 2018 production outlook +5% to +10%
India
18%
45%
15%56% 52% 15%
7% 7%10% 12%
0.52
18%
10
11%

WABCO Confidential and Proprietary
MARKET DYNAMICS SHOWING POSITIVE TREND
• Q4 ’17 up 4% vs. Q4 ’16 excluding impact of acquisitions
• Full year 2017 up 5% excluding impact of acquisitions
• Strong sales growth around the globe contracted by severe market depression in Middle East
• 2018 outlook +6% excluding impact of acquisitions
Aftermarket
• Q4 ’17 global production down 3% vs. Q4 ’16 followingproduction drop in China
• Total year 2017 production up 6% YoY driven by China and Europe
• 2018 production outlook -5% to flat
Trailers
• Q4 ’17 T&B production up 3% vs. Q4 ’16
• Full year 2017 up 9% vs. 2016
• Weak production in Q4 in Korea following production shutdowns driven by low demand and labour dispute
• 2018 production outlook -5% to flat
Japan & Korea
• Q4 ’17 T&B production up 28% vs. Q4 ’16
• Total year 2017 production up 25% vs. 2016
• Market continues to recover thanks to higher export and agriculture business
• 2018 production outlook +10% to +20%
Brazil8% 3%6% 6% 3% 3%
10% 9%26% 24%
%
% of WABCOSales
2017 Global T&B Production
2016 2017
11

WABCO Confidential and Proprietary
• New Long-Term Agreement to Supply Automated Manual Transmission Valve Technology: Sole supplier for a global OEM based in Europe, supporting their future series production primarily in Europe and South America.
• Extended and Expanded Strategic Partnership with Dongfeng Liuzhou Motor, One of China’s Major Truck Makers: New products and systems will upgrade technology adoption to enhance vehicle efficiency and safety.
• Acquisition of Remaining Interest in WABCO’s South African Partnership: Creates wholly owned WABCO South Africa, extending WABCO’s global portfolio to the African market, enabling continued growth region-wide.
FOCUSING ON CORE STRATEGIES
12
Globalization
Execution
New Technologies & Products
• $10 Million Strategic Investment in Nikola Motor, a Leader in Hydrogen-Electric Vehicles and Systems and Electric Vehicle Drivetrains: Agreed also to jointly develop safety technologies for electric commercial vehicles.
• New WABCO OnSide™ Advanced Blind Spot Detection System for Trucks and Trailers: When used with OnLaneASSIST™ lane keeping assist system, OnSide has capability to enable active collision avoidance.
• New Intelligent Brake Interlock Technology for Special Tank Trailers: Advanced electronic brake interlock system that improves the safety of tank trailers that haul hazardous materials or have deep-freeze equipment.
• WABCO’s R.H. Sheppard Received the PACCAR Supplier Performance Management Achiever Award:Global OEM PACCAR recognizes Sheppard for delivery performance and reliability of its steering technologies.
• WABCO India Wins Two Awards: Mahindra World City plant wins “Future Ready Factory Award” at 2017 India Manufacturing Excellence Awards; WABCO India receives “Export Excellence Award” from Indian government.
• WABCO Operating System Continued to Deliver Robust Results in 2017:
• Delivered productivity gain of $83.2 million
• Generated gross materials productivity of 5.3%, another robust result
• Generated conversion productivity of 8.1% in our factories, an annual record

WABCO Confidential and Proprietary
• Acquisitions contributing ~$200M sales growth
• Annual price erosion in line with 2017
• Raw material inflation of ~0.8% (unfavorable)
• Conversion productivity remaining at record level
2018
Sales Growth(4) 10.0% - 15.0%(in local currencies)
Reported Sales$3,820 - $3,980
1 Euro = 1.22 USD
PerformanceOp Margin(1) 14.5% - 14.9%
Performance EPS(2) $7.20 - $7.70
Performance Free Cash Flow(6) 80% - 90%
($ Millions, except per share data)
Guidance as of February 16, 2018
2018 Performance EPS(2) Guidance Range
FULL-YEAR 2018 GUIDANCE
13
Refer to Slide #16 for Footnotes
• Transactional FX vs 2017 rates negatively affecting pre-tax profits by ~$20M YoY
• Performance tax rate ~20%
• Average diluted shares ~53.4M
2018 Performance EPS(2) Guidance Bridge
Acquisitions20172018
Guidance
$7.70
$7.20
Core
$0.07 $(0.26)
FX
$0.75
$0.25
Tax rate
$6.86
$0.28

WABCO Confidential and Proprietary
WABCO DELIVERS RECORD YEAR
Continues to strongly outperform a growing global Truck and Bus market
WABCO Operating System generates record productivity gains
Record Performance EPS(2) of $6.86
Generated $361M of Performance Free Cash Flow(6) representing 97% conversion
Strategic acquisitions supporting the technology path to autonomous driving and strengthening WBC’s market position in North America
Share Buyback to be restarted in Q1 2018
14
Refer to Slide #16 for Footnotes

WABCO Confidential and Proprietary
APPENDIXRECONCILIATIONS OF NON-GAAP MEASURES TO GAAP MEASURES
15

WABCO Confidential and Proprietary
1. Adjusted for streamlining, separation costs and acquisition related costs2. Adjusted for streamlining, separation, one-time tax & discrete tax items and acquisition related costs 3. Net cash provided by operating activities less net purchases of property, plant, equipment and computer software4. Adjusted for currency translation5. Adjusted for currency translation, streamlining and separation costs and acquisition related costs 6. Free Cash Flow(3) excluding streamlining, separation and acquisition related payments
Definitions
Separation costs include all the incremental costs to establish WABCO as a stand-alone separate independent company. It also includes the costs associated with certain liabilities, including contingent liabilities, that have been assumed by WABCO from Trane, formerly American Standard, in the separation but are not related to the Vehicle Controls Business. These costs would include the (i) periodic adjustments to the carrying values of the liability, (ii) interest on certain liabilities and (iii) costs to defend certain of these assumed liabilities.
Streamlining costs are those costs that help adjust the company’s workforce and other resources to changing market requirements.
Acquisition related costs cover costs related to acquisitions and non-cash expenses associated with purchase accounting including amortization of identifiable intangible assets.
The tables that follow provide the reconciliations of the non-GAAP financial measures to the most comparable US GAAP measures.
Tables
FOOTNOTES, TABLES & DEFINITIONS
Footnotes
16

WABCO Confidential and Proprietary
ASU 2017-07 ADOPTION - COMPENSATION RETIREMENT BENEFITS
17
($ Millions)
Table below indicates how the adoption of the new accounting standard affects income statement
*includes a $3.0 million one-time charge to reflect a mortality update to one of our plans
In $ millions As reported
Retrospectivel
y revised per
ASU 2017-07
Per
ASU 2017-07
$ Change vs
2016As reported
Retrospectivel
y revised per
ASU 2017-07
Per
ASU 2017-07
$ Change vs
2016
Q1 2016 Q1 2016 Q1 2017 Q2 2016 Q2 2016 Q2 2017
Cost of Sales 3.5 2.3 2.4 0.1 3.6 2.4 2.4 -
Operating Expenses 6.1 1.7 2.7 1.0 7.6 1.8 2.8 1.0
Operating Income 9.6 4.0 5.1 1.1 11.2 4.2 5.2 1.0
Other Non-Operating Expenses - 5.6 10.8* 5.2* - 7.0 8.2 1.2
Reported Pre-Tax Income 9.6 9.6 15.9 6.3 11.2 11.2 13.4 2.2
Separation Adjustments (0.9) (0.9) (1.0) (0.1) (0.9) (0.9) (1.0) (0.1)
Performance Pre-Tax Income 8.7 8.7 14.9 6.2 10.3 10.3 12.4 2.1
Q3 2016 Q3 2016 Q3 2017 Q4 2016 Q4 2016 Q4 2017
Cost of Sales 3.7 2.4 2.7 0.3 3.9 2.6 3.2 0.6
Operating Expenses 7.4 1.8 2.8 1.0 8.4 3.1 2.7 (0.4)
Operating Income 11.1 4.2 5.5 1.3 12.3 5.7 5.9 0.2
Other Non-Operating Expenses - 6.9 8.6 1.7 - 6.6 8.2 1.6
Reported Pre-Tax Income 11.1 11.1 14.1 3.0 12.3 12.3 14.1 1.8
Separation Adjustments (0.9) (0.9) (1.0) (0.1) (1.0) (1.0) (1.0) -
Performance Pre-Tax Income 10.2 10.2 13.1 2.9 11.3 11.3 13.1 1.8
WABCO Confidential and Proprietary
Note: The presentation of the performance measures above are not in conformity with generally accepted accounting principles (GAAP). These measures may not be comparable to similar measures of other companies as not all companies calculate these measures in the same manner.
18
% of Sales/ % of Sales/ % Chg vs.
(Amounts in millions, except per share data) Adj Sales Adj Sales 2016
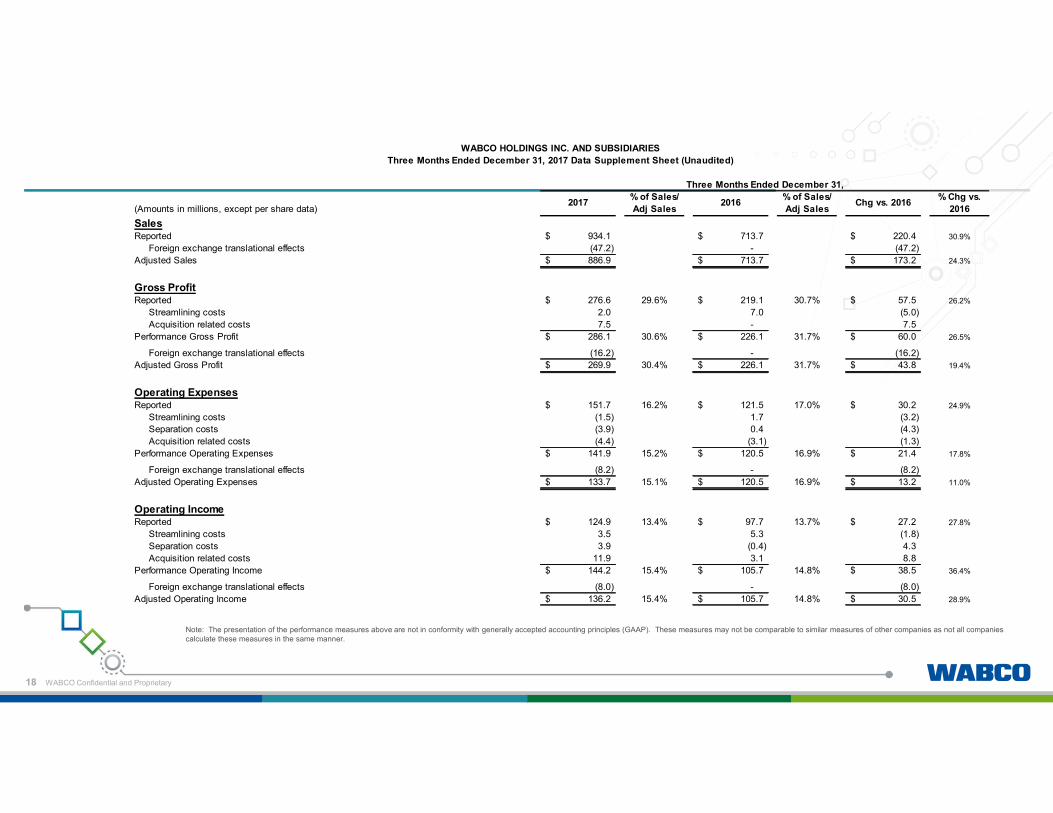
SalesReported 934.1$ 713.7$ 220.4$ 30.9%
Foreign exchange translational effects (47.2) - (47.2)
Adjusted Sales 886.9$ 713.7$ 173.2$ 24.3%
Gross ProfitReported 276.6$ 29.6% 219.1$ 30.7% 57.5$ 26.2%
Streamlining costs 2.0 7.0 (5.0)
Acquisition related costs 7.5 - 7.5
Performance Gross Profit 286.1$ 30.6% 226.1$ 31.7% 60.0$ 26.5%
Foreign exchange translational effects (16.2) - (16.2)
Adjusted Gross Profit 269.9$ 30.4% 226.1$ 31.7% 43.8$ 19.4%
Operating ExpensesReported 151.7$ 16.2% 121.5$ 17.0% 30.2$ 24.9%
Streamlining costs (1.5) 1.7 (3.2)
Separation costs (3.9) 0.4 (4.3)
Acquisition related costs (4.4) (3.1) (1.3)
Performance Operating Expenses 141.9$ 15.2% 120.5$ 16.9% 21.4$ 17.8%
Foreign exchange translational effects (8.2) - (8.2)
Adjusted Operating Expenses 133.7$ 15.1% 120.5$ 16.9% 13.2$ 11.0%
Operating IncomeReported 124.9$ 13.4% 97.7$ 13.7% 27.2$ 27.8%
Streamlining costs 3.5 5.3 (1.8)
Separation costs 3.9 (0.4) 4.3
Acquisition related costs 11.9 3.1 8.8
Performance Operating Income 144.2$ 15.4% 105.7$ 14.8% 38.5$ 36.4%
Foreign exchange translational effects (8.0) - (8.0)
Adjusted Operating Income 136.2$ 15.4% 105.7$ 14.8% 30.5$ 28.9%
WABCO HOLDINGS INC. AND SUBSIDIARIES
Three Months Ended December 31, 2017 Data Supplement Sheet (Unaudited)
Three Months Ended December 31,
2017 2016 Chg vs. 2016

WABCO Confidential and Proprietary
Note: The presentation of the performance measures above are not in conformity with generally accepted accounting principles (GAAP). These measures may not be comparable to similar measures of other companies as not all companies calculate these measures in the same manner.
(1) The tax impacts calculated are based on the statutory tax rate applicable to the item being adjusted for the jurisdiction from which the adjustment arises.
19
% of Sales/ % of Sales/ % Chg vs.
(Amounts in millions, except per share data) Adj Sales Adj Sales 2016
EBIT (Earnings Before Interest and Taxes)Reported Net Income Attributable to Company 168.3$ 63.1$ 105.2$ 166.7%
Income tax expense 186.1 16.7 169.4
Interest expense, net 4.3 3.6 0.7
EBIT 358.7$ 38.4% 83.4$ 11.7% 275.3$ 330.1%
Streamlining costs 3.5 5.3 (1.8)
Separation costs 4.8 0.7 4.1
Acquisition related costs (235.7) 3.1 (238.8)
Out-of-period noncontrolling interest correction - 12.3 (12.3)
Performance EBIT (Earnings Before Interest and Taxes) 131.3$ 14.1% 104.8$ 14.7% 26.5$ 25.3%
Pre-Tax IncomeReported Net Income Attributable to Company 168.3$ 63.1$ 105.2$
Income tax expense 186.1 16.7 169.4
Pre-Tax Income Attributable to Company 354.4$ 79.8$ 274.6$
Streamlining costs 3.5 5.3 (1.8)
Separation costs 4.8 0.7 4.1
Acquisition related costs (235.7) 3.1 (238.8)
Out-of-period noncontrolling interest correction - 12.3 (12.3)
Performance Pre-Tax Income Attributable to Company 127.0$ 101.2$ 25.8$
Tax rate on a reported basis 51.9% 17.7%
Tax rate on a performance basis 15.2% 20.1%
Net Income Attributable to CompanyReported Net Income Attributable to Company 168.3$ 63.1$ 105.2$
Streamlining costs 3.5 5.3 (1.8)
Separation costs 4.8 0.7 4.1
Acquisition related costs (235.7) 3.1 (238.8)
Out-of-period noncontrolling interest correction - 12.3 (12.3)
Tax items (1) 166.8 (3.6) 170.4
Performance Net Income Attributable to Company 107.7$ 80.9$ 26.8$
Net Income Attributable to Company per Diluted Common Share 3.12$ 1.15$
Performance Net Income Attributable to Company per Diluted Common Share 2.00$ 1.47$
Common Shares Outstanding - Diluted 53.9 55.1
Incremental Gross Profit and Operating Income Margin Gross Profit Operating Income
Increase in adjusted sales from '16 173.2 173.2
Increase in adjusted income from '16 43.8 30.5
Incremental Income as a % of Sales 25.3% 17.6%
Less: YoY Transactional Foreign Exchange (FX) Impact 8.5
Increase in adjusted income from '16 excluding transactional FX impact 39.0
Incremental income excluding transactional FX as a % of Sales 22.5%
WABCO HOLDINGS INC. AND SUBSIDIARIES
Three Months Ended December 31, 2017 Data Supplement Sheet (Unaudited)
Three Months Ended December 31,
2017 2016 Chg vs. 2016

WABCO Confidential and Proprietary
Note: The presentation of the performance measures above are not in conformity with generally accepted accounting principles (GAAP). These measures may not be comparable to similar measures of other companies as not all companies calculate these measures in the same manner.
20
% of Sales/ % of Sales/ % Chg vs.
(Amounts in millions, except per share data) Adj Sales Adj Sales 2016
SalesReported 3,304.2$ 2,810.0$ 494.2$ 17.6%
Foreign exchange translational effects (43.8) - (43.8)
Adjusted Sales 3,260.4$ 2,810.0$ 450.4$ 16.0%
Gross ProfitReported 1,013.8$ 30.7% 879.0$ 31.3% 134.8$ 15.3%
Streamlining costs 7.6 12.0 (4.4)
Acquisition related costs 7.5 0.9 6.6
Performance Gross Profit 1,028.9$ 31.1% 891.9$ 31.7% 137.0$ 15.4%
Foreign exchange translational effects (14.0) - (14.0)
Adjusted Gross Profit 1,014.9$ 31.1% 891.9$ 31.7% 123.0$ 13.8%
Operating ExpensesReported 578.8$ 17.5% 497.1$ 17.7% 81.7$ 16.4%
Streamlining costs (4.3) (3.8) (0.5)
Separation costs (16.8) (0.3) (16.5)
Acquisition related costs (20.9) (12.8) (8.1)
Performance Operating Expenses 536.8$ 16.2% 480.2$ 17.1% 56.6$ 11.8%
Foreign exchange translational effects (7.6) - (7.6)
Adjusted Operating Expenses 529.2$ 16.2% 480.2$ 17.1% 49.0$ 10.2%
Operating IncomeReported 435.0$ 13.2% 381.9$ 13.6% 53.1$ 13.9%
Streamlining costs 11.9 15.8 (3.9)
Separation costs 16.8 0.3 16.5
Acquisition related costs 28.4 13.7 14.7
Performance Operating Income 492.1$ 14.9% 411.7$ 14.7% 80.4$ 19.5%
Foreign exchange translational effects (6.4) - (6.4)
Adjusted Operating Income 485.7$ 14.9% 411.7$ 14.7% 74.0$ 18.0%
WABCO HOLDINGS INC. AND SUBSIDIARIES
Twelve months Ended December 31, 2017 Data Supplement Sheet (Unaudited)
Twelve months Ended December 31,
2017 2016 Chg vs. 2016

WABCO Confidential and Proprietary
Note: The presentation of the performance measures above are not in conformity with generally accepted accounting principles (GAAP). These measures may not be comparable to similar measures of other companies as not all companies calculate these measures in the same manner.
(1) The tax impacts calculated are based on the statutory tax rate applicable to the item being adjusted for the jurisdiction from which the adjustment arises.
21
% of Sales/ % of Sales/ % Chg vs.
(Amounts in millions, except per share data) Adj Sales Adj Sales 2016
EBIT (Earnings Before Interest and Taxes)Reported Net Income Attributable to Company 406.1$ 223.0$ 183.1$ 82.1%
Income tax expense 229.7 121.8 107.9
Interest expense, net 16.0 12.7 3.3
EBIT 651.8$ 19.7% 357.5$ 12.7% 294.3$ 82.3%
Streamlining costs 11.9 15.8 (3.9)
Separation costs 20.2 4.0 16.2
Acquisition related costs (219.2) 13.7 (232.9)
Out-of-period noncontrolling interest correction - 12.3 (12.3)
Performance EBIT (Earnings Before Interest and Taxes) 464.7$ 14.1% 403.3$ 14.4% 61.4$ 15.2%
Pre-Tax IncomeReported Net Income Attributable to Company 406.1$ 223.0$ 183.1$
Income tax expense 229.7 121.8 107.9
Pre-Tax Income Attributable to Company 635.8$ 344.8$ 291.0$
Streamlining costs 11.9 15.8 (3.9)
Separation costs 20.2 4.0 16.2
Acquisition related costs (219.2) 13.7 (232.9)
Out-of-period noncontrolling interest correction - 12.3 (12.3)
Performance Pre-Tax Income 448.7$ 390.6$ 58.1$
Tax rate on a reported basis 35.2% 33.0%
Tax rate on a performance basis 17.2% 16.9%
Net Income Attributable to CompanyReported Net Income Attributable to Company 406.1$ 223.0$ 183.1$
Streamlining cost 11.9 15.8 (3.9)
Separation costs 20.2 4.0 16.2
Acquisition related costs (219.2) 13.7 (232.9)
Out-of-period noncontrolling interest correction - 12.3 (12.3)
Tax items (1) 152.6 55.8 96.8
Performance Net Income Attributable to Company 371.6$ 324.6$ 47.0$
Net Income Attributable to Company per Diluted Common Share 7.50$ 3.98$
Performance Net Income Attributable to Company per Diluted Common Share 6.86$ 5.80$
Common Shares Outstanding - Diluted 54.1 56.0
Incremental Gross Profit and Operating Income Margin Gross Profit Operating Income
Increase in adjusted sales from '16 450.4 450.4
Increase in adjusted income from '16 123.0 74.0
Incremental Income as a % of Sales 27.3% 16.4%
Less: YoY Transactional Foreign Exchange (FX) Impact 15.4
Increase in adjusted income from '16 excluding transactional FX impact 89.4
Incremental income excluding transactional FX as a % of Sales 19.8%
WABCO HOLDINGS INC. AND SUBSIDIARIES
Twelve months Ended December 31, 2017 Data Supplement Sheet (Unaudited)
Twelve months Ended December 31,
2017 2016 Chg vs. 2016
WABCO Confidential and Proprietary22
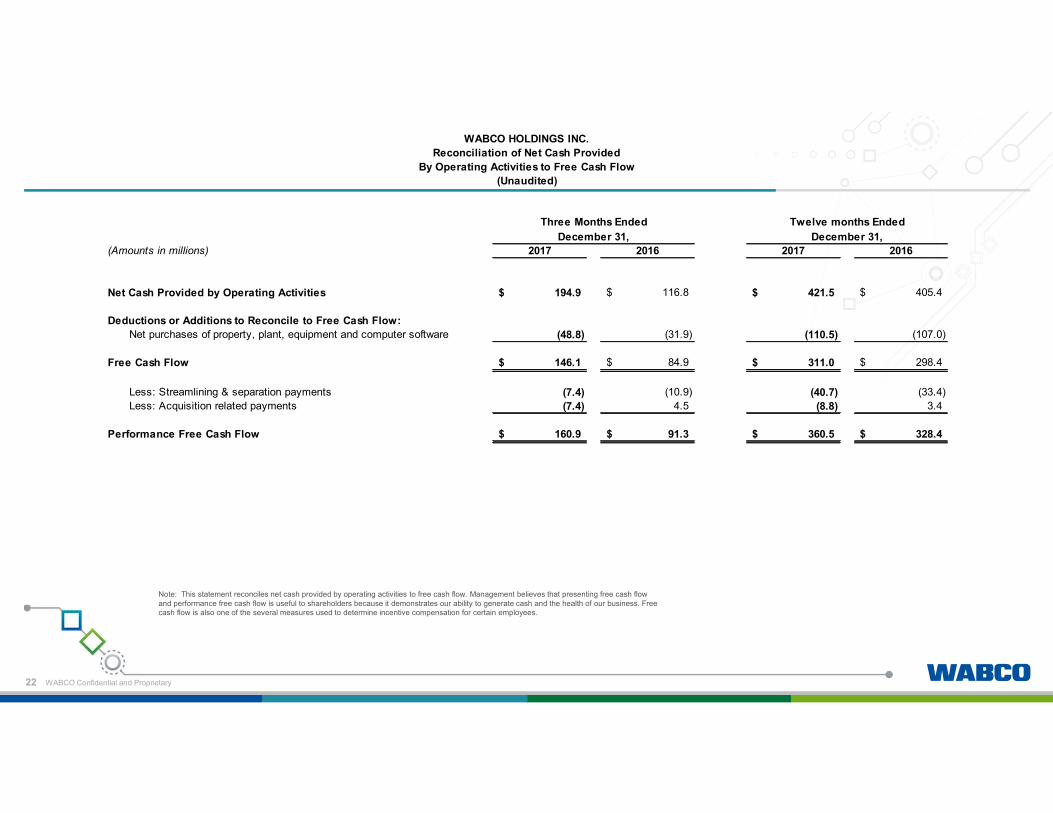
Note: This statement reconciles net cash provided by operating activities to free cash flow. Management believes that presenting free cash flow and performance free cash flow is useful to shareholders because it demonstrates our ability to generate cash and the health of our business. Free cash flow is also one of the several measures used to determine incentive compensation for certain employees.
(Amounts in millions) 2017 2016 2017 2016
Net Cash Provided by Operating Activities 194.9$ 116.8$ 421.5$ 405.4$
Deductions or Additions to Reconcile to Free Cash Flow:
Net purchases of property, plant, equipment and computer software (48.8) (31.9) (110.5) (107.0)
Free Cash Flow 146.1$ 84.9$ 311.0$ 298.4$
Less: Streamlining & separation payments (7.4) (10.9) (40.7) (33.4)
Less: Acquisition related payments (7.4) 4.5 (8.8) 3.4
160.9$ 91.3$ 360.5$ 328.4$
December 31, December 31,
Performance Free Cash Flow
WABCO HOLDINGS INC.
Reconciliation of Net Cash Provided
By Operating Activities to Free Cash Flow
(Unaudited)
Three Months Ended Twelve months Ended

WABCO Confidential and Proprietary23
Note: The presentation of performance operating income margin, performance net income and performance net income per diluted common share is not in conformity with generally accepted accounting principles (GAAP). These measures may not be comparable to similar measures of other companies as not all companies calculate these measures in the same manner.
(Amounts in millions, except per share data)
Sales
Reported Sales -
Operating Income
Reported Operating Income Margin 13.8% - 14.2%
Streamlining cost, impact to margin
Separation costs, impact to margin
Acquisition related items, impact to margin
Performance Operating Income Margin 14.5% - 14.9%
Net Income Attributable to Company
Reported Net Income Attributable to Company $361.2 - $387.9
Streamlining cost
Separation costs
Acquisition related items
Tax items (1)
Performance Net Income Attributable to Company $384.5 - $411.2
Reported Net Income Attributable to Company per Diluted Common Share (2) $6.76 - $7.26
Performance Net Income Attributable to Company per Diluted Common Share
$7.20 - $7.70
Diluted common shares outstanding ~
$3,820.0 $3,980.0
WABCO HOLDINGS INC. AND SUBSIDIARIES
Reconciliation of GAAP to Non-GAAP Financial Measures for Full Year 2018 Guidance
(Unaudited)
Full Year 2018 Guidance
(1 Euro = 1.22 USD)
0.2%
0.1%
0.4%
7.0
5.0
17.0(5.8)
53
(1) Includes the tax impacts of the above items, calculated based on the statutory tax rates applicable to each adjustment for the
jurisdiction from which the adjustment arises.

WABCO Confidential and Proprietary
THANK YOU
24