q4 2019 press release › ... › q4 › q4-2019-press-release.pdf · title: q4 2019 press release...
TRANSCRIPT

1
Exhibit 99.1Contact: Whirlpool Corporation
Media: 269/[email protected]
Financial: Roxanne Warner, 269/[email protected]
WHIRLPOOL CORPORATION REPORTS STRONG FOURTH-QUARTER AND FULL-YEAR 2019 RESULTS; PROVIDES 2020 GUIDANCE
• Very strong Q4 GAAP net earnings margin (5.4%, up 240 basis points) and ongoing (non-GAAP) EBIT margin(2) (7.2%, up 100 basis points), slightly ahead of our operational guidance.
• All-time record full-year GAAP and ongoing earnings per diluted share(1) of $18.45 and $16.00, respectively; ahead of our guidance.
• All regions profitable during Q4, with the North America region demonstrating sustained strong EBIT(3) margins of approximately 13%.
• Strong cash generation for full-year 2019; cash provided by operating activities of $1.2 billion and free cash flow(4) of $912 million.
• Solid outlook for 2020, forecasting earnings per diluted share of $14.80 to $15.80 on a GAAP basis and $16.00 to $17.00 on an ongoing(1) basis. Cash provided by operating activities in 2020 of $1.3 billion to $1.4 billion and free cash flow(4) of approximately $800 million to $900 million.
BENTON HARBOR, Mich., January 27, 2020 - Whirlpool Corporation (NYSE: WHR) today
reported financial results for the fourth-quarter and full-year 2019.
"2019 was a very strong year for Whirlpool as we successfully delivered against our
commitments and reported results that outperformed our guidance expectations despite a
continued challenging macro-environment," said Marc Bitzer, chairman and chief executive
officer of Whirlpool Corporation. “The underlying drivers of our global business are
favorable, including demand for our innovative products and a moderation of inflationary
cost pressures. We exited the year with solid momentum and are confident in our guidance
for 2020 and our ability to execute on our long-term strategy.”

2
FULL YEAR FINANCIAL HIGHLIGHTS
• GAAP net earnings and net earnings per share were $1.2 billion (5.8 percent of
sales) and $18.45 in 2019 compared to $(183) million ((0.9) percent of sales) and
$(2.72) in the prior year, driven by the gain on the sale of Embraco compressor
business of approximately $511 million, partially offset by product warranty and
liability expense of approximately $131 million.
• Ongoing EBIT(2) and ongoing earnings per diluted share(1) were $1.4 billion (6.9
percent of sales) and $16.00 in 2019, compared to $1.3 billion (6.3 percent of sales)
and $15.16 in the prior year, primarily driven by strong product price/mix and reduced
share count, partially offset by a higher effective tax rate.
• Full-year GAAP effective tax rate (ETR) of 22.8%, primarily driven by gain on sale of
Embraco.
• Full-year adjusted ETR of 15.3%, near the low end of guidance, primarily due to a
favorable European tax law change in December 2019 (~2.2 points tax rate
improvement or ~$0.40 favorable earnings per share impact).
• Net sales were $20.4 billion compared to $21.0 billion in 2018, a decrease of 2.9
percent. Organic net sales (non-GAAP)(5) increased 1.6 percent.
“We executed against our financial goals in 2019, including expanding our margins,
enhancing our free cash flow generation and strengthening our balance sheet – all while
delivering record earnings per share and continuing to invest in the business,” said Jim
Peters, chief financial officer of Whirlpool Corporation. “As momentum continues in 2020
and we progress towards our long-term financial goals, we expect to deliver further value to
our shareholders.”
FULL-YEAR 2020 OUTLOOK
• GAAP earnings per diluted share of $14.80 to $15.80
• Ongoing earnings per diluted share(1) of $16.00 to $17.00
• Effective tax rate of 20 to 25 percent
• Cash provided by operating activities of $1.3 billion to $1.4 billion
• Free cash flow(4) of $800 million to $900 million
3
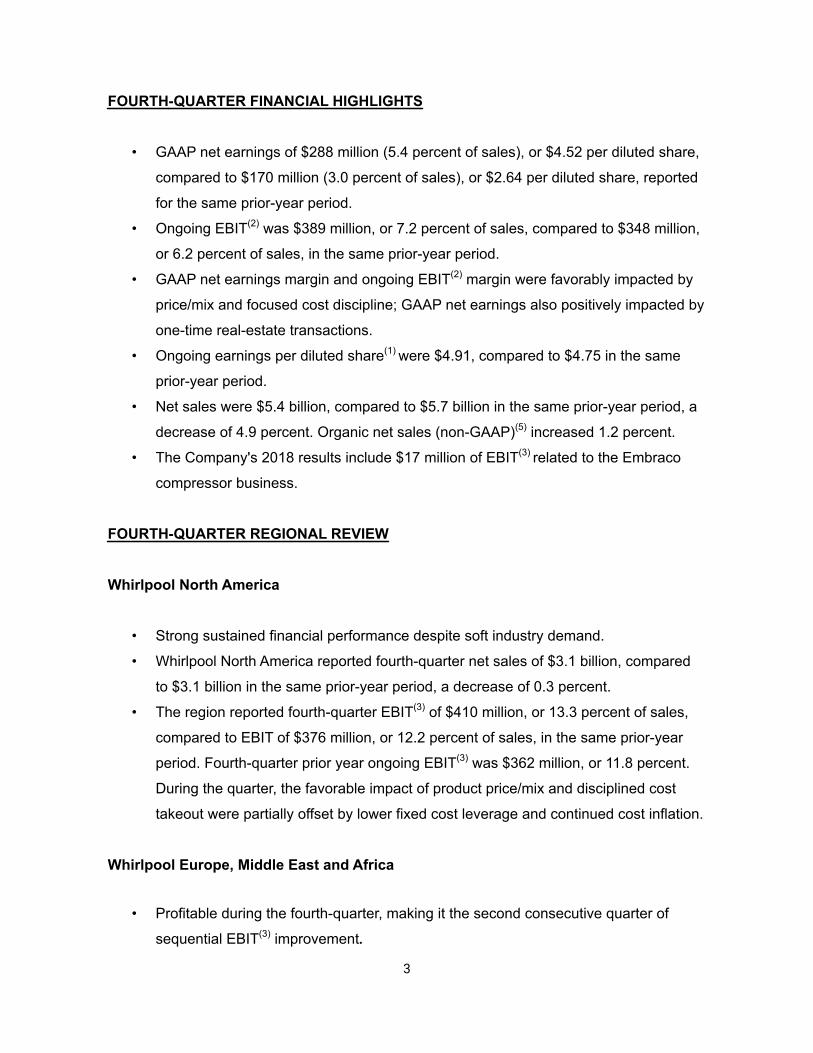
FOURTH-QUARTER FINANCIAL HIGHLIGHTS
• GAAP net earnings of $288 million (5.4 percent of sales), or $4.52 per diluted share,
compared to $170 million (3.0 percent of sales), or $2.64 per diluted share, reported
for the same prior-year period.
• Ongoing EBIT(2) was $389 million, or 7.2 percent of sales, compared to $348 million,
or 6.2 percent of sales, in the same prior-year period.
• GAAP net earnings margin and ongoing EBIT(2) margin were favorably impacted by
price/mix and focused cost discipline; GAAP net earnings also positively impacted by
one-time real-estate transactions.
• Ongoing earnings per diluted share(1) were $4.91, compared to $4.75 in the same
prior-year period.
• Net sales were $5.4 billion, compared to $5.7 billion in the same prior-year period, a
decrease of 4.9 percent. Organic net sales (non-GAAP)(5) increased 1.2 percent.
• The Company's 2018 results include $17 million of EBIT(3) related to the Embraco
compressor business.
FOURTH-QUARTER REGIONAL REVIEW
Whirlpool North America
• Strong sustained financial performance despite soft industry demand.
• Whirlpool North America reported fourth-quarter net sales of $3.1 billion, compared
to $3.1 billion in the same prior-year period, a decrease of 0.3 percent.
• The region reported fourth-quarter EBIT(3) of $410 million, or 13.3 percent of sales,
compared to EBIT of $376 million, or 12.2 percent of sales, in the same prior-year
period. Fourth-quarter prior year ongoing EBIT(3) was $362 million, or 11.8 percent.
During the quarter, the favorable impact of product price/mix and disciplined cost
takeout were partially offset by lower fixed cost leverage and continued cost inflation.
Whirlpool Europe, Middle East and Africa
• Profitable during the fourth-quarter, making it the second consecutive quarter of
sequential EBIT(3) improvement.

4
• Whirlpool Europe, Middle East and Africa reported fourth-quarter net sales of $1.2
billion, compared to $1.2 billion in the same prior-year period, a decrease of 5.5
percent. Excluding the impact of currency, sales decreased 4.2% percent.
• The region reported fourth-quarter EBIT(3) of $11 million, or 0.9 percent of sales,
compared to $(15) million, or (1.2) percent of sales, in the same prior-year period,
driven by the favorable impact of cost takeout actions.
Whirlpool Latin America
• Whirlpool Latin America reported fourth-quarter net sales of $782 million, compared
to $990 million in the same prior-year period, a decrease of 21.0 percent. Organic
net sales (non-GAAP)(5) increased 16.7 percent, despite industry softness in Mexico.
• The region reported fourth-quarter EBIT(3) of $42 million, or 5.3 percent of sales,
compared to EBIT of $45 million, or 4.5 percent of sales, in the same prior-year
period. Fourth-quarter prior year ongoing EBIT(3) was $59 million, or 5.9 percent.
During the quarter, the favorable impact of higher unit volumes and lower raw
material inflation was more than offset by unfavorable currency in Brazil and
Argentina. The Latin America region's fourth-quarter 2018 results include $17 million
of EBIT(3) related to the Embraco compressor business.
Whirlpool Asia
• India continues to deliver strong growth in a healthy demand environment.
• China brand transition investments and soft demand environment resulting in
another quarter with operating losses in China.
• Whirlpool Asia reported fourth-quarter net sales of $356 million, compared to $372
million in the same prior-year period, a decrease of 4.3 percent.
• The region reported fourth-quarter EBIT(3) of $2 million, or 0.6 percent of sales,
compared to $8 million, or 1.9 percent of sales, in the same prior-year period. During
the quarter, the favorable impact of cost takeout initiatives and lower raw material
inflation were more than offset by continued brand transition investments in China.

5
(1) A reconciliation of ongoing earnings per diluted share, a non-GAAP financial measure, to reported net earnings per diluted share available to Whirlpool and other important information, appears below.
(2) A reconciliation of earnings before interest and taxes (EBIT) and ongoing EBIT, non-GAAP financial measures, to reported net earnings available to Whirlpool, and a reconciliation of EBIT margin and ongoing EBIT margin, non-GAAP financial measures, to net earnings margin and other important information, appears below.
(3) Segment EBIT and Ongoing Segment EBIT represents our consolidated EBIT broken down by the Company's reportable segments and are metrics used by the chief operating decision maker in accordance with ASC 280. Consolidated EBIT also includes corporate "Other/Eliminations" of $(95) million and $(107) million for the fourth quarters of 2019 and 2018, respectively. Ongoing segment EBIT includes certain adjustments to segment EBIT, and a reconciliation and other important information, appears below.
(4) A reconciliation of free cash flow, a non-GAAP financial measure, to cash provided by (used in) operating activities and other important information, appears below.
(5) Organic net sales excludes the impact of foreign currency and the Embraco divestiture.

6
About Whirlpool CorporationWhirlpool Corporation (NYSE: WHR) is the leading major appliance manufacturer in the world, with approximately $20 billion in annual sales, 77,000 employees and 59 manufacturing and technology research centers in 2019. The company markets Whirlpool, KitchenAid, Maytag, Consul, Brastemp, Amana, Bauknecht, JennAir, Indesit and other major brand names in nearly every country throughout the world. Additional information about the company can be found at whirlpoolcorp.com, or find us on Twitter at @WhirlpoolCorp.
Website DisclosureWe routinely post important information for investors on our website, whirlpoolcorp.com, in the "Investors" section. We also intend to update the Hot Topics Q&A portion of this webpage as a means of disclosing material, non-public information and for complying with our disclosure obligations under Regulation FD. Accordingly, investors should monitor the Investors section of our website, in addition to following our press releases, SEC filings, public conference calls, presentations and webcasts. The information contained on, or that may be accessed through, our webpage is not incorporated by reference into, and is not a part of, this document.
Whirlpool Additional Information:This document contains forward-looking statements about Whirlpool Corporation and its consolidated subsidiaries ("Whirlpool") that speak only as of this date. Whirlpool disclaims any obligation to update these statements. Forward-looking statements in this document may include, but are not limited to, statements regarding expected earnings per share, cash flow, productivity and raw material prices. Many risks, contingencies and uncertainties could cause actual results to differ materially from Whirlpool's forward-looking statements. Among these factors are: (1) intense competition in the home appliance industry reflecting the impact of both new and established global competitors, including Asian and European manufacturers, and the impact of the changing retail environment, including direct-to-consumer sales; (2) Whirlpool's ability to maintain or increase sales to significant trade customers and the ability of these trade customers to maintain or increase market share; (3) Whirlpool's ability to maintain its reputation and brand image; (4) the ability of Whirlpool to achieve its business plans, productivity improvements, and cost control objectives, and to leverage its global operating platform, and accelerate the rate of innovation; (5) Whirlpool's ability to obtain and protect intellectual property rights; (6) acquisition and investment-related risks, including risks associated with our past acquisitions, and risks associated with our increased presence in emerging markets; (7) risks related to our international operations, including changes in foreign regulations, regulatory compliance and disruptions arising from political, legal and economic instability; (8) information technology system failures, data security breaches, data privacy compliance, network disruptions, and cybersecurity attacks; (9) product liability and product recall costs; (10) the ability of suppliers of critical parts, components and manufacturing equipment to deliver sufficient quantities to Whirlpool in a timely and cost-effective manner; (11) our ability to attract, develop and retain executives and other qualified employees; (12) the impact of labor relations; (13) fluctuations in the cost of key materials (including steel, resins, copper and aluminum) and components and the ability of Whirlpool to offset cost increases; (14) Whirlpool's ability to manage foreign currency fluctuations; (15) impacts from goodwill impairment and related charges; (16) triggering events or circumstances impacting the carrying value of our long-lived assets; (17) inventory and other asset risk; (18) the uncertain global economy and changes in economic conditions which affect demand for our products; (19) health care cost trends, regulatory changes and variations between results and estimates that could increase future funding obligations for pension and postretirement benefit plans; (20) changes in LIBOR, or replacement of LIBOR with an alternative reference rate; (21) litigation, tax, and legal compliance risk and costs, especially if materially different from the amount we expect to incur or have accrued for, and any disruptions caused by the same; (22) the effects and costs of

7
governmental investigations or related actions by third parties; and (23) changes in the legal and regulatory environment including environmental, health and safety regulations, and taxes and tariffs.
Additional information concerning these and other factors can be found in Whirlpool's filings with the Securities and Exchange Commission, including the most recent annual report on Form 10-K, quarterly reports on Form 10-Q, and current reports on Form 8-K. The number one major appliance manufacturer in the world claim is based on most recently available publicly reported annual revenues among leading appliance manufacturers.

8
WHIRLPOOL CORPORATIONCONSOLIDATED STATEMENTS OF INCOME (LOSS)
FOR THE PERIODS ENDED DECEMBER 31 (Millions of dollars, except per share data)
Three Months Ended Twelve Months Ended
2019 2018 2019 2018
(Unaudited) (Unaudited) (Unaudited)
Net sales $ 5,382 $ 5,660 $ 20,419 $ 21,037
Expenses
Cost of products sold 4,334 4,710 16,886 17,500
Gross margin 1,048 950 3,533 3,537
Selling, general and administrative 562 593 2,142 2,189
Intangible amortization 16 17 69 75
Restructuring costs 46 31 188 247
Impairment of goodwill and other intangibles — — — 747
(Gain) loss on sale and disposal of businesses — — (437) —
Operating profit (loss) 424 309 1,571 279
Other (income) expense
Interest and sundry (income) expense 54 2 (168) 108
Interest expense 39 51 187 192
Earnings (loss) before income taxes 331 256 1,552 (21)
Income tax expense (benefit) 43 86 354 138
Net earnings (loss) 288 170 1,198 (159)
Less: Net earnings (loss) available to noncontrolling interests — — 14 24
Net earnings (loss) available to Whirlpool $ 288 $ 170 $ 1,184 $ (183)
Per share of common stock
Basic net earnings (loss) available to Whirlpool $ 4.56 $ 2.66 $ 18.60 $ (2.72)
Diluted net earnings (loss) available to Whirlpool $ 4.52 $ 2.64 $ 18.45 $ (2.72)
Weighted-average shares outstanding (in millions)
Basic 63.3 64.2 63.7 67.2
Diluted 63.9 64.7 64.2 67.2

9
WHIRLPOOL CORPORATIONCONSOLIDATED BALANCE SHEETS
(Millions of dollars, except share data)
December 31,2019
December 31,2018
(Unaudited)
AssetsCurrent assets
Cash and cash equivalents $ 1,952 $ 1,498Accounts receivable, net of allowance of $132 and $136, respectively 2,198 2,210
Inventories 2,438 2,533Prepaid and other current assets 810 839Assets held for sale — 818
Total current assets 7,398 7,898Property, net of accumulated depreciation of $6,444 and $6,190, respectively 3,301 3,414Right of use assets 921 —Goodwill 2,440 2,451Other intangibles, net of accumulated amortization of $593 and $527, respectively 2,225 2,296Deferred income taxes 2,238 1,989Other noncurrent assets 358 299Total assets $ 18,881 $ 18,347Liabilities and stockholders' equityCurrent liabilities
Accounts payable $ 4,547 4,487Accrued expenses 652 690Accrued advertising and promotions 949 827Employee compensation 450 393Notes payable 294 1,034Current maturities of long-term debt 559 947Other current liabilities 918 811Liabilities held for sale — 489
Total current liabilities 8,369 9,678Noncurrent liabilities
Long-term debt 4,140 4,046Pension benefits 542 637Postretirement benefits 322 318Lease liabilities 778 —Other noncurrent liabilities 612 463
Total noncurrent liabilities 6,394 5,464Stockholders' equity
Common stock, $1 par value, 250 million shares authorized, 112 million shares issued, and 63 million and 64 million shares outstanding, respectively 112 112
Additional paid-in capital 2,806 2,768Retained earnings 7,870 6,933Accumulated other comprehensive loss (2,618) (2,695)Treasury stock, 49 million and 48 million shares, respectively (4,975) (4,827)
Total Whirlpool stockholders' equity 3,195 2,291Noncontrolling interests 923 914
Total stockholders' equity 4,118 3,205Total liabilities and stockholders' equity $ 18,881 $ 18,347

10
WHIRLPOOL CORPORATIONCONSOLIDATED STATEMENTS OF CASH FLOWS
FOR THE PERIODS ENDED DECEMBER 31 (Millions of dollars)
Twelve Months Ended
2019 2018
(Unaudited)
Operating activitiesNet earnings (loss) $ 1,198 $ (159)Adjustments to reconcile net earnings (loss) to cash provided by (used in) operating activities:
Depreciation and amortization 587 645Impairment of goodwill and other intangibles — 747(Gain) loss on sale and disposal of businesses (437) —Changes in assets and liabilities:
Accounts receivable (87) 79Inventories (39) 73Accounts payable 140 210Accrued advertising and promotions 118 12Accrued expenses and current liabilities 22 162Taxes deferred and payable, net (116) (67)Accrued pension and postretirement benefits (81) (434)Employee compensation 106 44Other (181) (83)
Cash provided by operating activities 1,230 1,229Investing activitiesCapital expenditures (532) (590)Proceeds from sale of assets and business 1,174 160Purchase of held-to-maturity securities — —Proceeds from held-to-maturity securities — 60Investment in related businesses — (25)Other (6) (4)
Cash provided by (used in) investing activities 636 (399)Financing activitiesNet proceeds from borrowings of long-term debt 700 705Repayments of long-term debt (949) (386)Net proceeds (repayments) from short-term borrowings (723) 653Dividends paid (305) (306)Repurchase of common stock (148) (1,153)Purchase of noncontrolling interest shares — (41)Common stock issued 8 17Other (7) (7)
Cash used in financing activities (1,424) (518)Effect of exchange rate changes on cash, cash equivalents and restricted cash (28) (67)Increase in cash, cash equivalents and restricted cash 414 245Cash, cash equivalents and restricted cash at beginning of year 1,538 1,293Cash, cash equivalents and restricted cash at end of year $ 1,952 $ 1,538
11
SUPPLEMENTAL INFORMATION - CONSOLIDATED FINANCIAL STATEMENTS
RECONCILIATION OF GAAP TO NON-GAAP FINANCIAL MEASURES(Millions of dollars except per share data)
(Unaudited)
We supplement the reporting of our financial information determined under U.S. generally accepted accounting principles (GAAP) with certain non-GAAP financial measures, some of which we refer to as "ongoing" measures, including earnings before interest and taxes (EBIT), EBIT margin, ongoing EBIT, ongoing EBIT margin, ongoing earnings, ongoing earnings per diluted share, organic net sales, adjusted effective tax rate, sales excluding currency and free cash flow. Ongoing measures exclude items that may not be indicative of, or are unrelated to, results from our ongoing operations and provide a better baseline for analyzing trends in our underlying businesses. Sales excluding foreign currency is calculated by translating the current period net sales, in functional currency, to U.S. dollars using the prior-year period’s exchange rate compared to the prior-year period net sales. Management believes that sales excluding foreign currency provides stockholders with a clearer basis to assess our results over time, excluding the impact of exchange rate fluctuations. Management believes that organic net sales provides stockholders with a clearer basis to assess our results over time, excluding the impact of exchange rate fluctuations and divestitures. Management believes that free cash flow provides investors and stockholders with a relevant measure of liquidity and a useful basis for assessing the company's ability to fund its activities and obligations.The Company provides free cash flow related metrics, such as free cash flow as a percentage of net sales, as long-term management goals, not an element of its annual financial guidance, and as such does not provide a reconciliation of free cash flow to cash provided by (used in) operating activities, the most directly comparable GAAP measure, for these long-term goal metrics. Whirlpool does not provide a Non-GAAP reconciliation for its other forward-looking long-term value creation and other goals, such as organic net sales, EBIT, and gross debt/EBITDA, as such reconciliation would rely on market factors and certain other conditions and assumptions that are outside of the company’s control. Any such reconciliation would rely on market factors and certain other conditions and assumptions that are outside of the company’s control. We believe that these non-GAAP measures provide meaningful information to assist investors and stockholders in understanding our financial results and assessing our prospects for future performance, and reflect an additional way of viewing aspects of our operations that, when viewed with our GAAP financial measures, provide a more complete understanding of our business. Because non-GAAP financial measures are not standardized, it may not be possible to compare these financial measures with other companies’ non-GAAP financial measures having the same or similar names. These ongoing financial measures should not be considered in isolation or as a substitute for reported net earnings available to Whirlpool per diluted share, net earnings, net earnings available to Whirlpool, net earnings margin, net sales, effective tax rate and cash provided by (used in) operating activities, the most directly comparable GAAP financial measures. We also disclose segment EBIT and ongoing segment EBIT as important financial metrics used by the Company's Chief Operating Decision Maker to evaluate performance and allocate resources in accordance with ASC 280 - Segment Reporting. GAAP net earnings available to Whirlpool per diluted share and ongoing earnings per diluted share are presented net of tax, while individual adjustments in each reconciliation are presented on a pre-tax basis; the income tax impact line item aggregates the tax impact for these adjustments. The tax impact of individual line item adjustments may not foot precisely to the aggregate income tax impact amount, as each line item adjustment may include non-taxable components. Historical quarterly earnings per share amounts are presented based on a normalized tax rate adjustment to reconcile quarterly tax rates to full-year tax rate expectations. We strongly encourage investors and stockholders to review our financial statements and publicly-filed reports in their entirety and not to rely on any single financial measure.

12
Fourth-Quarter 2019 Ongoing Earnings Before Interest and Taxes and Ongoing Earnings per Diluted Share
The reconciliation provided below reconciles the non-GAAP financial measures ongoing earnings before interest and taxes and ongoing earnings per diluted share, with the most directly comparable GAAP financial measures, net earnings available to Whirlpool and net earnings per diluted share available to Whirlpool, for the three months ended December 31, 2019. Net earnings margin is calculated by dividing net earnings available to Whirlpool by net sales. Ongoing EBIT margin is calculated by dividing ongoing EBIT by net sales. EBIT margin is calculated by dividing EBIT by net sales. The earnings per diluted share GAAP measure and ongoing measure are presented net of tax, while each adjustment is presented on a pre-tax basis. The aggregate income tax impact of the taxable components of each adjustment is presented in the income tax impact line item at our fourth-quarter adjusted tax rate (non-GAAP) of 9.6%.
Three Months Ended
Earnings Before Interest & Taxes Reconciliation: December 31, 2019
Net earnings (loss) available to Whirlpool $ 288
Net earnings (loss) available to noncontrolling interests —
Income tax expense (benefit) 43
Interest expense 39
Earnings before interest & taxes(6) $ 370
Net sales $ 5,382
Net earnings margin 5.4%
Results classification Earnings before interest & taxes(6)
Earnings perdiluted share
Reported measure $ 370 $ 4.52
Restructuring costs(a) Restructuring costs 46 0.72
Sale leaseback, real estate and receivable adjustments(k)
Cost of products sold (95) (1.49)
Sale leaseback, real estate and receivable adjustments(k)
Selling, general andadministrative
9 0.14
Trade customer insolvency claim settlement(j)
Interest and sundry(income) expense
59 0.93
Income tax impact — (0.02)
Normalized tax rate adjustment(b) — 0.11
Ongoing measure $ 389 $ 4.91
Net sales $ 5,382
Ongoing EBIT margin 7.2%
Note: Numbers may not reconcile due to rounding

13
Fourth-Quarter 2018 Ongoing Earnings Before Interest and Taxes and Ongoing Earnings per Diluted Share
The reconciliation provided below reconciles the non-GAAP financial measures ongoing earnings before interest and taxes and ongoing earnings per diluted share, with the most directly comparable GAAP financial measures, net earnings (loss) available to Whirlpool and net earnings (loss) per diluted share available to Whirlpool, for the three months ended December 31, 2018. Net earnings margin is calculated by dividing net earnings available to Whirlpool by net sales. Ongoing EBIT margin is calculated by dividing ongoing EBIT by net sales. EBIT margin is calculated by dividing EBIT by net sales. The earnings per diluted share GAAP measure and ongoing measure are presented net of tax, while each adjustment is presented on a pre-tax basis. The aggregate income tax impact of the taxable components of each adjustment is presented in the income tax impact line item at our fourth-quarter adjusted tax rate of (3.7)%.
Three Months Ended
Earnings Before Interest & Taxes Reconciliation: December 31, 2018
Net earnings (loss) available to Whirlpool $ 170
Net earnings (loss) available to noncontrolling interests —
Income tax expense (benefit) 86
Interest expense 51
Earnings (loss) before interest & taxes(6) $ 307
Net sales $ 5,660
Net earnings margin 3.0%
Resultsclassification
Earnings before interest &
taxes(6)
Earnings perdiluted share
Reported measure $ 307 $ 2.64
Restructuring costs(a) Restructuring costs 31 0.48
France antitrust settlement(h) Interest and sundry(income) expense
(12) (0.18)
Trade customer insolvency(e) Selling, general andadministrative
1 0.01
Divestiture related transition costs(d) Selling, general andadministrative
21 0.33
Income tax impact — 0.03
Normalized tax rate adjustment(b) — 1.44
Ongoing measure $ 348 $ 4.75
Net sales $ 5,660
Ongoing EBIT margin 6.2%
Note: Numbers may not reconcile due to rounding
14
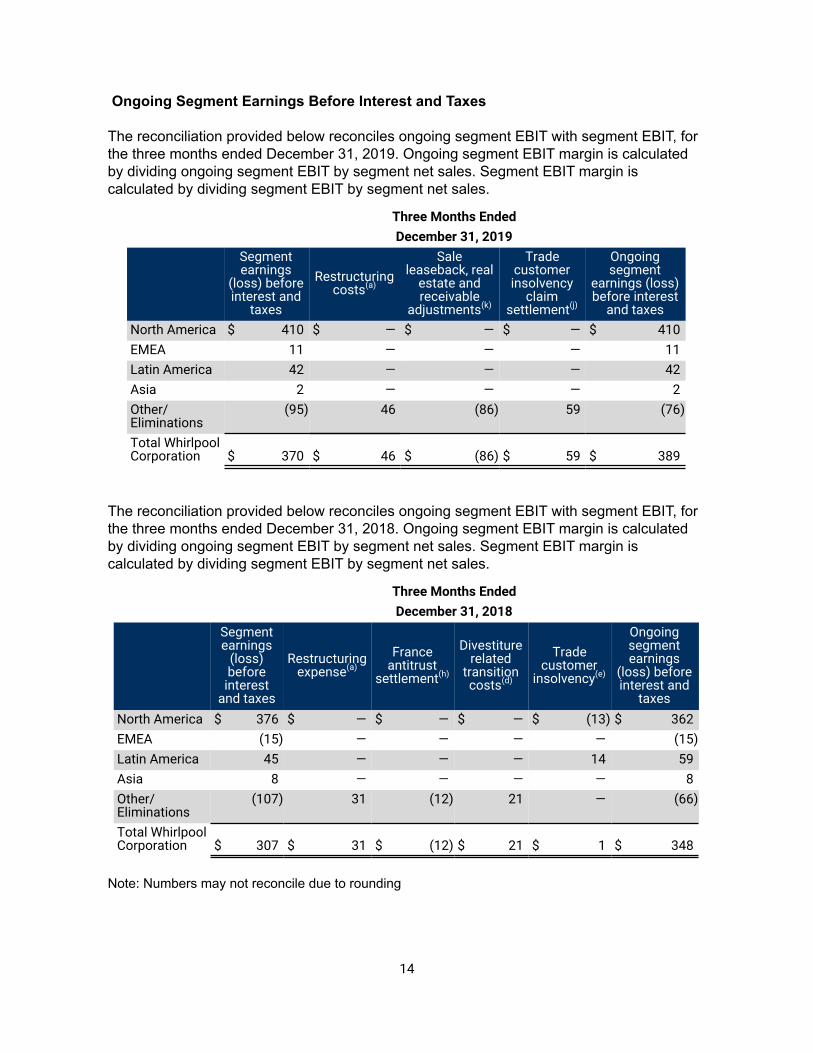
Ongoing Segment Earnings Before Interest and Taxes
The reconciliation provided below reconciles ongoing segment EBIT with segment EBIT, for the three months ended December 31, 2019. Ongoing segment EBIT margin is calculated by dividing ongoing segment EBIT by segment net sales. Segment EBIT margin is calculated by dividing segment EBIT by segment net sales.
Three Months Ended
December 31, 2019
Segmentearnings
(loss) beforeinterest and
taxes
Restructuring costs(a)
Sale leaseback, real
estate and receivable
adjustments(k)
Trade customer insolvency
claim settlement(j)
Ongoingsegment
earnings (loss)before interest
and taxes
North America $ 410 $ — $ — $ — $ 410
EMEA 11 — — — 11
Latin America 42 — — — 42
Asia 2 — — — 2
Other/Eliminations
(95) 46 (86) 59 (76)
Total WhirlpoolCorporation $ 370 $ 46 $ (86) $ 59 $ 389
The reconciliation provided below reconciles ongoing segment EBIT with segment EBIT, for the three months ended December 31, 2018. Ongoing segment EBIT margin is calculated by dividing ongoing segment EBIT by segment net sales. Segment EBIT margin is calculated by dividing segment EBIT by segment net sales.
Three Months Ended
December 31, 2018
Segmentearnings
(loss)beforeinterest
and taxes
Restructuring expense(a)
France antitrust
settlement(h)
Divestiture related
transition costs(d)
Trade customer
insolvency(e)
Ongoingsegmentearnings
(loss) beforeinterest and
taxes
North America $ 376 $ — $ — $ — $ (13) $ 362
EMEA (15) — — — — (15)
Latin America 45 — — — 14 59
Asia 8 — — — — 8
Other/Eliminations
(107) 31 (12) 21 — (66)
Total WhirlpoolCorporation $ 307 $ 31 $ (12) $ 21 $ 1 $ 348
Note: Numbers may not reconcile due to rounding

15
Full-Year 2019 Ongoing Earnings Before Interest and Taxes, Ongoing Earnings per Diluted Share and GAAP Effective Tax Rate to Non-GAAP Adjusted Tax Rate
The reconciliation provided below reconciles the non-GAAP financial measures ongoing earnings before interest and taxes and ongoing earnings per diluted share, with the most directly comparable GAAP financial measures, net earnings available to Whirlpool and net earnings per diluted share available to Whirlpool, for the twelve months ended December 31, 2019. Ongoing EBIT margin is calculated by dividing ongoing EBIT by net sales. EBIT margin is calculated by dividing EBIT by net sales. The earnings per diluted share GAAP measure and ongoing measure are presented net of tax, while each adjustment is presented on a pre-tax basis. Our full-year GAAP tax rate of approximately 22.8% includes the impact of the gain on sale of Embraco. The aggregate income tax impact of the taxable components of each adjustment is presented in the income tax impact line item at our full-year adjusted tax rate of approximately 15.3%.
Twelve Months Ended
Earnings Before Interest & Taxes Reconciliation: December 31, 2019
Net earnings (loss) available to Whirlpool $ 1,184
Net earnings (loss) available to noncontrolling interests 14
Income tax expense (benefit) 354
Interest expense 187
Earnings before interest & taxes(6) $ 1,739
Net sales $ 20,419
Net earnings margin 5.8%

16
Twelve Months Ending
December 31, 2019
Results classification Earnings before interest & taxes(6)
Earnings perdiluted share
Reported measure* $ 1,739 $ 18.45
Restructuring costs(a) Restructuring costs 188 2.93
Brazil indirect tax credit(c) Interest and sundry(income) expense
(180) (2.80)
(Gain) loss on sale and disposal of businesses(f)
(Gain) loss on sale anddisposal of businesses
(437) (6.79)
Product warranty and liability expense(g)
Cost of products sold 126 1.96
Product warranty and liability expense(g)
Interest and sundry(income) expense
5 0.08
Sale leaseback, real estate and receivable adjustments(k)
Cost of products sold (95) (1.48)
Sale leaseback, real estate and receivable adjustments(k)
Selling, general andadministrative
9 0.14
Trade customer insolvency claim settlement(j)
Interest and sundry(income) expense
59 0.92
Income tax impact — 0.75
Normalized tax rate adjustment(b) — 1.84
Ongoing measure $ 1,414 $ 16.00
Net sales $ 20,419
Ongoing EBIT margin 6.9%
Twelve Months Ended
December 31, 2019
GAAP effective tax rate 22.8 %
Tax effect of non-GAAP adjustmentsto net earnings
(7.5)%
Non-GAAP adjusted tax rate 15.3 %
Note: Numbers may not reconcile due to rounding

17
Full-Year 2018 Ongoing Earnings Before Interest and Taxes and Ongoing Earnings per Diluted Share
The reconciliation provided below reconciles the non-GAAP financial measures ongoing earnings before interest and taxes and ongoing earnings per diluted share, with the most directly comparable GAAP financial measures, net earnings (loss) available to Whirlpool and net earnings (loss) per diluted share available to Whirlpool, for the twelve months ended December 31, 2018. Net earnings margin is calculated by dividing net earnings available to Whirlpool by net sales. Ongoing EBIT margin is calculated by dividing ongoing EBIT by net sales. EBIT margin is calculated by dividing EBIT by net sales. The earnings per diluted share GAAP measure and ongoing measure are presented net of tax, while each adjustment is presented on a pre-tax basis. Our full-year GAAP tax rate includes the nondeductible earnings impact of the impairment of goodwill and intangibles of $747 million and the France antitrust settlement charge of $103 million. The aggregate income tax impact of the taxable components of each adjustment is presented in the income tax impact line item at our full-year adjusted tax rate of approximately 6.6%.
Twelve Months Ended
Earnings Before Interest & Taxes Reconciliation: December 31, 2018
Net earnings (loss) available to Whirlpool $ (183)
Net earnings (loss) available to noncontrolling interests 24
Income tax expense (benefit) 138
Interest expense 192
Earnings before interest & taxes(6) $ 171
Net sales $ 21,037
Net earnings margin (0.9)%
Results classification Earnings before interest & taxes(6)
Earnings (loss)per diluted share
Reported measure $ 171 $ (2.72)
Restructuring costs(a) Restructuring costs 247 3.68
France antitrust settlement (h) Interest and sundry(income) expense
103 1.53
Impairment of goodwill and intangibles (i)
Impairment of goodwilland other intangibles
747 11.11
Trade customer insolvency(e) Selling, general andadministrative
30 0.45
Divestiture related transition costs(d) Selling, general andadministrative
21 0.32
Income tax impact — (0.29)
Normalized tax rate adjustment(b) — 1.25
Share adjustment* — (0.17)
Ongoing measure $ 1,319 $ 15.16
Net sales $ 21,037
Ongoing EBIT margin 6.3%

18
Note: Numbers may not reconcile due to rounding
*As a result of our full-year GAAP earnings loss, the impact of antidilutive shares was excluded from the loss per share calculation on a GAAP basis. The share count adjustment used in the calculation of the full year ongoing earnings per diluted share includes the full-year weighted average basic shares outstanding of 67.2 million plus the impact of antidilutive shares of 0.7 million which were excluded on a GAAP basis.
19
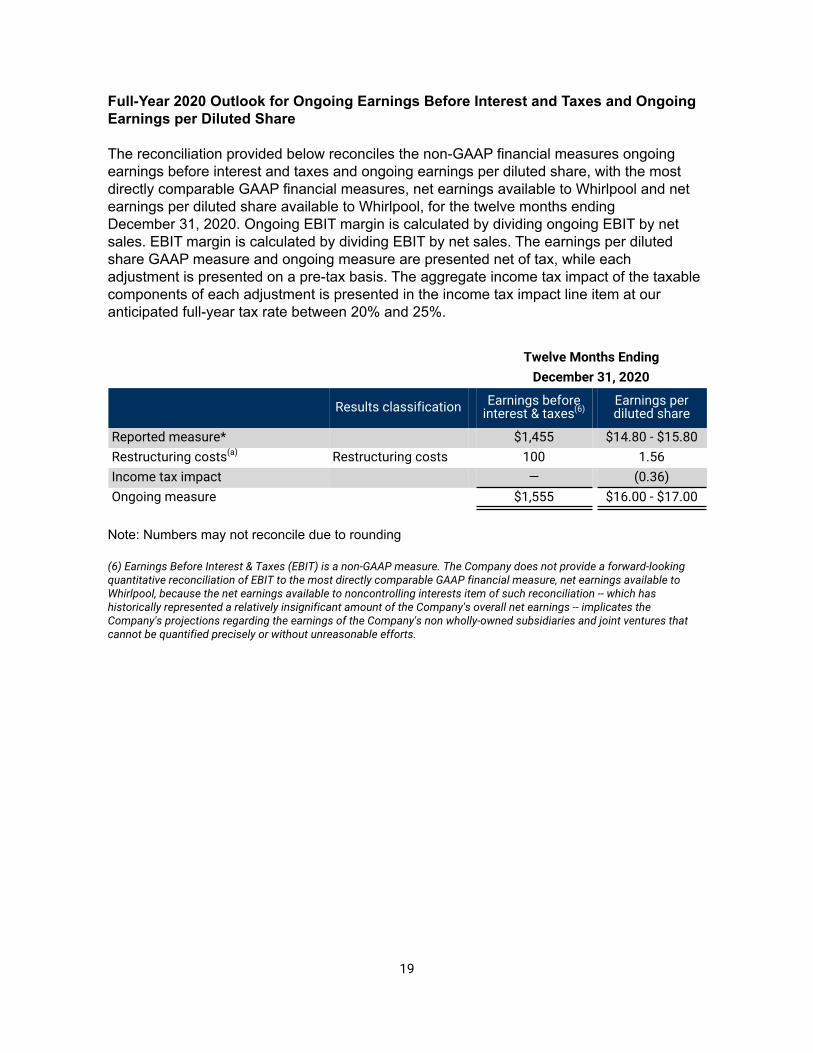
Full-Year 2020 Outlook for Ongoing Earnings Before Interest and Taxes and Ongoing Earnings per Diluted Share
The reconciliation provided below reconciles the non-GAAP financial measures ongoing earnings before interest and taxes and ongoing earnings per diluted share, with the most directly comparable GAAP financial measures, net earnings available to Whirlpool and net earnings per diluted share available to Whirlpool, for the twelve months ending December 31, 2020. Ongoing EBIT margin is calculated by dividing ongoing EBIT by net sales. EBIT margin is calculated by dividing EBIT by net sales. The earnings per diluted share GAAP measure and ongoing measure are presented net of tax, while each adjustment is presented on a pre-tax basis. The aggregate income tax impact of the taxable components of each adjustment is presented in the income tax impact line item at our anticipated full-year tax rate between 20% and 25%.
Twelve Months Ending
December 31, 2020
Results classification Earnings before interest & taxes(6)
Earnings per diluted share
Reported measure* $1,455 $14.80 - $15.80
Restructuring costs(a) Restructuring costs 100 1.56
Income tax impact — (0.36)
Ongoing measure $1,555 $16.00 - $17.00
Note: Numbers may not reconcile due to rounding
(6) Earnings Before Interest & Taxes (EBIT) is a non-GAAP measure. The Company does not provide a forward-looking quantitative reconciliation of EBIT to the most directly comparable GAAP financial measure, net earnings available to Whirlpool, because the net earnings available to noncontrolling interests item of such reconciliation -- which has historically represented a relatively insignificant amount of the Company's overall net earnings -- implicates the Company's projections regarding the earnings of the Company's non wholly-owned subsidiaries and joint ventures that cannot be quantified precisely or without unreasonable efforts.

20
Organic Net Sales
The reconciliation provided below reconciles the non-GAAP financial measure organic net sales with reported net sales, for the three months ended December 31, 2019 and December 31, 2018 for the Company.
Three Months Ended
2019 2018 Change
Net sales $ 5,382 $ 5,660 (4.9)%
Less: Embraco net sales - (288)
Add-Back: currency 53 —
Organic net sales $ 5,435 $ 5,372 1.2 %
The reconciliation provided below reconciles the non-GAAP financial measure organic net sales with reported net sales, for the twelve months ended December 31, 2019 and December 31, 2018 for the Company.
Twelve Months Ended
2019 2018 Change
Net sales $ 20,419 $ 21,037 (2.9)%
Less: Embraco net sales (635) (1,135)
Add-Back: currency 430 —
Organic net sales $ 20,214 $ 19,902 1.6 %
The reconciliation provided below reconciles the non-GAAP financial measure organic net sales with reported net sales, for the three months ended December 31, 2019 and December 31, 2018 for Whirlpool Latin America.
Three Months Ended
2019 2018 Change
Net sales $ 782 $ 990 (21.0)%
Less: Embraco net sales — (288)
Add-Back: currency 37 —
Organic net sales $ 819 $ 702 16.7 %
Note: Numbers may not reconcile due to rounding

21
Footnotes:
a. RESTRUCTURING COSTS - In 2014, the Company completed the acquisition of Indesit S.p.A., which, due to its size, materially changed our European footprint. In 2018, these costs are primarily related to Indesit restructuring, an Embraco plant closure in Italy, and certain other unique restructuring events. In 2019, these costs are primarily related to actions that right-size our EMEA business and certain other unique restructuring events, including restructuring of the Naples, Italy manufacturing plant.
b. NORMALIZED TAX RATE ADJUSTMENT - Our 2019 normalized tax rate excludes the tax impact of the gain on sale of the Embraco business, a valuation allowance release and the Brazil indirect tax credit. The Company's 2018 normalized tax rate excludes the tax impact of impairment of goodwill and intangibles of $747 million, the France antitrust settlement charge of $103 million and the impact of U.S. tax reform of $95 million.
c. BRAZIL INDIRECT TAX CREDIT - During the first half of 2019, the Company received favorable, non-appealable decisions related to the recovery of certain taxes previously paid over gross sales. As a result, the Company recorded a gain in interest and sundry (income) expense during the first and second quarter of 2019 in the amount of $127 million and $53 million, respectively, in connection with these decisions.
d. DIVESTITURE RELATED TRANSITION COSTS - In the fourth quarter of 2018, the Company recognized transition costs of approximately $21 million associated with the sale of its Embraco compressor business. During the first and second quarter of 2019, the Company recognized additional transition costs of $6 million and $11 million, respectively. In the third quarter of 2019, the Company reclassified approximately $17 million of first half 2019 divestiture related transition costs into "(Gain) loss on sale and disposal of businesses" to fully reflect the net impact from the gain on the sale of the Embraco compressor business.
e. TRADE CUSTOMER INSOLVENCY - During the third quarter of 2018, the Company recognized bad debt expense related to trade customer insolvency of a U.S. retailer and a Brazilian retailer, in the amounts of approximately $17 million and $12 million, respectively. During the fourth quarter of 2018, the Company recognized an additional bad debt expense related to the Brazilian retailer in the amount of approximately $14 million, and reduced bad debt expense related to the U.S. retailer in the amount of approximately $13 million.
f. (GAIN) LOSS ON SALE AND DISPOSAL OF BUSINESSES - During the second quarter of 2019, the Company entered into an agreement to sell its South Africa operations. As a result, the Company recorded a charge of $35 million for the write-down of the assets of the disposal group to fair value and $33 million of cumulative foreign currency translation adjustments included in the carrying amount of the disposal group to calculate the impairment. The Company also incurred charges of approximately $11 million, primarily inventory liquidation costs, related to the exit of our domestic sales operations in Turkey. Total charges recorded in the second quarter of 2019 were approximately $79 million. During the third quarter of 2019, changes in working capital accounts and currency translation adjustments resulted in the Company reducing the amount of loss by approximately $5 million.

22
On July 1, 2019 the Company closed the sale of the Embraco compressor business. As a result, the Company recorded a gain, before taxes, of approximately $511 million. Included in this amount are closing costs related to the sale and previously disclosed divestiture related transition costs. To report the full gain amount as net of these costs, the Company reclassified previously disclosed divestiture related transition costs from their original accounts into the account for the gain. Approximately $14 million of previously disclosed charges were reclassified out of “Selling, general and administrative” into “(Gain) loss on sale and disposal of businesses.” Approximately $3 million of previously disclosed charges were reclassified out of “Interest and sundry (income) expense” into “(Gain) loss on sale and disposal of businesses.” During the third quarter of 2019, the Company incurred approximately $17 million of additional divestiture related transition costs, resulting in a year-to-date total of approximately $34 million, which are fully reflected in the gain, before taxes, of approximately $511 million.
g. PRODUCT WARRANTY AND LIABILITY EXPENSE - In September 2015, the Company recorded a liability related to a corrective action affecting certain legacy Indesit products. During the second and third quarters of 2019, the Company incurred additional product warranty expense related to our previously disclosed legacy Indesit dryer corrective action campaign in the UK for approximately $12 million and $14 million, respectively. In the third quarter of 2019, the Company recorded a charge of approximately $105 million for estimated product warranty expense related to certain EMEA-produced washers for which the Company commenced a recall in January 2020.
h. FRANCE ANTITRUST SETTLEMENT - In 2013, the French Competition Authority ("FCA") commenced an investigation of appliance manufacturers and retailers, including Whirlpool and Indesit operations in France. With respect to the first part of the investigation, the Company agreed to a preliminary settlement with the FCA staff in the second quarter of 2018 and accrued $114 million. In the fourth quarter of 2018, the final settlement was approved by the FCA's college of commissioners in the amount of approximately $122 million, with approximately $19 million of the total settlement to be paid by the previous owner of Indesit to the Company. The Company paid $52 million in the first quarter of 2019 and the remainder in the second quarter of 2019.
i. IMPAIRMENT OF GOODWILL AND INTANGIBLES - During the second quarter of 2018, the Company performed a quantitative assessment of the EMEA region's goodwill and intangible assets for impairment. Based on a third-party valuation, the Company concluded that fair value of equity did not exceed its carrying value and therefore goodwill and intangible assets were impaired. The impact of this impairment was $168 million to intangible assets and $579 million to goodwill in the second quarter of 2018.
j. TRADE CUSTOMER INSOLVENCY CLAIM SETTLEMENT - In 2017, Alno AG and certain affiliated companies filed for insolvency protection in Germany. Bauknecht Hausgeräte GmbH, a subsidiary of the Company, was a long-standing supplier to Alno and certain of its affiliated companies. The Company was also a former indirect minority shareholder of Alno. In August 2018, the insolvency trustee asserted €174.5 million in clawback and related claims against Bauknecht. In January 2020, we entered into an agreement with the insolvency trustee to settle all potential claims that the insolvency trustee may have related to this matter, resulting in a one-time charge of €52.75 million ($59 million as of December 31, 2019).

23
k. SALE LEASEBACK, REAL ESTATE AND RECEIVABLE ADJUSTMENTS - In the fourth quarter of 2019, the Company sold certain owned properties, primarily warehouses, while agreeing to lease these same properties from the purchaser. As part of the sale, the Company recognized a pre-tax gain on sale of the group of properties of approximately $111M and a cash benefit of approximately $140M. In addition, the Company wrote-off the full loan receivable amount outstanding of approximately $18M related to a previous loan between the Company and a not-for-profit entity in connection with a community and economic development project. The Company also wrote-down the book value of certain real estate properties, recognizing a loss of approximately $7M.

24
Free Cash Flow
As defined by the Company, free cash flow is cash provided by (used in) operating activities after capital expenditures, proceeds from the sale of assets and businesses and changes in restricted cash. The reconciliation provided below reconciles twelve months ended December 31, 2019 and 2018 and projected 2020 full-year free cash flow with cash provided by (used in) operating activities, the most directly comparable GAAP financial measure. Free cash flow as a percentage of net sales is calculated by dividing free cash flow by net sales.
Twelve Months EndedDecember 31
(millions of dollars) 2019 2018 2020 Outlook
Cash provided by (used in) operating activities $1,230 $1,229 $1,350 - $1,450
Capital expenditures, proceeds from sale of assets/businesses and change in restricted cash*
682 (376) (550)
Repayment of term loan (1,000) — —
Free cash flow $912 $853 $800 - $900
Cash provided by (used in) investing activities** $636 $(399)
Cash provided by (used in) financing activities** $(1,424) $(518)
Note: 2019 free cash flow includes the net proceeds and the term loan repayment related to the sale of the Embraco business of approximately $1 billion. *The change in restricted cash relates to the private placement funds paid by Whirlpool to acquire majority control of Whirlpool China (formerly Hefei Sanyo) and which are used to fund capital and technical resources to enhance Whirlpool China’s research and development and working capital, as required by the terms of the Hefei Sanyo acquisition completed in October 2014.
**Financial guidance on a GAAP basis for cash provided by (used in) financing activities and cash provided by (used in) investing activities has not been provided because in order to prepare any such estimate or projection, the Company would need to rely on market factors and certain other conditions and assumptions that are outside of its control.
# # #