q4 and preliminary results 2015 - otc.nfmf.nootc.nfmf.no/public/news/15958_2.pdf · shares listed...
TRANSCRIPT

-- Q4 and preliminary results 2015
29 February 2016

13/29/77
0/51/153
Colour scheme
54/97/222
121/150/233
188/202/244
217/217/217
191/191/191
166/166/166
127/127/127
B2H-blue
1. Introduction to B2Holding
2. Financials
Agenda
| 2

13/29/77
0/51/153
Colour scheme
54/97/222
121/150/233
188/202/244
217/217/217
191/191/191
166/166/166
127/127/127
B2H-blue
B2Holding is one of the leading debt purchasers and collection
players in Europe focusing on attractive regions
B2Holding today Geographical presence
Key facts and figures
Shares listed on OTC with a MCAP of around NOK 4.5bn
1,331 employees (as of 31 December 2015), headquarter in
Oslo
Established as one of the leading debt purchaser and
collection player in attractive regions
- Pan-European platform established in the Nordics, the Baltics
and Central and Eastern Europe (Poland and the Balkans)
Main focus on NPLs from the banking sector as well as
providing third party debt collection solutions on behalf of
clients
Overall administration, financing and business development
coordinated from Oslo
Centre of excellence for portfolio investments set in
Luxembourg
- Analysis, valuation, scoring and benchmarking to be carried out
by an experienced team
Platforms and
portfolios:
Norway
Sweden
Finland
Estonia
Latvia
Poland
Croatia
Serbia
Slovenia
Montenegro
Portfolios
(no operation):
Italy
Lithuania
Denmark
Romania
Offices:
Austria
Luxembourg
Netherlands
NOKm 2014 2015 Q4 2014 Q4 2015
Total cash revenue 740 1,500 330 469
Total operating revenue 510 1,076 244 345
Cash EBITDA 333 829 140 240
EBITDA 103 405 54 117
Equity ratio 46% 35% 46% 35%
Total Estimated remaining collection (ERC) 4,430 6,490 4,430 6,490
Total claims outstanding (mill) 3.45 3.99 3.45 3.99
Portfolio face value 30,931 44,221 30,931 44,221
| 3

13/29/77
0/51/153
Colour scheme
54/97/222
121/150/233
188/202/244
217/217/217
191/191/191
166/166/166
127/127/127
B2H-blue
2013 2011 2012 2014
European platform built through acquisitions of well-established
companies
April 2013:
Acquisition of
Resurs Bank
portfolio
November 2011:
B2Holding AS
established
April 2013:
Acquisition of
Interkreditt AS
July 2013:
Acquisition of
portfolio from
Latvijas Krājbanka
January 2014:
Acquisition of
Creditreform Latvija
September 2014:
Acquisition of NPL-
portfolios from
Hypo Alpe Adria
August 2014:
Acquisition of
Ultimo
September 2012:
Acquired OK
Perinta; Finland’s
third largest debt
collector
[Estonia]
October 2013:
B2Kapital
d.o.o.(Croatia)
established
Acquired first
portfolio in
December 2013
April 2012:
Acquired 50.1% of
Sileo Kapital AB
B2H now owns
100% of Sileo
2015
As of 2015:
NOK 672m in Q4
and in total for
2015 NOK 1,358m
in portfolio
investments
| 4

13/29/77
0/51/153
Colour scheme
54/97/222
121/150/233
188/202/244
217/217/217
191/191/191
166/166/166
127/127/127
B2H-blue
Established a unique market position through 10 collection
platforms: – A diversified risk profile
| 5
The Nordics
• Stable flow
• Mainly unsecured debt
• High cash flow projection certainty
• High price in % of face value
The Balkans
• Growth market
• Mix unsecured/secured
• Low price in % of face value
Poland
• Large and stable cash flows
• Mainly unsecured debt
• Significant growth in secured debt
from non-banks
The Baltics
• Mainly unsecured debt
• Low transaction volume
• Focus redirection from third party
collection to DP
• Significant growth in secured debt
Mature market
Growth market
Four separate
platforms under
B2Kapital
Two separate
platforms under
OK Perinta

Established
(month/year)
11 / 2011
Collection platforms
(#)
10
Countries present*
(#)
14
Portfolios acquired
(#)
2,000+
Employees
(#)
~1,331
Equity raised
(NOKm)
~1,500
Cash revenue
(NOKm)
~1,500
Net interest-bearing debt
(NOKm)
~1,800
Financial figures for the year ending and as of 31 Dec 2015
*Platforms in 10 countries, portfolios in 14 countries
Total ERC
(NOKm)
~6,490

13/29/77
0/51/153
Colour scheme
54/97/222
121/150/233
188/202/244
217/217/217
191/191/191
166/166/166
127/127/127
B2H-blue
B2 Holding current status
Highlights for the fourth quarter
B2Holding has established itself as one of the leading players in the markets where the Group operates
Important events
- Raised EUR 150m in bond debt and refinanced existing debt with an EUR 260m bank facility
- High portfolio purchases in Q4 with a total of NOK 672m invested
- Hired team focused on secured claims, and invested in secured portfolios – building up portfolio workout department
Overall portfolio activity is high, with significant investment opportunities in the Group’s existing markets
- The group acquired portfolios in all markets where it has presence, and views this as a good sign that the current geographic foot print is a
solid platform for further growth
- In the Balkans activity is high, and the organization is growing on the back of new portfolios acquisitions
Strong growth and strong portfolio pipeline
M&A opportunities are under evaluation
Key financial targets established
| 7

13/29/77
0/51/153
Colour scheme
54/97/222
121/150/233
188/202/244
217/217/217
191/191/191
166/166/166
127/127/127
B2H-blue
Agenda
1. Introduction to B2Holding
2. Financials
| 8

13/29/77
0/51/153
Colour scheme
54/97/222
121/150/233
188/202/244
217/217/217
191/191/191
166/166/166
127/127/127
B2H-blue
Financial highlights as of Q4’15
1) Adjusted for extraordinary items. ROE based on average equity
2) 39.4% equity ratio based on target cash position of NOK 300m
3) Cash EBITDA defined as operating EBITDA plus portfolio amortisation
4) Excess cash (cash above minimum cash position of NOK 300m) plus undrawn amount on the revolving credit facility
Available liquidity (NOK)4
2015:
NOK 1.8 billion
Cash EBITDA (NOK)2
Adjusted net profit (NOK)1
Portfolio acquisitions
Increasing collections and Cash EBITDA Increasing profits and acquisition activity Solid balance sheet and return on capital
Cash collection (NOK)
629
113%
2014 2015
1,339 277
101
174%
2015 2014
Equity ratio2 2015:
2014: 46.4%
35.5% 18.2%
Adjusted ROE1 2015:
2014: 12.2%
333
829
2015 2014
149%
527
2015
1,358
2014
1,551
157%
| 9

13/29/77
0/51/153
Colour scheme
54/97/222
121/150/233
188/202/244
217/217/217
191/191/191
166/166/166
127/127/127
B2H-blue
Strong acquisition activity in the fourth quarter
Activities in connection with portfolio acquisitions were high,
The group acquired portfolios in all markets where it has
presence, and views this as a good sign that the current
geographic foot print is a solid platform for further growth
In the Balkans activity is high, and the organization is
growing on the back of new portfolios acquisitions
2015 portfolio purchases by geography (NOKm)
Comments Portfolio purchases
NOK million
672
304318
64
Q2 2015 Q4 2015 Q1 2015 Q3 2015
310 (23%)
Finland and Estonia
Balkans
13 (1%) Poland
Rest of Nordics
67 (5%)
334 (25%)
634 (47%)
Baltics
•c
| 10

13/29/77
0/51/153
Colour scheme
54/97/222
121/150/233
188/202/244
217/217/217
191/191/191
166/166/166
127/127/127
B2H-blue
Healthy portfolio growth in attractive markets
Portfolio development Gross ERC split by region per 2015 (NOKm)
NOKm 2013 2014 2015
Portfolio purchases
Total claims outstanding
(millions)
Total face value
outstanding
Total gross ERC
120 month ERC
Q1-Q3 Q4
61
(1%)
Rest of Nordics
Finland and Estonia
795
(12%)
958
(15%)
Balkans
1,813
(28%)
Poland 2,864
(44%)
Baltics
•c
686
527562672
1,358
3.45
0.30
3.84
3.99
38,188 2,594
6,033 44,221
30,931
5,316 1,371
1,174
6,490
4,430
6,300
4,319
| 11
13/29/77
0/51/153
Colour scheme
54/97/222
121/150/233
188/202/244
217/217/217
191/191/191
166/166/166
127/127/127
B2H-blue
1,668
1,318
1,031
797
585
341 239
166 99 57
191
0
200
400
600
800
1,000
1,200
1,400
1,600
1,800
1 2 3 4 5 6 7 8 9 10 >10
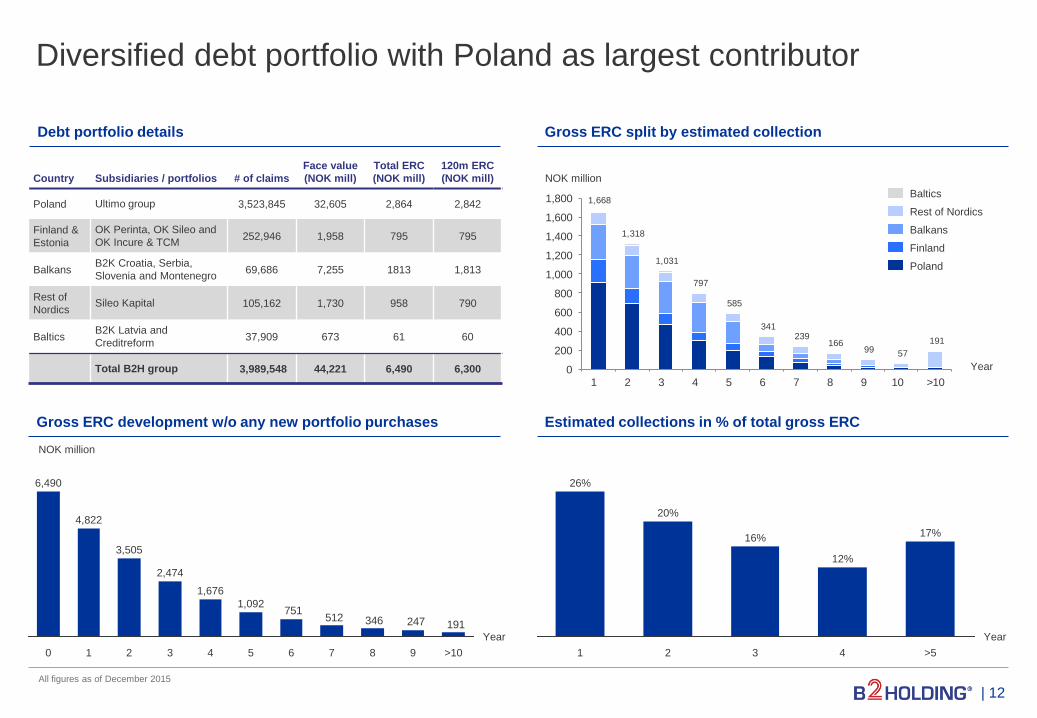
Diversified debt portfolio with Poland as largest contributor
Debt portfolio details Gross ERC split by estimated collection
All figures as of December 2015
Country Subsidiaries / portfolios # of claims
Face value
(NOK mill)
Total ERC
(NOK mill)
120m ERC
(NOK mill)
Poland Ultimo group 3,523,845 32,605 2,864 2,842
Finland &
Estonia
OK Perinta, OK Sileo and
OK Incure & TCM 252,946 1,958 795 795
Balkans B2K Croatia, Serbia,
Slovenia and Montenegro 69,686 7,255 1813 1,813
Rest of
Nordics Sileo Kapital 105,162 1,730 958 790
Baltics B2K Latvia and
Creditreform 37,909 673 61 60
Total B2H group 3,989,548 44,221 6,490 6,300
NOK million
Year
Poland
Finland
Balkans
Rest of Nordics
Baltics
Estimated collections in % of total gross ERC
Year
1 3 2 4 >5
12%
17%
20%
16%
26%
Gross ERC development w/o any new portfolio purchases
191247346512751
1 0
Year
3 5 6 2 4 7 >10 8
1,676
2,474
1,092
3,505
4,822
6,490
9
| 12
NOK million

13/29/77
0/51/153
Colour scheme
54/97/222
121/150/233
188/202/244
217/217/217
191/191/191
166/166/166
127/127/127
B2H-blue
345
278
223230
Q4 2015 Q2 2015 Q3 2015 Q1 2015
Strong growth in both total operating revenues and gross cash
collection
Net operating revenue Gross cash collection
NOK million NOK million
415
352
293279
Q4 2015 Q2 2015 Q3 2015 Q1 2015
| 13

13/29/77
0/51/153
Colour scheme
54/97/222
121/150/233
188/202/244
217/217/217
191/191/191
166/166/166
127/127/127
B2H-blue
190
38
135
150159
228
Q1 Q2 Q3 Q4
Operating cost development reflecting a company in growth
Total operational costs per quarter Operational costs split
2015 was a year of significant growth and the company ramped
up its organisational capabilities to support this expansion Increase in personnel costs
is related to the increase in
number of employees, from
960.2 in December 2014 to
1,177 in December 2015
Stable development in
external costs even
though the company’s
collections grew
substantially
Other operating expenses
in Q4 increased due to
non-recurring items mainly
related to transaction
bonuses, advisory costs
and expenses related to
the debt refinancing and
bond issue
NOK million
NOK million
NOK million
40
5247 50
Q1 Q2 Q3 Q4
External costs
33
3839 38 40
71
Q1 Q2 Q3 Q4
Other operating costs
Non-recurring items
| 14
56 6072
107
Q1 Q2 Q3 Q4
Personnel costs

13/29/77
0/51/153
Colour scheme
54/97/222
121/150/233
188/202/244
217/217/217
191/191/191
166/166/166
127/127/127
B2H-blue
Strong top-line growth and disciplined cost control, even in a rapid
expansion phase, increases profitability
Operating profit Cash EBITDA
NOK million NOK million
269
108
6
91
249
377
2013 2014 2014 inc. Ultimo 2015
589
240
241
333
507
829
2013 2014 2014 inc. Ultimo 2015
Q1-Q3 Q4 Q1-Q3 Q4
| 15
13/29/77
0/51/153
Colour scheme
54/97/222
121/150/233
188/202/244
217/217/217
191/191/191
166/166/166
127/127/127
B2H-blue
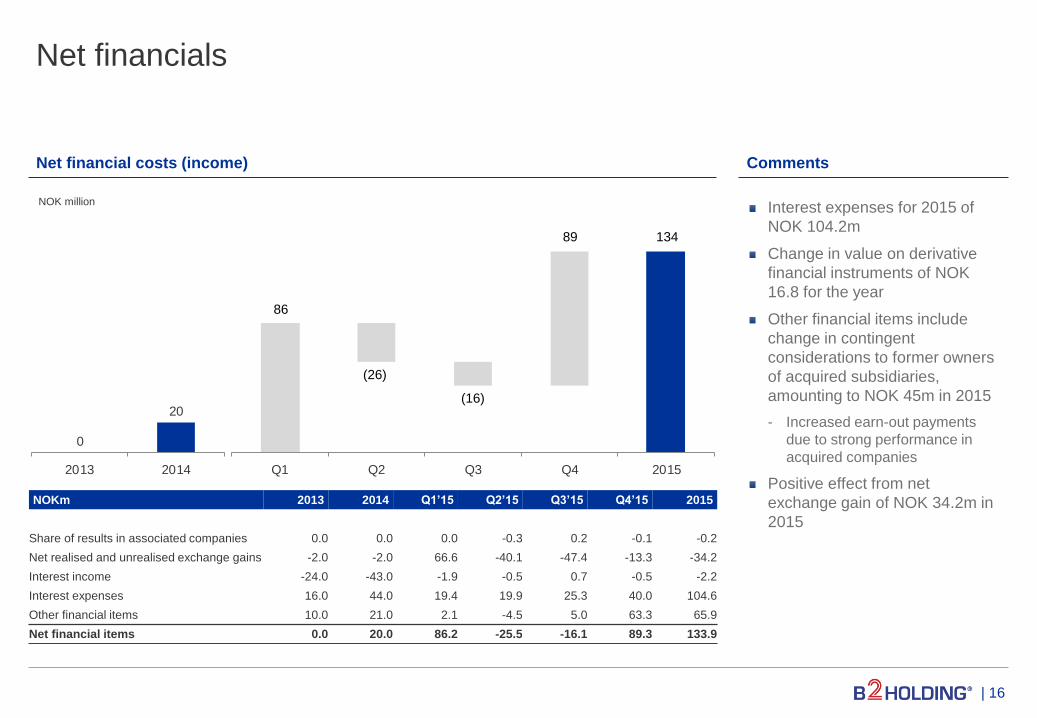
Net financials
Net financial costs (income) Comments
Interest expenses for 2015 of
NOK 104.2m
Change in value on derivative
financial instruments of NOK
16.8 for the year
Other financial items include
change in contingent
considerations to former owners
of acquired subsidiaries,
amounting to NOK 45m in 2015
- Increased earn-out payments
due to strong performance in
acquired companies
Positive effect from net
exchange gain of NOK 34.2m in
2015
NOKm 2013 2014 Q1’15 Q2’15 Q3’15 Q4’15 2015
Share of results in associated companies 0.0 0.0 0.0 -0.3 0.2 -0.1 -0.2
Net realised and unrealised exchange gains -2.0 -2.0 66.6 -40.1 -47.4 -13.3 -34.2
Interest income -24.0 -43.0 -1.9 -0.5 0.7 -0.5 -2.2
Interest expenses 16.0 44.0 19.4 19.9 25.3 40.0 104.6
Other financial items 10.0 21.0 2.1 -4.5 5.0 63.3 65.9
Net financial items 0.0 20.0 86.2 -25.5 -16.1 89.3 133.9
NOK million
Q1 Q2 Q3 Q4 2015
0
20
2013 2014
86
(26)
(16)
89 134
| 16
13/29/77
0/51/153
Colour scheme
54/97/222
121/150/233
188/202/244
217/217/217
191/191/191
166/166/166
127/127/127
B2H-blue
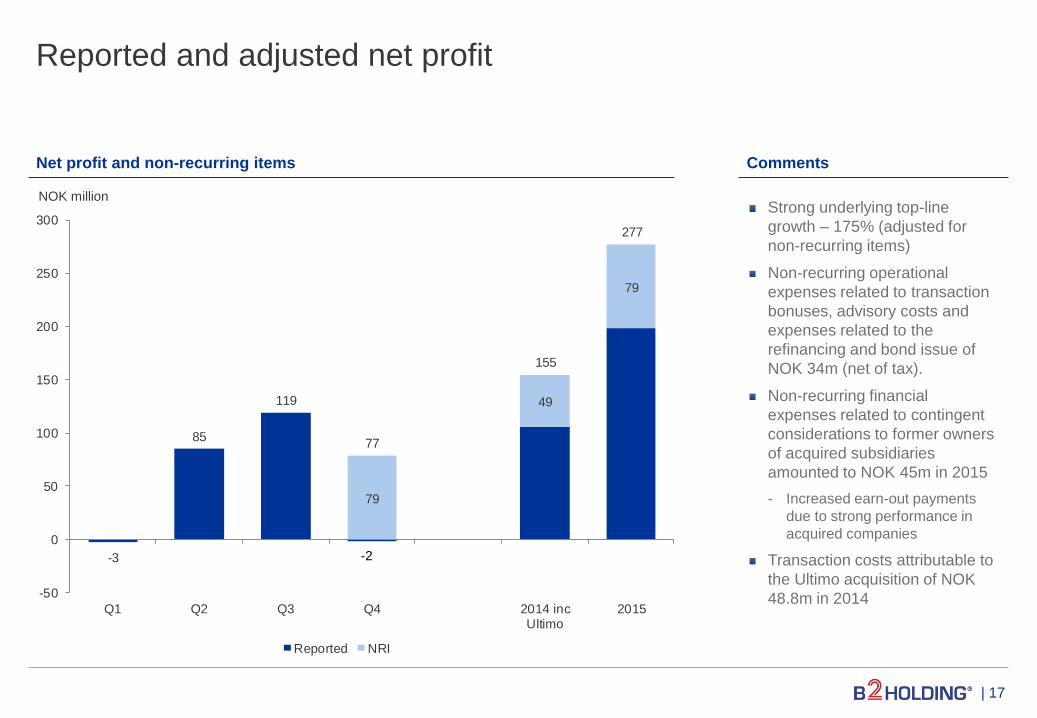
Reported and adjusted net profit
Strong underlying top-line
growth – 175% (adjusted for
non-recurring items)
Non-recurring operational
expenses related to transaction
bonuses, advisory costs and
expenses related to the
refinancing and bond issue of
NOK 34m (net of tax).
Non-recurring financial
expenses related to contingent
considerations to former owners
of acquired subsidiaries
amounted to NOK 45m in 2015
- Increased earn-out payments
due to strong performance in
acquired companies
Transaction costs attributable to
the Ultimo acquisition of NOK
48.8m in 2014
-2
79
49
79
-3
85
119
77
155
277
-50
0
50
100
150
200
250
300
Q1 Q2 Q3 Q4 2014 incUltimo
2015
Reported NRI
Comments Net profit and non-recurring items
NOK million
| 17

13/29/77
0/51/153
Colour scheme
54/97/222
121/150/233
188/202/244
217/217/217
191/191/191
166/166/166
127/127/127
B2H-blue
Strong operational performance
in Q4, ending the year with solid
growth in key metrics
Financial results impacted by
significant non-recurring items
and ramping up of organisation
to handle future growth in
portfolio acquisitions
Financial highlights: Income statement
Income statement Comments
1) Interest income including change in portfolio cash flow estimates, explained by permanent deviations to initial NPV of non-performing loan portfolio
2) Actual cash collection over interest income on purchased loan portfolios – equal to portfolio amortisation
NOKm 2013 2014 2015
unaudited Q4’15
Interest income on purchased loan portfolios1 99 400 915 291
Revenue from external collection 86 91 104 34
Other operating revenues 3 20 57 20
Net operating revenues 188 511 1,076 345
Excess cash from collection over income2 234 230 424 124
Total cash revenue 422 740 1,500 469
External costs of services provided -62 -119 -189 -50
Personnel costs -72 -136 -294 -107
Other operating expenses -46 -152 -188 -71
Cash EBITDA 242 333 829 240
EBITDA 8 103 405 117
Depreciation and amortization -3 -12 -28 -8
EBIT 6 91 377 108
Net financials 16 24 -134 -89
Tax -4 -19 -45 -21
Net profit 2 52 198 -2
Non-recurring items (net of tax) 49 79 79
Adjusted net profit 101 277 77
| 18

13/29/77
0/51/153
Colour scheme
54/97/222
121/150/233
188/202/244
217/217/217
191/191/191
166/166/166
127/127/127
B2H-blue
NOKm 2013 2014 2015
unaudited
Tangible and intangible assets 38 419 418
Other long term financial assets 0 2 2
Non performing loans portfolio 562 2,017 3,168
Loan receivables & other financial assets 7 168 286
Total long term financial assets 569 2,187 3,455
Other short term assets 10 60 70
Cash & short term deposits 118 294 765
Total current assets 128 354 835
Total assets 734 2,960 4,708
Total equity 280 1,372 1,672
Long term interest bearing loans & borrowings 302 1,053 2,526
Other long term liabilities 39 67 91
Total long term liabilities 340 1,120 2,617
Short term interest bearing loans 41 159 0
Other short term liabilities 73 308 419
Total short term liabilities 114 468 419
Total equity and liabilities 734 2,960 4,708
Financial highlights: Balance sheet
Balance sheet Comments
Strong growth in NPL and loan
receivables
Net debt of ~NOK 1.8bn and
available liquidity (including
excess cash above NOK 300m
and undrawn amount under the
RCF) of approximately NOK
1.8bn
Equity ratio of 35.5% (39.4%
adjusted for excess cash)
In parallel with the refinancing in
November 2015, the group’s
legal structure was streamlined
for future bank debt funding
| 19

13/29/77
0/51/153
Colour scheme
54/97/222
121/150/233
188/202/244
217/217/217
191/191/191
166/166/166
127/127/127
B2H-blue
Financial targets
Portfolio
acquisitions
Geographic
and platform
expansion
The company is actively evaluating additional platforms, both to strengthen existing geographies and for possible
entry into new markets
The company’s strategy to gain local presence before acquiring substantial portfolios remains firm
Dividend
policy
As the company foresees significant opportunities in the near to medium-term, the company aims to distribute
20-30% of net profits as dividend to shareholders, starting at the low end for 2016 (to be paid in 2017)
The strong cash generation capacity of the business supports a significantly higher long-term pay-out ratio target,
and potential distribution through both dividends and share buybacks
ROE target The company targets a return on equity (ROE) above 20%
Year-to-date 2016, B2Holding has acquired portfolios at a pace well above historical levels for comparable periods,
and has a strong pipeline of opportunities being evaluated
The company expects to acquire portfolios over the next years with a target to reach an equity ratio down towards
~30% by year-end 2017
| 20

13/29/77
0/51/153
Colour scheme
54/97/222
121/150/233
188/202/244
217/217/217
191/191/191
166/166/166
127/127/127
B2H-blue
Outlook
Highlights
High acquisition activity so far in Q1, with purchases and market opportunities well above historic levels in the first quarter
Geographic and platform expansion
- Currently evaluating both portfolios and platforms in new markets
- Expansion into new markets expected going forward – both greenfields and acquisitions under considerations
Overall portfolio activity is high, with significant investment opportunities in the Group’s existing markets
Bond listing process on track, with target to list by 8 March
Continuing to work towards a listing on the Oslo Stock Exchange, with a target of listing in Q2 2016
| 21

13/29/77
0/51/153
Colour scheme
54/97/222
121/150/233
188/202/244
217/217/217
191/191/191
166/166/166
127/127/127
B2H-blue
B2Holding AS | Stortingsgaten 22 | P.O. Box 1642 Vika | N-0119 Oslo
www.b2holding.no | Tel: +47 22 83 39 50 | E-mail: [email protected]
| 22