q4 & fy 2013 results - solvay · 2 q4 & fy 2013 results ... • reducing 2020 energy...
TRANSCRIPT
Q4 & FY 2013 results
February 26, 2014

2013 overview
• Acceleration of Solvay’s transformation
• Delivery in a challenging economic context
• Strong fundamentals to create value
26/02/2014
Q4 & FY 2013 results 2
Forenote
All references to 2012 Income Statement
data are restated for:
• the Group’s new business organization
effective as from January 1, 2013;
• the application of IAS 19 revised;
• the Group’s European Chlorovinyls
activities planned to be contributed to
the JV with Ineos.
The European Chlorovinyls business
activities are reflected as “Assets Held
For Sale” on the balance sheet (in one
single line) and as discontinued
operations in the Income Statement as
required by IFRS.
As from December 31, 2013, Benvic (the
PVC compounding business) is reflected
in the Balance Sheet as "Assets Held for
Sale", but as continued operations in the
Income Statement.
Chemlogics is consolidated in the
financial statements from November 1,
2013.
Furthermore, Solvay is presenting
Adjusted Income Statement performance
indicators that exclude non-cash
Purchase Price Allocation (PPA)
accounting impacts related to the Rhodia
acquisition.

2013 overview
• Acceleration of Solvay’s transformation
• Delivery in a challenging economic context
• Strong fundamentals to create value
26/02/2014
Q4 & FY 2013 results 3
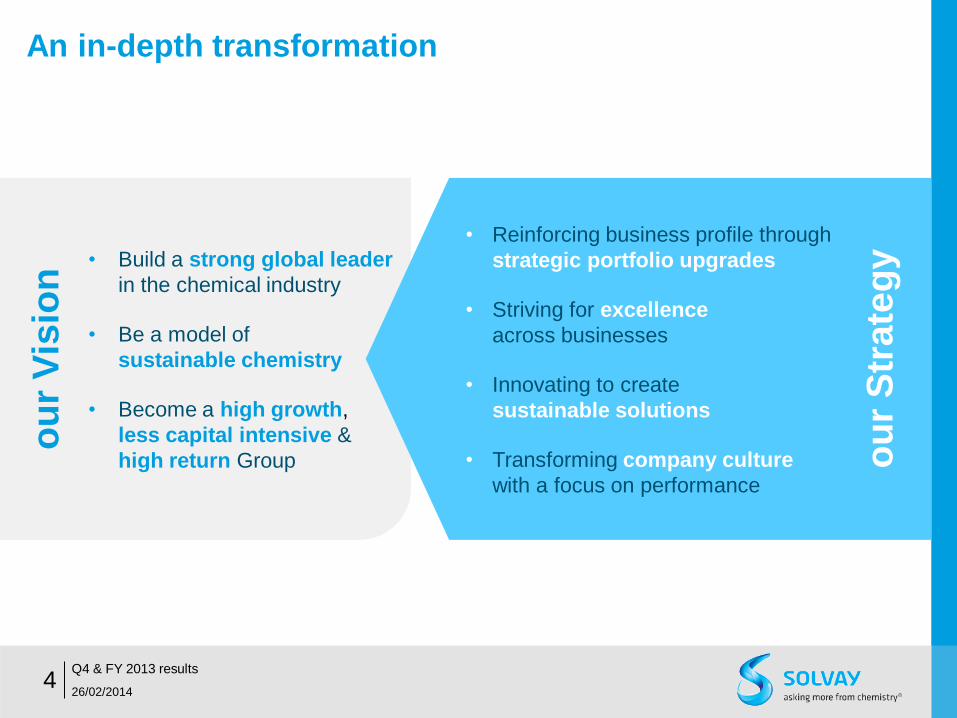
An in-depth transformation
ou
r S
tra
teg
y • Reinforcing business profile through
strategic portfolio upgrades
• Striving for excellence
across businesses
• Innovating to create
sustainable solutions
• Transforming company culture
with a focus on performance
• Build a strong global leader
in the chemical industry
• Be a model of
sustainable chemistry
• Become a high growth,
less capital intensive &
high return Group
ou
r V
isio
n
26/02/2014
Q4 & FY 2013 results 4

26/02/2014
Q4 & FY 2013 results 5
Business profile enhanced through strategic portfolio upgrades
Reduced cyclicality through
phased disposals
• European Chlorovinyls activities to be
contributed to JV with Ineos
• Indupa to be sold to Braskem
• Benvic divestment in progress
Extended customer solutions offering
• Chemlogics acquisition:
Strong start to synergies delivery
• Investing in growth engines
and innovation capabilities Solvay businesses
ChemLogics
GROW
ENHANCE
EXIT
RESTORE
Value creation potential
of industry segment
Solv
ay’s
abili
ty
to e
xtra
ct
valu
e
Solvay
YE 2013
Solvay
YE 2012 Chemical industry
Portfolio upgrade to continue
2013

26/02/2014
Q4 & FY 2013 results 6
Footprint enhanced, poised for more growth
Aeronautics
& Automotive
17% +1%
Consumer Goods
& Healthcare
25% +2%
Agro
Food
12% +1%
Energy &
Environment
11% Building
& Construction
10% -4%
Electrical
& Electronics
6% -1%
Industrial
Applications
19%
Rebalanced geographic exposure*
North
America
25%
Europe
33%
Latin
America
11%
Asia Pacific
& RoW
31%
Enhanced exposure to higher growth end-markets*
*Figures represent % of 2013 net sales (pro-forma Chemlogics)
% evolution vs 2012
+1%
-9%
+5%
+3%

Energy efficiency
• Reducing 2020 energy consumption by 10% vs 2012
• > € 100 m by YE 2016
Soda ash and Polyamide improvement plans
• Reinforcing Soda Ash global leadership and competitiveness
in Europe: € 100m by YE 2015
• Restoring Polyamide profitability and regaining strategic
flexibility: € 100 m by YE 2014
Building best-in-class global business
services
26/02/2014
Q4 & FY 2013 results 7
Excellence initiatives embedded in the organization
>120 major programs initiated
Unlocking value growth: € 670 m by YE 2016
Manufacturing excellence
• Variable & fixed cost reductions
• Overall Equipment Efficiency
Purchasing, supply chain
& logistical excellence
Commercial excellence
Innovation excellence

Innovative products launch
• Bio-based products:
Ocalio, Starguar, Kalix®, …
• High performance products :
Technyl® One, Kalix® HFFR, ...
Open innovation initiatives
• Participation in AONIX (Canada):
Accelerate development & commer-
cialization of mass-produced
thermoplastic composites
• Partnership with Granbio (Brazil):
Development of bio-based n-butanol
for use in green solvents
New R&I facility in Shanghai
• 130 researchers
• Supporting all businesses in Asia
26/02/2014
Q4 & FY 2013 results 8
Innovative sustainable solutions launched
Main 2013 achievements
Renewable
chemistry
Climate change
Resource scarcity
Next billion consumers
Sustainable
energy
Organic
electronics
Eco-
processes
Advanced
formulations
Advanced
materials
Health & well being
Key figures
Major sites
worldwide 1,950
€ 280 m
22% 251 R&I staff
R&I efforts
New sales
ratio
Patents filed
15
2013
Focused innovation fields
26/02/2014
Q4 & FY 2013 results 9
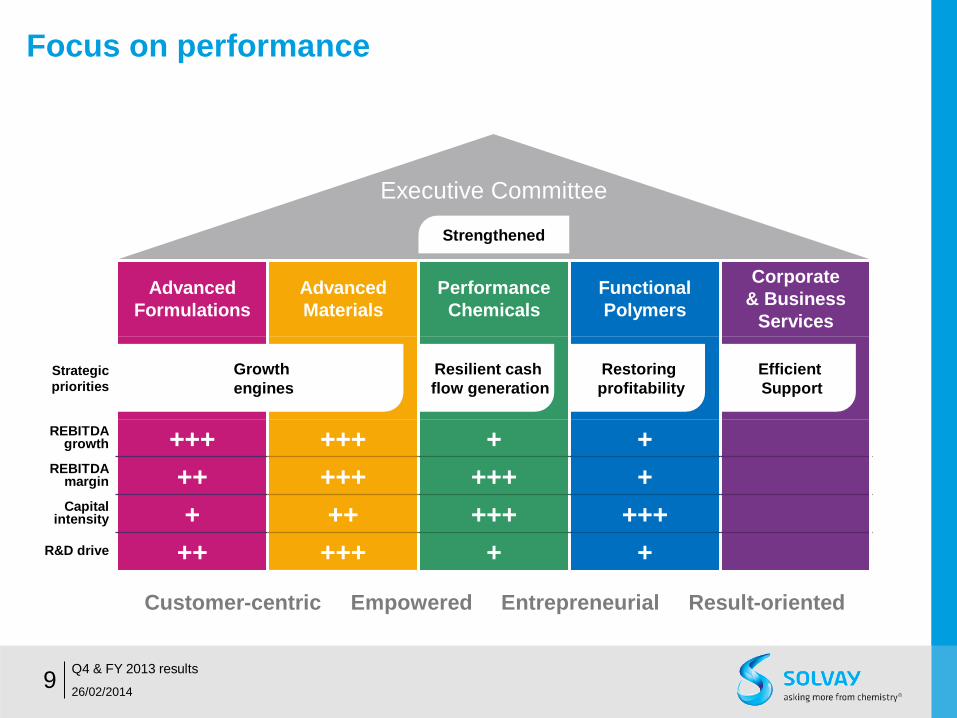
Focus on performance
Advanced
Formulations
Advanced
Materials
Performance
Chemicals
Functional
Polymers
Corporate
& Business
Services
Strategic
priorities
REBITDA growth +++ +++ + +
REBITDA margin ++ +++ +++ + Capital
intensity + ++ +++ +++
R&D drive ++ +++ + +
Growth
engines
Resilient cash
flow generation
Restoring
profitability
Efficient
Support
Strengthened
Customer-centric Empowered Entrepreneurial Result-oriented
Executive Committee

2013 overview
• Acceleration of Solvay’s transformation
• Delivery in a challenging
economic context
• Strong fundamentals to create value
26/02/2014
Q4 & FY 2013 results 10

FY 2013 financial highlights
REBITDA
€ 1,663 m (12)% yoy
Stable allowing for
exceptionals &
Chemlogics
Stable dividend
proposed at
26/02/2014
Q4 & FY 2013 results 11
Net Sales
€ 9.9 bn (5)% yoy
€ 3.20 gross / share
FCF
€ 524 m
Net Income
€ 378 m Adjusted, Group Share
• Strong Free Cash Flow
• Industrial working
capital of 12.4%
• Significant
non-recurring costs
€ (239) m
(e.g. restructuring for
integration and
excellence)
• Forex headwinds
• Raw materials
deflation
• Volume decrease
primarily related to
CER phase-out
• CER phase-out
and guar effect
exceptionals
• Pricing power
preserved
• Excellence programs
delivering

26/02/2014
Q4 & FY 2013 results 12
Stable underlying results allowing for exceptionals
Pricing power
preserved thanks to
portfolio quality and
excellence initiatives
Exceptional elements impacted REBITDA by ~€ (240) m
• ~ € (90) m of CER anticipated phase-out
• ~ € (100) m from native guar peak prices in 2012
• ~ € (50) m from guar derivatives margin impact
2012
1%
Scope (2)%
Conversion
(7)%
Volume & mix
(11)%
Price
11%
Variable costs
(2)%
Fixed costs
(4)%
Net contribution
from
associates
1%
Others
2013
1,896 17 (36) (126)
(202) 205 (36) (82)
27 1,663
(12)%
Net pricing € 3 m
CERs
Fixed cost
inflation
partially
mitigated
2012
1%
Scope
(3)%
Conversion
(2)%
Volume & mix
(2)%
Price
2013
10,515
136 (328)
(183)
(202)
9,938
(5)%
REBITDA in € m
Net Sales in € m
18.0%
margin
16.7%
margin
Conversion effects
primarily from USD,
JPY and BRL
devaluations vs EUR

26/02/2014
Q4 & FY 2013 results 13
Underlying operational performance flat, growth engine impacted by exceptionals
REBITDA 2013 in € m
• Successful integration of
Chemlogics, with strong start to
synergies delivery
• Guar conditions stabilized
• Resilience in Coatis and
Aroma Performance
518
369
2012 2013
(29)%
Advanced
Formulations Essentially flat,
allowing for exceptionals
• Essential Chemicals’
resilient results proving
sustainability
• Record performance at Acetow
• Eco Services resilient;
strategic options being explored
• Poor demand at Emerging
Biochemicals
Performance
Chemicals Overall
resilience
750 724
2012 2013
(3)%
• Record performance at Specialty
Polymers and Silica
• Performance stabilization at Rare
Earths with an end to previous
margin squeeze
• Special Chemicals’
refocused portfolio
enhancing profitability
Advanced
Materials Record
performance
• Challenging trading
conditions persisted in
Polyamide & Intermediates
• Structural repositioning at
Engineering Plastics
• Divestment process for
European Chlorovinyls
activities on-going
Functional
Polymers Restoring
profitability
627 646
2012 2013
3%
100 93
2012 2013
(7)%
20%
34%
38%
5% 3%
REBITDA
2013*
* Energy Services in purple, excluding Corporate costs

26/02/2014
Q4 & FY 2013 results 14
Non-cash one-offs reduce net income
Depreciation & Amortization and other elements
• Recurring Depreciation & Amortization of € (603) m
• Other elements relate to pre-operational forex effect on Rusvinyl debt
and temporary Chemlogics inventory step-up and retention plan
Adjusted* P&L 2012 2013
Net sales 10,515 9,938
REBITDA 1,896 1,663
Depreciation & Amortization +
other elements (593) (628)
REBIT 1,303 1,035
Non-recurring items 55 (239)
EBIT 1,357 796
Net financial charges (362) (210)
Income taxes (291) (229)
Discontinued operations 1 65
Net Income 707 422
of which Solvay share 690 378
Non-recurring rose due to non-cash elements
• Restructuring costs largely flat at € (115) m, primarily linked
to integration and Soda Ash restructuring
• Non-cash elements include impairments € (65) m on
Plextronics and Benvic
Net financial charges lower
• Higher discount rates reduced environmental provisions
• Capital gain on disposal of a non-core financial investment
Higher contribution from discontinued operations
• Last milestone payment from divested pharma business
more than offset impairment on Indupa
* Adjusted: Excluding non-cash PPA accounting impacts related to the Rhodia
acquisition
In € m

26/02/2014
Q4 & FY 2013 results 15
Strong Free Cash Flow generation
Net debt evolution in € m
YE 2012
REBITDA,
provisions & other
operating
cash flow
Capex
Change in
industrial working capital Free Cash
Flow from discontinued operations
Aquisitions
& divest- ments
Hybrid bond Net
financial charges
Dividends
Other
changes in net debt
Changes in
net debt attributable to assets
held for sale
YE 2013
(1,125) 981
(708) 17 234
(978) 1,200
(198)
(343)
(147) (35) (1,102)
FCF € 524 m
Focus on cash generation

641
144
785
708
700-800
2012 2013 average2013-2016
26/02/2014
Q4 & FY 2013 results 16
Selective investments for value growth
Capex (in € m)
Growth engines
Resilient & Cyclical businesses
Discontinued
operations
Continued
operations
Advanced Formulations
Advanced Materials
Performance Chemicals
Focused on
superior growth areas
1/3
2/3
Alkoxylation
HDS Silica
HPPO
Alkoxylation
Bicarbonate
Fluoro-polymers
Specialty surfactants
TARGET TARGET
26/02/2014
Q4 & FY 2013 results 17
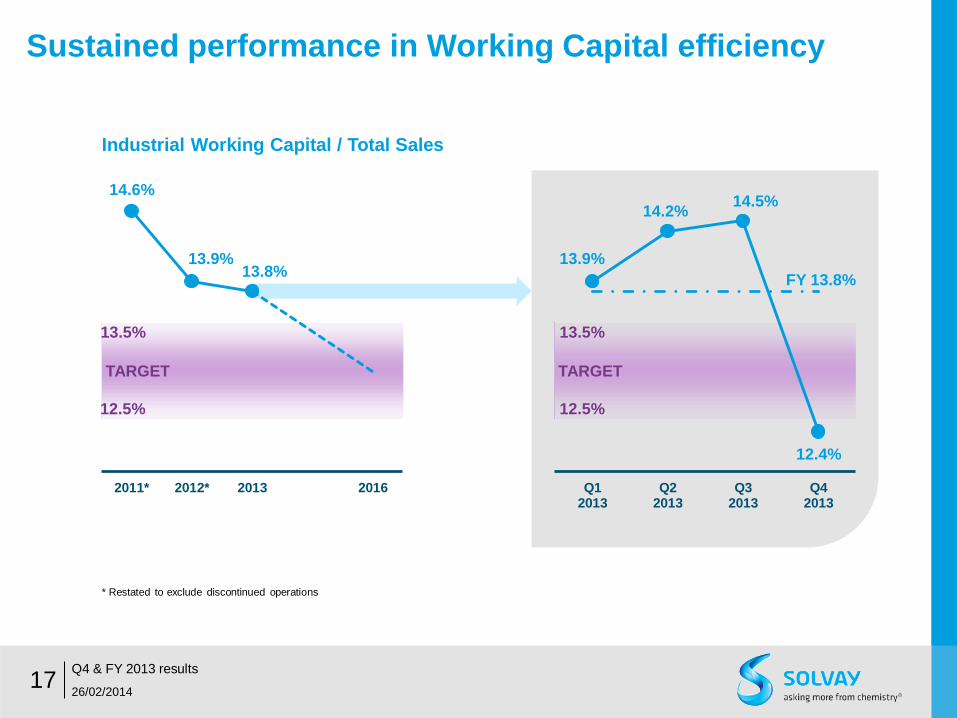
Sustained performance in Working Capital efficiency
* Restated to exclude discontinued operations
12.5%
13.5%
14.6%
13.9% 13.8%
2011* 2012* 2013 2016
12.5%
13.5%
13.9%
14.2% 14.5%
12.4%
FY 13.8%
Q12013
Q22013
Q32013
Q42013
Industrial Working Capital / Total Sales
26/02/2014
Q4 & FY 2013 results 18
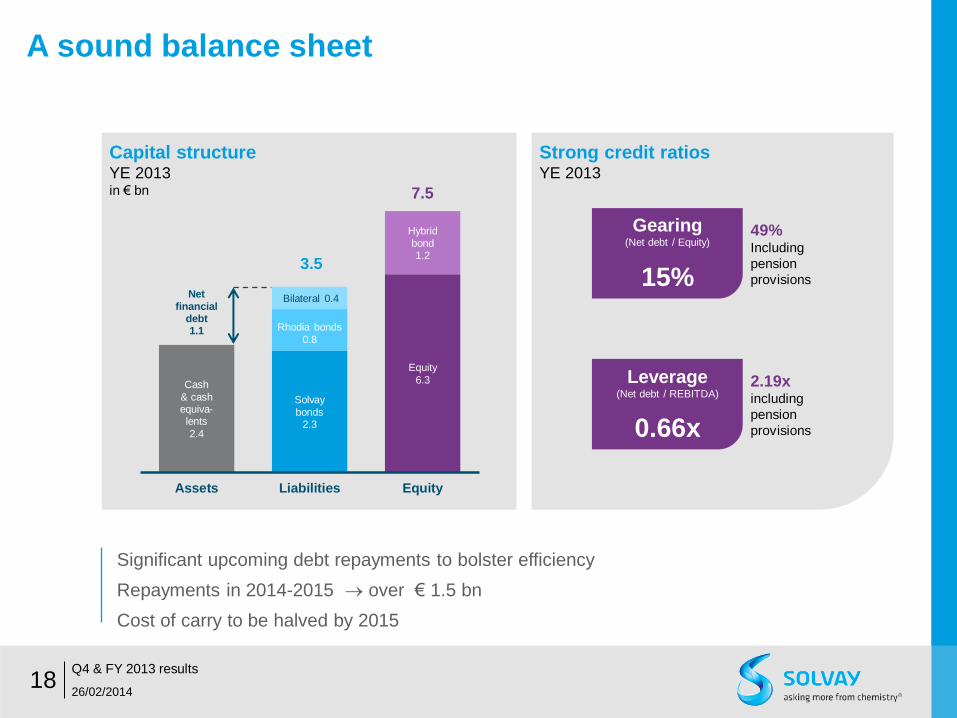
A sound balance sheet
Cash
& cash equiva- lents
2.4
Net
financial debt 1.1
Solvay
bonds 2.3
Rhodia bonds
0.8
Bilateral 0.4
Equity
6.3
Hybrid
bond 1.2
3.5
7.5
Assets Liabilities Equity
Capital structure YE 2013 in € bn
Strong credit ratios YE 2013
Gearing (Net debt / Equity)
15%
Leverage (Net debt / REBITDA)
0.66x
49% Including
pension
provisions
2.19x including
pension
provisions
Significant upcoming debt repayments to bolster efficiency
Repayments in 2014-2015 over € 1.5 bn
Cost of carry to be halved by 2015

26/02/2014
Q4 & FY 2013 results 19
Stable total dividend proposed
1982 1987 1992 1997 2002 2007 2012
CAGR >5%
€ 3.20 / share (gross) dividend proposed
• € 1.33 interim dividend paid
in January 2014
• € 1.87 balance to be paid in
May 2014
Over more than 30 years
40% average pay out
Committed to stable / growing dividend
Solvay’s gross dividend in €/share
2013

2013 overview
• Acceleration of Solvay’s transformation
• Delivery in a challenging economic context
• Strong fundamentals to create value
26/02/2014
Q4 & FY 2013 results 20
26/02/2014
Q4 & FY 2013 results 21
Transformation will continue
Asking more from chemistry
• Complete initiated portfolio upgrades
• Explore further strategic options
• Grow with our customers
• Sustain focus on excellence
2014 Priorities

26/02/2014
Q4 & FY 2013 results 22
2014 outlook
Although
cautious, Solvay
is confident that
2014 will show
REBITDA growth
Solvay well-placed to benefit from an
upswing in macroeconomic conditions
Excellence programs will
deliver in coming years
Some end-markets show
early signs of improvement

Take-aways
Progress on
many fronts
REBITDA to reach € 2.3 – 2.5 bn
REBIT margin to reach 18%
26/02/2014
Q4 & FY 2013 results 23
2016 CFROI to increase by > 100 bp vs 2013
2/3 of businesses in value-creation zone
Poised
for growth
On track towards
2016 targets

26/02/2014
Q4 & FY 2013 results 24
Safe harbour
To the extent that any statements made in
this presentation contain information that is
not historical, these statements are
essentially forward-looking. The
achievement of forward-looking statements
contained in this presentation is subject to
risks and uncertainties because of a number
of factors, including general economic
factors, interest rate and foreign currency
exchange rate fluctuations; changing market
conditions, product competition, the nature
of product development, impact of
acquisitions and divestitures, restructurings,
products withdrawals; regulatory approval
processes, all-in scenario of R&D projects
and other unusual items.
Consequently, actual results may differ
materially from those expressed or implied
by such forward-looking statements.
Forward-looking statements can be identified
by the use of words such as "expects,"
"plans," "will," "believes," "may," "could"
"estimates," "intends", "goals", "targets",
"objectives", "potential", and other words of
similar meaning. Should known or unknown
risks or uncertainties materialize, or should
our assumptions prove inaccurate, actual
results could vary materially from those
anticipated. The Company undertakes no
obligation to publicly update any forward-
looking statements.

26/02/2014
Q4 & FY 2013 results 25
Calendar
March 31, 2014 Annual report (on website)
May 6, 2014 Q1 results publication
May 13, 2014 AGM
May 15, 2014 Ex-dividend trading date
May 20, 2014 Dividend payment (balance)
July 31, 2014 Q2 results publication
November 13, 2014 Q3 results publication

Annexes
• Q4 & FY 2013 Group results
• Q4 & FY 2013 segment results
• Considerations for 2014
• 2016 ambition
• Segment presentation
26/02/2014
Q4 & FY 2013 results 26

Annexes
• Q4 & FY 2013 Group results
• Q4 & FY 2013 segment results
• Considerations for 2014
• 2016 ambition
• Segment presentation
26/02/2014
Q4 & FY 2013 results 27

Q4 2013 financial highlights
REBITDA
€ 384 m (6)% yoy
Up 8% allowing for
exceptionals &
Chemlogics
26/02/2014
Q4 & FY 2013 results 28
Net Sales
€ 2.4 bn (5)% yoy
FCF
€ 246 m
Net Income
€ 25 m Adjusted, Group Share
• Strong Free Cash Flow
• Industrial working
capital of 12.4%
• Significant
non-recurring costs
€ (68) m related to
non-cash impairments
(portfolio upgrade)
• Forex headwinds
• Raw materials
deflation
• Chemlogics 2 months
contribution
• CER phase-out
and guar effect
exceptionals
• Pricing power
preserved
• Excellence programs
delivering

Q4 2012
4%
Scope
(4)%
Conversion
(11)%
Volume & mix
(19)%
Price
19%
Variable costs
4%
Fixed costs
1%
Net contribution
from
associates
Q4 2013
407 18 (16)
(43)
(79) 77 16 4 384
(6)%
Net pricing
€ (2) m
CERs
26/02/2014
Q4 & FY 2013 results 29
Q4 2013 Net sales and REBITDA
REBITDA decreased by (6)%;
Underlying REBITDA grew by 8%
allowing for CER phase-out, guar
exceptionals and Chemlogics
Pricing power
and REBITDA
margin largely
stable
REBITDA in € m
16.0%
margin
15.9%
margin
Net Sales in € m
Net Sales decreased
primarily due to forex
headwinds and raw
materials deflation
Chemlogics 2 months
contribution added 3%
to net sales and 4% to
REBITDA
Volume de-
crease fully
due to CER
phase-out
Q4 2012
3%
Scope (4)%
Conversion (1)%
Volume & mix
(3)%
Price
Q4 2013
2,541
79 (110)
(15) (86)
2,417
(5)%

26/02/2014
Q4 & FY 2013 results 30
Q4 2013 net income
Adjusted* P&L 2012 2013
Net sales 2,541 2,417
REBITDA 407 384
Depreciation & Amortization
+ other elements (157) (184)
REBIT 250 200
Non-recurring items 92 (68)
EBIT 342 131
Net financial charges (86) (18)
Income taxes (77) (84)
Discontinued operations (4) 1
Net Income 176 29
of which Solvay share 198 25
Depreciation & Amortization and other elements
• Recurring Depreciation & Amortization of € (164) m
• Other elements relate to pre-operational forex effect on Rusvinyl debt
and temporary Chemlogics inventory step-up and retention plan
Non-recurring rose due to non-cash elements
• Restructuring costs at € (14) m
• Non-cash elements include impairment € (32) m on Benvic
• 2012 included € 139 m positive impairment reversal in Soda Ash
Net financial charges lower
• Higher discount rates in 2013 reduced NPV environmental
provisions; the reverse was true in 2012
• Capital gain of € 40 m on disposal of a non-core financial investment
in 2013
Higher contribution from discontinued operations
• Last milestone payment from divested pharma business of € 100 m
more than offset impairment on Indupa
* Adjusted: Excluding non-cash PPA accounting impacts related to the Rhodia
acquisition
In € m
26/02/2014
Q4 & FY 2013 results 31
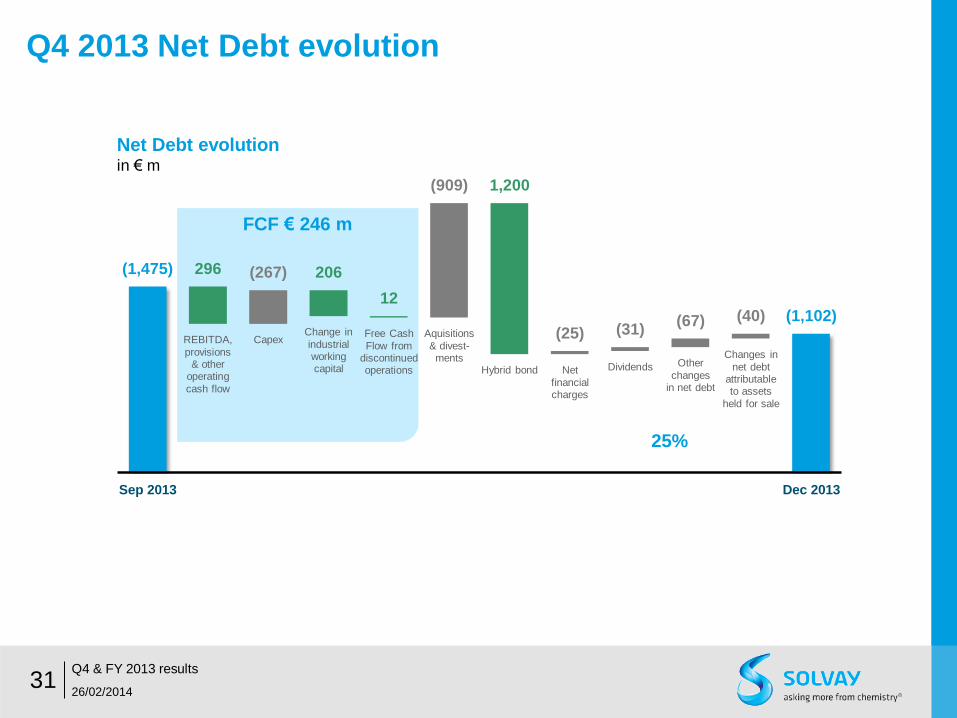
Q4 2013 Net Debt evolution
Sep 2013
REBITDA,
provisions & other
operating
cash flow
Capex Change in
industrial working capital
Free Cash
Flow from discontinued operations
Aquisitions
& divest- ments
Hybrid bond Net
financial charges
Dividends Other
changes in net debt
Changes in
net debt attributable to assets
held for sale
Dec 2013
(1,475) 296 (267) 206
12
(909) 1,200
(25) (31) (67) (40) (1,102)
25%
FCF € 246 m
Net Debt evolution in € m

WACC
Cash Flow Return On Investment
26/02/2014
Q4 & FY 2013 results 32
Portfolio actions and excellence delivery overcome exceptionals
CFROI
Raising the CFROI towards WACC by 2016
REBITDA – Rec. Capex –Tax
Gross assets + Working Capital CFROI =
6.5%
6.9%
2012 2013 2016
>100 bp
+40 bp Portfolio overcame exceptionals
European
chlorovinyls
and Indupa
included
European
chlorovinyls
and Indupa
excluded
• Demanding value-based framework for
strategic decision making
• Provides insight on capital allocation
• Based on actualised investment costs
rather than historic ones
• Key metric to determine real economic
value creation

26/02/2014
Q4 & FY 2013 results 33
Balance sheet
Balance sheet YE 2012 YE 2013
Fixed assets 9,572 9,395
Investment & shares 1,057 1,036
Loans and other non current financial receivables / payables 209 91
Assets held for sale 425 1,621
Taxes payable/receivable + Others 3 51
Working capital 1,379 1,216
Total invested capital 12,645 13,411
Equity 6,573 7,453
Provisions 4,507 3,796
Dividends 103 111
Net financial debt 1,125 1,102
Liabilities related to assets held for sale 337 949
Total financing 12,645 13,411
In € m

(1,732) (173)
(403)
(155) (72)
France & Germany(unfunded pension schemes)
Belgium
United Kingdom
North America
Other countries
• Net pension liability
75% denominated in EUR
• Stable cash contribution in 2013
of € (186) m
• Discount rate used at YE 2013
of 3.88% weighted average*
• EUR: 3.25%
• GBP: 4.50%
• USD: 4.75%
• Pension assets of € 1,925 m at YE
• 50% Equities / Diversified alternative funds
• 50% Bonds / Real estate
26/02/2014
Q4 & FY 2013 results 34
Pension liabilities
Net pension liabilities
YE 2013 in € m
(2,535)
* Versus 3.63% weighted average at YE 2012

Annexes
• Q4 & FY 2013 Group results
• Q4 & FY 2013 segment results
• Considerations for 2014
• 2016 ambition
• Segment presentation
26/02/2014
Q4 & FY 2013 results 35

26/02/2014
Q4 & FY 2013 results 36
Advanced Formulations impacted by guar price developments
FY 2013
€ 2,432 m (5)% yoy
Q4 2013
€ 644 m (0)% yoy
Net sales
65%
20%
15%
Novecare(6)% yoy
Coatis(4)% yoy
Aroma Performance(3)% yoy
Novecare
• Successful integration of Chemlogics and
strong start to synergies delivery
• Back to stable guar demand conditions at
YE, after significant setbacks
• Encouraging demand growth in Agro and
Coatings
• Impact from exceptionals 2013 vs 2012 of
~ € (150) m
Coatis
• Positive pricing power supported by BRL
devaluation and sales indexed in USD
Aroma Performance
• Resilient food and pharma markets
FY 2013
€ 369 m (29)% YoY
Q4 2013
€ 87 m (16)% YoY
REBITDA
103 87
518
369
20%
15%
2012 2013 (in € m)
REBITDA margin
2013

Net sales
50%
16% 12%
22%
Specialty Polymers(4)% yoy
Silica9% yoy
Rare Earth Systems(31)% yoy
Special Chemicals(5)% yoy
2013
REBITDA
26/02/2014
Q4 & FY 2013 results 37
Strong results at Advanced Materials
FY 2013
€ 2,551 m (7)% yoy
Q4 2013
€ 603 m (4)% yoy
Specialty Polymers
• Record performance
Silica
• Record performance
Rare Earth Systems
• Performance stabilization as market price
declines slowed by YE
Special Chemicals
• Refocused portfolio enhancing profitability
with successful Life Science strategic exit
FY 2013
€ 646 m 3% yoy
Q4 2013
€ 160 m 18% yoy
136 160
627 646
23% 25%
2012 2013 (in € m)
REBITDA margin

56%
21%
9%
14%
Essential Chemicals(3)% yoy
Acetow7% yoy
Eco Services(8)% yoy
2013
Net sales
REBITDA
26/02/2014
Q4 & FY 2013 results 38
Resilient cash generation by Performance Chemicals
FY 2013
€ 3,125 m (1)% yoy
Q4 2013
€ 784 m (2)% yoy
Essential Chemicals
• Resilience of results proving sustainability
Acetow
• Record performance
Eco Services
• Resilient performance
• Strategic options being explored
Emerging Biochemicals
• Poor demand in both Chlorovinyls and
Epichlorohydrin
FY 2013
€ 724 m (3)% yoy
Q4 2013
€ 186 m 4% yoy 179 186
750 724
24% 23%
2012 2013 (in € m)
REBITDA margin
88%
12%
Polyamide(8)% yoy
PVC Compounds3% yoy
2013
Net sales
REBITDA
26/02/2014
Q4 & FY 2013 results 39
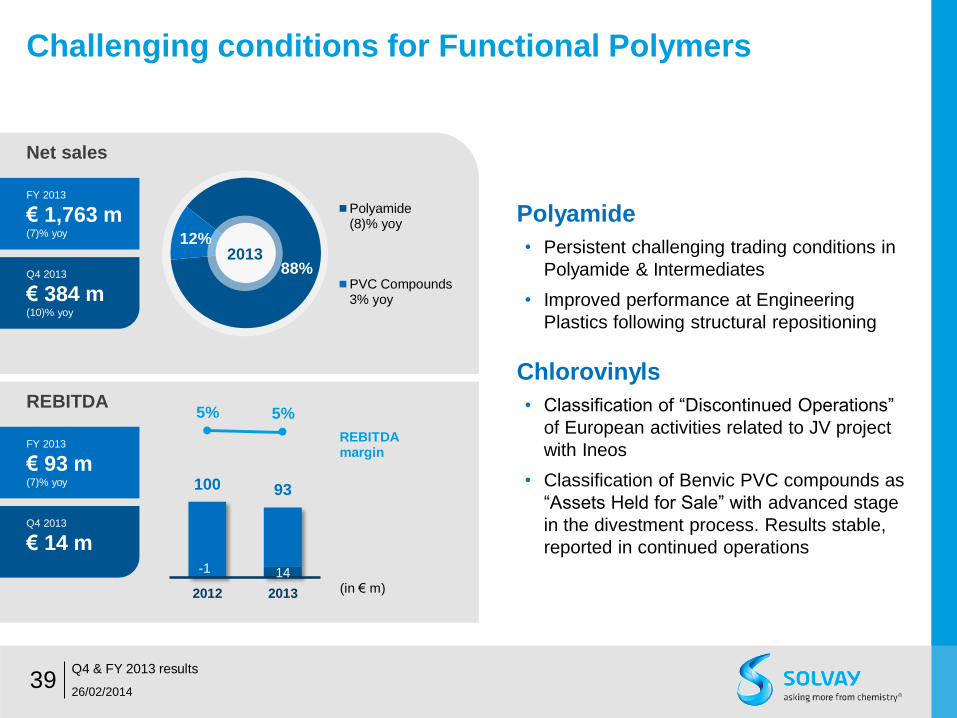
Challenging conditions for Functional Polymers
FY 2013
€ 1,763 m (7)% yoy
Q4 2013
€ 384 m (10)% yoy
Polyamide
• Persistent challenging trading conditions in
Polyamide & Intermediates
• Improved performance at Engineering
Plastics following structural repositioning
Chlorovinyls
• Classification of “Discontinued Operations”
of European activities related to JV project
with Ineos
• Classification of Benvic PVC compounds as
“Assets Held for Sale” with advanced stage
in the divestment process. Results stable,
reported in continued operations
FY 2013
€ 93 m (7)% yoy
Q4 2013
€ 14 m
-1 14
100 93
5% 5%
2012 2013 (in € m)
REBITDA margin

Annexes
• Q4 & FY 2013 Group results
• Q4 & FY 2013 segment results
• Considerations for 2014
• 2016 ambition
• Segment presentation
26/02/2014
Q4 & FY 2013 results 40

• Carbon emission rights
• Carbon Emission Rights (CER) scheme came to an end in 2013
• Total sales of CERS: € 58 m in H1 2013
• Rusvinyl ramp-up
• PVC plant in Russia, JV with Sibur
• Planned commissioning and subsequent ramp-up in H2
26/02/2014
Q4 & FY 2013 results 41
REBITDA considerations for 2014

• Debt repayments for € 1 bn in the year, € 1.5 bn by 2015
• € 500 m in January 2014
• € 500 m in May 2014 (call option on high-yield bond 2018)
• € 500 m in 2015
Lead to a reduction of net interest charges
Average gross interest rate to reduce by 40 bp to 4.9%
Cost of carry on cash to decrease following reduced cash position
• Discounting costs on provisions, at YE 2013 rates
• Environmental provisions: ~ € 30 m
• Pensions: ~ € 100 m
26/02/2014
Q4 & FY 2013 results 42
Financial charges considerations for 2014

• Nominal value of € 1.2 bn, at initial average dividend yield of 4.7%
• € 0.5 bn at 5.425%
• € 0.7 bn at 4.199%
• Dividends from hybrid bond will be accounted for in equity
Income statement:
No impact
Statement of financial position:
Treated under Equity
Statement of cash flows:
Treated as dividend in Cash flow from financing activities
26/02/2014
Q4 & FY 2013 results 43
Hybrid bond

• Depreciation & Amortization
• Recurring Depreciation & Amortization: ~€ 650 m
• Rhodia PPA impact: ~€ 120 m
• Restructuring costs expected to be lower
• Recurring tax rate mid to low 30s over 2014-2016
• Discontinued operations, expected to reach completion in 2014
• Indupa sale to Braskem to add negative result of currency translation
adjustments for ~ € 50 m (situation YE 2013) at deal closing
• Chlorovinyls JV with Ineos will be treated as equity associate upon JV
effectiveness
26/02/2014
Q4 & FY 2013 results 44
Other considerations for 2014
Annexes
• Q4 & FY 2013 Group results
• Q4 & FY 2013 segment results
• Considerations for 2014
• 2016 ambition
• Segment presentation
26/02/2014
Q4 & FY 2013 results 45

26/02/2014
Q4 & FY 2013 results 46
Solvay, a major global chemical player
€ 9.9 bn Net sales
€ 1.7 bn REBITDA
16.7% REBITDA margin
€ 378 m Adjusted Net Income,
Group share
Based on strengths 117 Industrial sites
15 Major R&I centers
29,400 Employees (EFTEs)
56 Country presence
And with ambition
Well-balanced geographical
spread and end-user markets
Leading player in 90%
of our businesses
Strong
R&I portfolio
All figures excluding discontinued operations, except for employees

26/02/2014
Q4 & FY 2013 results 47
Well-balanced geographical spread and end-user markets
Aeronautics
& Automotive
17% Consumer Goods
& Healthcare
25% Agro
Food
12% Energy &
Environment
11% Building
& Construction
10% Electrical
& Electronics
6% Industrial
Applications
19%
Balanced geographic exposure*
North
America
25%
Europe
33%
Latin
America
11%
Asia Pacific
& RoW
31%
Exposure to higher growth end-markets*
* Figures represent % of 2013 net sales (pro-forma Chemlogics)

26/02/2014
Q4 & FY 2013 results 48
90% of our business ranking among top 3 players
1
Phosphorus
chemistry
Diphenols
Specialty
surfactants
ADVANCED
FORMULATIONS
High-performance
engineering
polymers
& compounds
ADVANCED
MATERIALS
Bicarbonate
Soda ash
Hydrogen
peroxide
PERFORMANCE
CHEMICALS
High-barrier
polymers
Fluorinated
polymers
High-dispersible
silica
Rare earth
formulations
FUNCTIONAL
POLYMERS
PA 6.6 polymers
& intermediates
PA 6.6 engineering
plastics
3 PERFORMANCE
CHEMICALS
Cellulose acetate
fiber

26/02/2014
Q4 & FY 2013 results 49
Strong innovation portfolio aligned with global megatrends
2013
Major sites worldwide
15
1,950
€ 280 m
22%
251
R&I staff
R&I efforts
New sales ratio
Patents filed
Renewable
chemistry
Climate change
Resource scarcity
Next bn consumers
Sustainable
energy
Organic
electronics
Eco-
processes
Advanced
formulations
Advanced
materials
Health & well being

26/02/2014
Q4 & FY 2013 results 50
Converting vision into value
• Reinforcing business profile
through strategic portfolio changes
• Striving for excellence
across businesses
• Innovating to create
sustainable solutions
• Transforming company culture
with a focus on performance
Our strategy Our 2016 ambition
REBITDA to reach
€ 2.3 - 2.5 bn
CFROI to increase by
>100 bp vs 2013*
From 1/3rd to 2/3rd
of businesses in
value creation zone
Keeping focus
on being a
model of
sustainability
* Prior to discontinued operations

INTEGRATION
26/02/2014
Q4 & FY 2013 results 51
A business portfolio change
Executing our strategic action plan
Pharma divestiture
2010 Rhodia acquisition
2011
Integration & definition
of new strategic priorities
2012
Alignment of corporate
& business structure
Renew management
And people model
TRANSFORMATION
2013
Chlorovinyls Europe JV
announcement
Solvay Indupa divestiture
Chemlogics acquisition
LAUNCHING EXCELLENCE INITIATIVES
Soda Ash breakthrough
performance improvement plan
Chemlogics
GROW
ENHANCE
EXIT
RESTORE
Value creation potential
of industry segment
Solv
ay’s
abili
ty
to e
xtra
ct
valu
e
Solvay businesses Solvay Group evolution Chemical industry
To enhance our business profile
Polyamide breakthrough
performance improvement plan

>10% CAGR
Commercial
Excellence
Overall
Equipment
Efficiency
Market
growth
Variable
& fixed cost
reductions
Purchasing,
supply & other
efficiencies
Innovation
Excellence
Manufacturing
Excellence
230
Excellence
programs
670
2013
Chemlogics
(10 months)
(260) 300
280
250
2016e
1,663*
2,300-2,500
26/02/2014
Q4 & FY 2013 results 52
REBITDA growth
Portfolio Inflation Innovation Organic
growth
Operational
excellence
REBITDA in € m
* Chemlogics consolidated for 2 months
supported by strong operational levers

>10% CAGR
>60% 54%
26/02/2014
Q4 & FY 2013 results 53
Enhanced quality of earnings across segments
Double digit growth Delivering high capital returns
Double digit growth Maintaining low capital intensity
Mid-single digit growth Enhancing sustainable cash generation
Restoring profitability
REBITDA in € m
2013
Chemlogics
(10 months)
Advanced
Formulations
Advanced
Materials
Performance
Chemicals
Functional
Polymers
Corporate
& Energy
2016e
with differentiated levers throughout our businesses

26/02/2014
Q4 & FY 2013 results 54
Focused on being a model of sustainability taking commitments
Investors
Communities
Employees
Suppliers
Planet
Customers
Energy consumption
Greenhouse gas emissions
Groundwater consumption
Air emission*
Water emissions**
Sustainable water
management***
• Reach excellence in safety & health
• Deploy unmatched sustainable portfolio
management
• Reduce our impact on environment by 2020
Providing sustainable solutions
• Manage risk
• Develop rich & balanced social dialogue

26/02/2014
Q4 & FY 2013 results 55
Executing a clear value creation strategy
Towards a higher growth,
improved cash generation
& enhanced returns
Chemical Group
Targeting Sustainable
Value Growth

Annexes
• Q4 & FY 2013 Group results
• Q4 & FY 2013 segment results
• Considerations for 2014
• 2016 ambition
• Segment presentation
26/02/2014
Q4 & FY 2013 results 56

Soda Ash &
Derivatives*
Aroma
Performance
Coatis
Novecare
Silica
Rare Earth
Systems
Specialty
Polymers
Acetow*
Eco-Services
Peroxide* P&I
Engineering
Plastics
Polyamide
Corporate
Functions
Solvay
Energy
Services
Special
Chemicals
Emerging
Biochemicals
Fibras A
dvan
ced
Mat
eria
ls
Per
form
ance
Che
mic
als
Fun
ctio
nal P
olym
ers
Cor
pora
te &
Bus
ines
s S
ervi
ces
Adv
ance
d F
orm
ulat
ions
Net Sales € 2,432 m € 2,551 m € 3,125 m € 1,763 m € 157 m
REBITDA € 369 m € 646 m € 724 m € 93 m € (169) m
REBITDA margin 15% 25% 23% 5% n.m.
New organisation set-up
* Up to end 2013
forming GBU
Essential
Chemicals
2013
26/02/2014
Q4 & FY 2013 results 57
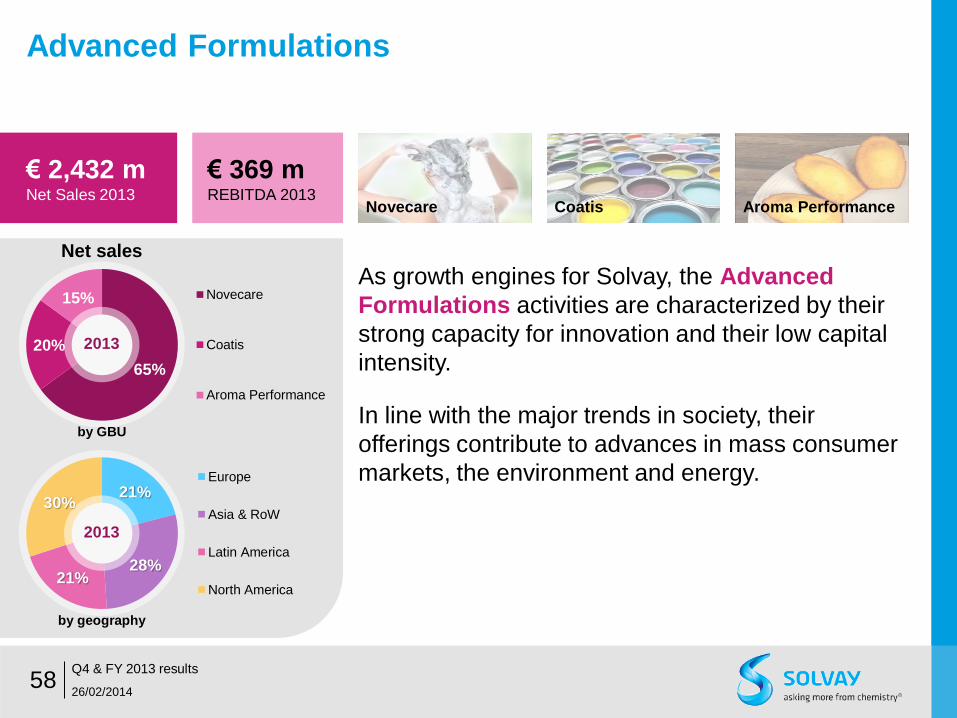
Advanced Formulations
€ 369 m REBITDA 2013
€ 2,432 m Net Sales 2013
As growth engines for Solvay, the Advanced
Formulations activities are characterized by their
strong capacity for innovation and their low capital
intensity.
In line with the major trends in society, their
offerings contribute to advances in mass consumer
markets, the environment and energy. 21%
28% 21%
30%
Europe
Asia & RoW
Latin America
North America
65%
20%
15% Novecare
Coatis
Aroma Performance
2013
2013
Novecare Coatis Aroma Performance
Net sales
by GBU
by geography
26/02/2014
Q4 & FY 2013 results 58

26/02/2014
Q4 & FY 2013 results 59
Advanced Materials
€ 646 m REBITDA 2013
€ 2,551 m Net Sales 2013
A leader in markets with high entry barriers and high
returns on investment, the Advanced Materials
segment is a major contributor to the Group's
performance and growth.
The innovation capacities of its various activities, their
global presence and the long-term partnerships they
have forged with customers give them a clear
competitive edge with industries that are seeking ever
less energy-consuming and polluting functionalities. 39%
32%
5%
24%
Europe
Asia & RoW
Latin America
North America
50%
16%
12%
22% Specialty Polymers
Silica
Rare Earth Systems
Special Chemicals
2013
2013
Specialty
Polymers Silica
Rare Earth
Systems
Special
Chemicals
Net sales
by GBU
by geography

26/02/2014
Q4 & FY 2013 results 60
Performance Chemicals
€ 724 m REBITDA 2013
€ 3,125 m Net Sales 2013
Performance Chemicals operates in specific,
highly resilient and mature markets whose key
success factors are principally economies of scale,
competitiveness and quality of service.
Solidly cash-generating, its activities of the are
engaged in new programs of excellence to create
sustainable value.
56% 21%
9%
14% Essential Chemicals
Acetow
Eco Services
EmergingBiochemicals
34%
36%
7%
23% Europe
Asia & RoW
Latin America
North America
2013
2013
Soda Ash &
Derivatives Peroxides Acetow
Eco
Services
Emerging
Bio-
chemicals
Net sales
by GBU
by geography

26/02/2014
Q4 & FY 2013 results 61
Functional Polymers
€ 93 m REBITDA 2013
€ 1,763 m Net Sales 2013
As part of its portfolio optimization strategy, the Group
has refocused Functional Polymers on the
polyamide chain. Solvay is one of the few players to
control the entire polyamide 6-6 chain.
Given the cyclical nature of its markets, the GBUs in
this segment have launched major competitiveness
enhancement programs. They have also opened new
markets with by launching innovative solutions.
50%
29%
16% 6% Europe
Asia & RoW
Latin America
North America
88%
12% Polyamide
PVC Compounds
2013
2013
Polyamides &
Intermediates Fibras
Engineering
Plastics
PVC
Compounds
Net sales
by GBU
by geography

26/02/2014
Q4 & FY 2013 results 62
Corporate & Business Services
€ (169) m REBITDA 2013
€ 157 m Net Sales 2013
Corporate & Business Services includes the GBU
Energy Services offering of energy optimization
programs for the Group and for third parties.
It also includes the "Corporate" functions that are
responsible with GBUs for defining and deploying
transversal policies that guarantee consistency
within the Group. Further, Solvay Business
Services, handles all the Group's IT and business
processes.
Energy Services Business Services
www.solvay.com