q4 / fy 2017 results | march 21st,...
TRANSCRIPT

1
Q4 / FY 2017 RESULTS | March 21st, 2018
2
Disclaimer
This document has been prepared by HelloFresh SE (the “Company“ and, together with its subsidiaries, the “Group”). All material contained in this document and informationpresented is for information purposes only and must not be relied upon for any purpose, and does not purport to be a full or complete description of the Company or the Group.This document does not, and is not intended to, constitute or form part of, and should not be construed as, an offer to sell, or a solicitation of an offer to purchase, subscribe for orotherwise acquire, any securities of the Company, nor shall it or any part of it form the basis of or be relied upon in connection with or act as any inducement or recommendationto enter into any contract or commitment or investment decision or other transaction whatsoever. This document is not directed at, or intended for distribution to or use by, anyperson or entity that is a citizen or resident or located in any locality, state, country or other jurisdiction where such distribution, publication, availability or use would be contraryto law or regulation or which would require any registration or licensing within such jurisdiction. Persons into whose possession this document comes should inform themselvesabout, and observe, any such restrictions.No representation, warranty or undertaking, express or implied, is made by the Company or any other Group company as to, and no reliance should be placed on, the fairness,accuracy, completeness or correctness of the information or the opinions contained herein, for any purpose whatsoever. No responsibility, obligation or liability is or will beaccepted by the Company or any of its officers, directors, employees, affiliates, agents or advisers in relation to any written or oral information provided in this document or inconnection with the document. All information in this document is subject to verification, correction, completion, updating and change without notice. Neither the Company, norany other Group company undertake any obligation to provide the recipient with access to any additional information or to update this document or any information or to correctany inaccuracies in any such information.A significant portion of the information contained in this document, including market data and trend information, is based on estimates or expectations of the Company, and therecan be no assurance that these estimates or expectations are or will prove to be accurate. Where any information and statistics are quoted from any external source, suchinformation or statistics should not be interpreted as having been adopted or endorsed by the Company or any other person as being accurate. All statements in this documentattributable to third party industry experts represent the Company's interpretation of data, research opinion or viewpoints published by such industry experts, and have not beenreviewed by them. Each publication of such industry experts speaks as of its original publication date and not as of the date of this document.This document contains forward-looking statements relating to the business, financial performance and results of the Company, the Group or the industry in which the Groupoperates. These statements may be identified by words such as "expectation", "belief', "estimate", "plan", "target“ or "forecast" and similar expressions, or by their context.Forward-looking statements include statements regarding: strategies, outlook and growth prospects; future plans and potential for future growth; growth for products andservices in new markets; industry trends; and the impact of regulatory initiatives. These statements are made on the basis of current knowledge and assumptions and involve risksand uncertainties. Various factors could cause actual future results, performance or events to differ materially from those described in these statements, and neither the Companynor any other person accepts any responsibility for the accuracy of the opinions expressed in this document or the underlying assumptions. No obligation is assumed to update anyforward-looking statements.These materials may not be published, distributed or transmitted in the United States, Canada, Australia or Japan. These materials do not constitute an offer of securities for saleor a solicitation of an offer to purchase securities (the “Securities”) of the Company in the United States, Germany or any other jurisdiction. The Securities of the Company may notbe offered or sold in the United States absent registration or an exemption from registration under the U.S. Securities Act of 1933, as amended (the “Securities Act”). TheSecurities of the Company have not been, and will not be, registered under the Securities Act. Any sale in the United States of the securities mentioned in this communication willbe made solely to “qualified institutional buyers” as defined in, and in reliance on, Rule 144A under the Securities Act.In the United Kingdom, this document is only made available to and is only directed at persons who (i) are investment professionals falling within Article 19(5) of the FinancialServices and Markets Act 2000 (Financial Promotion) Order 2005 (as amended) (the “Order”) or (ii) are persons falling within Article 49(2)(a) to (d) of the Order (high net worthcompanies, unincorporated associations, etc.) (all such persons together being referred to as “Relevant Persons”). This document is directed only at Relevant Persons and mustnot be acted on or relied on by persons who are not Relevant Persons. Any investment or investment activity to which this document relates is available only to Relevant Personsand will be engaged in only with Relevant Persons.
3
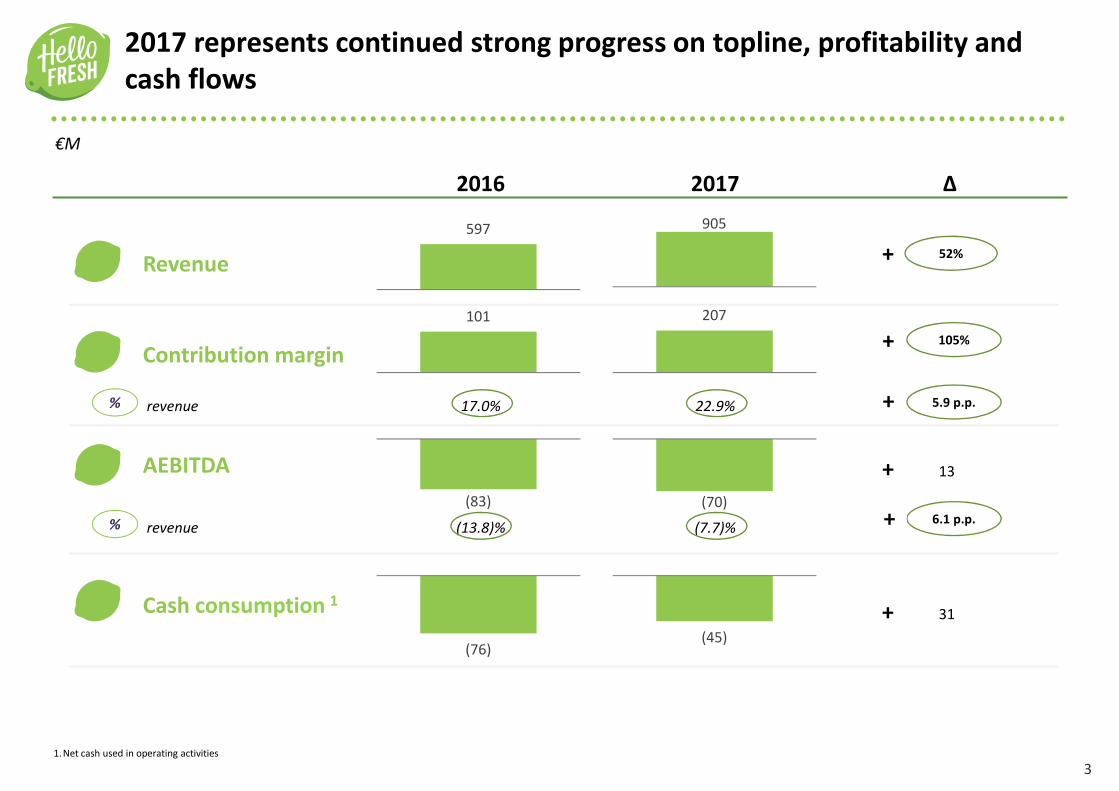
(83) (70)
905
2016 2017 ∆
revenue 17.0% 22.9%
revenue (13.8)% (7.7)%
207101
2017 represents continued strong progress on topline, profitability and cash flows
€M
597
(76)(45)
Revenue
Contribution margin
AEBITDA
Cash consumption 1
%
%
+
+
+
+
52%
105%
5.9 p.p.+
6.1 p.p.
13
31
1.Net cash used in operating activities
+

4
141
205
150
230
147
217
15
159
253
We accelerated revenue growth every quarter, culminating in 69% growth in Q4 (in constant currency)
1.Based on constant currency
+45% +54% +48%
+53%
Q1 2016 Q1 2017 Q2 2016 Q2 2017 Q3 2016 Q3 2017
€M
+52%+43%
€
CC1
Q4 2016 Q4 2017
+59%
+69%
268
5
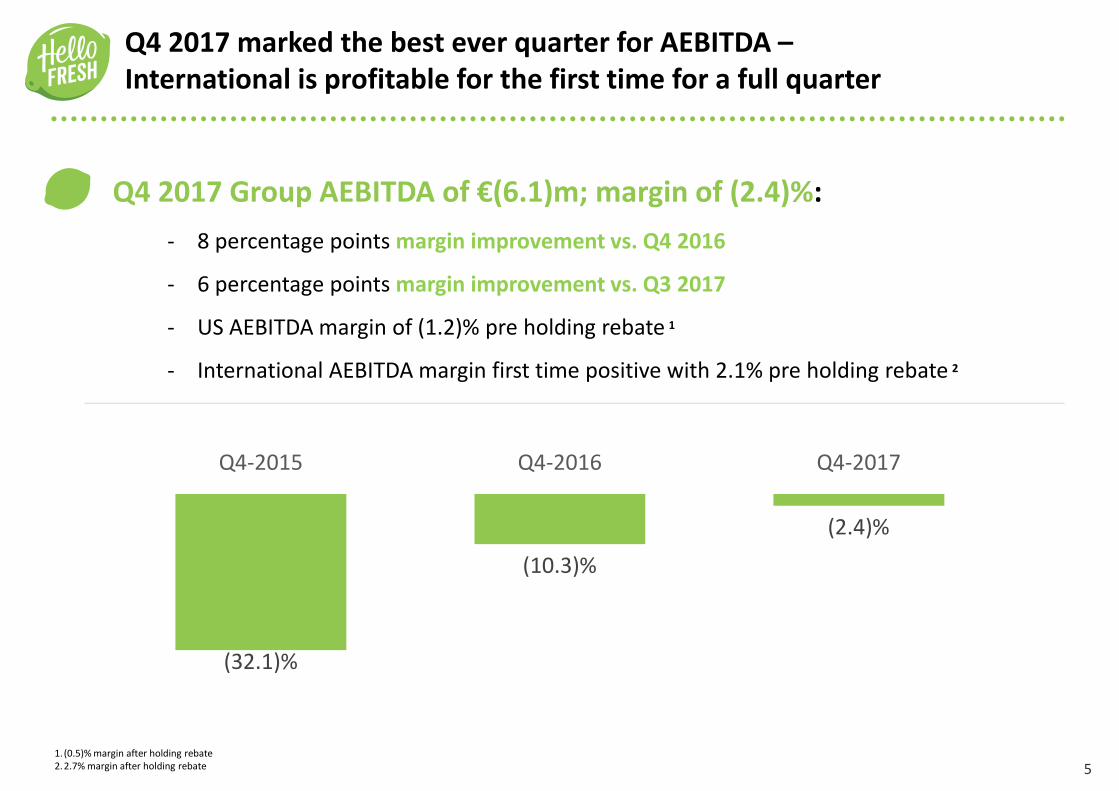
Q4 2017 marked the best ever quarter for AEBITDA –International is profitable for the first time for a full quarter
Q4 2017 Group AEBITDA of €(6.1)m; margin of (2.4)%:
- 8 percentage points margin improvement vs. Q4 2016
- 6 percentage points margin improvement vs. Q3 2017
- US AEBITDA margin of (1.2)% pre holding rebate 1
- International AEBITDA margin first time positive with 2.1% pre holding rebate 2
1. (0.5)% margin after holding rebate2.2.7% margin after holding rebate
(32.1)%
(10.3)%
(2.4)%
Q4-2015 Q4-2016 Q4-2017
6
Co
re c
apab
iliti
es
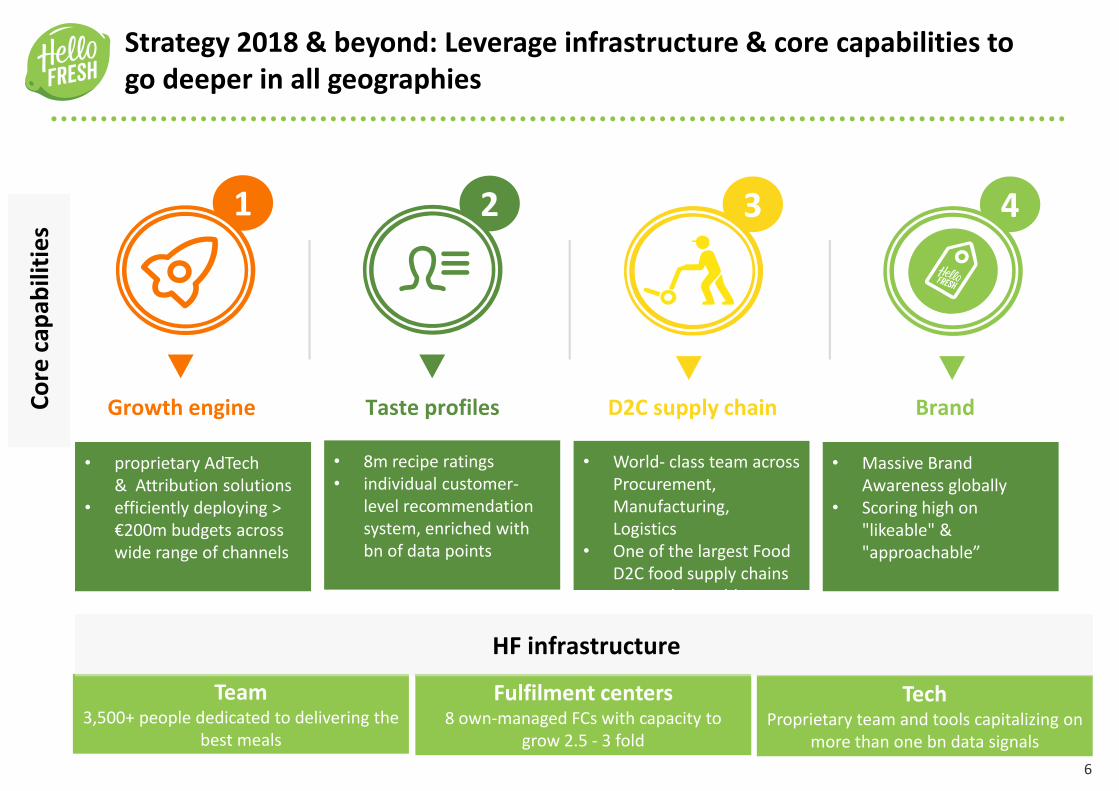
Strategy 2018 & beyond: Leverage infrastructure & core capabilities to go deeper in all geographies
1 2 3 4
Taste profiles D2C supply chainGrowth engine Brand
Fulfilment centers8 own-managed FCs with capacity to
grow 2.5 - 3 fold
TechProprietary team and tools capitalizing on
more than one bn data signals
Team3,500+ people dedicated to delivering the
best meals
HF infrastructure
• proprietary AdTech & Attribution solutions
• efficiently deploying > €200m budgets across wide range of channels
• 8m recipe ratings• individual customer-
level recommendation system, enriched with bn of data points
• World- class team across Procurement, Manufacturing, Logistics
• One of the largest Food D2C food supply chains across the world
• Massive Brand Awareness globally
• Scoring high on "likeable" & "approachable”

7
Broadening Product Portfolio
Dinner-to-lunch introduction in US
Roll out of premium meals in UK, Benelux
Introductions of desserts in Benelux
Acquisition of Green Chef (see next slide)
More Flexibility
Introducing 3 person plans in DE/AT
Expanding meal choice in AU
20 min. meals in the US
Gluten-free meals launched in UK
Increasing Personalization
Personalization successfully started in US
Upfront protein exclusion
Customer clustering
Individualized taste profiling
Launch New Verticals and markets
Launch of smart fridges in DE
Launch of Froozeo in DE
Expansion to Western Australia in Q4’17
Broadening product portfolio, increasing personalization and flexibility as well as launching new verticals will drive the majority of our growth
Global infrastructure footprint enables a high speed of innovation and multiple tests simultaneously
8
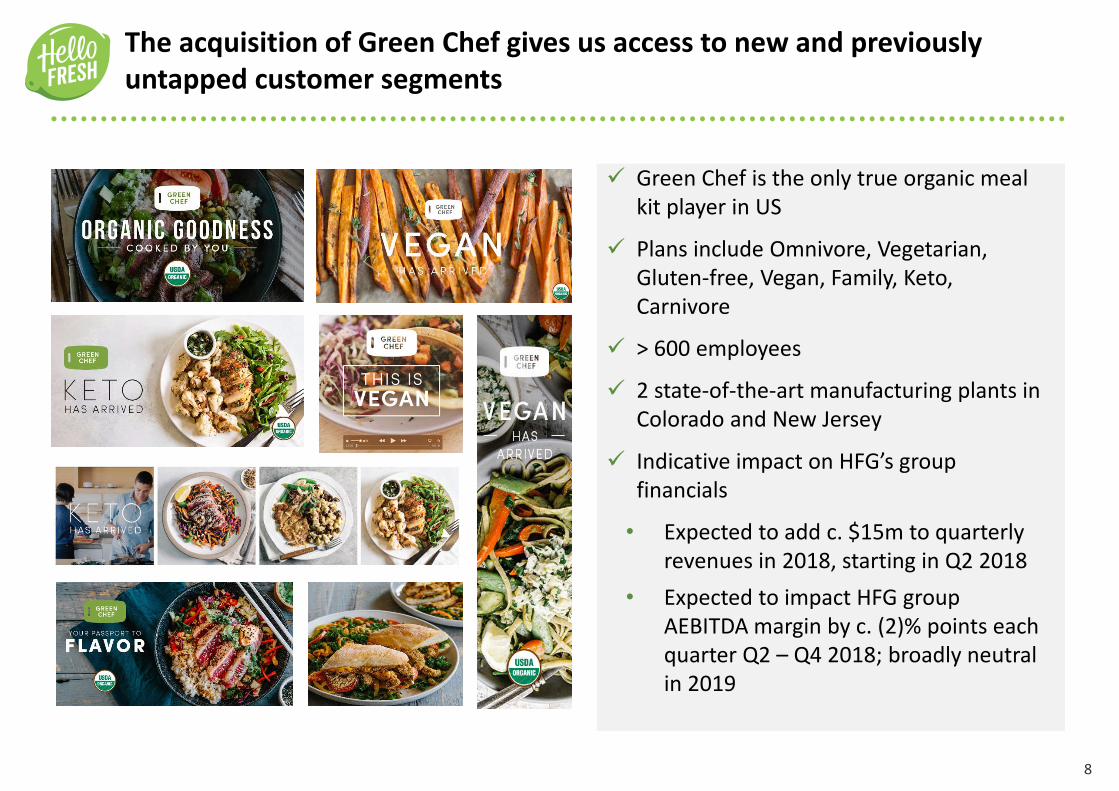
The acquisition of Green Chef gives us access to new and previously untapped customer segments
Green Chef is the only true organic meal kit player in US
Plans include Omnivore, Vegetarian, Gluten-free, Vegan, Family, Keto, Carnivore
> 600 employees
2 state-of-the-art manufacturing plants in Colorado and New Jersey
Indicative impact on HFG’s group financials
• Expected to add c. $15m to quarterly revenues in 2018, starting in Q2 2018
• Expected to impact HFG group AEBITDA margin by c. (2)% points each quarter Q2 – Q4 2018; broadly neutral in 2019
9
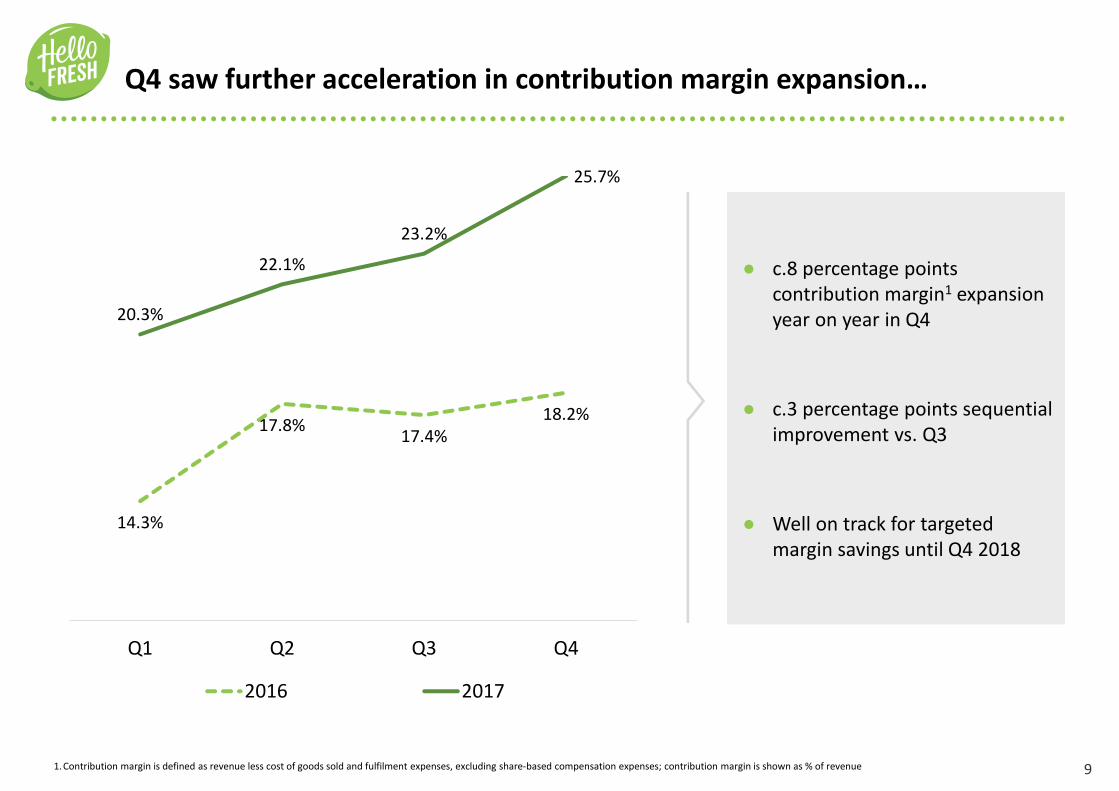
Q4 saw further acceleration in contribution margin expansion…
● c.8 percentage points contribution margin1 expansion year on year in Q4
● c.3 percentage points sequential improvement vs. Q3
● Well on track for targeted margin savings until Q4 2018
1.Contribution margin is defined as revenue less cost of goods sold and fulfilment expenses, excluding share-based compensation expenses; contribution margin is shown as % of revenue
14.3%
17.8% 17.4%
18.2%
20.3%
22.1%
23.2%
25.7%
Q1 Q2 Q3 Q4
2016 2017

10
… leading to the best ever quarter for AEBITDA1 margin!
● (2.4)% AEBITDA margin in Q4, c.8 percentage points better than in Q4 2016
- Continued strong year-on-year expansion across both segments
- US AEBITDA margin of (1.2)% pre holding rebate 2
- International AEBITDA margin first time positive with 2.1% pre holding rebate 3
- Organic AEBITDA break even in Q4 2018 is within reach!
1.AEBITDA is calculated by adjusting EBITDA for special items and share-based compensation expenses; AEBITDA margin is defined as % of revenue2. (0.5)% margin after holding rebate3. 2.7% margin after holding rebate
(19.3)%
(12.3)%(14.0)%
(10.3)%(14.4)%
(7.4)% (8.0)%
(2.4)%
Q1 Q2 Q3 Q4
2016 2017
11
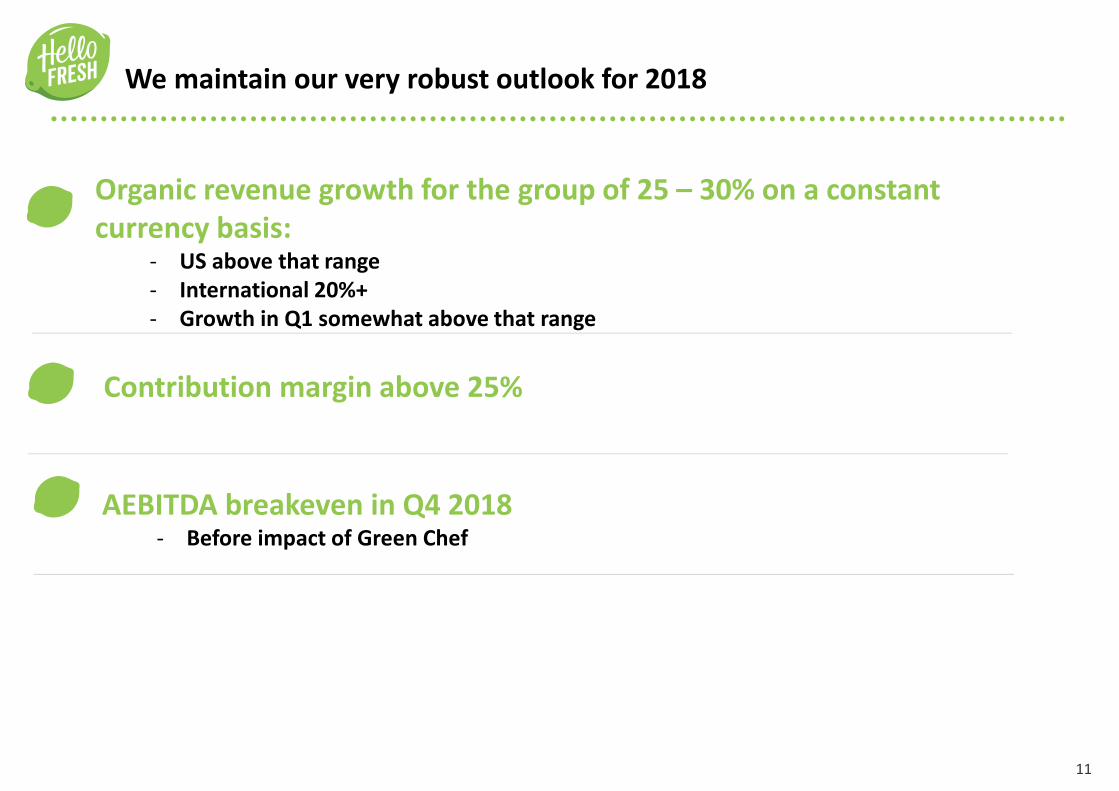
We maintain our very robust outlook for 2018
Organic revenue growth for the group of 25 – 30% on a constant currency basis:
- US above that range- International 20%+- Growth in Q1 somewhat above that range
Contribution margin above 25%
AEBITDA breakeven in Q4 2018- Before impact of Green Chef
12
Vietnamese Beef3.67 / 4.00 Stars
12
APPENDIX
13
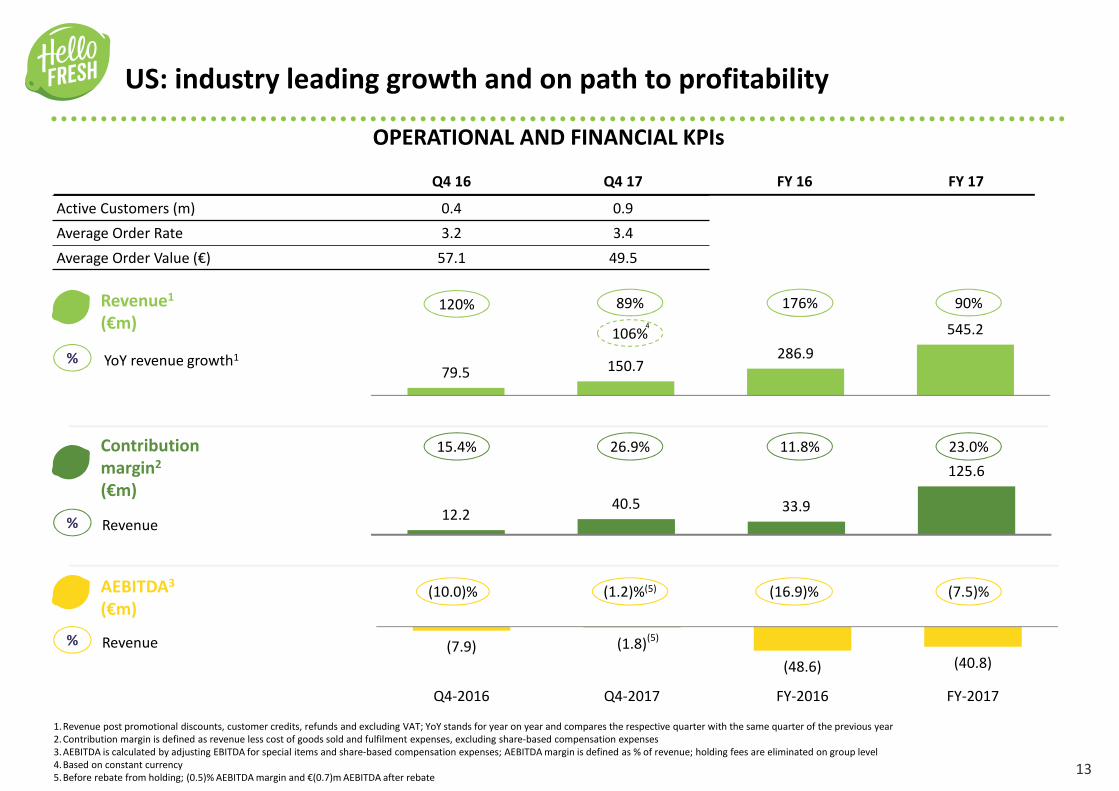
12.240.5 33.9
125.6
79.5 150.7286.9
545.2
US: industry leading growth and on path to profitability
Q4 16 Q4 17 FY 16 FY 17
Active Customers (m) 0.4 0.9
Average Order Rate 3.2 3.4
Average Order Value (€) 57.1 49.5
OPERATIONAL AND FINANCIAL KPIs
Revenue1
(€m)
%
%
%
YoY revenue growth1
Contributionmargin2
(€m)
AEBITDA3
(€m)
1.Revenue post promotional discounts, customer credits, refunds and excluding VAT; YoY stands for year on year and compares the respective quarter with the same quarter of the previous year2.Contribution margin is defined as revenue less cost of goods sold and fulfilment expenses, excluding share-based compensation expenses3.AEBITDA is calculated by adjusting EBITDA for special items and share-based compensation expenses; AEBITDA margin is defined as % of revenue; holding fees are eliminated on group level4.Based on constant currency5.Before rebate from holding; (0.5)% AEBITDA margin and €(0.7)m AEBITDA after rebate
Revenue
Revenue
26.9%
106%4
89%
(1.2)%(5)
120%
15.4%
(10.0)%
90%176%
23.0%11.8%
(7.5)%(16.9)%
(7.9) (1.8)
(48.6) (40.8)
Q4-2016 Q4-2017 FY-2016 FY-2017
(5)
14
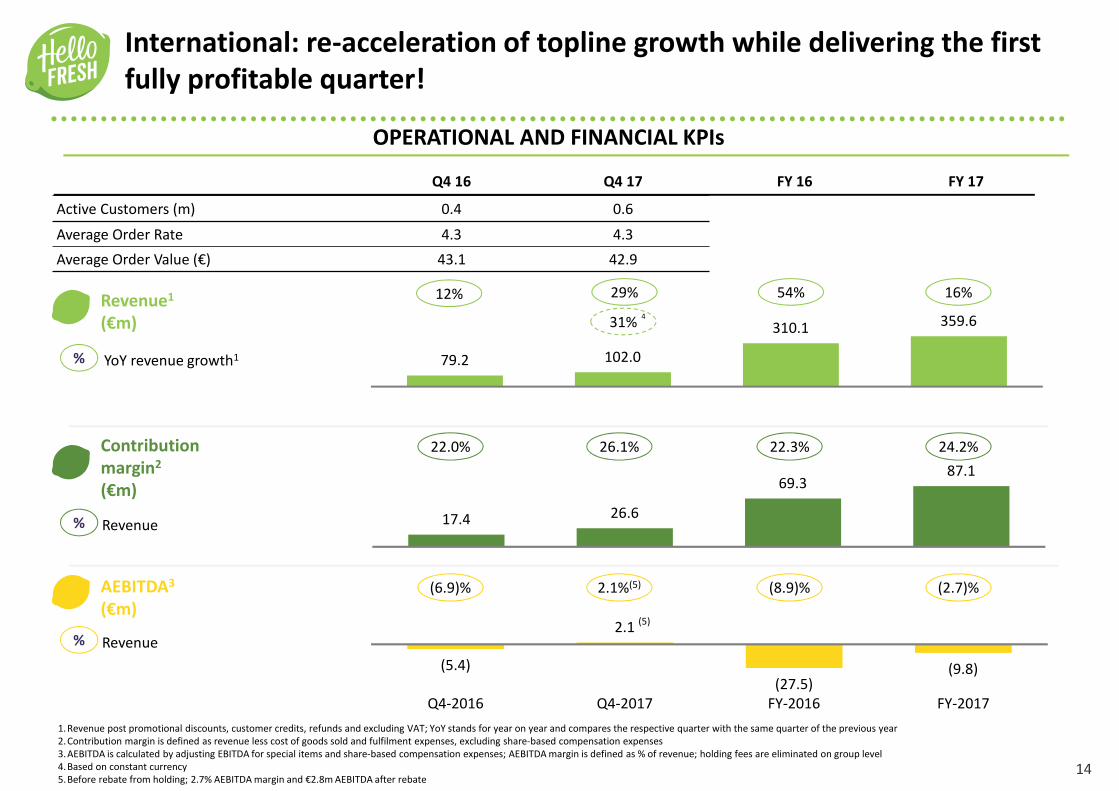
17.4 26.6
69.387.1
International: re-acceleration of topline growth while delivering the first fully profitable quarter!
Q4 16 Q4 17 FY 16 FY 17
Active Customers (m) 0.4 0.6
Average Order Rate 4.3 4.3
Average Order Value (€) 43.1 42.9
OPERATIONAL AND FINANCIAL KPIs
%
%
Contributionmargin2
(€m)
AEBITDA3
(€m)
1.Revenue post promotional discounts, customer credits, refunds and excluding VAT; YoY stands for year on year and compares the respective quarter with the same quarter of the previous year2.Contribution margin is defined as revenue less cost of goods sold and fulfilment expenses, excluding share-based compensation expenses3.AEBITDA is calculated by adjusting EBITDA for special items and share-based compensation expenses; AEBITDA margin is defined as % of revenue; holding fees are eliminated on group level4.Based on constant currency5.Before rebate from holding; 2.7% AEBITDA margin and €2.8m AEBITDA after rebate
Revenue
Revenue
12%
22.0%
(6.9)%
Revenue1
(€m)
% YoY revenue growth1
26.1%
31%4
29%
2.1%(5)
16%54%
24.2%22.3%
(2.7)%(8.9)%
79.2 102.0
310.1 359.6
(5.4)
2.1
(27.5)(9.8)
Q4-2016 Q4-2017 FY-2016 FY-2017
(5)

15
Profit & loss statement
(€m)
Financial result
Net income / (loss)
EBT
Income tax (expense) benefit
Margin (% of revenue)
1. Including share-based compensation expenses2.AEBITDA is calculated by adjusting EBITDA for special items and share-based compensation expenses; AEBITDA margin is defined as % of revenue
Revenue
% YoY growth
Cost of goods sold1
Gross profit
Margin (% of revenue)
Fulfilment expenses1
Marketing expenses1
G&A1
EBIT
Margin (% of revenue)
Other operating income & expenses
Reconciliation starting at EBIT
EBIT
D&A
SBC
Special Items
AEBITDA2
EBITDA
(0.3)
(10.6)
(13.2)
2.6
(2.4)%
Q4 2017
252.8
59%
(98.8)
154.0
61%
(89.4)
(59.4)
(16.3)
(12.9)
(5)%
(1.8)
(12.9)
2.3
3.6
0.9
(6.1)
(10.6)
Q4 2016
158.7
48%
(67.7)
91.0
57%
(61.8)
(37.0)
(7.7)
(16.3)
(10)%
(0.8)
(0.6)
(16.6)
(16.9)
0.3
(10.0)%
(16 .3)
1.4
(2.0)
0.6
(16.3)
(14.9)
FY 2017
904.9
52%
(365.8)
539.1
60%
(332.3)
(239.7)
(51.8)
(88.8)
(10)%
(4.1)
(6.3)
(92.0)
(95.1)
3.1
(7.7)%
(88.8)
8.1
7.4
3.2
(70.1)
(80.7)
FY 2016
597.0
96%
(257.3)
339.6
57%
(238.4)
(157.4)
(30.7)
(90.5)
(15)%
(3.6)
(3.7)
(93.9)
(94.1)
0.3
(13.8)%
(90.5)
4.3
2.0
1.6
(82.6)
(86.2)
16
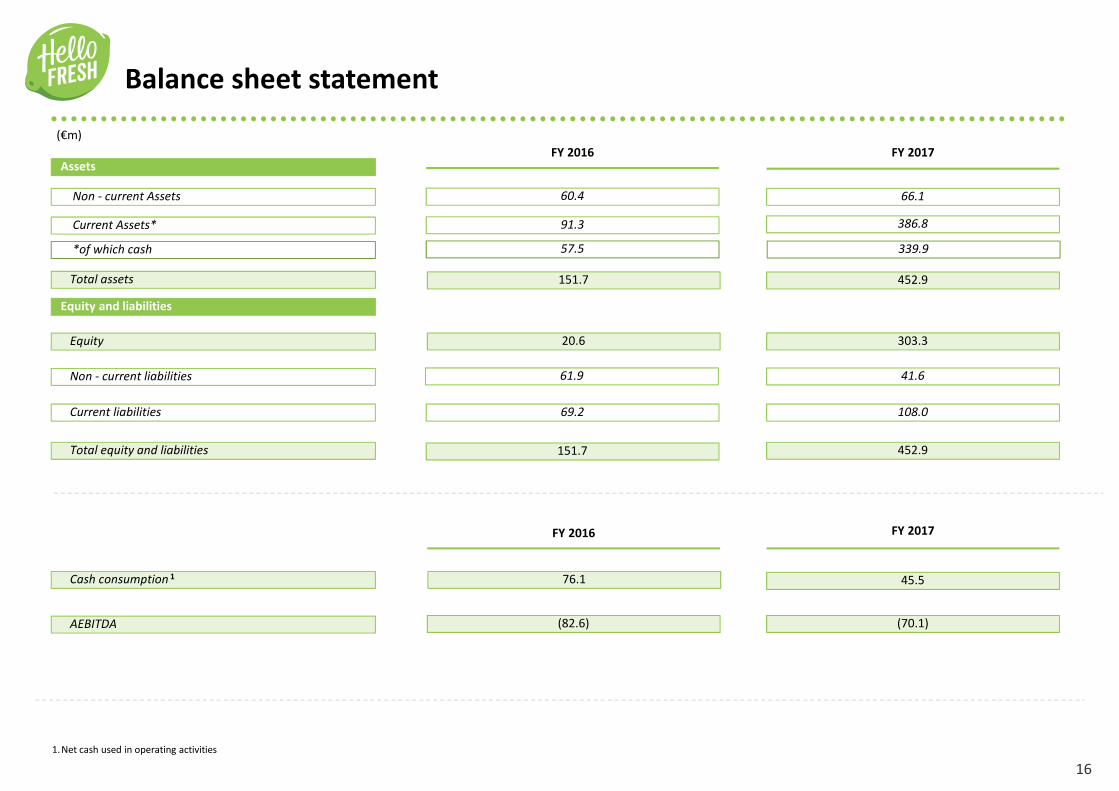
Balance sheet statement
(€m)
Equity and liabilities
Assets
Total equity and liabilities
Total assets
Equity
Non - current Assets
Current Assets*
Non - current liabilities
AEBITDA
Cash consumption 1
Current liabilities
FY 2017
66.1
452.9
386.8
303.3
108.0
41.6
452.9
FY 2016
60.4
91.3
151.7
20.6
69.2
61.9
151.7
*of which cash 339.957.5
FY 2016 FY 2017
76.1
(82.6) (70.1)
45.5
1.Net cash used in operating activities

17