q4 & fy2016 results - the phoenix · pdf fileq4 & fy2016 results ... (5.60 msf) hsp...
TRANSCRIPT
Q4 & FY2016 Results
Disclaimer
Certain statements in this communication may be ‘forward looking statements’ within the meaning of applicable
laws and regulations. These forward-looking statements involve a number of risks, uncertainties and other factors
that could cause actual results to differ materially from those suggested by the forward-looking statements.
Important developments that could affect the Company’s operations include changes in the industry structure,
significant changes in political and economic environment in India and overseas, tax laws, import duties, litigation
and labour relations.
The Phoenix Mills Ltd. (PML) will not be in any way responsible for any action taken based on such statements and
undertakes no obligation to publicly update these forward-looking statements to reflect subsequent events or
circumstances.
2
Q4 & FY2016 Results
Portfolio Performance
Shareholding Pattern
Company Overview
3
Debt Profile
Financial Overview
Annexure
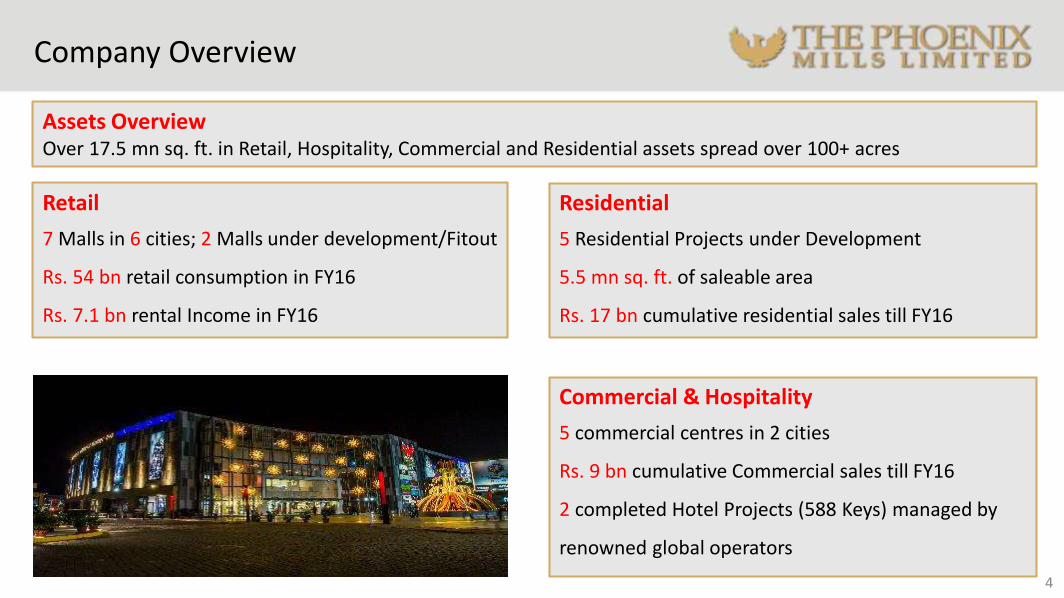
Company Overview
4
Assets OverviewOver 17.5 mn sq. ft. in Retail, Hospitality, Commercial and Residential assets spread over 100+ acres
Retail
7 Malls in 6 cities; 2 Malls under development/Fitout
Rs. 54 bn retail consumption in FY16
Rs. 7.1 bn rental Income in FY16
Residential
5 Residential Projects under Development
5.5 mn sq. ft. of saleable area
Rs. 17 bn cumulative residential sales till FY16
Commercial & Hospitality
5 commercial centres in 2 cities
Rs. 9 bn cumulative Commercial sales till FY16
2 completed Hotel Projects (588 Keys) managed by
renowned global operators

Key Execution Milestones
5
One of the oldest business groups in India with a strong track record of execution and delivery with history spanning over 100 years
Started by the Ruia family
Began operations as a textile
company on 21 acres land in
Lower Parel, Mumbai
Opened Phoenix MarketCity,
Pune
Opened Courtyard by
Marriott, Agra
Launched Kessaku, Luxury
Residential Development in
Bangalore
Opened Phoenix MarketCity,
Mumbai
Opened Phoenix MarketCity,
Bangalore
Commissioned Palladium
Hotel, Mumbai
1999 2002 Q1 20151905 Q1 2014Q4 2012 Q1 2013Q4 2011Q2 20112007 20091986 Q1 2012 Q3 20122001 Q3 2011
Successfully raised INR 13 bn
through a QIP and preferential
issue
Announced the development of
Market Cities in Mumbai, Pune,
Bangalore and Chennai
Built the first multi-
storied residential luxury
tower, Phoenix Towers
Opened a Luxury mall,
The Palladium, at
Mumbai
Opened High Street
Phoenix mall
Opened Phoenix
MarketCity, Chennai
Launched Chennai Residential,
Development, The Crest
Launched Phoenix Paragon Plaza,
Mumbai Commercial Development
Launched Commercial
development Art Guild
House in Kurla, Mumbai
Big Bazaar Started
Operations at High
Street Phoenix
Launched Fountainhead,
Residential development in
Pune
Launched One Bangalore
West, Residential
Development in Bangalore
Opened Phoenix House and
Phoenix Center with 350,000 sq.ft
of Office space
Note – Year denotes calendar year
Q3 2015
Successfully raised INR 2.83 bn
through a QIP
Palladium hotel rebranded as
The St .Regis, Mumbai
Acquired controlling stake in
Gangetic Hotels, Agra
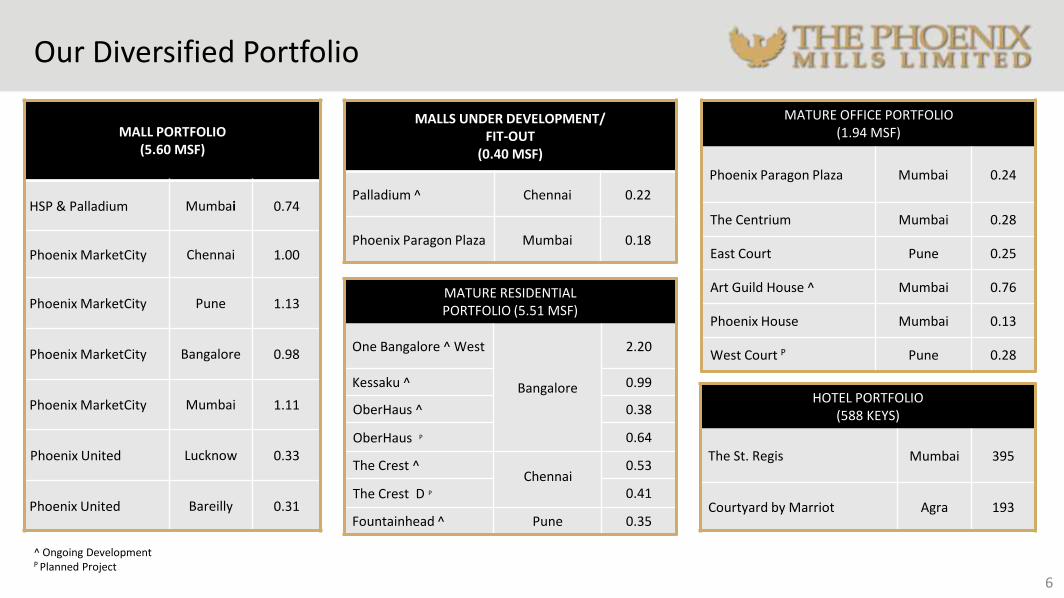
Our Diversified Portfolio
MALL PORTFOLIO (5.60 MSF)
HSP & Palladium Mumbai 0.74
Phoenix MarketCity Chennai 1.00
Phoenix MarketCity Pune 1.13
Phoenix MarketCity Bangalore 0.98
Phoenix MarketCity Mumbai 1.11
Phoenix United Lucknow 0.33
Phoenix United Bareilly 0.31
MALLS UNDER DEVELOPMENT/ FIT-OUT
(0.40 MSF)
Palladium ̂ Chennai 0.22
Phoenix Paragon Plaza Mumbai 0.18
MATURE RESIDENTIAL PORTFOLIO (5.51 MSF)
One Bangalore ^ West
Bangalore
2.20
Kessaku ^ 0.99
OberHaus ^ 0.38
OberHaus P 0.64
The Crest ^Chennai
0.53
The Crest D P 0.41
Fountainhead ̂ Pune 0.35
MATURE OFFICE PORTFOLIO (1.94 MSF)
Phoenix Paragon Plaza Mumbai 0.24
The Centrium Mumbai 0.28
East Court Pune 0.25
Art Guild House ^ Mumbai 0.76
Phoenix House Mumbai 0.13
West Court P Pune 0.28
HOTEL PORTFOLIO(588 KEYS)
The St. Regis Mumbai 395
Courtyard by Marriot Agra 193
^ Ongoing Development P Planned Project
6
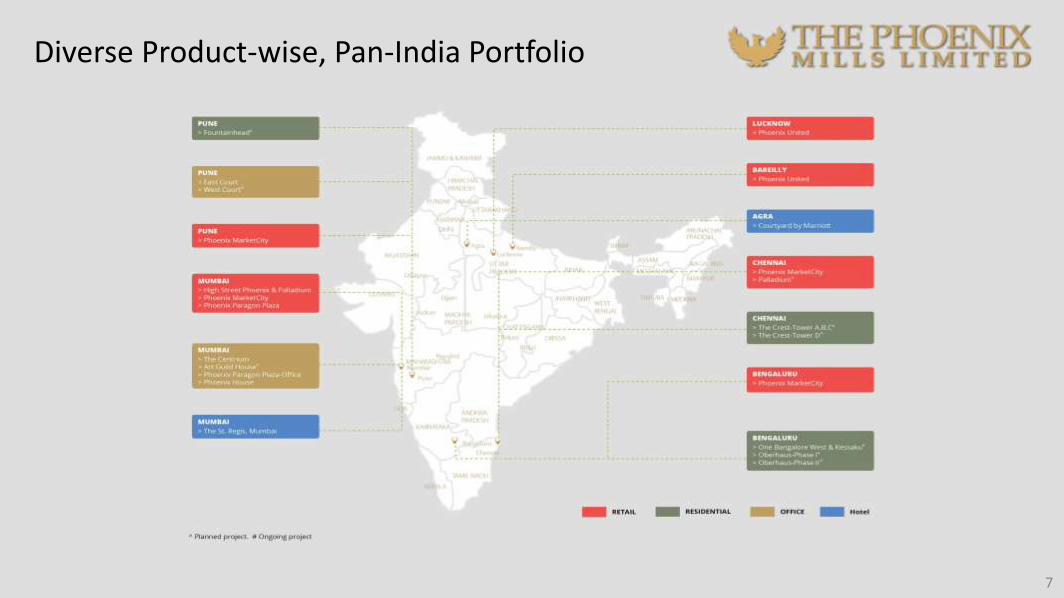
Diverse Product-wise, Pan-India Portfolio
7
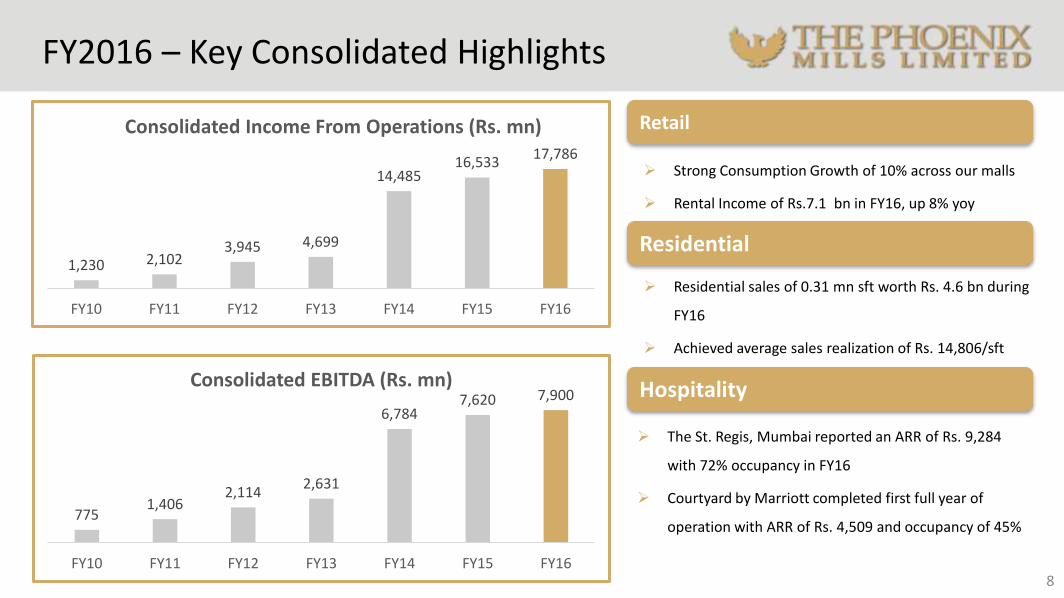
FY2016 – Key Consolidated Highlights
8
1,230 2,1023,945 4,699
14,48516,533
17,786
FY10 FY11 FY12 FY13 FY14 FY15 FY16
Consolidated Income From Operations (Rs. mn)
7751,406
2,1142,631
6,7847,620 7,900
FY10 FY11 FY12 FY13 FY14 FY15 FY16
Consolidated EBITDA (Rs. mn)
Retail
Residential
Hospitality
Strong Consumption Growth of 10% across our malls
Rental Income of Rs.7.1 bn in FY16, up 8% yoy
Residential sales of 0.31 mn sft worth Rs. 4.6 bn during
FY16
Achieved average sales realization of Rs. 14,806/sft
The St. Regis, Mumbai reported an ARR of Rs. 9,284
with 72% occupancy in FY16
Courtyard by Marriott completed first full year of
operation with ARR of Rs. 4,509 and occupancy of 45%
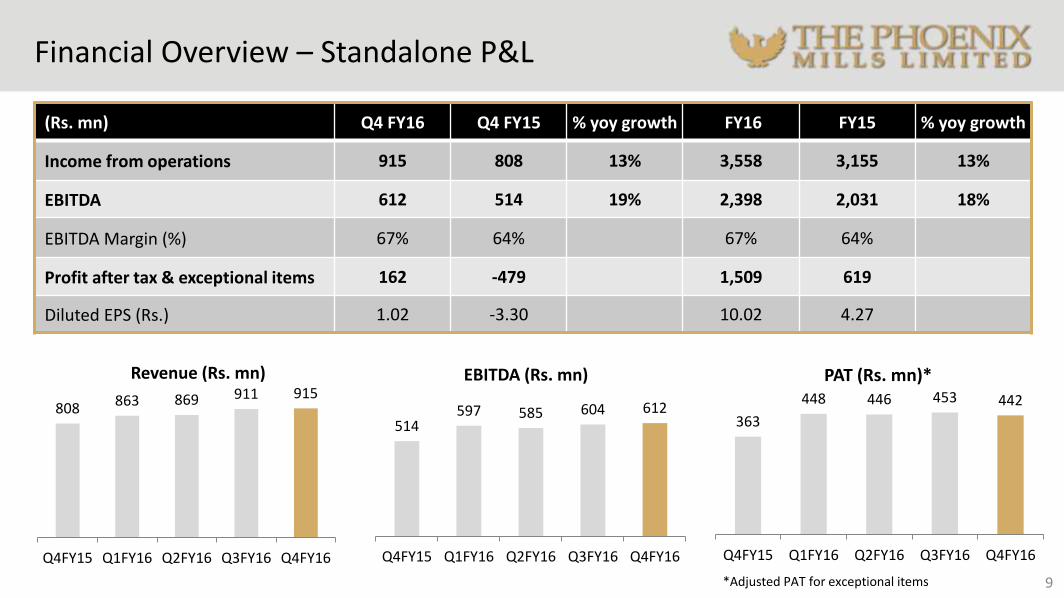
Financial Overview – Standalone P&L
(Rs. mn) Q4 FY16 Q4 FY15 % yoy growth FY16 FY15 % yoy growth
Income from operations 915 808 13% 3,558 3,155 13%
EBITDA 612 514 19% 2,398 2,031 18%
EBITDA Margin (%) 67% 64% 67% 64%
Profit after tax & exceptional items 162 -479 1,509 619
Diluted EPS (Rs.) 1.02 -3.30 10.02 4.27
9
808 863 869 911 915
Q4FY15 Q1FY16 Q2FY16 Q3FY16 Q4FY16
Revenue (Rs. mn)
514597 585 604 612
Q4FY15 Q1FY16 Q2FY16 Q3FY16 Q4FY16
EBITDA (Rs. mn)
363
448 446 453 442
Q4FY15 Q1FY16 Q2FY16 Q3FY16 Q4FY16
PAT (Rs. mn)*
*Adjusted PAT for exceptional items
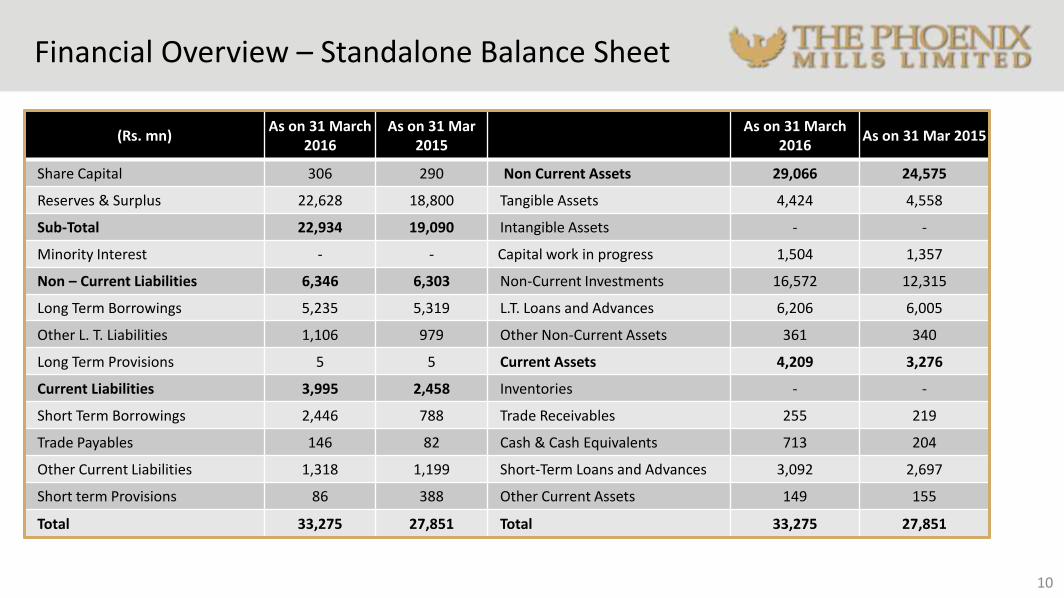
Financial Overview – Standalone Balance Sheet
10
(Rs. mn)As on 31 March
2016 As on 31 Mar
2015 As on 31 March
2016 As on 31 Mar 2015
Share Capital 306 290 Non Current Assets 29,066 24,575
Reserves & Surplus 22,628 18,800 Tangible Assets 4,424 4,558
Sub-Total 22,934 19,090 Intangible Assets - -
Minority Interest - - Capital work in progress 1,504 1,357
Non – Current Liabilities 6,346 6,303 Non-Current Investments 16,572 12,315
Long Term Borrowings 5,235 5,319 L.T. Loans and Advances 6,206 6,005
Other L. T. Liabilities 1,106 979 Other Non-Current Assets 361 340
Long Term Provisions 5 5 Current Assets 4,209 3,276
Current Liabilities 3,995 2,458 Inventories - -
Short Term Borrowings 2,446 788 Trade Receivables 255 219
Trade Payables 146 82 Cash & Cash Equivalents 713 204
Other Current Liabilities 1,318 1,199 Short-Term Loans and Advances 3,092 2,697
Short term Provisions 86 388 Other Current Assets 149 155
Total 33,275 27,851 Total 33,275 27,851
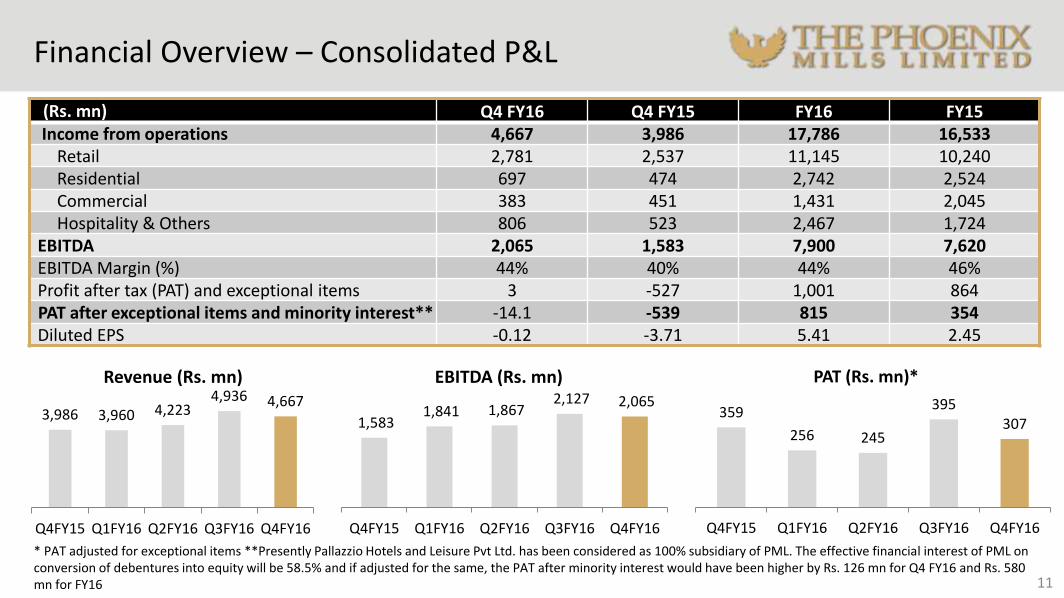
Financial Overview – Consolidated P&L
* PAT adjusted for exceptional items **Presently Pallazzio Hotels and Leisure Pvt Ltd. has been considered as 100% subsidiary of PML. The effective financial interest of PML on conversion of debentures into equity will be 58.5% and if adjusted for the same, the PAT after minority interest would have been higher by Rs. 126 mn for Q4 FY16 and Rs. 580 mn for FY16 11
3,986 3,960 4,2234,936 4,667
Q4FY15 Q1FY16 Q2FY16 Q3FY16 Q4FY16
Revenue (Rs. mn)
1,583 1,841 1,867
2,127 2,065
Q4FY15 Q1FY16 Q2FY16 Q3FY16 Q4FY16
EBITDA (Rs. mn)
(Rs. mn) Q4 FY16 Q4 FY15 FY16 FY15Income from operations 4,667 3,986 17,786 16,533
Retail 2,781 2,537 11,145 10,240Residential 697 474 2,742 2,524Commercial 383 451 1,431 2,045Hospitality & Others 806 523 2,467 1,724
EBITDA 2,065 1,583 7,900 7,620EBITDA Margin (%) 44% 40% 44% 46%Profit after tax (PAT) and exceptional items 3 -527 1,001 864PAT after exceptional items and minority interest** -14.1 -539 815 354Diluted EPS -0.12 -3.71 5.41 2.45
359
256 245
395307
Q4FY15 Q1FY16 Q2FY16 Q3FY16 Q4FY16
PAT (Rs. mn)*
1.18
1.93 1.98 2.08
FY13 FY14 FY15 FY16
Debt / Equity (x)
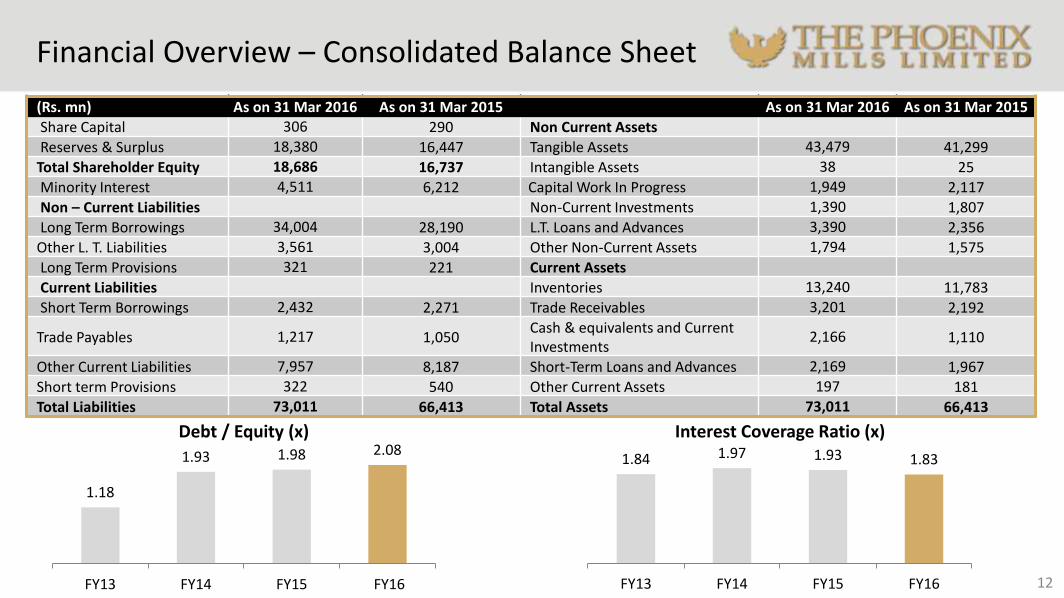
Financial Overview – Consolidated Balance Sheet
12
1.84 1.97 1.93 1.83
FY13 FY14 FY15 FY16
Interest Coverage Ratio (x)
(Rs. mn) As on 31 Mar 2016 As on 31 Mar 2015 As on 31 Mar 2016 As on 31 Mar 2015
Share Capital 306 290 Non Current Assets
Reserves & Surplus 18,380 16,447 Tangible Assets 43,479 41,299
Total Shareholder Equity 18,686 16,737 Intangible Assets 38 25
Minority Interest 4,511 6,212 Capital Work In Progress 1,949 2,117
Non – Current Liabilities Non-Current Investments 1,390 1,807
Long Term Borrowings 34,004 28,190 L.T. Loans and Advances 3,390 2,356
Other L. T. Liabilities 3,561 3,004 Other Non-Current Assets 1,794 1,575
Long Term Provisions 321 221 Current Assets
Current Liabilities Inventories 13,240 11,783
Short Term Borrowings 2,432 2,271 Trade Receivables 3,201 2,192
Trade Payables 1,217 1,050Cash & equivalents and Current Investments
2,166 1,110
Other Current Liabilities 7,957 8,187 Short-Term Loans and Advances 2,169 1,967
Short term Provisions 322 540 Other Current Assets 197 181
Total Liabilities 73,011 66,413 Total Assets 73,011 66,413
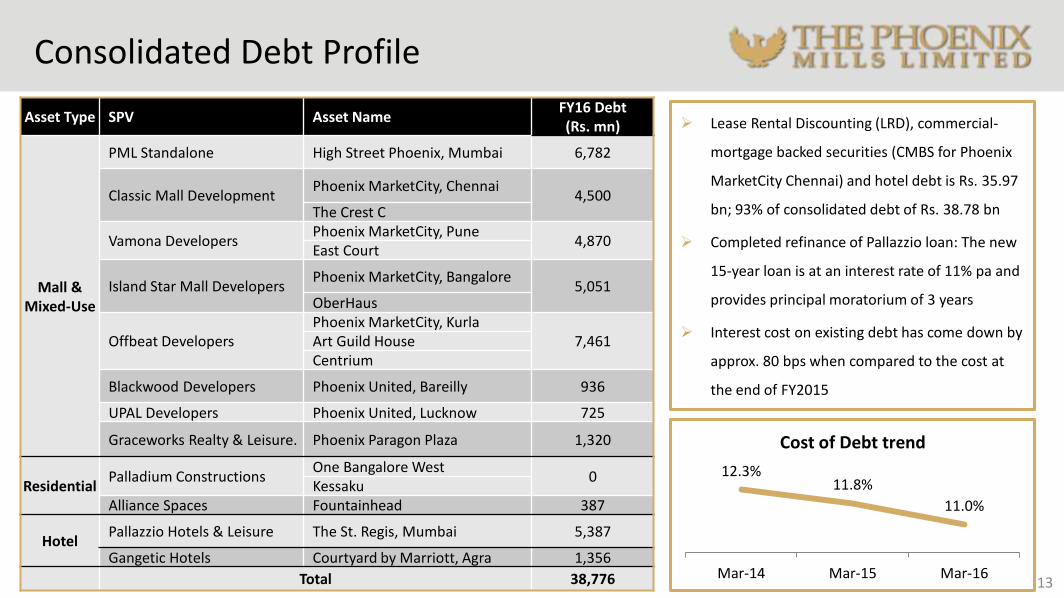
Consolidated Debt Profile
13
Asset Type SPV Asset Name FY16 Debt (Rs. mn)
Mall & Mixed-Use
PML Standalone High Street Phoenix, Mumbai 6,782
Classic Mall DevelopmentPhoenix MarketCity, Chennai
4,500The Crest C
Vamona DevelopersPhoenix MarketCity, Pune
4,870East Court
Island Star Mall DevelopersPhoenix MarketCity, Bangalore
5,051OberHaus
Offbeat DevelopersPhoenix MarketCity, Kurla
7,461Art Guild House Centrium
Blackwood Developers Phoenix United, Bareilly 936
UPAL Developers Phoenix United, Lucknow 725
Graceworks Realty & Leisure. Phoenix Paragon Plaza 1,320
ResidentialPalladium Constructions
One Bangalore West 0
Kessaku Alliance Spaces Fountainhead 387
HotelPallazzio Hotels & Leisure The St. Regis, Mumbai 5,387
Gangetic Hotels Courtyard by Marriott, Agra 1,356
Total 38,776
12.3%11.8%
11.0%
Mar-14 Mar-15 Mar-16
Cost of Debt trend
Lease Rental Discounting (LRD), commercial-
mortgage backed securities (CMBS for Phoenix
MarketCity Chennai) and hotel debt is Rs. 35.97
bn; 93% of consolidated debt of Rs. 38.78 bn
Completed refinance of Pallazzio loan: The new
15-year loan is at an interest rate of 11% pa and
provides principal moratorium of 3 years
Interest cost on existing debt has come down by
approx. 80 bps when compared to the cost at
the end of FY2015
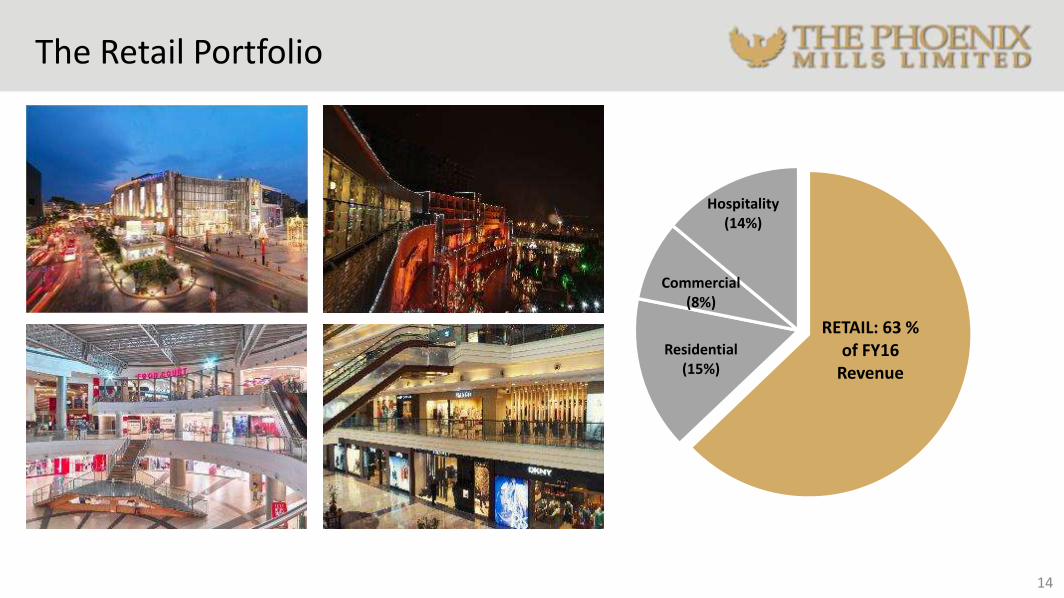
The Retail Portfolio
14
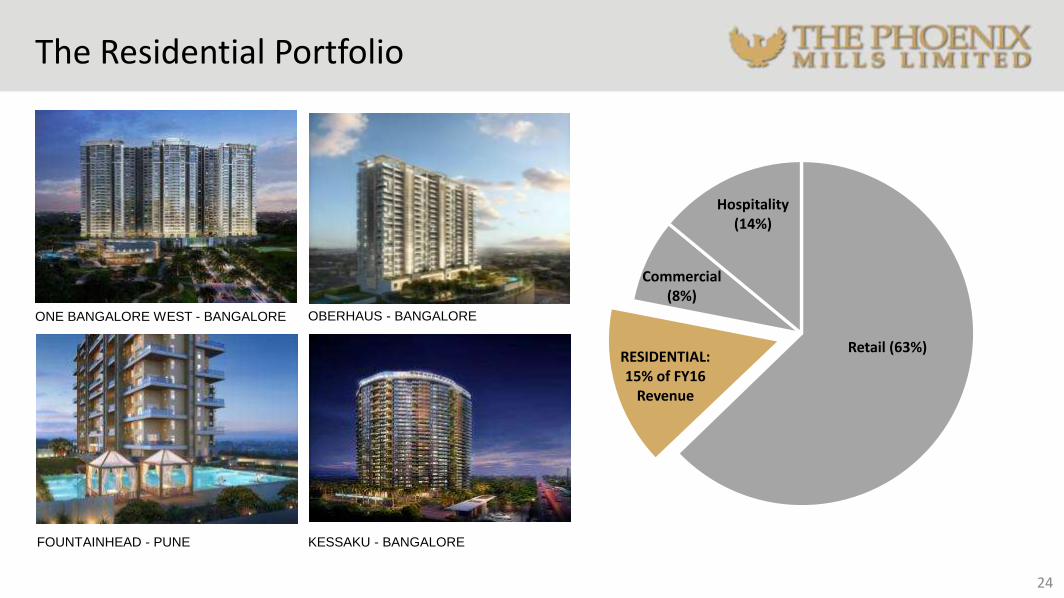
RETAIL: 63 % of FY16
Revenue
Residential (15%)
Commercial (8%)
Hospitality (14%)

Operational Update – Retail Portfolio
# Phoenix Paragon Plaza (PPP) has become partly operational from Q1 FY16. ## Expected to become operational from 2016. ** For year ended 31 March 2016 @ Trading density is computed on carpet area
15
HSP & Palladium
Phoenix MarketCity Phoenix United PhoenixParagon
PlazaPalladium##
Mumbai Bengaluru Chennai Mumbai Pune Bareilly Lucknow Mumbai Chennai
Retail Leasable/Licensable Area (msf ) 0.74 0.98 1.00 1.11 1.13 0.31 0.33 0.18# 0.22
Total No. of Stores 273 301 264 310 319 132 106 305 76
Average Rental (Rs. psf)** 289 91 109 88 87 50 58 63 NA
Occupancy %** 93% 87% 93% 87% 88% 85% 83% 24% NA
25.7
40.3
49.054.0
FY13 FY14 FY15 FY16
Consumption (Rs. bn)
4.2
5.76.5
7.1
FY13 FY14 FY15 FY16
Rental Income (Rs. bn)
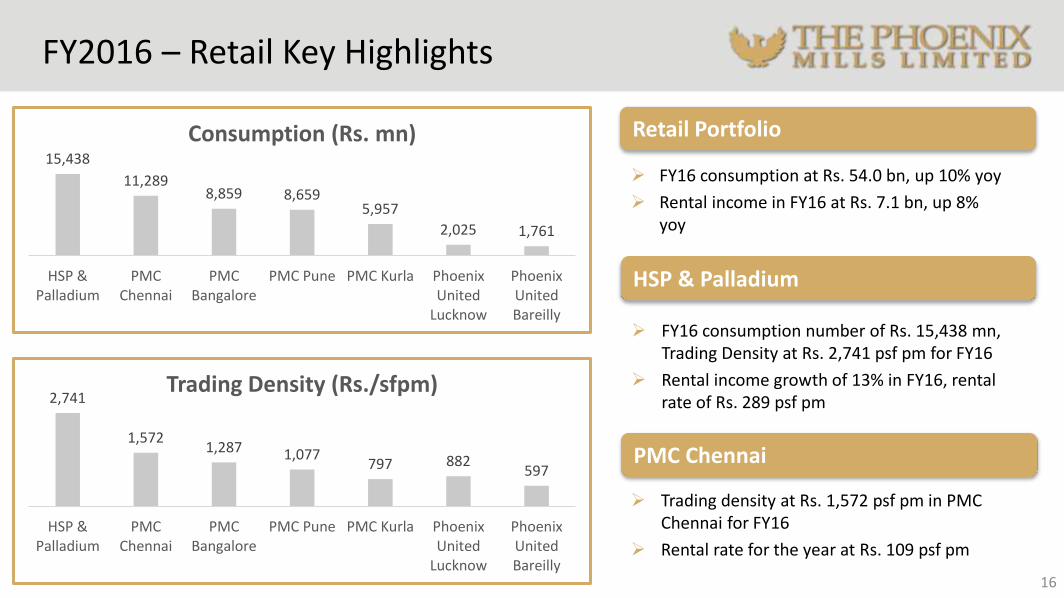
FY2016 – Retail Key Highlights
16
15,438
11,2898,859 8,659
5,957
2,025 1,761
HSP &Palladium
PMCChennai
PMCBangalore
PMC Pune PMC Kurla PhoenixUnited
Lucknow
PhoenixUnitedBareilly
Consumption (Rs. mn)
2,741
1,5721,287 1,077
797 882597
HSP &Palladium
PMCChennai
PMCBangalore
PMC Pune PMC Kurla PhoenixUnited
Lucknow
PhoenixUnitedBareilly
Trading Density (Rs./sfpm)
FY16 consumption at Rs. 54.0 bn, up 10% yoy
Rental income in FY16 at Rs. 7.1 bn, up 8% yoy
Trading density at Rs. 1,572 psf pm in PMC Chennai for FY16
Rental rate for the year at Rs. 109 psf pm
Retail Portfolio
PMC Chennai
HSP & Palladium
FY16 consumption number of Rs. 15,438 mn, Trading Density at Rs. 2,741 psf pm for FY16
Rental income growth of 13% in FY16, rental rate of Rs. 289 psf pm
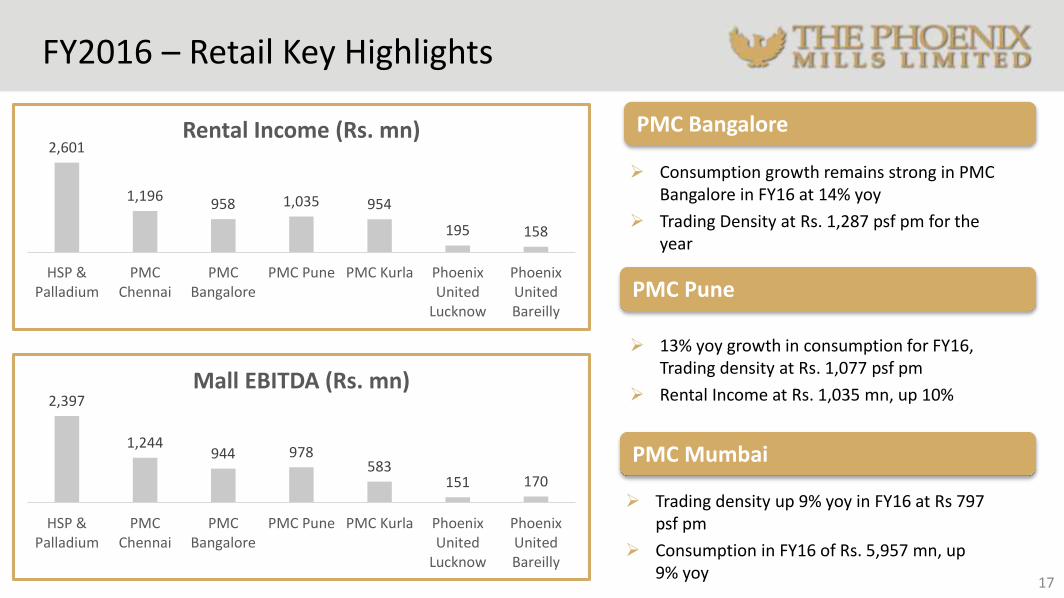
FY2016 – Retail Key Highlights
17
2,397
1,244944 978
583151 170
HSP &Palladium
PMCChennai
PMCBangalore
PMC Pune PMC Kurla PhoenixUnited
Lucknow
PhoenixUnitedBareilly
Mall EBITDA (Rs. mn)
2,601
1,196958 1,035 954
195 158
HSP &Palladium
PMCChennai
PMCBangalore
PMC Pune PMC Kurla PhoenixUnited
Lucknow
PhoenixUnitedBareilly
Rental Income (Rs. mn)
PMC Pune
PMC Mumbai
13% yoy growth in consumption for FY16,Trading density at Rs. 1,077 psf pm
Rental Income at Rs. 1,035 mn, up 10%
Trading density up 9% yoy in FY16 at Rs 797 psf pm
Consumption in FY16 of Rs. 5,957 mn, up 9% yoy
PMC Bangalore
Consumption growth remains strong in PMC Bangalore in FY16 at 14% yoy
Trading Density at Rs. 1,287 psf pm for the year
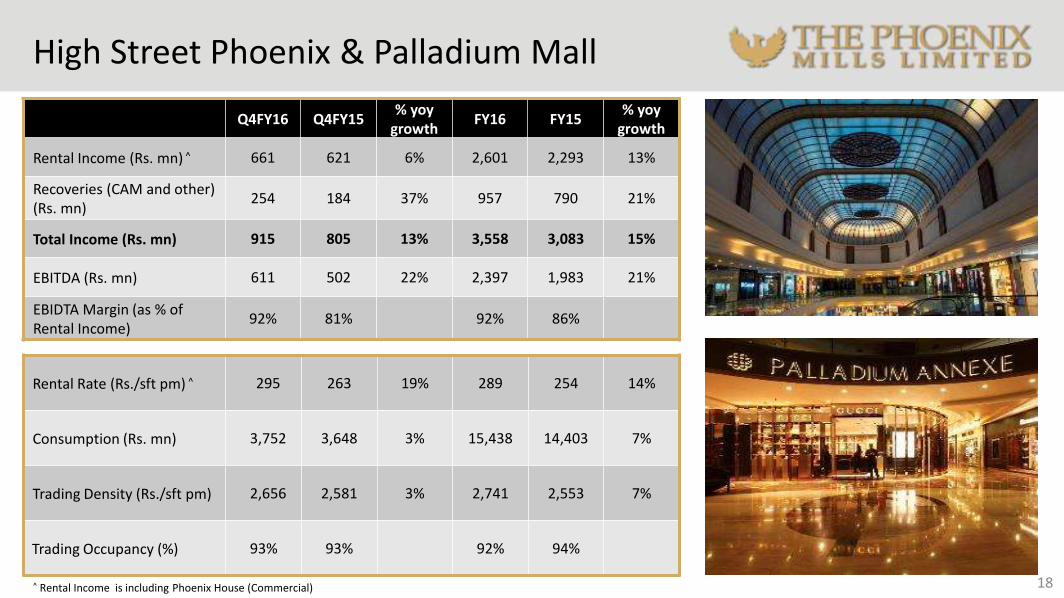
High Street Phoenix & Palladium Mall
18
Q4FY16 Q4FY15 % yoy
growthFY16 FY15
% yoy growth
Rental Income (Rs. mn) ^ 661 621 6% 2,601 2,293 13%
Recoveries (CAM and other) (Rs. mn)
254 184 37% 957 790 21%
Total Income (Rs. mn) 915 805 13% 3,558 3,083 15%
EBITDA (Rs. mn) 611 502 22% 2,397 1,983 21%
EBIDTA Margin (as % of Rental Income)
92% 81% 92% 86%
Rental Rate (Rs./sft pm) ^ 295 263 19% 289 254 14%
Consumption (Rs. mn) 3,752 3,648 3% 15,438 14,403 7%
Trading Density (Rs./sft pm) 2,656 2,581 3% 2,741 2,553 7%
Trading Occupancy (%) 93% 93% 92% 94%
^ Rental Income is including Phoenix House (Commercial)
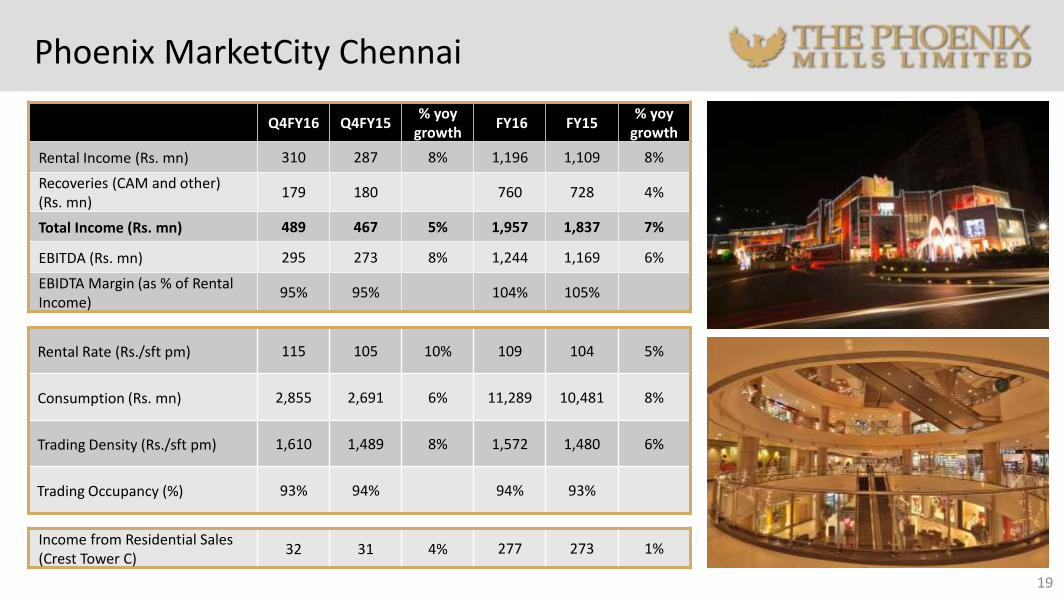
Phoenix MarketCity Chennai
19
Q4FY16 Q4FY15 % yoy
growthFY16 FY15
% yoy growth
Rental Income (Rs. mn) 310 287 8% 1,196 1,109 8%
Recoveries (CAM and other) (Rs. mn)
179 180 760 728 4%
Total Income (Rs. mn) 489 467 5% 1,957 1,837 7%
EBITDA (Rs. mn) 295 273 8% 1,244 1,169 6%
EBIDTA Margin (as % of Rental Income)
95% 95% 104% 105%
Rental Rate (Rs./sft pm) 115 105 10% 109 104 5%
Consumption (Rs. mn) 2,855 2,691 6% 11,289 10,481 8%
Trading Density (Rs./sft pm) 1,610 1,489 8% 1,572 1,480 6%
Trading Occupancy (%) 93% 94% 94% 93%
Income from Residential Sales (Crest Tower C)
32 31 4% 277 273 1%
Phoenix MarketCity Bangalore
20
Q4FY16 Q4FY15 % yoy
growthFY16 FY15
% yoy growth
Rental Income (Rs. mn) 247 223 11% 958 876 9%
Recoveries (CAM and other) (Rs. mn)
138 128 8% 555 520 7%
Total Income (Rs. mn) 384 351 9% 1,513 1,396 8%
EBITDA (Rs. mn) 242 219 10% 944 890 6%
EBIDTA Margin (as % of Rental Income)
98% 98% 99% 102%
Rental Rate (Rs./sft pm) 95 88 8% 91 87 5%
Consumption (Rs. mn) 2,162 1,912 13% 8,859 7,753 14%
Trading Density (Rs./sft pm) 1,229 1,138 8% 1,287 1,131 14%
Trading Occupancy (%) 87% 87% 87% 88%
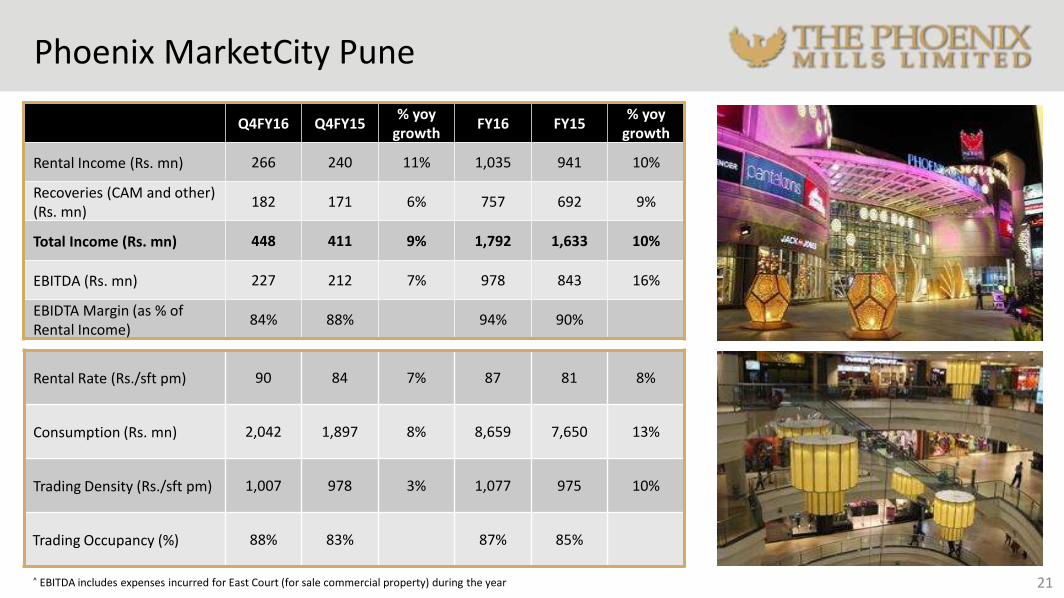
Phoenix MarketCity Pune
21
Q4FY16 Q4FY15 % yoy
growthFY16 FY15
% yoy growth
Rental Income (Rs. mn) 266 240 11% 1,035 941 10%
Recoveries (CAM and other) (Rs. mn)
182 171 6% 757 692 9%
Total Income (Rs. mn) 448 411 9% 1,792 1,633 10%
EBITDA (Rs. mn) 227 212 7% 978 843 16%
EBIDTA Margin (as % of Rental Income)
84% 88% 94% 90%
Rental Rate (Rs./sft pm) 90 84 7% 87 81 8%
Consumption (Rs. mn) 2,042 1,897 8% 8,659 7,650 13%
Trading Density (Rs./sft pm) 1,007 978 3% 1,077 975 10%
Trading Occupancy (%) 88% 83% 87% 85%
^ EBITDA includes expenses incurred for East Court (for sale commercial property) during the year
22
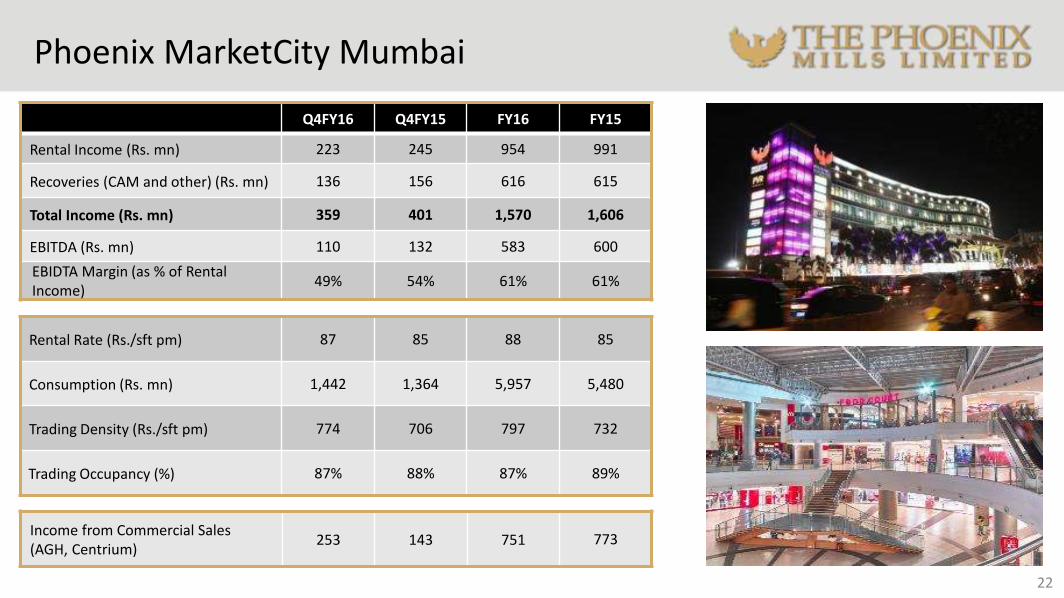
Q4FY16 Q4FY15 FY16 FY15
Rental Income (Rs. mn) 223 245 954 991
Recoveries (CAM and other) (Rs. mn) 136 156 616 615
Total Income (Rs. mn) 359 401 1,570 1,606
EBITDA (Rs. mn) 110 132 583 600
EBIDTA Margin (as % of Rental Income)
49% 54% 61% 61%
Rental Rate (Rs./sft pm) 87 85 88 85
Consumption (Rs. mn) 1,442 1,364 5,957 5,480
Trading Density (Rs./sft pm) 774 706 797 732
Trading Occupancy (%) 87% 88% 87% 89%
Income from Commercial Sales (AGH, Centrium)
253 143 751 773
Phoenix MarketCity Mumbai
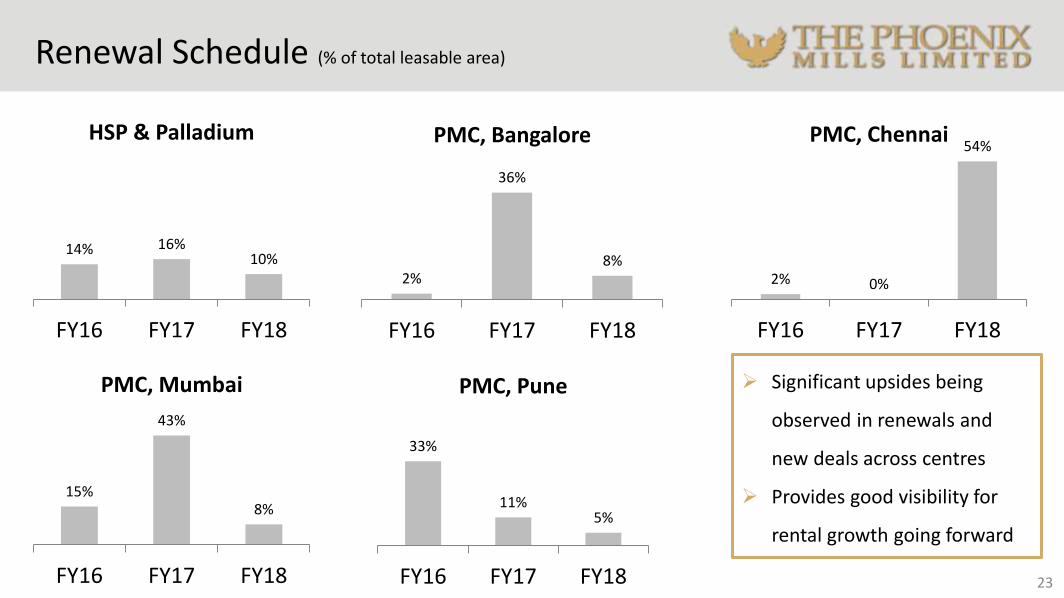
Renewal Schedule (% of total leasable area)
23
2%
36%
8%
FY16 FY17 FY18
PMC, Bangalore
15%
43%
8%
FY16 FY17 FY18
PMC, Mumbai
14% 16%10%
FY16 FY17 FY18
HSP & Palladium
33%
11%5%
FY16 FY17 FY18
PMC, Pune
2% 0%
54%
FY16 FY17 FY18
PMC, Chennai
Significant upsides being
observed in renewals and
new deals across centres
Provides good visibility for
rental growth going forward
Retail (63%)RESIDENTIAL: 15% of FY16
Revenue
Commercial (8%)
Hospitality (14%)
The Residential Portfolio
ONE BANGALORE WEST - BANGALORE
FOUNTAINHEAD - PUNE KESSAKU - BANGALORE
24
OBERHAUS - BANGALORE
Operational Update – Residential Portfolio
# Crest Tower D is expected to be launched during 2016 ## Note that of the nine towers in One Bangalore West (OWB), only Towers 1-7 have been launched as of March 2016; ### In Crest residential development, only Tower C is consolidated in our financials.
25
Project Name
Saleable area (msf)Area Sold
(msf) Sales Value
(Rs. mn) Average Selling Price
(Rs. psf)Collections
(Rs. mn)
Revenue recognized (Rs. mn)
Total Area
Area launched
Balance Area
in Q4 FY16 Cumulative
One Bangalore West, Bangalore
2.20 1.6 0.60## 1.15 10,974 9,549 8,216 665 8,268
Kessaku, Bangalore 0.99 0.57 0.42 0.24 3,509 14,924 963 - -
OberHaus, Bangalore 1.02 - 1.02 Yet to launch
Fountainhead, Pune 0.35 0.35 0 0.01 158 11,203 99 - -
The Crest#, Chennai 0.94 0.53 0.41 0.38 3,312 8,639 2,734 100### 2,978
TOTAL 5.50 3.05 2.45 1.78 17,953 10,075 12,013 765### 11,246
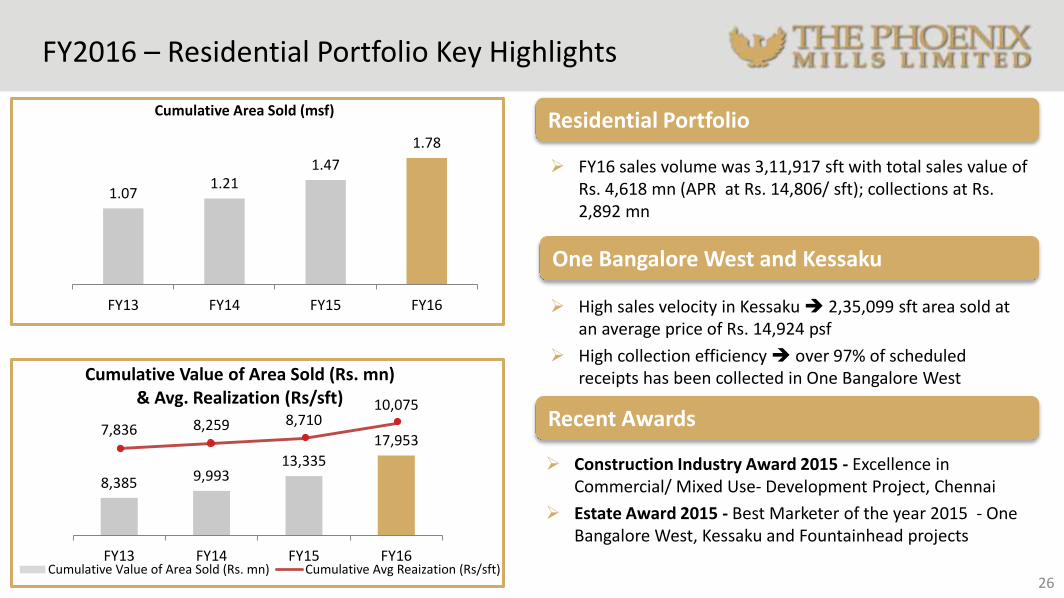
FY2016 – Residential Portfolio Key Highlights
26
FY16 sales volume was 3,11,917 sft with total sales value of Rs. 4,618 mn (APR at Rs. 14,806/ sft); collections at Rs. 2,892 mn
Residential Portfolio
One Bangalore West and Kessaku
High sales velocity in Kessaku 2,35,099 sft area sold at an average price of Rs. 14,924 psf
High collection efficiency over 97% of scheduled receipts has been collected in One Bangalore West
Construction Industry Award 2015 - Excellence in Commercial/ Mixed Use- Development Project, Chennai
Estate Award 2015 - Best Marketer of the year 2015 - One Bangalore West, Kessaku and Fountainhead projects
Recent Awards
1.071.21
1.47
1.78
FY13 FY14 FY15 FY16
Cumulative Area Sold (msf)
8,385 9,99313,335
17,9537,836 8,259 8,710
10,075
0
10,000
0
20,000
FY13 FY14 FY15 FY16
Cumulative Value of Area Sold (Rs. mn) & Avg. Realization (Rs/sft)
Cumulative Value of Area Sold (Rs. mn) Cumulative Avg Reaization (Rs/sft)
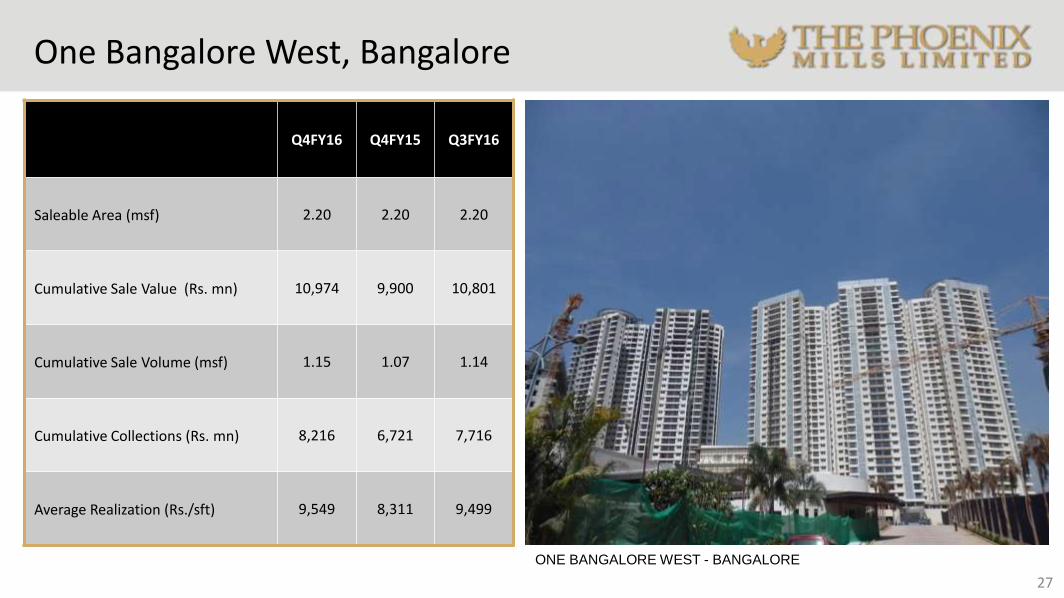
One Bangalore West, Bangalore
27
Q4FY16 Q4FY15 Q3FY16
Saleable Area (msf) 2.20 2.20 2.20
Cumulative Sale Value (Rs. mn) 10,974 9,900 10,801
Cumulative Sale Volume (msf) 1.15 1.07 1.14
Cumulative Collections (Rs. mn) 8,216 6,721 7,716
Average Realization (Rs./sft) 9,549 8,311 9,499
ONE BANGALORE WEST - BANGALORE
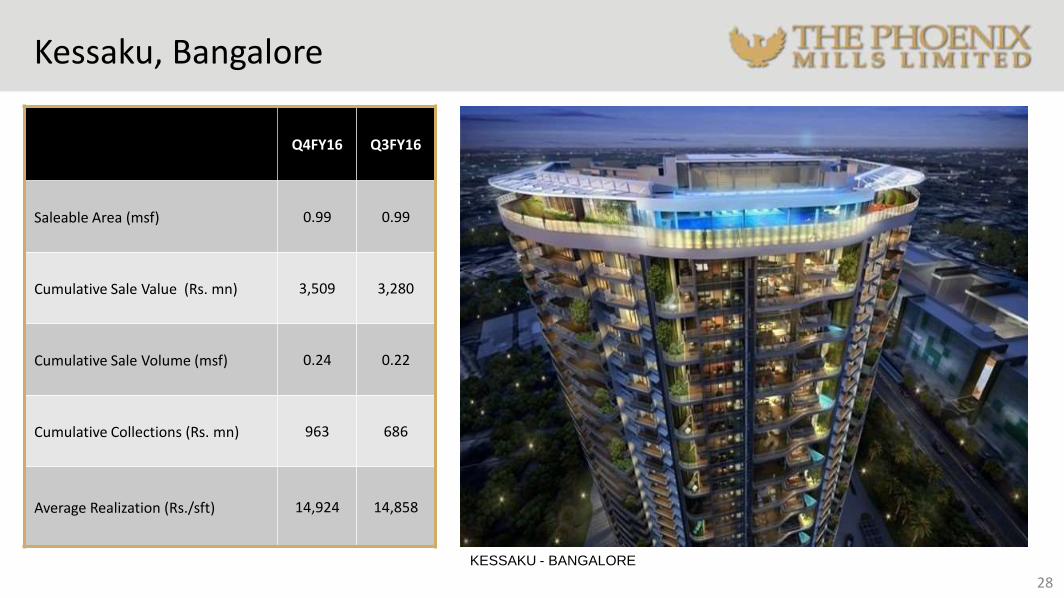
Kessaku, Bangalore
28
KESSAKU - BANGALORE
Q4FY16 Q3FY16
Saleable Area (msf) 0.99 0.99
Cumulative Sale Value (Rs. mn) 3,509 3,280
Cumulative Sale Volume (msf) 0.24 0.22
Cumulative Collections (Rs. mn) 963 686
Average Realization (Rs./sft) 14,924 14,858
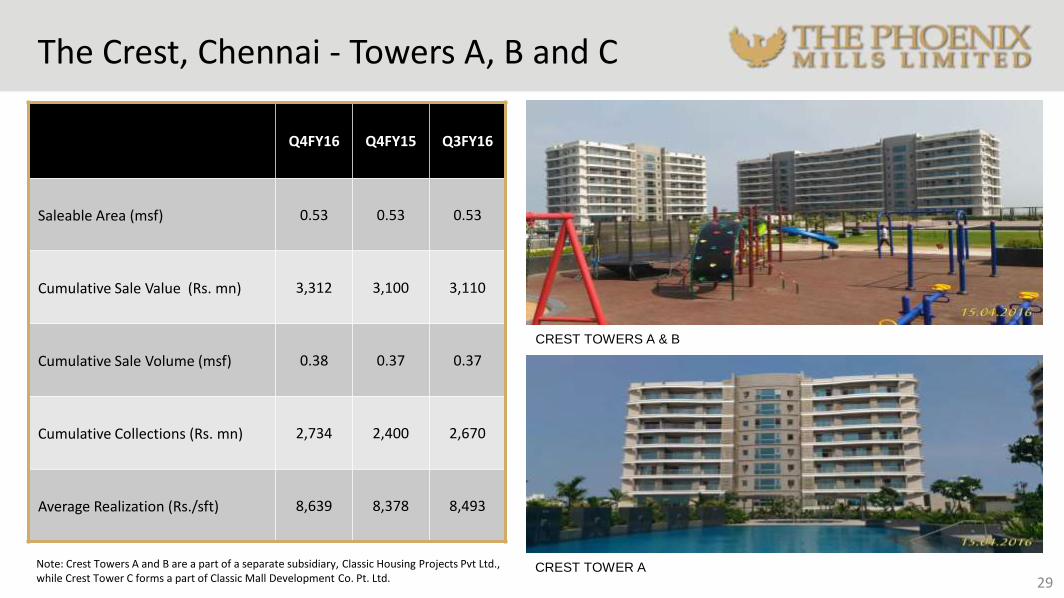
The Crest, Chennai - Towers A, B and C
Note: Crest Towers A and B are a part of a separate subsidiary, Classic Housing Projects Pvt Ltd., while Crest Tower C forms a part of Classic Mall Development Co. Pt. Ltd.
CREST TOWERS A & B
CREST TOWER A
29
Q4FY16 Q4FY15 Q3FY16
Saleable Area (msf) 0.53 0.53 0.53
Cumulative Sale Value (Rs. mn) 3,312 3,100 3,110
Cumulative Sale Volume (msf) 0.38 0.37 0.37
Cumulative Collections (Rs. mn) 2,734 2,400 2,670
Average Realization (Rs./sft) 8,639 8,378 8,493
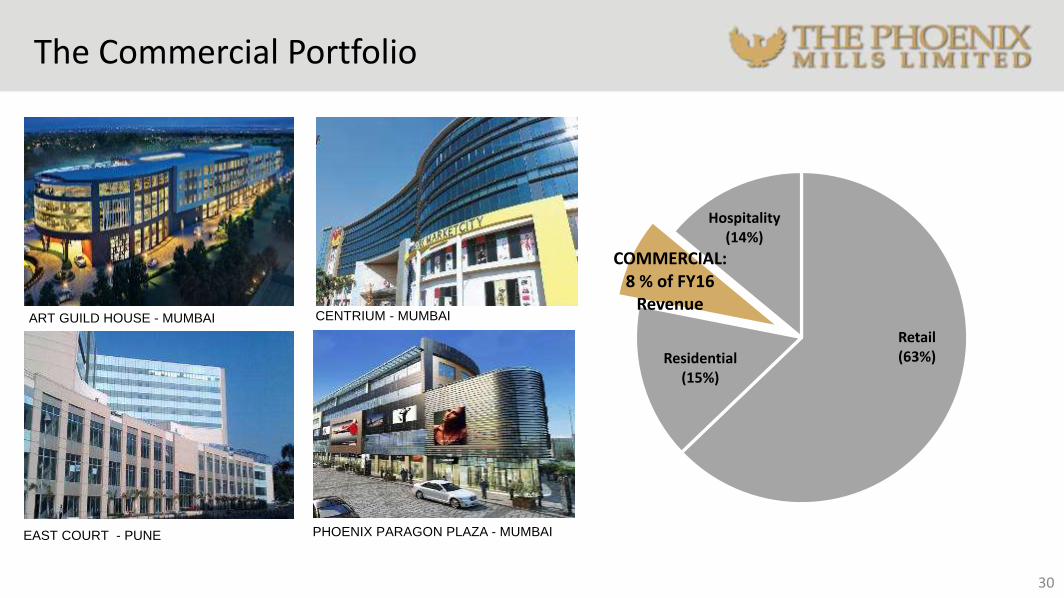
The Commercial Portfolio
ART GUILD HOUSE - MUMBAI
EAST COURT - PUNE
CENTRIUM - MUMBAI
PHOENIX PARAGON PLAZA - MUMBAI
30
Retail (63%)Residential
(15%)
COMMERCIAL: 8 % of FY16
Revenue
Hospitality (14%)
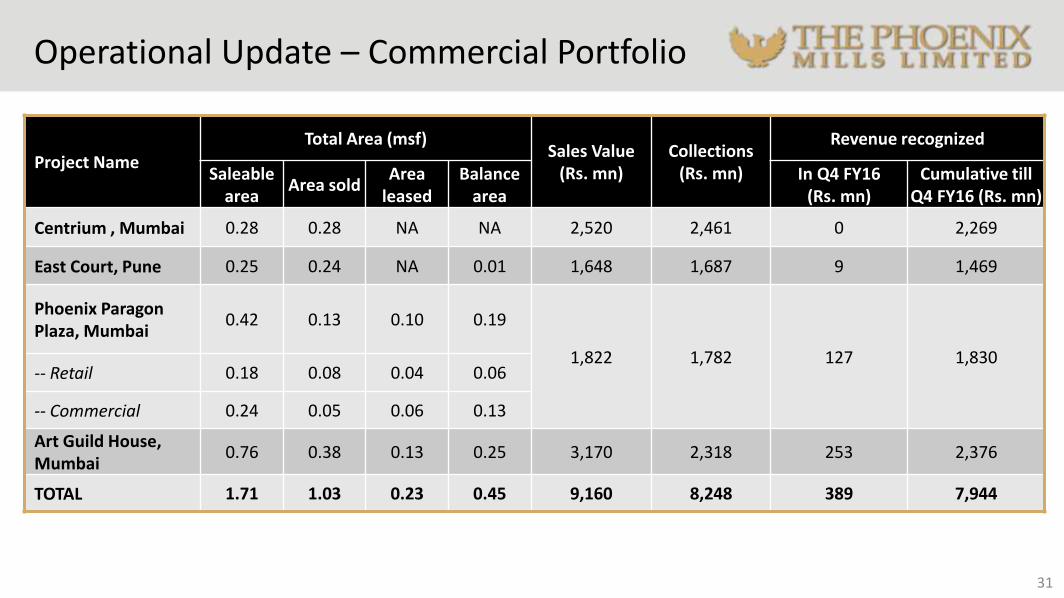
Operational Update – Commercial Portfolio
31
Project Name
Total Area (msf) Sales Value
(Rs. mn) Collections
(Rs. mn)
Revenue recognized
Saleable area
Area sold Area
leased Balance
area In Q4 FY16
(Rs. mn) Cumulative till
Q4 FY16 (Rs. mn)
Centrium , Mumbai 0.28 0.28 NA NA 2,520 2,461 0 2,269
East Court, Pune 0.25 0.24 NA 0.01 1,648 1,687 9 1,469
Phoenix Paragon Plaza, Mumbai
0.42 0.13 0.10 0.19
1,822 1,782 127 1,830-- Retail 0.18 0.08 0.04 0.06
-- Commercial 0.24 0.05 0.06 0.13
Art Guild House, Mumbai
0.76 0.38 0.13 0.25 3,170 2,318 253 2,376
TOTAL 1.71 1.03 0.23 0.45 9,160 8,248 389 7,944
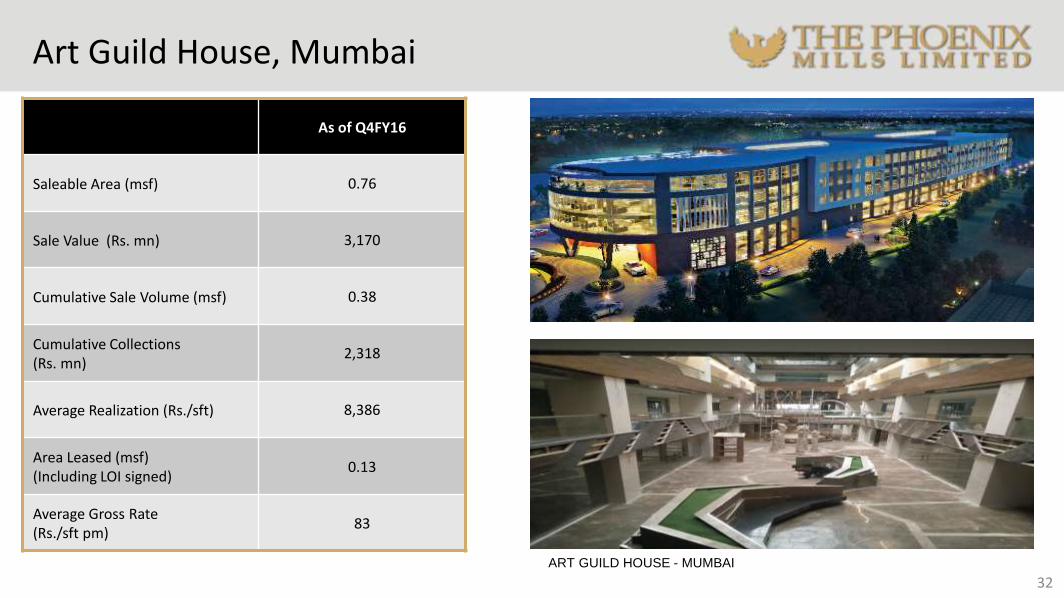
Art Guild House, Mumbai
ART GUILD HOUSE - MUMBAI
32
As of Q4FY16
Saleable Area (msf) 0.76
Sale Value (Rs. mn) 3,170
Cumulative Sale Volume (msf) 0.38
Cumulative Collections (Rs. mn)
2,318
Average Realization (Rs./sft) 8,386
Area Leased (msf) (Including LOI signed)
0.13
Average Gross Rate (Rs./sft pm)
83
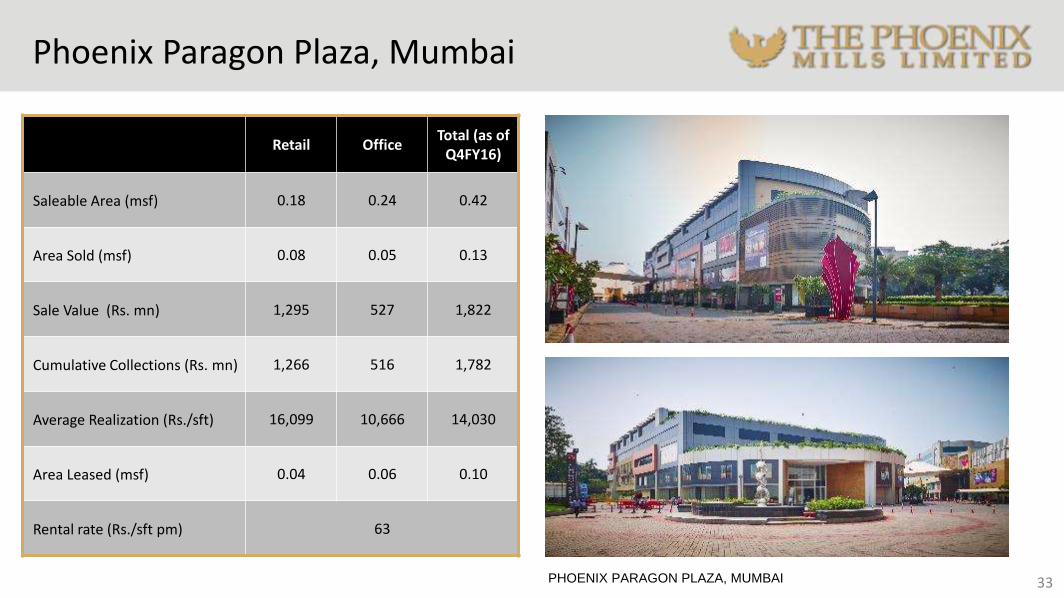
Phoenix Paragon Plaza, Mumbai
PHOENIX PARAGON PLAZA, MUMBAI 33
Retail OfficeTotal (as of
Q4FY16)
Saleable Area (msf) 0.18 0.24 0.42
Area Sold (msf) 0.08 0.05 0.13
Sale Value (Rs. mn) 1,295 527 1,822
Cumulative Collections (Rs. mn) 1,266 516 1,782
Average Realization (Rs./sft) 16,099 10,666 14,030
Area Leased (msf) 0.04 0.06 0.10
Rental rate (Rs./sft pm) 63
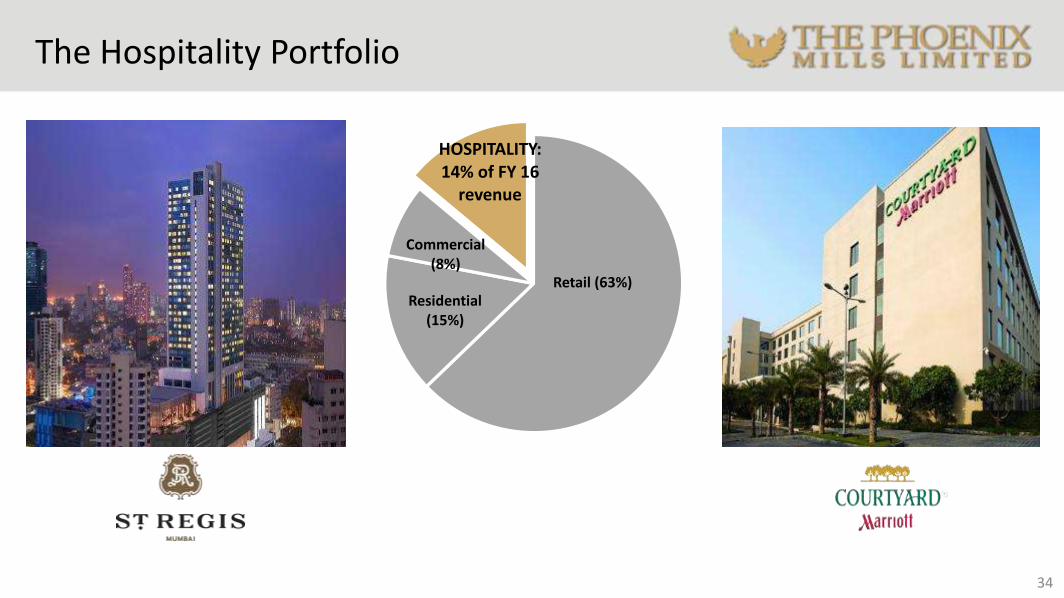
The Hospitality Portfolio
34
5% of total
Revenue in FY15
Retail (63%)Residential
(15%)
Commercial (8%)
HOSPITALITY: 14% of FY 16
revenue
Operational Update – Hospitality
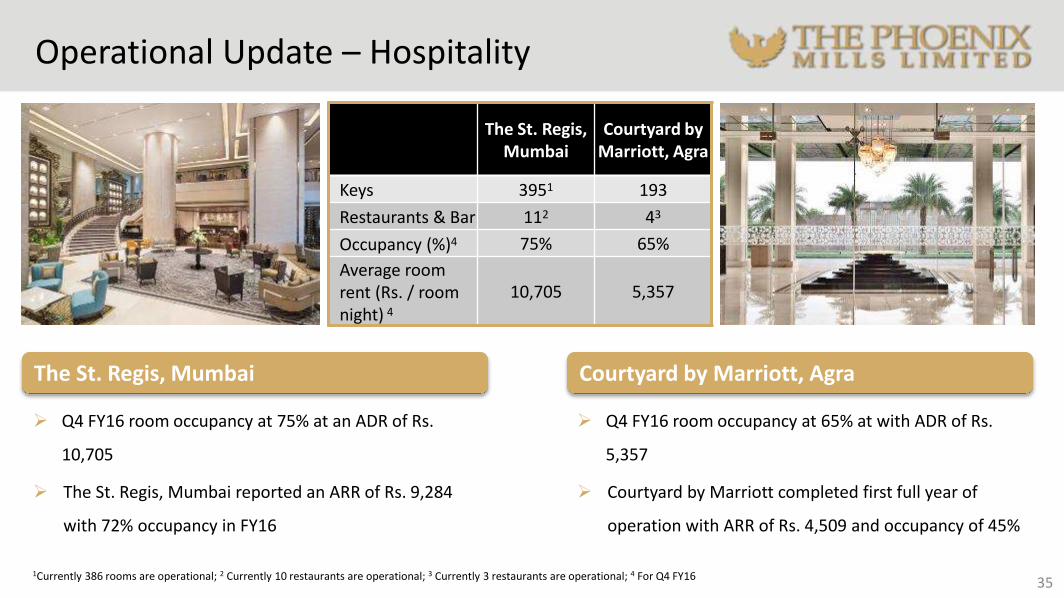
1Currently 386 rooms are operational; 2 Currently 10 restaurants are operational; 3 Currently 3 restaurants are operational; 4 For Q4 FY16 35
The St. Regis, Mumbai
Courtyard by Marriott, Agra
Keys 3951 193
Restaurants & Bar 112 43
Occupancy (%)4 75% 65%
Average room rent (Rs. / room night) 4
10,705 5,357
The St. Regis, Mumbai
Q4 FY16 room occupancy at 75% at an ADR of Rs.
10,705
The St. Regis, Mumbai reported an ARR of Rs. 9,284
with 72% occupancy in FY16
Courtyard by Marriott, Agra
Q4 FY16 room occupancy at 65% at with ADR of Rs.
5,357
Courtyard by Marriott completed first full year of
operation with ARR of Rs. 4,509 and occupancy of 45%
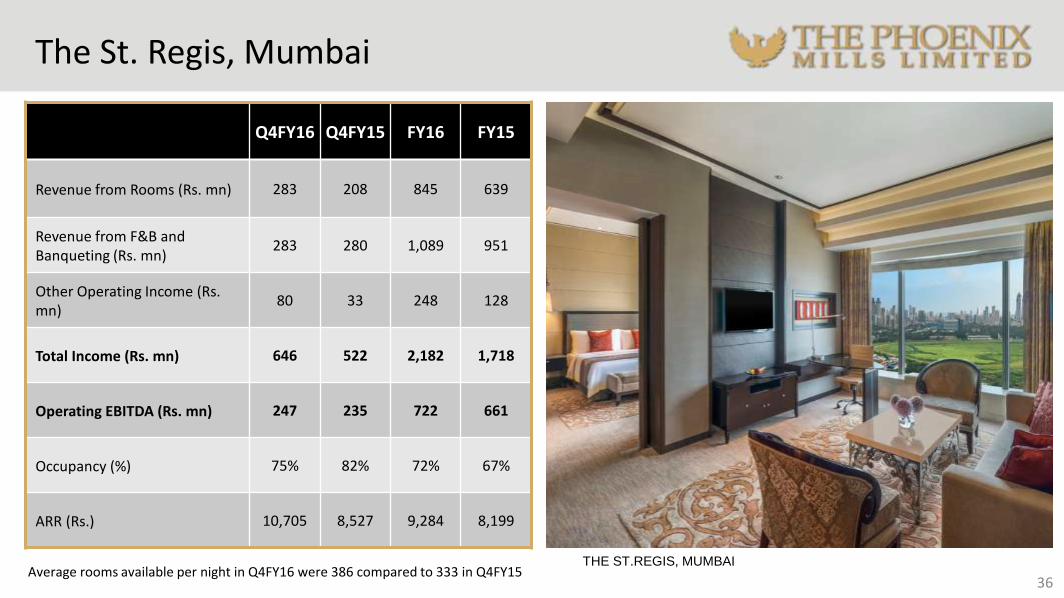
The St. Regis, Mumbai
36
THE ST.REGIS, MUMBAI
Q4FY16 Q4FY15 FY16 FY15
Revenue from Rooms (Rs. mn) 283 208 845 639
Revenue from F&B and Banqueting (Rs. mn)
283 280 1,089 951
Other Operating Income (Rs. mn)
80 33 248 128
Total Income (Rs. mn) 646 522 2,182 1,718
Operating EBITDA (Rs. mn) 247 235 722 661
Occupancy (%) 75% 82% 72% 67%
ARR (Rs.) 10,705 8,527 9,284 8,199
Average rooms available per night in Q4FY16 were 386 compared to 333 in Q4FY15
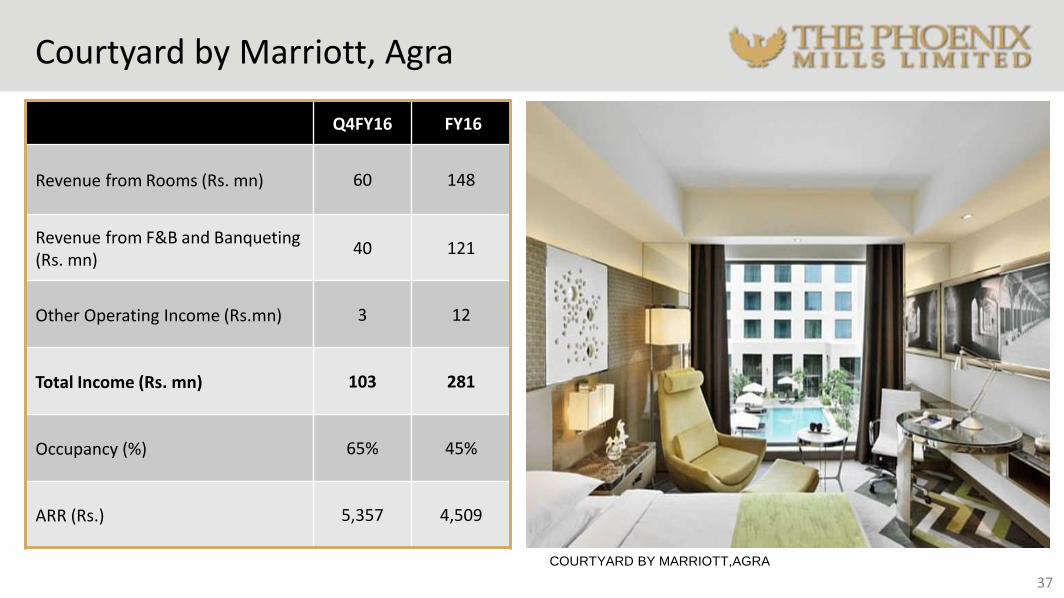
Courtyard by Marriott, Agra
37
COURTYARD BY MARRIOTT,AGRA
Q4FY16 FY16
Revenue from Rooms (Rs. mn) 60 148
Revenue from F&B and Banqueting (Rs. mn)
40 121
Other Operating Income (Rs.mn) 3 12
Total Income (Rs. mn) 103 281
Occupancy (%) 65% 45%
ARR (Rs.) 5,357 4,509
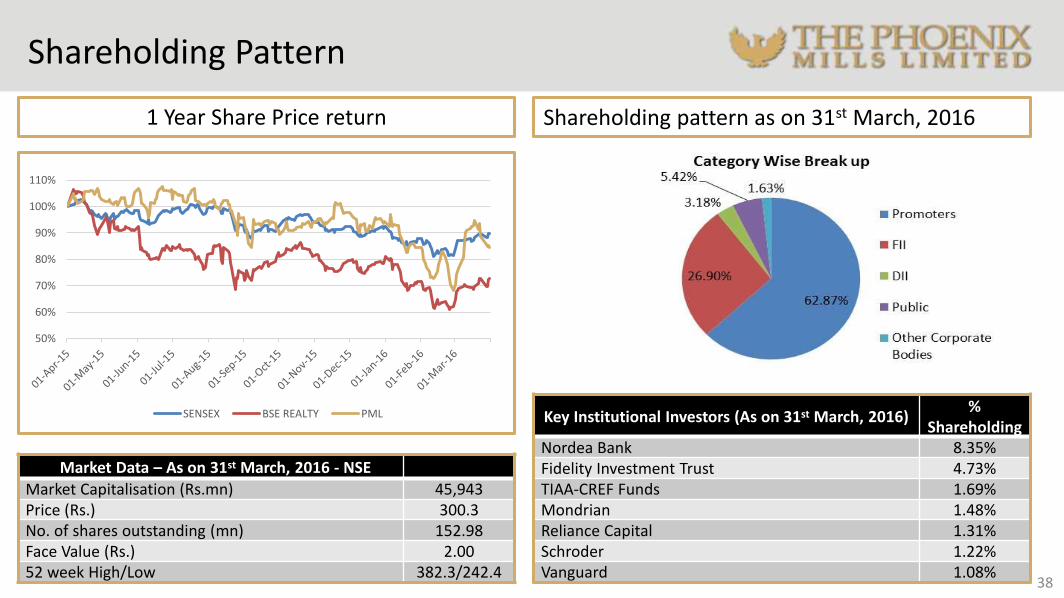
Shareholding Pattern
Key Institutional Investors (As on 31st March, 2016)%
ShareholdingNordea Bank 8.35%Fidelity Investment Trust 4.73%TIAA-CREF Funds 1.69%Mondrian 1.48%Reliance Capital 1.31%Schroder 1.22%Vanguard 1.08%
Shareholding pattern as on 31st March, 2016
38
50%
60%
70%
80%
90%
100%
110%
SENSEX BSE REALTY PML
1 Year Share Price return
Market Data – As on 31st March, 2016 - NSE
Market Capitalisation (Rs.mn) 45,943Price (Rs.) 300.3No. of shares outstanding (mn) 152.98Face Value (Rs.) 2.0052 week High/Low 382.3/242.4
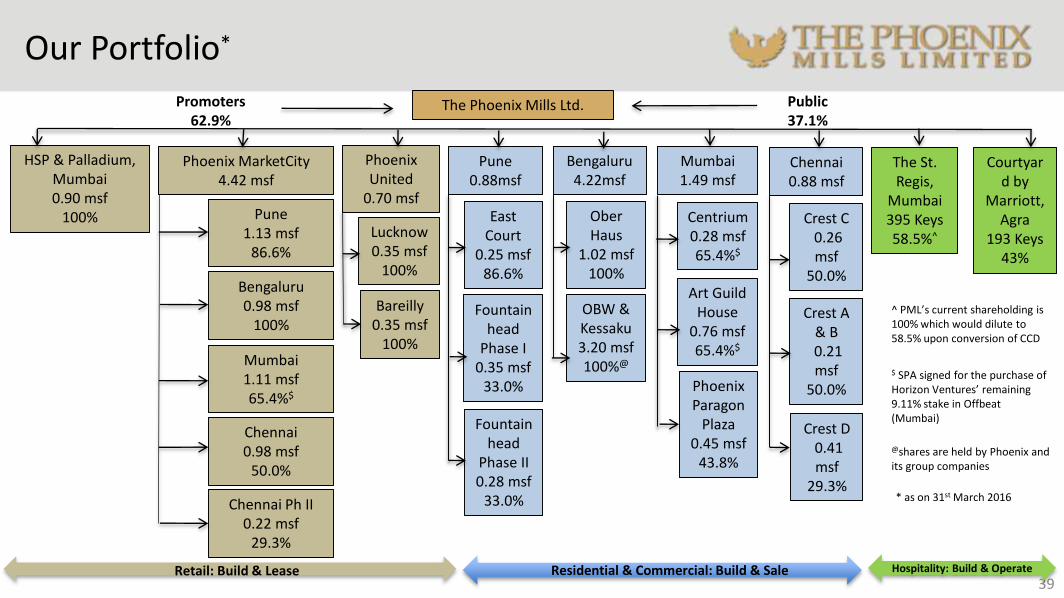
Our Portfolio*
39
The Phoenix Mills Ltd.Promoters62.9%
Public37.1%
HSP & Palladium, Mumbai0.90 msf
100%
Phoenix MarketCity4.42 msf
Pune 1.13 msf
86.6%
Bengaluru0.98 msf
100%
Mumbai1.11 msf65.4%$
Chennai 0.98 msf
50.0%
Chennai Ph II0.22 msf
29.3%
Phoenix United
0.70 msf
Lucknow0.35 msf
100%
Bareilly0.35 msf
100%
Pune0.88msf
East Court
0.25 msf86.6%
Fountainhead
Phase I0.35 msf
33.0%
Fountainhead
Phase II0.28 msf
33.0%
Bengaluru4.22msf
OberHaus
1.02 msf100%
OBW & Kessaku3.20 msf100%@
Mumbai1.49 msf
Centrium0.28 msf65.4%$
Art Guild House
0.76 msf65.4%$
Phoenix Paragon
Plaza0.45 msf
43.8%
Chennai0.88 msf
Crest C0.26 msf
50.0%
Crest A & B0.21 msf
50.0%
Crest D0.41 msf
29.3%
The St. Regis,
Mumbai395 Keys58.5%^
Courtyard by
Marriott, Agra
193 Keys43%
Retail: Build & Lease Residential & Commercial: Build & Sale Hospitality: Build & Operate
^ PML’s current shareholding is 100% which would dilute to 58.5% upon conversion of CCD
$ SPA signed for the purchase of Horizon Ventures’ remaining 9.11% stake in Offbeat (Mumbai)
* as on 31st March 2016
@shares are held by Phoenix and its group companies
Annexure
Commercial Portfolio
Hotels & Restaurants Portfolio
40
Residential Portfolio
Retail Portfolio
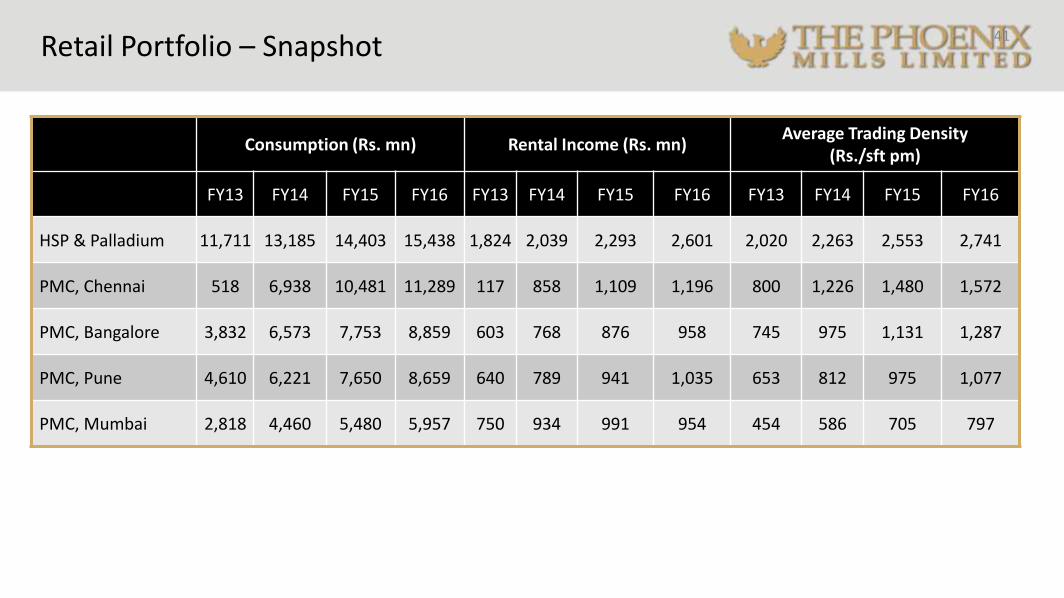
Retail Portfolio – Snapshot 41
Consumption (Rs. mn) Rental Income (Rs. mn)Average Trading Density
(Rs./sft pm)
FY13 FY14 FY15 FY16 FY13 FY14 FY15 FY16 FY13 FY14 FY15 FY16
HSP & Palladium 11,711 13,185 14,403 15,438 1,824 2,039 2,293 2,601 2,020 2,263 2,553 2,741
PMC, Chennai 518 6,938 10,481 11,289 117 858 1,109 1,196 800 1,226 1,480 1,572
PMC, Bangalore 3,832 6,573 7,753 8,859 603 768 876 958 745 975 1,131 1,287
PMC, Pune 4,610 6,221 7,650 8,659 640 789 941 1,035 653 812 975 1,077
PMC, Mumbai 2,818 4,460 5,480 5,957 750 934 991 954 454 586 705 797
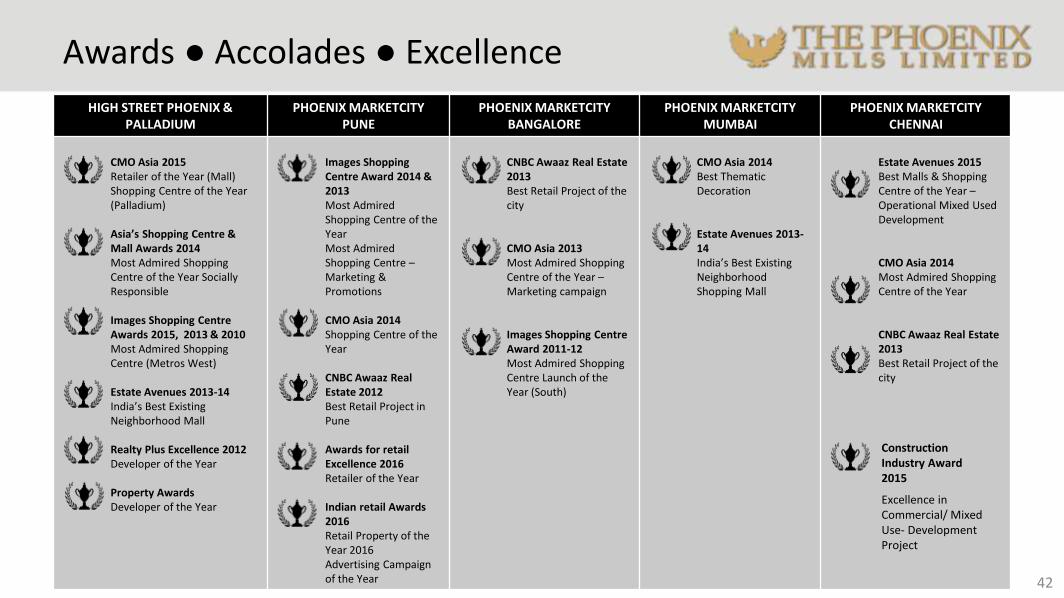
Awards ● Accolades ● Excellence
42
HIGH STREET PHOENIX & PALLADIUM
PHOENIX MARKETCITY PUNE
PHOENIX MARKETCITY BANGALORE
PHOENIX MARKETCITY MUMBAI
PHOENIX MARKETCITY CHENNAI
CMO Asia 2015Retailer of the Year (Mall)Shopping Centre of the Year (Palladium)
Asia’s Shopping Centre & Mall Awards 2014Most Admired Shopping Centre of the Year Socially Responsible
Images Shopping Centre Awards 2015, 2013 & 2010Most Admired Shopping Centre (Metros West)
Estate Avenues 2013-14India’s Best Existing Neighborhood Mall
Realty Plus Excellence 2012Developer of the Year
Property AwardsDeveloper of the Year
Images Shopping Centre Award 2014 & 2013Most Admired Shopping Centre of the YearMost Admired Shopping Centre –Marketing & Promotions
CMO Asia 2014Shopping Centre of the Year
CNBC Awaaz Real Estate 2012Best Retail Project in Pune
Awards for retail Excellence 2016Retailer of the Year
Indian retail Awards 2016Retail Property of the Year 2016Advertising Campaign of the Year
CNBC Awaaz Real Estate 2013Best Retail Project of the city
CMO Asia 2013Most Admired Shopping Centre of the Year –Marketing campaign
Images Shopping Centre Award 2011-12Most Admired Shopping Centre Launch of the Year (South)
CMO Asia 2014Best Thematic Decoration
Estate Avenues 2013-14India’s Best Existing Neighborhood Shopping Mall
Estate Avenues 2015Best Malls & Shopping Centre of the Year –Operational Mixed Used Development
CMO Asia 2014Most Admired Shopping Centre of the Year
CNBC Awaaz Real Estate 2013Best Retail Project of the city
Excellence in Commercial/ Mixed Use- Development Project
Construction Industry Award 2015
43
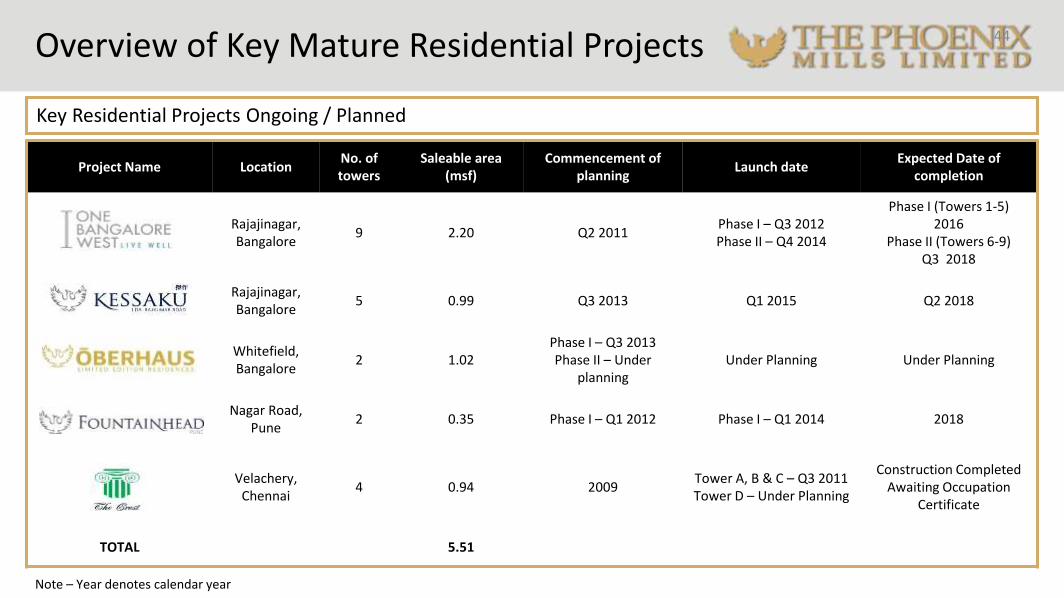
Project Name LocationNo. of towers
Saleable area (msf)
Commencement of planning
Launch dateExpected Date of
completion
Rajajinagar,Bangalore
9 2.20 Q2 2011Phase I – Q3 2012Phase II – Q4 2014
Phase I (Towers 1-5)2016
Phase II (Towers 6-9)Q3 2018
Rajajinagar,Bangalore
5 0.99 Q3 2013 Q1 2015 Q2 2018
Whitefield,Bangalore
2 1.02Phase I – Q3 2013Phase II – Under
planningUnder Planning Under Planning
Nagar Road, Pune
2 0.35 Phase I – Q1 2012 Phase I – Q1 2014 2018
Velachery, Chennai
4 0.94 2009Tower A, B & C – Q3 2011Tower D – Under Planning
Construction Completed Awaiting Occupation
Certificate
TOTAL 5.51
Overview of Key Mature Residential Projects
Key Residential Projects Ongoing / Planned
44
Note – Year denotes calendar year
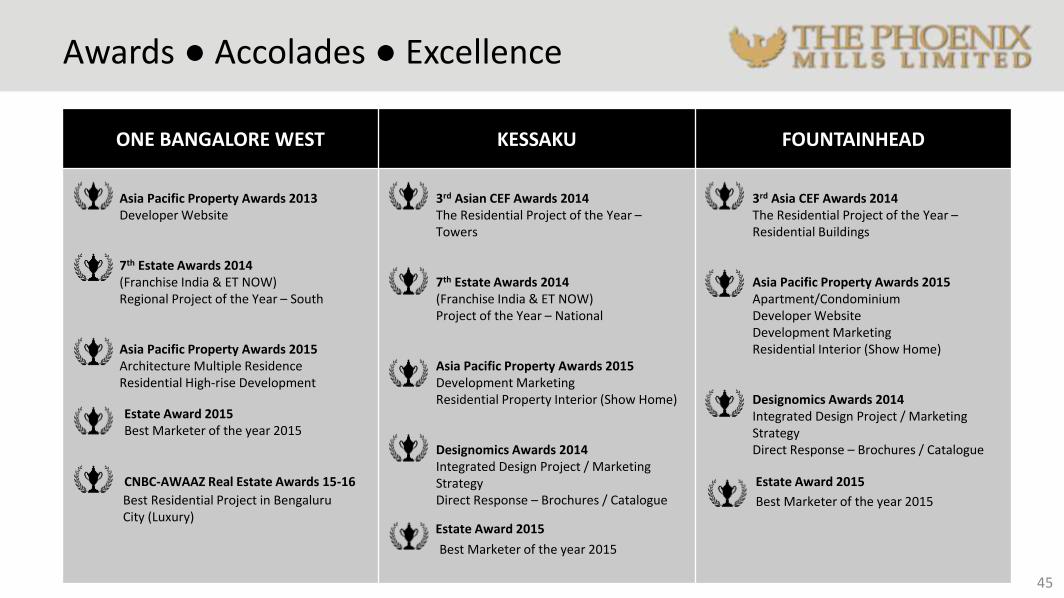
Awards ● Accolades ● Excellence
45
ONE BANGALORE WEST KESSAKU FOUNTAINHEAD
Asia Pacific Property Awards 2013Developer Website
7th Estate Awards 2014(Franchise India & ET NOW)Regional Project of the Year – South
Asia Pacific Property Awards 2015Architecture Multiple ResidenceResidential High-rise Development
3rd Asian CEF Awards 2014The Residential Project of the Year –Towers
7th Estate Awards 2014(Franchise India & ET NOW)Project of the Year – National
Asia Pacific Property Awards 2015Development MarketingResidential Property Interior (Show Home)
Designomics Awards 2014Integrated Design Project / Marketing StrategyDirect Response – Brochures / Catalogue
3rd Asia CEF Awards 2014The Residential Project of the Year –Residential Buildings
Asia Pacific Property Awards 2015Apartment/CondominiumDeveloper WebsiteDevelopment MarketingResidential Interior (Show Home)
Designomics Awards 2014Integrated Design Project / Marketing StrategyDirect Response – Brochures / Catalogue
Estate Award 2015
Best Marketer of the year 2015
Best Marketer of the year 2015
Estate Award 2015
Estate Award 2015Best Marketer of the year 2015
CNBC-AWAAZ Real Estate Awards 15-16
Best Residential Project in Bengaluru City (Luxury)

46
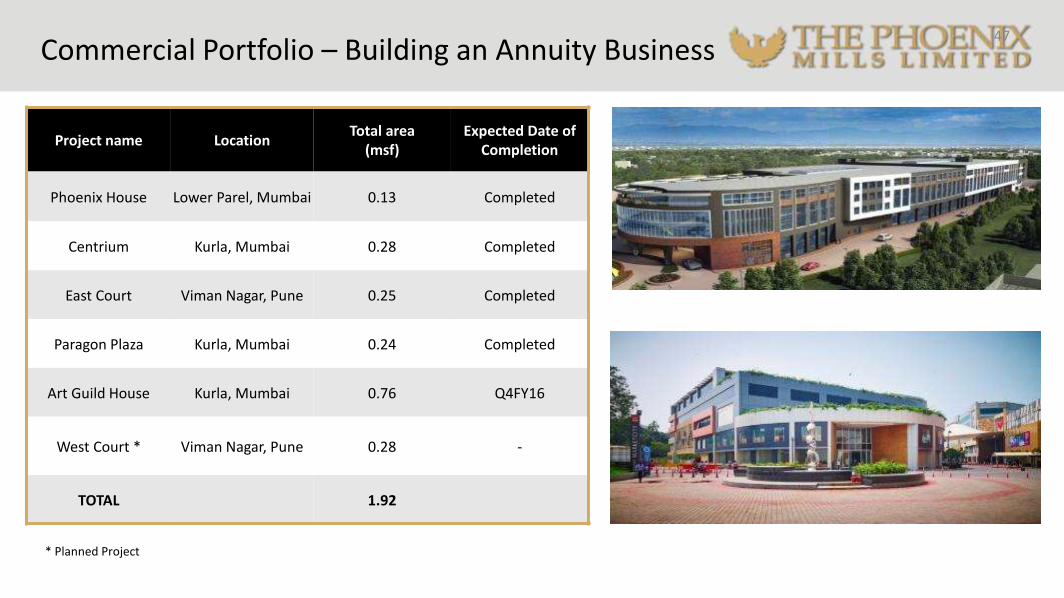
Project name Location Total area
(msf) Expected Date of
Completion
Phoenix House Lower Parel, Mumbai 0.13 Completed
Centrium Kurla, Mumbai 0.28 Completed
East Court Viman Nagar, Pune 0.25 Completed
Paragon Plaza Kurla, Mumbai 0.24 Completed
Art Guild House Kurla, Mumbai 0.76 Q4FY16
West Court * Viman Nagar, Pune 0.28 -
TOTAL 1.92
Commercial Portfolio – Building an Annuity Business
* Planned Project
47

48
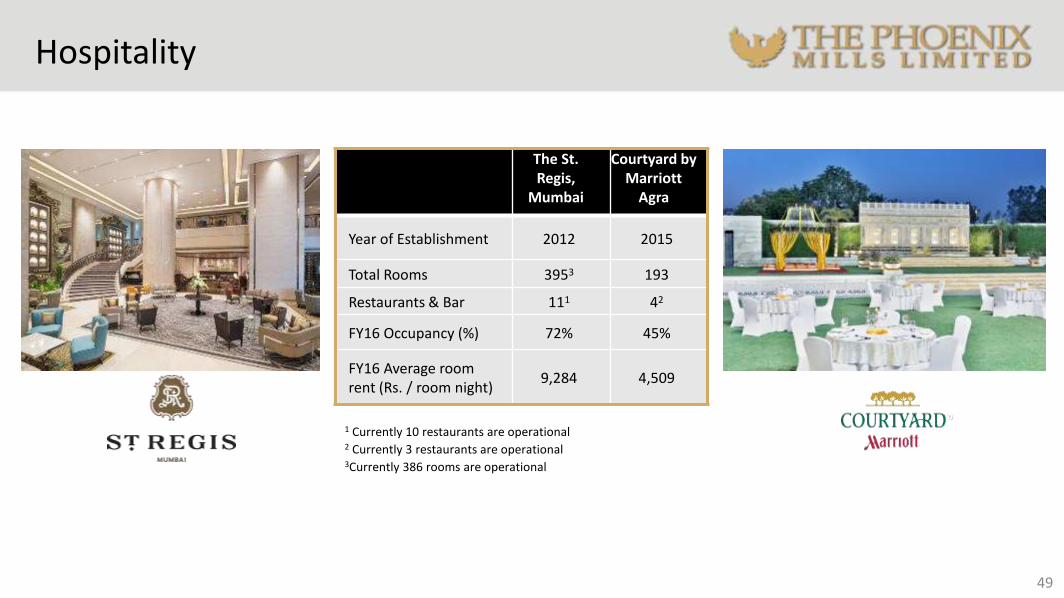
Hospitality
49
The St. Regis,
Mumbai
Courtyard by Marriott
Agra
Year of Establishment 2012 2015
Total Rooms 3953 193
Restaurants & Bar 111 42
FY16 Occupancy (%) 72% 45%
FY16 Average room rent (Rs. / room night)
9,284 4,509
1 Currently 10 restaurants are operational2 Currently 3 restaurants are operational3Currently 386 rooms are operational
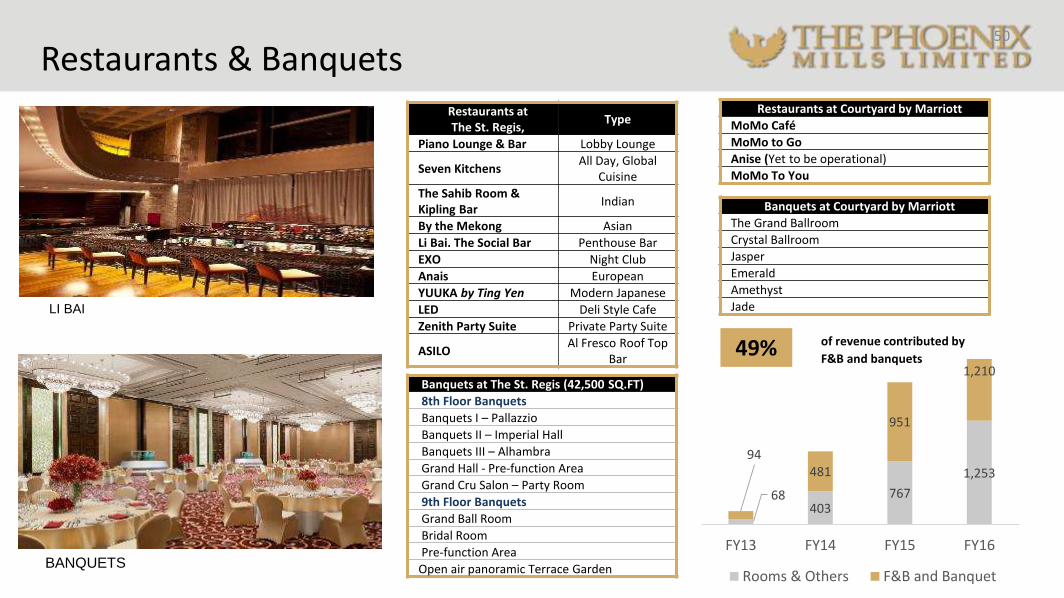
Restaurants & Banquets
LI BAI
Restaurants atThe St. Regis,
Type
Piano Lounge & Bar Lobby Lounge
Seven KitchensAll Day, Global
Cuisine
The Sahib Room & Kipling Bar
Indian
By the Mekong Asian
Li Bai. The Social Bar Penthouse Bar
EXO Night Club
Anais European
YUUKA by Ting Yen Modern Japanese
LED Deli Style Cafe
Zenith Party Suite Private Party Suite
ASILOAl Fresco Roof Top
Bar
50
Banquets at The St. Regis (42,500 SQ.FT)
8th Floor Banquets
Banquets I – Pallazzio
Banquets II – Imperial Hall
Banquets III – Alhambra
Grand Hall - Pre-function Area
Grand Cru Salon – Party Room
9th Floor Banquets
Grand Ball Room
Bridal Room
Pre-function Area
Open air panoramic Terrace GardenBANQUETS
of revenue contributed by
F&B and banquets
68403
767
1,253
94481
951
1,210
FY13 FY14 FY15 FY16
Rooms & Others F&B and Banquet
Restaurants at Courtyard by Marriott
MoMo Café
MoMo to Go
Anise (Yet to be operational)
MoMo To You
49%
Banquets at Courtyard by Marriott
The Grand Ballroom
Crystal Ballroom
Jasper
Emerald
Amethyst
Jade
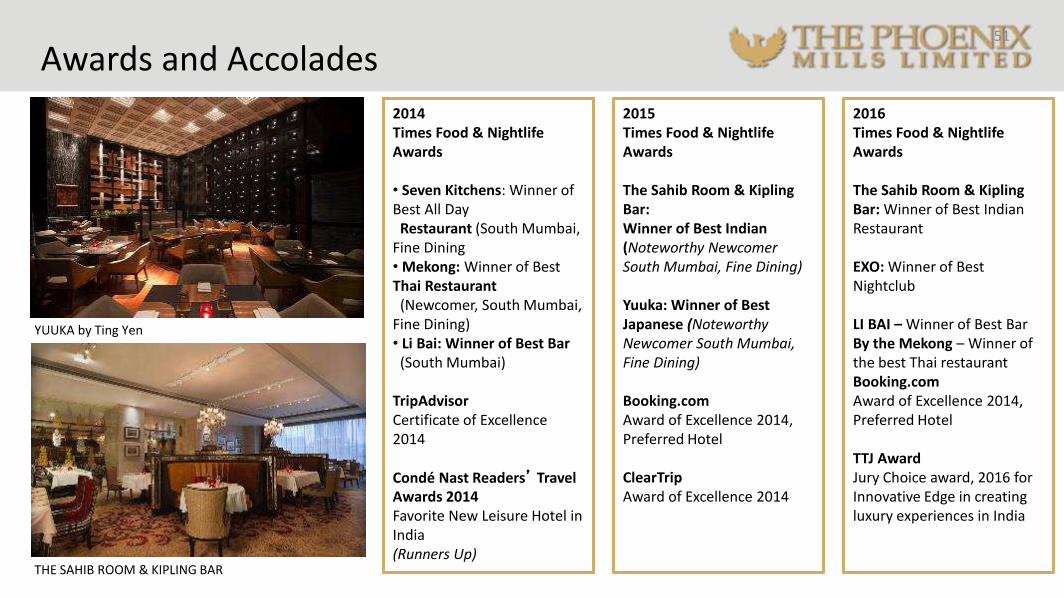
Awards and Accolades
2014Times Food & Nightlife Awards
• Seven Kitchens: Winner of Best All Day
Restaurant (South Mumbai, Fine Dining• Mekong: Winner of Best Thai Restaurant
(Newcomer, South Mumbai, Fine Dining)• Li Bai: Winner of Best Bar
(South Mumbai)
TripAdvisorCertificate of Excellence 2014
Condé Nast Readers’ Travel Awards 2014Favorite New Leisure Hotel in India(Runners Up)
YUUKA by Ting Yen
51
2015Times Food & Nightlife Awards
The Sahib Room & Kipling Bar: Winner of Best Indian (Noteworthy Newcomer South Mumbai, Fine Dining)
Yuuka: Winner of Best Japanese (Noteworthy Newcomer South Mumbai, Fine Dining)
Booking.comAward of Excellence 2014, Preferred Hotel
ClearTripAward of Excellence 2014
THE SAHIB ROOM & KIPLING BAR
2016Times Food & Nightlife Awards
The Sahib Room & Kipling Bar: Winner of Best Indian Restaurant
EXO: Winner of Best Nightclub
LI BAI – Winner of Best BarBy the Mekong – Winner of the best Thai restaurantBooking.comAward of Excellence 2014, Preferred Hotel
TTJ Award Jury Choice award, 2016 for Innovative Edge in creating luxury experiences in India
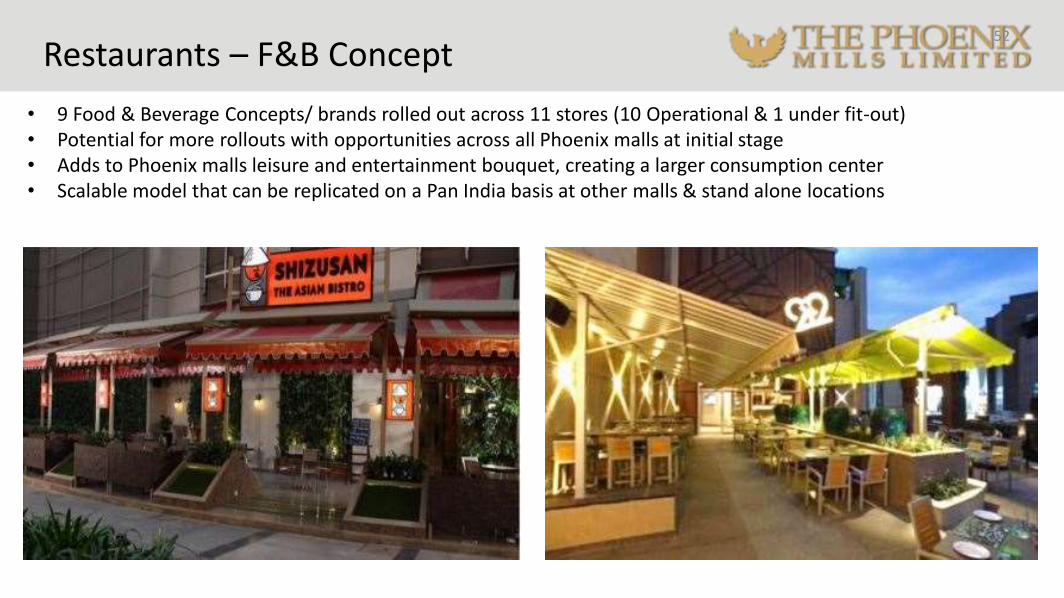
Restaurants – F&B Concept
• 9 Food & Beverage Concepts/ brands rolled out across 11 stores (10 Operational & 1 under fit-out)• Potential for more rollouts with opportunities across all Phoenix malls at initial stage• Adds to Phoenix malls leisure and entertainment bouquet, creating a larger consumption center• Scalable model that can be replicated on a Pan India basis at other malls & stand alone locations
52
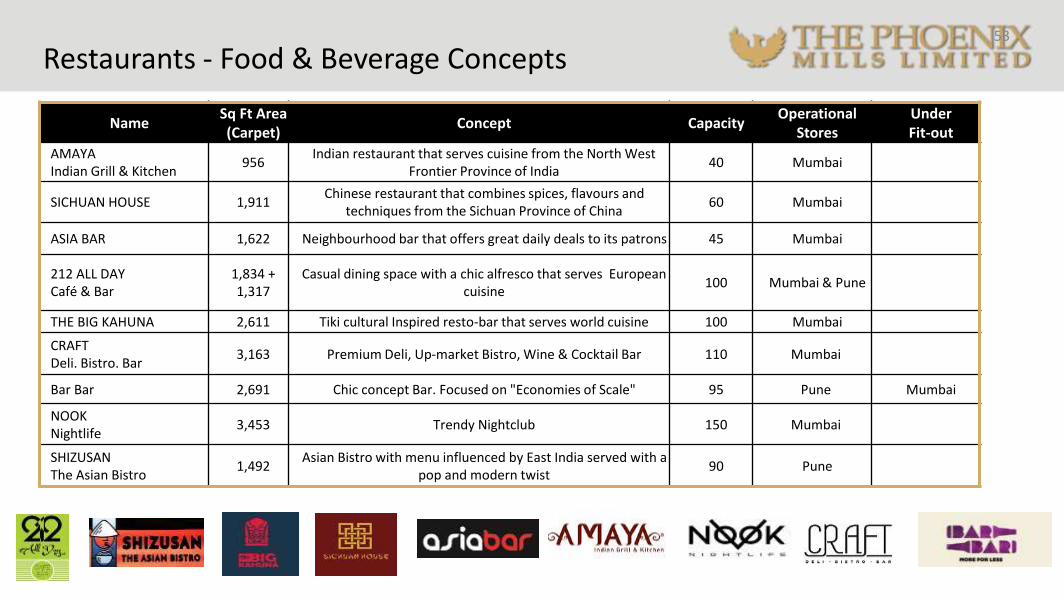
Restaurants - Food & Beverage Concepts53
NameSq Ft Area (Carpet)
Concept CapacityOperational
StoresUnder Fit-out
AMAYAIndian Grill & Kitchen
956Indian restaurant that serves cuisine from the North West
Frontier Province of India40 Mumbai
SICHUAN HOUSE 1,911Chinese restaurant that combines spices, flavours and
techniques from the Sichuan Province of China 60 Mumbai
ASIA BAR 1,622 Neighbourhood bar that offers great daily deals to its patrons 45 Mumbai
212 ALL DAYCafé & Bar
1,834 + 1,317
Casual dining space with a chic alfresco that serves European cuisine
100 Mumbai & Pune
THE BIG KAHUNA 2,611 Tiki cultural Inspired resto-bar that serves world cuisine 100 Mumbai
CRAFTDeli. Bistro. Bar
3,163 Premium Deli, Up-market Bistro, Wine & Cocktail Bar 110 Mumbai
Bar Bar 2,691 Chic concept Bar. Focused on "Economies of Scale" 95 Pune Mumbai
NOOK Nightlife
3,453 Trendy Nightclub 150 Mumbai
SHIZUSANThe Asian Bistro
1,492Asian Bistro with menu influenced by East India served with a
pop and modern twist90 Pune

Thank you!
For more information on the Company, its projects and services
please log on to www.thephoenixmills.com
or contact:
Varun Parwal
Contact: +91 22 30016737
Email: [email protected]
Rohini Garg
Contact: +91 22 30016849
Email: [email protected]
54