q4 june fy21
TRANSCRIPT

Page 1 of 19
Highlights Q4 June FY211
• Group gold production steady at 82,698 ounces
• All-In Sustaining Cost (AISC) 2% lower at A$1,623 per ounce
• Full year gold production of 327,662 ounces and AISC of A$1,616 per ounce
• Operational cash flow of A$100 million
• FY22 guidance
− Group gold production 305,000 - 355,000 ounces
− AISC A$1,710 - A$1,860 per ounce
• Total cash at bank on 30 June 2021 up 45% to A$133 million after A$21 million repayment of debt
Overview
The June quarter saw significant improvements in
operating performance with record mill throughput rates at
Atlantic, whilst Gwalia had its highest quarter of mill
throughput for almost 5 years. In addition, ore mined at
Gwalia was up 16% on the prior quarter, despite the
challenges of a change in mining contractor. Gold
production for the quarter remained steady at 82,698
ounces despite Simberi being shut down for almost half
the quarter. Mining at Simberi has been granted
conditional approval to recommence and will ramp up over
the weeks ahead. The processing facility is expected to be
brought back into production by the end of Q2 Dec FY22.
All-In Sustaining Costs for the June quarter were ~2%
lower at A$1,623 per ounce compared to the prior
quarter, largely due to increased gold production at
Atlantic.
“All our operations rose to the challenge posed by the
second year of the global COVID-19 pandemic and a
difficult operating environment with rolling border closures
causing additional challenges” said Mr Craig Jetson,
Managing Director and CEO.
In June St Barbara released the Leonora Province Plan
adding ~1.4 million ounces to the existing 5.0 million
ounces of gold in Mineral Resources. The three-stage
strategy of growing sustainable production at lower cost
profile to deliver superior returns to shareholders remains
on track. In early July St Barbara acquired a 19.8% equity
position in Kin Minerals2 which has 1.2 million ounces of
gold resources near St Barbara’s Leonora operations and
has exploration upside potential.
Total cash at bank on 30 June 2021 was A$133 million (31
March 2021: A$92 million), after the repayment of debt of
A$21 million during the quarter. Total debt owing under
the Company’s syndicated facility on 30 June 2021 was
A$82 million (31 March 2021: A$102 million).
Production Summary
Q4 Jun
FY20
Q1 Sep
FY21
Q2 Dec
FY21
Q3 Mar
FY21
Q4 Jun
FY21
Year
FY21
Group TRIFR3 3.0 3.1 3.3 3.7 3.9 3.9
Gold Production koz 109 73 90 82 83 328
All-In Sustaining Cost A$/oz 1,301 1,711 1,517 1,649 1,623 1,616
Gold Sold koz 104 66 99 71 96 333
Realised Gold Price A$/oz 2,412 2,171 2,126 2,247 2,336 2,221
1 This report uses certain Non-IFRS measures as set out on the last page of this report. Unless otherwise noted, information in this report that relates to Mineral
Resources or Ore Reserves is extracted from the report titled ‘Ore Reserves and Mineral Resources Statements 30 June 2020’ re leased to the ASX on 24 August
2020. This report has not been audited.
2 Refer to ASX release dated 14 July 2021 ‘Holding in Kin Mining NL (KIN)’
3 Total Recordable Injury Frequency Rate rolling 12 month average
Q4 June FY21
(3 months to 30 June 2021)
St Barbara Quarterly Report / Q4 June FY21
Page 2 of 19
Safety
On 21 May 2021, a truck driver at Simberi was fatally injured when the truck travelled over a safety berm and fell
approximately 40 metres into the open pit. All of St Barbara was deeply saddened by the tragic incident. Assistance
continues to be provided to the employee’s family, together with counselling support for the Simberi team. An
independent investigation was completed, and the report was submitted to the Mineral Resource Authority (MRA), who
also conducted an inquiry. The site team is currently implementing recommended corrective and preventative actions
from both investigations.
Total Recordable Injury Frequency Rate (TRIFR) safety performance was 3.9 as at 30 June 2021 compared with 3.7
at the end of March 2021. The corresponding Lost Time Injury Frequency Rate on 30 June 2021 was 0.59 (31 March
2021 was 0.39). For the quarter there was one fatality and two recordable injuries. The month of April and June were
recordable injury free.
During the quarter the COVID-19 situation in PNG has improved with a significant decrease in community
transmissions. Simberi has continued to implement the St Barbara COVID-19 protocols with the support and guidance
of external medical specialists and with additional controls to limit people movements. Currently a COVID-19 vaccination
program is taking place onsite.
Safety focus over the quarter has been on the development of communities of practices to improve the Critical Control
Risk Standards and the ongoing development work for the Safety Always leadership program. The COVID-19
management work continues across all sites.
Guidance
FY22 guidance is for consolidated gold production of between 305,000 and 355,000 ounces at an AISC of between
A$1,710 and A$1,860 per ounce.
Gold production
(koz)
AISC
(A$/oz)
Sustaining capex
(A$M)
Growth capex
(A$M)
Atlantic Operations 65 - 85 1,305 – 1,5151 15 – 20 30 – 40
Leonora Operations 180 – 200 1,605 – 1,720 65 – 75 15 – 20
Simberi Operations 60 – 70 2,465 – 2,6502 15 – 20 25 – 35
Consolidated 305 - 355 1,710 – 1,860 95 – 115 70 – 95
FY22 consolidated guidance includes the latest mine plan at Atlantic (which forecast lower-than-expected ore grades),
the disruption to production at Simberi and includes 10,000 ounces of production at Leonora from ore purchased from
Linden Gold Alliance.
Due to the Simberi processing facility restart anticipated in Q2 Dec FY22 (on commissioning of the new deep-sea
tailings placement (DSTP) pipeline) consolidated gold production is forecast to be weighted marginally to H2 FY22.
Leonora Province Plan
As reported on 21 June 2021 the Company provided an update on the Leonora Province Plan3, with the key highlights:
• An additional ~1.4 million ounces of Mineral Resources in the Leonora Province, equating to an uplift of ~30%
• Resource Development and Extensional drilling has commenced
• A combined Pre-Feasibility Study for Tower Hill and Harbour Lights has commenced
• Additional Resource inventory supports a Mill Expansion Study, which is scheduled for completion in Q4 Jun FY22
• Gwalia Intermediates incorporated in the Life of Mine plan and will be included in the Ore Reserves update to be
reported in August 2021
1 C$1,240 to C$1,440 per ounce at AUD/CAD of 0.95
2 US$1,850 to US$1,990 per ounce at AUD/USD of 0.75
3 Refer to ASX release dated 21 June 2021 ‘Progress on the Leonora Province Plan’

St Barbara Quarterly Report / Q4 June FY21
Page 3 of 19
• Third party ore source opportunities for both toll treatment and ore purchase continue to be explored and the Company
is working closely with a number of parties.
Building Brilliance at St Barbara
Since its launch in September 2020, the Building Brilliance transformation program has delivered a cash benefit of
A$41M to 30 June 2021 compared with the target of A$30M to A$40M, with many of the production and cost initiatives
realising their potential during the quarter. Examples of initiatives implemented at each site are described below.
During FY22, Building Brilliance will focus on the sustainability of initiatives at each operation, and embedding the
Building Brilliance process as a “business as usual” mindset in daily activities to ensure business improvement initiatives
continue to be developed and implemented. The focus of Building Brilliance in FY21 was on operational productivity
and cost efficiency with the program extended to corporate activities in FY22.
Atlantic Operations
• Mill throughput rate: Increases in throughput rate have been realised from gravity circuit enhancements, increasing
power draw on the ball mill and enhanced operator management of the plant. During the June quarter these
improvements yielded a 13% improvement in average throughput rates.
• Mill availability: By adopting a new approach towards maintenance, shifting from a scheduled/routine to a condition
monitoring based approach, together with improvements to reduce wear to the ball mill feed chute, mill availability
has increased from 90% to 97%.
• Recovery: Installation of downcomers in the CIL1 tanks, together with improved cyanide and dissolved oxygen control
has seen recovery improve from 92% to 94%
Leonora Operations
• Scrap metal reclaim and ore removal: Historically, when waste steel (rock bolts, mesh, etc.) was separated from
the main ore stockpiles it would be discarded despite containing embedded ore. An initiative was developed to refine
the separation process to increase the amount of ore reclaimed and to sell the steel as scrap.
• Paste fill: Extensive research and testing has resulted in a reduction in the number of pours required to backfill a
stope after it has been bogged. By reducing the number of pours required, the total curing time of the paste has
improved by up to 48 hours per stope.
• TKMs2 and material moved: A focus on material movement underground saw the introduction of many initiatives
which have increased truck availability and utilisation. Establishing Wi-Fi underground has expanded the use of
teleremote operations for the trucking fleet and drilling activities.
Simberi Operations
• Although Simberi is not currently processing ore, while shut down and pending restart after remediation of the DSTP
pipeline, many initiatives have been progressed to ensure the benefits are realised when operations resume.
Initiatives have focussed on equipment availability and productivity, mill recoveries and cost reduction.
Executive changes
On 5 July 2021, the Company announced that Mr Garth Campbell-Cowan, Chief Financial Officer, is leaving the
Company after 15 years to pursue other opportunities.
Mr Lucas Welsh has been appointed to succeed Mr Campbell-Cowan as Chief Financial Officer (CFO), effective
27 August 2021, and is now a member of the Executive Leadership Team. Mr Welsh joined St Barbara in 2007 and is
a Chartered Accountant. He was appointed General Manager Finance in 2014 and in 2015 this role expanded to include
procurement. During his long and successful career at St Barbara he’s built the Company’s financial systems and led
process improvement across the Finance and Procurement departments. Mr Welsh was most recently appointed as
Chief Transformation Officer, leading the Building Brilliance efforts across the Group.
1 Carbon In Leach
2 Tonne Kilometres
St Barbara Quarterly Report / Q4 June FY21
Page 4 of 19
Mr Campbell-Cowan will remain with the Company until 10 September 2021 to ensure a smooth transition to his
successor and will oversee the release of the Company’s FY21 full year results in August 2021.
Also joining the team is Mr Chris Maitland as Head of Investor Relations based in Melbourne. Mr Maitland has more
than 20 years’ experience in financial, capital markets and corporate services in mining and other sectors. Most recently,
he was Head of Business Improvement at Newcrest and previously Head of Investor Relations and Media. He has also
worked at Rio Tinto, Mayne Group and National Foods.
Quarterly briefing and audio webcast
Mr Craig Jetson, Managing Director & CEO, will brief analysts and investors on the Q4 June FY21 Quarterly Report at
11:00 am Australian Eastern Standard Time (UTC + 10 hours) on Wednesday 28 July 2021.
Analysts and institutional investors
Analysts and institutional investors can register for the briefing at https://s1.c-conf.com/DiamondPass/10014896-
sj84f3.html
Shareholders and media
An audio webcast will be available live and after the event on St Barbara’s website at
stbarbara.com.au/investors/webcast/ or by clicking here. The audio webcast is ‘listen only’ and does not enable
questions.
For more information
Investor Relations Media Relations
Chris Maitland
Head of Investor Relations Ben Wilson
GRACosway
T M
+61 3 8660 1914 +61 447 120 070
M
+61 407 966 083
David Cotterell
Manager Investor Relations
T +61 3 8600 1959
M +61 447 644 648
Authorised by
Craig Jetson
Managing Director & CEO
28 July 2021
St Barbara Limited ACN 009 165 066
Level 10, 432 St Kilda Road, Melbourne VIC 3004 ASX: SBM
Locked Bag 9, Collins Street East, Melbourne VIC 8003 ADR: STBMY
T +61 3 8660 1900 F +61 3 8660 1999 stbarbara.com.au

St Barbara Quarterly Report / Q4 June FY21
Page 5 of 19
Overview
Group Safety Performance
Consolidated Quarterly Operational
Cash Contribution
Consolidated Gold Production
3.0 3.1 3.33.7 3.9
FY21Q4 Jun
FY21Q1 Sep
FY21Q2 Dec
FY21Q3 Mar
FY21Q4 Jun
Total Recordable Injury Frequency Rate
46
1733
2041
55
-23
36
24
48
25
35
17
-8
11
126
29
86
36
100
FY20Q4 Jun
FY21Q1 Sep
FY21Q2 Dec
FY21Q3 Mar
FY21Q4 Jun
Simberi Leonora Atlantic
(A$M)
1,301
1,7111,517 1,649 1,623
FY20Q4 Jun
FY21Q1 Sep
FY21Q2 Dec
FY21Q3 Mar
FY21Q4 Jun
Quarterly AISC
(A$/oz)
29 27 2721
27
51
23
4243
45
28
23
2119 11
108
73
9082 83
FY20Q4 Jun
FY21Q1 Sep
FY21Q2 Dec
FY21Q3 Mar
FY21Q4 Jun
Simberi Leonora Atlantic
Figures displayed to nearest thousand ounces.Reported ounces in associated table.
Combined Quarterly Gold Production
(koz)
23%25%
24%
28%
FY22Q1 Sep
FY22Q2 Dec
FY22Q3 Mar
FY22Q4 Jun
Indicative % of annual production (koz)
FY22 Production
Indicative Quarterly Guidance Profile(%)
St Barbara Quarterly Report / Q4 June FY21
Page 6 of 19
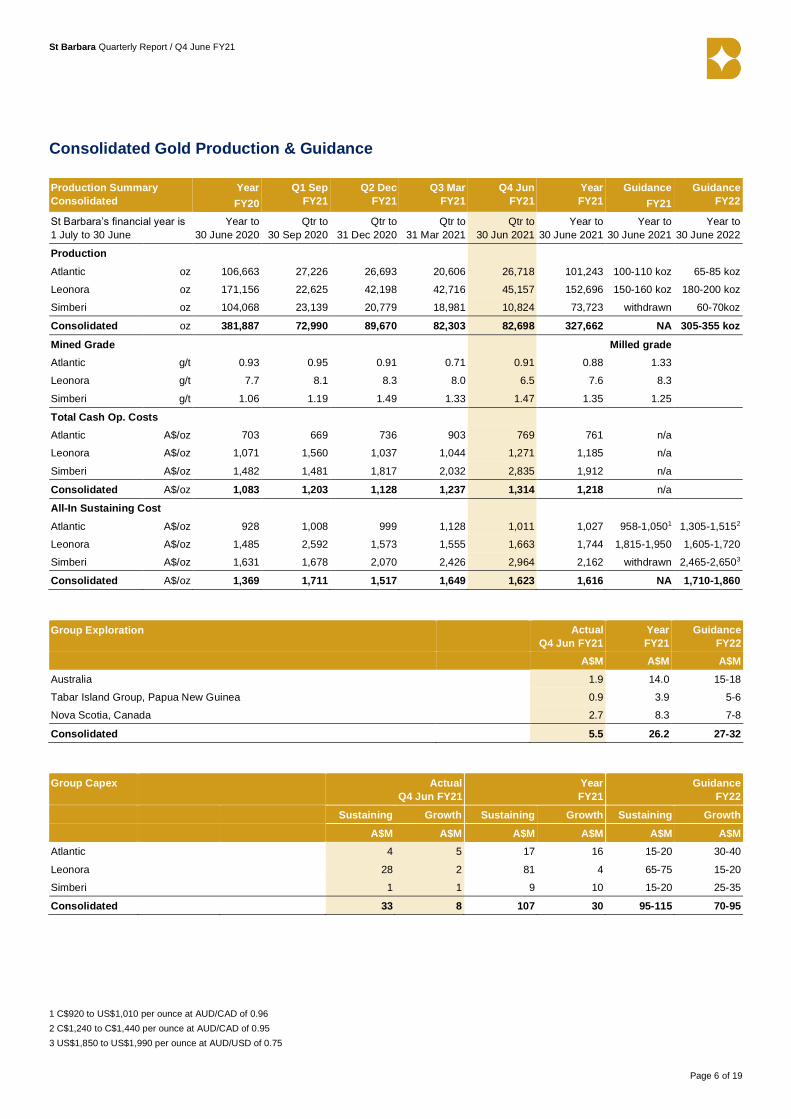
Consolidated Gold Production & Guidance
Production Summary
Consolidated
Year
FY20
Q1 Sep
FY21
Q2 Dec
FY21
Q3 Mar
FY21
Q4 Jun
FY21
Year
FY21
Guidance
FY21
Guidance
FY22
St Barbara’s financial year is
1 July to 30 June
Year to
30 June 2020
Qtr to
30 Sep 2020
Qtr to
31 Dec 2020
Qtr to
31 Mar 2021
Qtr to
30 Jun 2021
Year to
30 June 2021
Year to
30 June 2021
Year to
30 June 2022
Production
Atlantic oz 106,663 27,226 26,693 20,606 26,718 101,243 100-110 koz 65-85 koz
Leonora oz 171,156 22,625 42,198 42,716 45,157 152,696 150-160 koz 180-200 koz
Simberi oz 104,068 23,139 20,779 18,981 10,824 73,723 withdrawn 60-70koz
Consolidated oz 381,887 72,990 89,670 82,303 82,698 327,662 NA 305-355 koz
Mined Grade Milled grade
Atlantic g/t 0.93 0.95 0.91 0.71 0.91 0.88 1.33
Leonora g/t 7.7 8.1 8.3 8.0 6.5 7.6 8.3
Simberi g/t 1.06 1.19 1.49 1.33 1.47 1.35 1.25
Total Cash Op. Costs
Atlantic A$/oz 703 669 736 903 769 761 n/a
Leonora A$/oz 1,071 1,560 1,037 1,044 1,271 1,185 n/a
Simberi A$/oz 1,482 1,481 1,817 2,032 2,835 1,912 n/a
Consolidated A$/oz 1,083 1,203 1,128 1,237 1,314 1,218 n/a
All-In Sustaining Cost
Atlantic A$/oz 928 1,008 999 1,128 1,011 1,027 958-1,0501 1,305-1,5152
Leonora A$/oz 1,485 2,592 1,573 1,555 1,663 1,744 1,815-1,950 1,605-1,720
Simberi A$/oz 1,631 1,678 2,070 2,426 2,964 2,162 withdrawn 2,465-2,6503
Consolidated A$/oz 1,369 1,711 1,517 1,649 1,623 1,616 NA 1,710-1,860
Group Exploration Actual
Q4 Jun FY21
Year
FY21
Guidance
FY22
A$M A$M A$M
Australia 1.9 14.0 15-18
Tabar Island Group, Papua New Guinea 0.9 3.9 5-6
Nova Scotia, Canada 2.7 8.3 7-8
Consolidated 5.5 26.2 27-32
Group Capex Actual
Q4 Jun FY21
Year
FY21
Guidance
FY22
Sustaining Growth Sustaining Growth Sustaining Growth
A$M A$M A$M A$M A$M A$M
Atlantic 4 5 17 16 15-20 30-40
Leonora 28 2 81 4 65-75 15-20
Simberi 1 1 9 10 15-20 25-35
Consolidated 33 8 107 30 95-115 70-95
1 C$920 to US$1,010 per ounce at AUD/CAD of 0.96
2 C$1,240 to C$1,440 per ounce at AUD/CAD of 0.95
3 US$1,850 to US$1,990 per ounce at AUD/USD of 0.75

St Barbara Quarterly Report / Q4 June FY21
Page 7 of 19
Atlantic Operations, Nova Scotia, Canada
Operations
Production for Q4 Jun FY21 was 26,718 ounces
representing a 30% quarter-on-quarter increase (Q3 Mar
FY21: 20,606 ounces). The mine focused on delivering
high-grade ore from the pit, with ore mined up 19%
compared to the prior quarter. This was despite the
challenges of pit dewatering and congestion due to
smaller work areas on the lower benches of the pit.
There was a 10% quarter-on-quarter reduction in AISC to
A$1,011 per ounce for Q4 Jun FY21 (Q3 Mar FY21:
A$1,128 per ounce), mainly due to increased gold
production.
The Building Brilliance program continued to deliver
productivity benefits, as demonstrated by mill
performance in Q4 Jun FY21. In Q4, mill throughput was
a record of 374 tonnes per operating hour (tpoh), up 8%
on the prior quarter (Q3 Mar FY21: 347 tpoh) and included
a record month in June of 380 tpoh.
Throughput for FY21 was a new record of 2,918 kt (FY20:
2,588 kt). Mill availability was also a quarterly record at
97% (Q3 Mar FY21: 95%).
1 C$1,240 to C$1,440 per ounce at AUD/CAD 0.95
Gold recovery in Q4 Jun FY21 was 94%, a slight
improvement on the prior quarter (Q3 Mar FY21: 93%).
The average milled grade for Q4 Jun FY21 was 1.11 g/t
Au (Q3 Mar FY21: 0.96 g/t Au), this included a blend of
higher-grade ore supplemented with lower-grade ore.
Atlantic Gold growth projects
Beaver Dam: The revised Environmental Impact Study
(EIS) and second round of information requests were
submitted in June 2021. Following the completion of
several reviews, the Feasibility Study is being refined with
the plan to complete during Q1 Sep FY22.
Fifteen Mile Stream: The EIS was submitted in February
2021, with the first round of information requests received
in late June 2021. Responses to the information requests
have commenced. Permitting support and land acquisition
activities are continuing.
Cochrane Hill: Baseline monitoring for permitting is
continuing.
Outlook
FY22 guidance comprises:
• Gold production of between 65,000 and 85,000 ounces
• AISC of between A$1,305 and A$1,515 per ounce1
• Sustaining capex of A$15 to A$20 million
• Growth capex of A$30 to A$40 million.
988 1,008 9991,128
1,011
AISC(A$/oz)
1.4 1.3 1.21.0
1.1
Milled grade
(g/t Au) Reserve grade
1.1 g/t Au 30 June 2020
2927 27
21
27
FY20Q4 Jun
FY21Q1 Sep
FY21Q2 Dec
FY21Q3 Mar
FY21Q4 Jun
Production
(koz)

St Barbara Quarterly Report / Q4 June FY21
Page 8 of 19
Leonora Operations, Leonora, WA
Operations
Production for Q4 Jun FY21 of 45,157 ounces was up 6%
compared to the prior quarter (Q3 Mar FY21: 42,716
ounces). Mined grade for the quarter was lower at 6.5 g/t
Au (Q3 Mar FY21: 8.0 g/t Au). This was related to the
stope sequencing in the mine plan, aligned with the
strategy to increase tonnes and maximise the resource
while mining from more than one mining area.
AISC of A$1,663 per ounce was ~7% higher than the
previous quarter (Q3 Mar FY21: A$1,555 per ounce).
Higher AISC was attributable to lower mined grades, ore
purchase costs and the cost of transitioning to the new
mining contractor.
Ore mined in Q4 Jun FY21 was the highest quarter for
FY21 at 195 kt (Q3 Mar FY21: 168 kt), reflecting the
continued focus on the debottlenecking program at
Gwalia.
Ore milled in the quarter was 281 kt (Q3 Mar FY21: 194
kt), the highest quarter of milled tonnes since Q1 Sep
FY16. Gold recovery at 96% was marginally lower than
the previous quarter (Q3 Mar FY21: 97%).
Ore stockpile material, whilst of lower grade (1.3 g/t),
provided additional ounces. A total of 36 kt of ore was
purchased from Linden Gold Alliance, with 3,531 ounces
recovered.
The grade for Q4 milled tonnes was 5.3 g/t Au (Q3 Mar
FY21: 7.1 g/t Au). This is consistent with the province plan
to process economical stockpile material and purchased
ore to maximise the mill capacity while generating
additional ounces and revenue.
Building Brilliance continues to deliver improvements at
Gwalia, in particular:
• The focus on the mine planning process has increased
the development fronts from 12 at the start of FY21 to 24
in Q4 Jun FY21. The number of development fronts is
expected to increase to 28 by the end of FY22.
• Improved development has positioned Gwalia such that
minimal development is required to achieve FY22
production. The focus with the new contractor is on
opening new mining areas (e.g., Intermediates).
Outlook
FY22 guidance comprises:
• Gold production of between 180,000 and 200,000
ounces and includes 10,000 ounces of production from
ore purchased from Linden Gold Alliance
• AISC of between A$1,605 and A$1,720 per ounce
• Sustaining capex of A$65 to A$75 million
• Growth capex of A$15 to A$20 million.
1,389
2,592
1,573 1,555 1,663
AISC
(A$/oz)
7.08.1 8.3 8.0
6.5
Mined grade
(g/t Au)
Reserve grade
6.3 g/t Au 30 June 2020
51
23
42 43 45
FY20Q4 Jun
FY21Q1 Sep
FY21Q2 Dec
FY21Q3 Mar
FY21Q4 Jun
Production
(koz)
231
85
157168
195
44
102
84 73 71
17
6
275
187
241 241266
FY20Q4 Jun
FY21Q1 Sep
FY21Q2 Dec
FY21Q3 Mar
FY21Q4 Jun
Gwalia total material moved
(kt)
Ore mined Development waste Raisebore waste
St Barbara Quarterly Report / Q4 June FY21
Page 9 of 19
Simberi Operations, Papua New Guinea
Operations
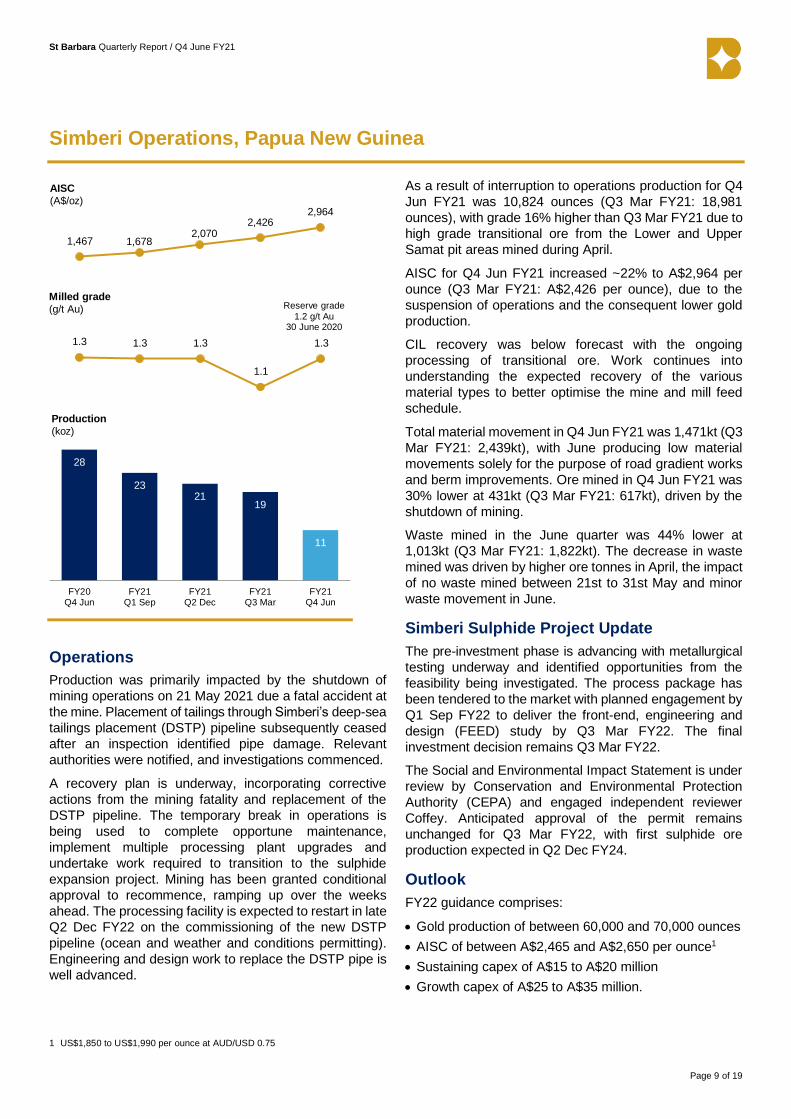
Production was primarily impacted by the shutdown of
mining operations on 21 May 2021 due a fatal accident at
the mine. Placement of tailings through Simberi’s deep-sea
tailings placement (DSTP) pipeline subsequently ceased
after an inspection identified pipe damage. Relevant
authorities were notified, and investigations commenced.
A recovery plan is underway, incorporating corrective
actions from the mining fatality and replacement of the
DSTP pipeline. The temporary break in operations is
being used to complete opportune maintenance,
implement multiple processing plant upgrades and
undertake work required to transition to the sulphide
expansion project. Mining has been granted conditional
approval to recommence, ramping up over the weeks
ahead. The processing facility is expected to restart in late
Q2 Dec FY22 on the commissioning of the new DSTP
pipeline (ocean and weather and conditions permitting).
Engineering and design work to replace the DSTP pipe is
well advanced.
1 US$1,850 to US$1,990 per ounce at AUD/USD 0.75
As a result of interruption to operations production for Q4
Jun FY21 was 10,824 ounces (Q3 Mar FY21: 18,981
ounces), with grade 16% higher than Q3 Mar FY21 due to
high grade transitional ore from the Lower and Upper
Samat pit areas mined during April.
AISC for Q4 Jun FY21 increased ~22% to A$2,964 per
ounce (Q3 Mar FY21: A$2,426 per ounce), due to the
suspension of operations and the consequent lower gold
production.
CIL recovery was below forecast with the ongoing
processing of transitional ore. Work continues into
understanding the expected recovery of the various
material types to better optimise the mine and mill feed
schedule.
Total material movement in Q4 Jun FY21 was 1,471kt (Q3
Mar FY21: 2,439kt), with June producing low material
movements solely for the purpose of road gradient works
and berm improvements. Ore mined in Q4 Jun FY21 was
30% lower at 431kt (Q3 Mar FY21: 617kt), driven by the
shutdown of mining.
Waste mined in the June quarter was 44% lower at
1,013kt (Q3 Mar FY21: 1,822kt). The decrease in waste
mined was driven by higher ore tonnes in April, the impact
of no waste mined between 21st to 31st May and minor
waste movement in June.
Simberi Sulphide Project Update
The pre-investment phase is advancing with metallurgical
testing underway and identified opportunities from the
feasibility being investigated. The process package has
been tendered to the market with planned engagement by
Q1 Sep FY22 to deliver the front-end, engineering and
design (FEED) study by Q3 Mar FY22. The final
investment decision remains Q3 Mar FY22.
The Social and Environmental Impact Statement is under
review by Conservation and Environmental Protection
Authority (CEPA) and engaged independent reviewer
Coffey. Anticipated approval of the permit remains
unchanged for Q3 Mar FY22, with first sulphide ore
production expected in Q2 Dec FY24.
Outlook
FY22 guidance comprises:
• Gold production of between 60,000 and 70,000 ounces
• AISC of between A$2,465 and A$2,650 per ounce1
• Sustaining capex of A$15 to A$20 million
• Growth capex of A$25 to A$35 million.
1,467 1,6782,070
2,4262,964
AISC
(A$/oz)
1.3 1.3 1.3
1.1
1.3
Milled grade
(g/t Au) Reserve grade 1.2 g/t Au
30 June 2020
28
2321
19
11
FY20Q4 Jun
FY21Q1 Sep
FY21Q2 Dec
FY21Q3 Mar
FY21Q4 Jun
Production
(koz)

St Barbara Quarterly Report / Q4 June FY21
Page 10 of 19
Exploration activities
Q4 Jun FY21
Exploration activity summary
Australia
Leonora – near mine (WA) • 95 RC holes for 843 m
• Geological interpretation
Leonora – regional (WA) • 40.5 RC holes for 4,987 m
Pinjin (WA) • Rehabilitation works
Lake Wells (WA) • No field activity
Back Creek (NSW) • 2 Diamond holes for 508.8 m
Drummartin JV (VIC) • 27 Aircore holes for 4,265 m
Canada
Moose River Corridor • 9 Diamond holes for 1,077 m
• 2 RC holes for 202 m
Touquoy Camp • 5 Diamond holes for 514 m
NE Regional • 4 Diamond holes for 639 m
• 9 IFRC holes for 187 m
SW Regional • 10 IFRC holes for 264 m
PNG
Simberi Island • 17 Diamond holes for 1,160 m
• 8 RC holes for 554 m
Tatau Island No field activity
Australia
Leonora Exploration, Western Australia
Figure 2.0
Gwalia near mine: Geological interpretation and wire-
framing was completed for the Gwalia Shallows target.
Subject to access, exploration drilling is planned in
between Gwalia, Tower Hill and Harbour Lights as well as
resource definition drilling at Tower Hill and Harbour
Lights, commencing in late Q1 Sep FY22 or Q2 Dec FY22.
A 95 hole RC drill program for 844m was completed on
historic ore stockpiles adjacent to the Tower Hill open pit.
Leonora regional: A 60 hole RC drill program for 7,025m
testing five targets (Falklands Trend, Hawaii, Jasper Hill,
Trevor Bore and Ascension) commenced late in Q4 Jun
FY21. Drilling during the quarter totalled 40.5 RC holes for
4,987 m. Assay results are pending.
Figure 2.0 Gwalia and surrounding Leonora tenements
Pinjin Project, Western Australia
Figure 3.0
Field activities during the quarter were restricted to
rehabilitation work.
Lake Wells Gold Project, Western Australia
Figure 3.0
No field activities occurred during the quarter.
Back Creek, New South Wales
Figure 3.0
Two diamond drill holes were completed for 508.8m at the
South West target in EL8214 testing beneath a gold in
bedrock aircore anomaly during Q4 Jun FY21. A section
of assays from the second hole were still pending at the
end of the quarter.

St Barbara Quarterly Report / Q4 June FY21
Page 11 of 19
Drummartin, Victoria
Figure 3.0
27 aircore holes were completed for 4,265m during Q4
Jun FY21. In total, the aircore program consisted of 89
holes for 13,213 m, testing five gravity targets. Results will
be interpreted in Q1 Sep FY22 and follow-up drilling is
expected to recommence late in Q2 Dec FY22.
Figure 3.0 Australia and Papua New Guinea project locations
Canada
Moose River Corridor
Figure 4.0
Nine diamond drill holes for 1,077m were completed at
Seloam Brook North East target, testing for extensions to
mineralisation immediately west of the Hudson deposit at
Fifteen Mile Stream. Two RC holes for 202m were
completed at Caribou East target. Assay results for both
drill programs are pending. Surface sampling included 58
till samples collected from Meagher’s Grant target and 379
soil samples from Bear Brook, Marinette targets and
Fifteen Mile Stream.
Touquoy Camp
Figure 4.0
Five diamond drill holes for 514m were completed in Q4
Jun FY21 testing the HLS-Scheelite Closure Area target
located south west of Touquoy Mine. Assay results are
pending.
Southwest Regional
Figure 4.0
Ten Interface RC (IFRC) holes for 264m was completed
at Moses Lake A target in Q4 Jun FY21 returning no
significant results.
Northeast Regional
Figure 4.0
Four diamond holes for 639m were completed at Lake
Catcha target. Assay results are pending. Nine Interface
RC (IFRC) holes for 187m were completed at Cameron
Dam in Q4 Jun FY21 returning no significant results.
Figure 4.0 Nova Scotia project locations
Papua New Guinea
Simberi, Tatau & Tabar Islands
Figure 5.0 & 5.1
Diamond and RC drilling of six oxide targets on Simberi
Island (ML136) to define potential additional Inferred to
Indicated Resources continued through Q4 Jun FY21.
Eight RC holes for 554m and 17 diamond drill holes for
1,159.9m were completed at Pigicow, Sorowar North
West, Pigibo North and Cell Tower / Pigibo East during
the quarter. In total during FY21, 60 RC holes for 4,147m
and 44 diamond holes for 3,152m were completed at
Pigicow, Sorowar North West, Pigibo North, Cell Tower /
Pigibo East and Andora. Drilling will continue into FY22
initially at Cell Tower / Pigibo East and then Bekou South.
Drilling results will be included in a new resource estimate
planned for Q1 Sep FY22.

St Barbara Quarterly Report / Q4 June FY21
Page 12 of 19
Figure 5.0 Tabar Islands location map, Papua New Guinea
Figure 5.1 Simberi drill location map, Papua New Guinea
Group Exploration Expenditure (unaudited)
Q1 Sep
FY21
Q2 Dec
FY21
Q3 Mar
FY21
Q4 Jun
FY21
Year
FY21
A$ million
Australia* 3.5 5.6 3.0 1.9 14.0
Canada – MRC 0.1 0.1 0.2 0.3 0.7
Canada – Regional* 1.4 1.7 2.1 2.4 7.6
PNG* 1.1 1.3 0.6 0.9 3.9
6.1 8.7 5.9 5.5 26.2
* These items are expensed
Exploration – FY22 Guidance & Strategy
Exploration Guidance FY22
FY22 exploration expenditure is forecast to be between
A$27 and A$32 million, consisting of:
• A$10 to A$11 million at Gwalia and Leonora regional,
A$5 to A$7 million elsewhere in Australia including
Pinjin and Lake Wells in Western Australia, Back Creek
in New South Wales and Drummartin in Victoria.
• A$7 to A$8 million in Nova Scotia, Canada.
• A$5 to A$6 million on Simberi oxide drilling and the
Tabar Island group in PNG.
Exploration Strategy FY22
The aim for the FY22 exploration program is to extend the
life of each operation and provide future growth options for
the Company. It will largely focus on the potential for
additional near-mine ore sources around the three
existing operations, including: Gwalia mine and the
surrounding mine lease, Touquoy mine and the Moose
River Corridor, and Simberi mine and mining lease
ML136.
Exploration on regional projects will focus on the discovery
of new deposits which have the potential to support a
stand-alone operation, including: Australia - Lake Wells,
Leonora Regional, Back Creek and Drummartin, Nova
Scotia - NE Regional and SW Regional areas, and PNG -
Tabar Island Group.
The annual targeting process ranks targets from the global
exploration portfolio for FY22. Exploration is then focused
on the highest geologically and value-add ranked targets.
There is specific emphasis on targets in the near mine
environment that have the potential to provide additional
ore sources to support operations in the short- and
medium-term.

St Barbara Quarterly Report / Q4 June FY21
Page 13 of 19
Australia
Activities in the Leonora region for FY22 will concentrate
on opportunities in between the Gwalia mine, Tower Hill
and Harbour Lights with special focus on testing potential
high grade extensions to known targets. Additionally,
exploration programs will continue in the broader Leonora
region testing targets in the Jasper area which is located
approximately 20 km from the Gwalia operations.
Work on the Lake Wells JV, Leonora Regional projects
(Western Australia), Back Creek (New South Wales) and
Drummartin JV (Victoria) is focused on continuing to drill
test the highest ranked geological, geophysical, structural
and bedrock geochemical targets. Aircore drilling
programs are planned at Leonora Regional and the
Drummartin JV testing targets under cover. Diamond and
/ or RC drilling is planned to test the highest ranked targets
at Leonora Regional, Lake Wells, Back Creek and
Drummartin JV.
Nova Scotia, Canada
Activities in Nova Scotia for FY22 will concentrate on four
camps: Moose River Corridor, NE Regional, SW Regional
and Touquoy. The focus within the Moose River Corridor
will be diamond and / or RC drill testing several targets
located immediately adjacent to, and along strike from
known deposits. In the Northeast Regional Camp,
diamond and / or RC drilling will test the two highest
ranked targets.
In the Southwest Regional Camp, extensive interface RC
(IFRC) drill programs are planned to continue to follow
up on defined targets. Small diamond and / or RC drill
programs are planned at targets that returned the best
gold in bedrock results from the FY21 IFRC drilling. At
Touquoy Camp, geophysics and soil sampling is planned
for an area located within 4 km of current open pit.
Mapping, surface sampling (rock, soil and till) and limited
geophysics is planned locally within each Camp to
generate new targets.
Simberi, PNG
Diamond and RC drilling of up to six oxide targets is
planned within ML136 to define potential additional
Inferred to Indicated Resources. Surface sampling and
mapping is planned for EL609 and EL2462.
1 Shareholdings as notified by St Barbara in substantial holder notices
Equity Investments
At the date of this report, St Barbara holds the following
investments in Australian explorers1:
Catalyst Metals Limited (ASX: CYL) 13.0%
Kin Mining NL (ASX: KIN) 19.8%
Peel Mining Limited (ASX: PEX) 9.9%
Subsequent to the end of the quarter St Barbara fully
exited the equity interest in Duketon Mining Limited (ASX:
DKM) for net proceeds of A$4.1 million2.
2 Refer to ASX release dated 27 July 2021 ‘Cessation of Holding in Duketon
Mining Limited (DKM)’

St Barbara Quarterly Report / Q4 June FY21
Page 14 of 19
Finance (unaudited)
• 95,535 ounces of gold were sold in Q4 Jun FY21, at an average realised gold price of A$2,336 per ounce (Q3 Mar
FY20: 71,329 ounces at A$2,247 per ounce), with 9,000 ounces delivered to call options that matured in the quarter
at a strike price of C$2,050 per ounce (average of A$2,160 per ounce).
• Total cash at bank on 30 June 2021 was A$133 million (31 March 2021: A$92 million), after project costs of A$13
million, growth capex of A$8 million, exploration expenditure of A$5 million and repayment of debt of A$21 million.
• Total debt owing under the Company’s syndicated facility on 30 June 2021 was A$82 million (31 March 2021: A$102
million). The Australian tranche of the syndicated facility of A$200 million remains undrawn.
• The Company generated an operational cash contribution in Q4 Jun FY21 of A$100 million (Q3 Mar FY21: A$36
million).
• Cash movements are summarised in the following table:
Cash movements & balance A$M
(unaudited)
Q1 Sep
FY21
Q2 Dec
FY21
Q3 Mar
FY21
Q4 Jun
FY21
Year
FY21
Operating cash flow1 Atlantic 17 33 20 41 111
Leonora (23) 36 24 48 85
Simberi 35 17 (8) 11 55
Operational cash contribution 29 86 36 100 251
Growth capital - Atlantic (1) (2) (2) (5) (10)
Leonora (6) (5) (3) (2) (16)
Simberi (1) (1) (2) (1) (5)
Leonora mining equipment - - - (16) (16)
Project costs (3) (6) (5) (13) (27)
Corporate costs2 (7) (6) (7) (6) (26)
Corporate royalties (1) (3) (2) (2) (8)
Exploration (6) (9) (6) (5) (26)
Investments (61) (3) - - (64)
Income tax payments (2) (15) (9) (4) (30)
Working capital movement (30) 5 4 - (21)
Cash flows before finance costs (89) 41 4 46 2
Net interest income/(expense) (1) - (1) - (2)
Lease facility - - - 16 16
Other financing (1) (6) - - (7)
Syndicated facility repayments (200) - - (21) (221)
Linden Gold Alliance Loan - (9) (7) - (16)
Dividends paid (22) - (23) - (45)
Net movement for period (313) 26 (27) 41 (273)
Cash balance at start of quarter 406 93 119 92 406
Cash balance at end of quarter 93 119 92 133 133
Hedging in place at the date of this report comprises:
Financial Year Volume ounces Price $/oz Type Delivery Delivery schedule Announced
Jul 21 to Dec 22 66,010 C$2,050 European call options Jul 2021 to Dec 2022 monthly 24 Feb 2020
1 Net of sustaining capex
2 Cash corporate costs in Q1 Sep FY21 include payment of short term incentives for employees (inc. key management personnel) accrued at 30 June 2020

St Barbara Quarterly Report / Q4 June FY21
Page 15 of 19
Corporate
Share Capital
Issued shares ASX:SBM
Opening Balance 31 March 2021 708,023,789
Issued Nil
Closing balance 30 June 2021 708,023,789
Unlisted employee rights ASX:SBMAK
Opening balance 31 March 2021 3,695,220
Issued1 24,163
Exercised as shares Nil
Subject to assessment2 595,949
Lapsed3 276,229
Closing balance 30 June 2021 3,443,154
Comprises rights expiring:
Expiring on 30 June 2021 595,949
30 June 2022 1,183,530
30 June 2023 1,639,512
Unlisted rights issued under the NED Equity Plan 24,163
Closing balance 30 June 2021 3,443,154
1 Rights issued under the Non-Executive Directors Equity Plan
2 Vesting of employee rights expiring on 30 June 2021 will be determined as part of annual financial reporting due 26 August 2021
3 Rights lapsed of departed employees

St Barbara Quarterly Report / Q4 June FY21
Page 16 of 19
Corporate Directory
St Barbara Limited ABN 36 009 165 066
Board of Directors
Tim Netscher, Non-Executive Chairman
Craig Jetson, Managing Director & CEO
Steven Dean, Non-Executive Director
Kerry Gleeson, Non-Executive Director
Stef Loader, Non-Executive Director
David Moroney, Non-Executive Director
Company Secretary
Sarah Standish, General Counsel & Company Secretary
Executives
Craig Jetson, Managing Director & CEO
Garth Campbell-Cowan, Chief Financial Officer
Val Madsen, Executive General Manager People
Evan Spencer, Chief Operating Officer
Registered Office
Level 10, 432 St Kilda Road
Melbourne Victoria 3004 Australia
T +61 3 8660 1900
F +61 3 8660 1999
stbarbara.com.au
Australian Securities Exchange (ASX) Listing code
“SBM”
American Depositary Receipts (ADR OTC code
“STBMY”) through BNY Mellon,
www.adrbnymellon.com/dr_profile.jsp?cusip=852278100
Financial figures are in Australian dollars (unless
otherwise noted).
Financial year commences 1 July and ends 30 June.
Q1 Sep FY21 = quarter to 30 Sep 2020
Q2 Dec FY21 = quarter to 31 Dec 2020
Q3 Mar FY21 = quarter to 31 Mar 2021
Q4 Jun FY21 = quarter to 30 Jun 2021
Shareholder Enquiries
Computershare Investor Services Pty Ltd
GPO Box 2975
Melbourne Victoria 3001 Australia
T 1300 653 935 (within Australia)
T +61 3 9415 4356 (international)
F +61 3 9473 2500
www.investorcentre.com/au
Investor Relations
Chris Maitland, Head of Investor Relations
T +61 3 8660 1914
M +61 447 120 070
Substantial Shareholders
% of Holdings1
Van Eck Associates Corporation 10.9%
Schroder Investment Management 6.7%
L1 Capital 6.0%
Vanguard Group 5.0%
Scheduled Future Reporting
Date Report
26 August Annual Financial Results
Resources and Reserves Statements
Dates are tentative and subject to change
1 As notified by the substantial shareholder to 27 July 2021

St Barbara Quarterly Report / Q4 June FY21
Page 17 of 19
Appendix
Site gold production
Production summary Atlantic Operations Leonora Operations
Q1 Sep Q2 Dec Q3 Mar Q4 Jun FY21 Q1 Sep Q2 Dec Q3 Mar Q4 Jun FY21
Ore Mined kt 1,077 854 813 967 3,710 85 157 168 195 605
Waste mined kt 1,137 1,087 1,214 1,284 4,722 102 84 73 71 331
Grade g/t 0.95 0.91 0.71 0.91 0.88 8.1 8.3 8.0 6.5 7.6
Ore milled1 kt 698 714 711 795 2,918 97 177 194 281 749
Grade1 g/t 1.29 1.24 0.96 1.11 1.15 7.5 7.6 7.1 5.2 6.6
Recovery % 94 94 93 94 94 97 97 97 96 97
Gold production oz 27,226 26,693 20,606 26,718 101,243 22,625 42,198 42,716 45,157 152,696
Gold sold oz 22,789 29,294 19,581 28,312 99,976 16,490 47,846 36,864 49,597 150,797
Realised gold price A$/oz 1,844 1,966 2,099 2,311 2,062 1,914 2,022 2,298 2,348 2,185
All-In Sustaining Cost2
A$/oz produced
Mining 266 280 344 268 286 1,047 735 731 952 844
Processing 302 302 405 333 331 224 101 163 173 158
Site Services 121 139 179 145 144 214 117 104 79 116
Stripping and ore inventory adj (52) (29) (65) (31) (43) 35 11 (3) 4 9
637 692 863 715 718 1,520 964 995 1,208 1,127
By-product credits (1) (2) (2) (2) (2) (3) (3) (3) (3) (3)
Third party refining & transport 2 3 2 3 2 1 2 2 2 1
Royalties 31 43 40 53 43 42 74 50 64 60
Total cash operating costs 669 736 903 769 761 1,560 1,037 1,044 1,271 1,185
Less operating development* - - - - - (356) (215) (224) (201) (234)
Adjusted cash operating cost* - - - - - 1,204 822 820 1,070 951
Corporate and administration 90 75 89 67 77 90 75 89 67 77
Corporate royalty* - - - - - 44 59 43 49 49
Rehabilitation 13 13 16 18 14 12 8 8 8 8
Operating development* - - - - - 379 191 227 204 233
Capitalised mine development* - - - - - 827 342 312 184 359
Sustaining capital expenditure 236 175 120 157 175 36 76 56 81 67
All-In Sustaining Cost (AISC) 1,008 999 1,128 1,011 1,027 2,592 1,573 1,555 1,663 1,744
* These items only relevant to Gwalia
1 Includes Gwalia mineralised waste
2 Non-IFRS measure, refer Appendix

St Barbara Quarterly Report / Q4 June FY21
Page 18 of 19
Production summary Simberi Operations
Q1 Sep Q2 Dec Q3 Mar Q4 Jun FY21
Ore Mined kt 767 576 617 430 2,390
Waste mined kt 1,769 1,859 1,822 960 6,410
Grade g/t 1.19 1.49 1.33 1.47 1.35
Ore milled kt 703 796 803 457 2,758
Grade g/t 1.30 1.30 1.12 1.30 1.25
Recovery % 79 63 66 57 67
Gold production oz 23,139 20,779 18,981 10,824 73,723
Gold sold oz 27,181 22,321 14,884 17,627 82,013
Realised gold price A$/oz 2,601 2,559 2,317 2,343 2,482
All-In Sustaining Cost1
A$/oz produced
Mining 526 760 852 1,285 787
Processing 597 652 733 843 683
Site Services 330 362 405 616 401
Stripping and ore inventory adj (3) - - - -
1,450 1,774 1,990 2,744 1,871
By-product credits (56) (33) (18) (29) (37)
Third party refining & transport 11 7 16 25 9
Royalties 76 69 44 95 69
Total cash operating costs 1,481 1,817 2,032 2,835 1,912
Less operating development* - - - - -
Adjusted cash operating cost* - - - - -
Corporate and administration 90 75 89 67 77
Corporate royalty* - - - - -
Rehabilitation 31 35 38 74 40
Operating development* - - - - -
Capitalised mine development* - - - - -
Sustaining capital expenditure 76 143 267 (12) 132
All-In Sustaining Cost (AISC) 1,678 2,070 2,426 2,964 2,162
1 Non-IFRS measure, refer Appendix

St Barbara Quarterly Report / Q4 June FY21
Page 19 of 19
Disclaimer
This report has been prepared by St Barbara Limited (“Company”). The
material contained in this report is for information purposes only. This
release is not an offer or invitation for subscription or purchase of, or a
recommendation in relation to, securities in the Company and neither
this release nor anything contained in it shall form the basis of any
contract or commitment.
This report contains forward-looking statements that are subject to risk
factors associated with exploring for, developing, mining, processing
and the sale of gold. Forward-looking statements include those
containing such words as anticipate, estimates, forecasts, indicative,
should, will, would, expects, plans or similar expressions. Such forward-
looking statements are not guarantees of future performance and
involve known and unknown risks, uncertainties, assumptions and other
important factors, many of which are beyond the control of the Company,
and which could cause actual results or trends to differ materially from
those expressed in this report. Actual results may vary from the
information in this report. The Company does not make, and this report
should not be relied upon as, any representation or warranty as to the
accuracy, or reasonableness, of such statements or assumptions.
Investors are cautioned not to place undue reliance on such statements.
This report has been prepared by the Company based on information
available to it, including information from third parties, and has not been
independently verified. No representation or warranty, express or
implied, is made as to the fairness, accuracy or completeness of the
information or opinions contained in this report.
The Company estimates its reserves and resources in accordance with
the Australasian Code for Reporting of Identified Mineral Resources and
Ore Reserves 2012 Edition (“JORC Code”), which governs such
disclosures by companies listed on the Australian Securities Exchange.
Non-IFRS Measures
The Company supplements its financial information reporting
determined under International Financial Reporting Standards (IFRS)
with certain non-IFRS financial measures, including Cash Operating
Costs and All-In Sustaining Cost. We believe that these measures
provide additional meaningful information to assist management,
investors and analysts in understanding the financial results and
assessing our prospects for future performance.
All-In Sustaining Cost (AISC) is based on Cash Operating Costs and
adds items relevant to sustaining production. It includes some, but not
all, of the components identified in World Gold Council’s Guidance Note
on Non-GAAP Metrics - All-In Sustaining Costs and All-In Costs (June
2013).
• AISC is calculated on gold production in the quarter.
• For underground mines, amortisation of operating development is
adjusted from “Total Cash Operating Costs” in order to avoid
duplication with cash expended on operating development in the
period contained within the “Mine & Operating Development” line item.
• Rehabilitation is calculated as the amortisation of the rehabilitation
provision on a straight-line basis over the estimated life of mine.
Cash Contribution is cash flow from operations before finance costs,
refer reconciliation of cash movement earlier in this quarterly report.
Cash Operating Costs are calculated according to common mining
industry practice using The Gold Institute (USA) Production Cost
Standard (1999 revision).
Competent Persons Statement
Exploration Results
The information in this report that relates to Exploration Results is based
on information compiled by Dr Roger Mustard, who is a Member of The
Australasian Institute of Mining and Metallurgy. Dr Mustard is a full-time
employee of St Barbara and has sufficient experience relevant to the
style of mineralisation and type of deposit under consideration and to
the activity which he is undertaking to qualify as a Competent Person as
defined in the 2012 Edition of the ‘Australasian Code for Reporting of
Exploration Results, Mineral Resources and Ore Reserves’. Dr Mustard
consents to the inclusion in the report of the matters based on his
information in the form and context in which it appears.
Mineral Resource and Ore Reserve Estimates
The information in this report that relates to Mineral Resources or Ore
Reserves is extracted from the report titled ‘Ore Reserves and Mineral
Resources Statements 30 June 2020’ released to the Australian
Securities Exchange (ASX) on 24 August 2020 and available to view at
www.stbarbara.com.au and for which Competent Persons’ consents
were obtained. Each Competent Person’s consent remains in place for
subsequent releases by the Company of the same information in the
same form and context, until the consent is withdrawn or replaced by a
subsequent report and accompanying consent.
The Company confirms that it is not aware of any new information or
data that materially affects the information included in the original ASX
announcements released on 24 August 2020 and, in the case of
estimates of Mineral Resources or Ore Reserves, that all material
assumptions and technical parameters underpinning the estimates in
the original ASX announcements continue to apply and have not
materially changed. The Company confirms that the form and context in
which the Competent Person's findings are presented have not been
materially modified from the original ASX announcements.
Full details are contained in the ASX release dated 24 August 2020 ‘Ore
Reserves and Mineral Resources Statements 30 June 2020’ available
at stbarbara.com.au.